
Study Guides
AQA AS-Level Business: Operations management (7137)
Study guide to operations objectives, KPIs, efficiency, quality, supply chains, inventory, innovation, network analysis and scale for AQA AS Business (7137).
- Subject
- Business
- Level
- AS LEVEL
- Topic
- Managing people and operations
- Author
- Marlbridge Academic Team
- Updated
- Reviewed by
- Salman Ahmad (what this means)
Aligned to AQA AS Level Business (7137), For first teaching from September 2026. Official specification .
Syllabus page (what it covers and how it is assessed): AQA AS Level Business.
Syllabus points this page covers
7137
- 3.2.2 Operations management
Found an error? Report a correction.
Need help with this topic? Request a free trial class for AS Level Business (7137).
This guide covers 3.2.2 Operations management for AQA AS-Level Business (7137). It was checked on 5 November 2026 against AQA’s AS and A-level Business specification (7137/7138), Version 1.1, November 2025, including its annex of formulae; “the specification” below means that document. Formulas are the ones in the annex.
Related: revision notes, practice questions, course structure, AQA AS Business hub, checklist and free diagnostics.
What the specification asks of you
| Content area | You must be able to |
|---|---|
| Managing operations | Explain operations objectives and the influences on them; how operations adds value; choice of location; links with other functions; effect on competitiveness |
| Operations data and KPIs | Calculate employee productivity, unit costs and resource (capacity) utilisation; interpret KPIs and environmental measures |
| Efficiency | Judge ways of improving resource utilisation and efficiency, including lean production |
| Quality | Explain the costs of poor quality and judge methods of improving quality |
| Environmental impact | Explain why and how operations can be made more sustainable, and the challenges |
| Matching output to demand | Judge ways of matching supply to high, low and fluctuating demand |
| Supply chain and inventory | Compare making with buying in; manage suppliers; judge just in time against just in case; calculate inventory turnover |
| Innovation, projects, scale, technology | Ways to innovate and protect innovation; network analysis (float and critical path); economies and diseconomies of scale; technology (including AI) in operations |
Ethics in operations (supplier codes of conduct and audits, sourcing, product safety) is A-level only (7138), so it is not covered here.
1. Managing operations
Operations is the function that converts inputs (labour, materials, equipment) into the goods or services customers buy. An operations objective is a target for that function that supports the wider business objectives. The specification names five:
- Efficiency. Getting the most output from the resources used, so unit costs are low.
- Quality. Meeting the standard customers expect, with few errors or complaints.
- Volume of goods and services. Producing enough to meet demand.
- Flexibility. Coping with changes in volume, product mix or specification.
- Environmental impact. For example less waste, less energy used or fewer emissions.
Objectives can conflict (more volume may cost quality), so say which should come first and why.
Influences on operations objectives. Internal: finance available, staff skills, existing equipment and the business’s other objectives. External: competitors, customer expectations, technology, suppliers, legislation and environmental pressure. A firm in a price-sensitive market will stress efficiency; a premium brand will stress quality.
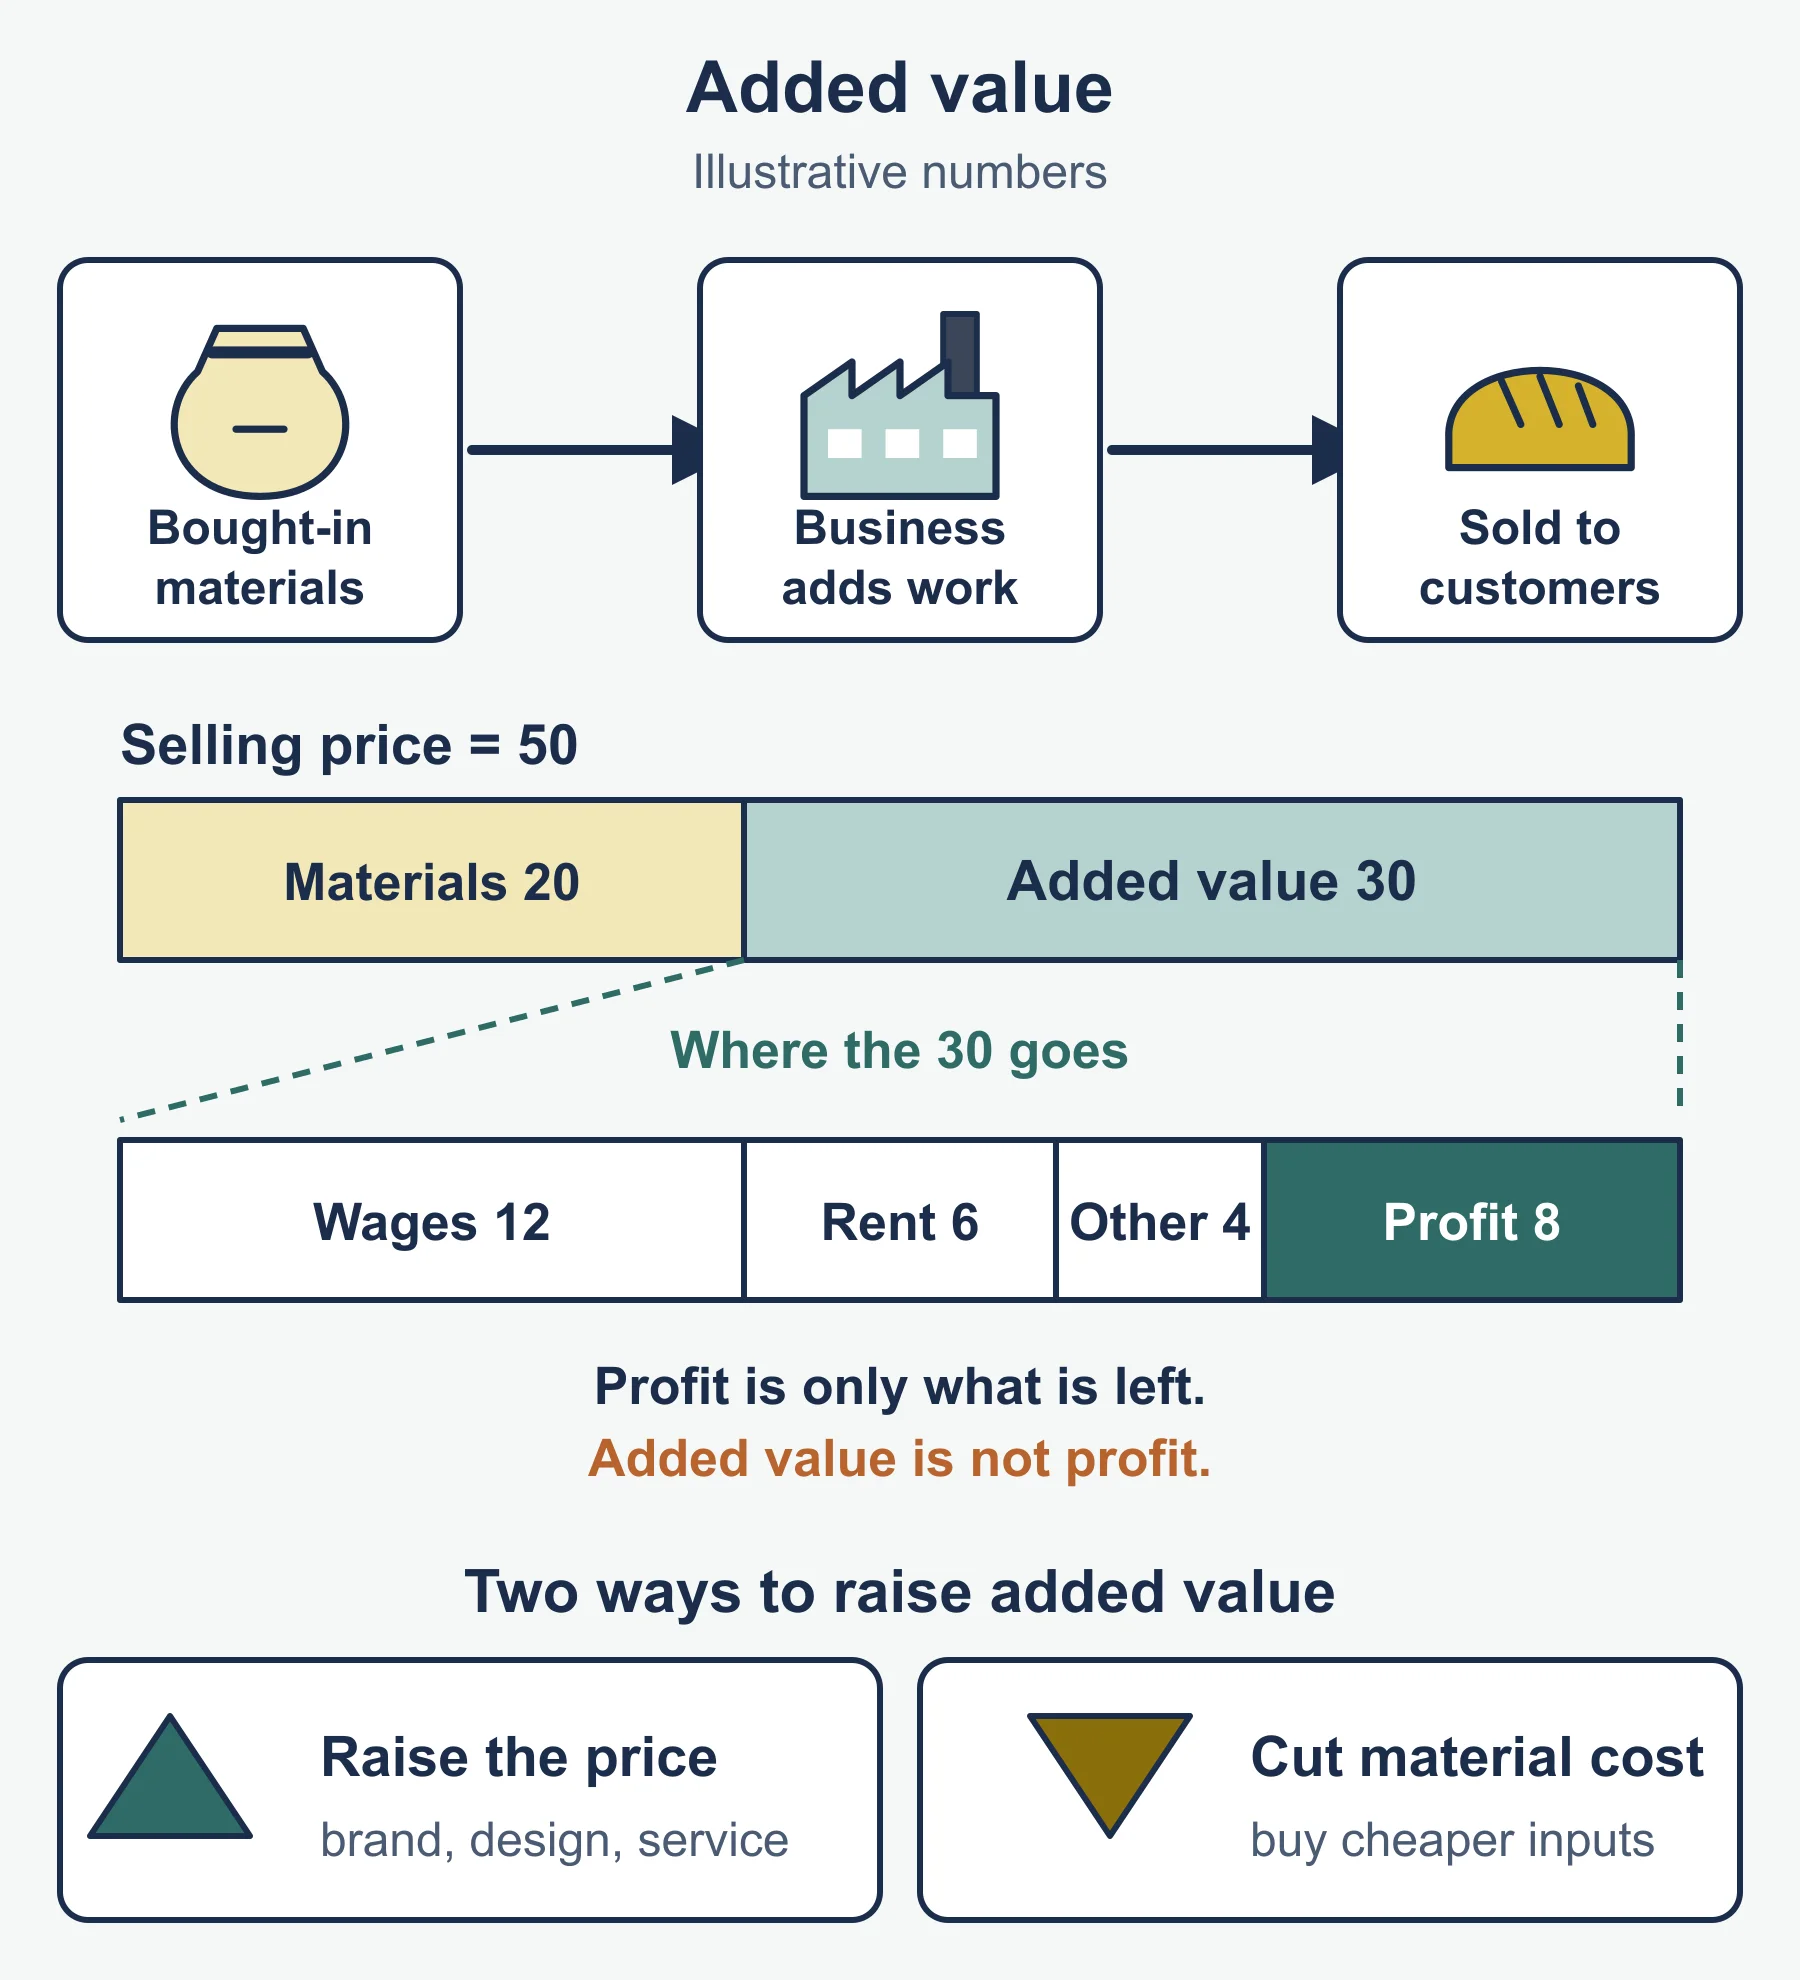
Adding value. Added value is the difference between the selling price and the cost of bought-in materials and services. Operations adds value by making a product customers will pay more for (better quality, design or speed) or by producing it with less waste. A cake sold for £12 using £4.80 of ingredients adds £7.20, which is 60% of the price.
Choosing a location. The specification lists costs, demand, access to resources and markets, infrastructure, government incentives, ethical and people considerations, break-even, return on investment and environmental factors. A good answer weighs quantitative factors (costs, break-even, ROI) against qualitative ones (access to skilled staff, ethics).
Links and competitiveness. Operations decisions depend on finance (capital), marketing (forecast demand) and people (skills and staffing). Lower unit costs, better quality and greater flexibility all make a business more competitive.
2. Operations data: objectives and KPIs
The specification asks you to calculate three measures (formulas from its annex):
| Measure | Formula |
|---|---|
| Employee productivity | Output over a time period ÷ number of employees |
| Unit costs (average costs) | Total costs ÷ number of units of output |
| Capacity utilisation (%) | Actual output ÷ maximum possible output × 100 |
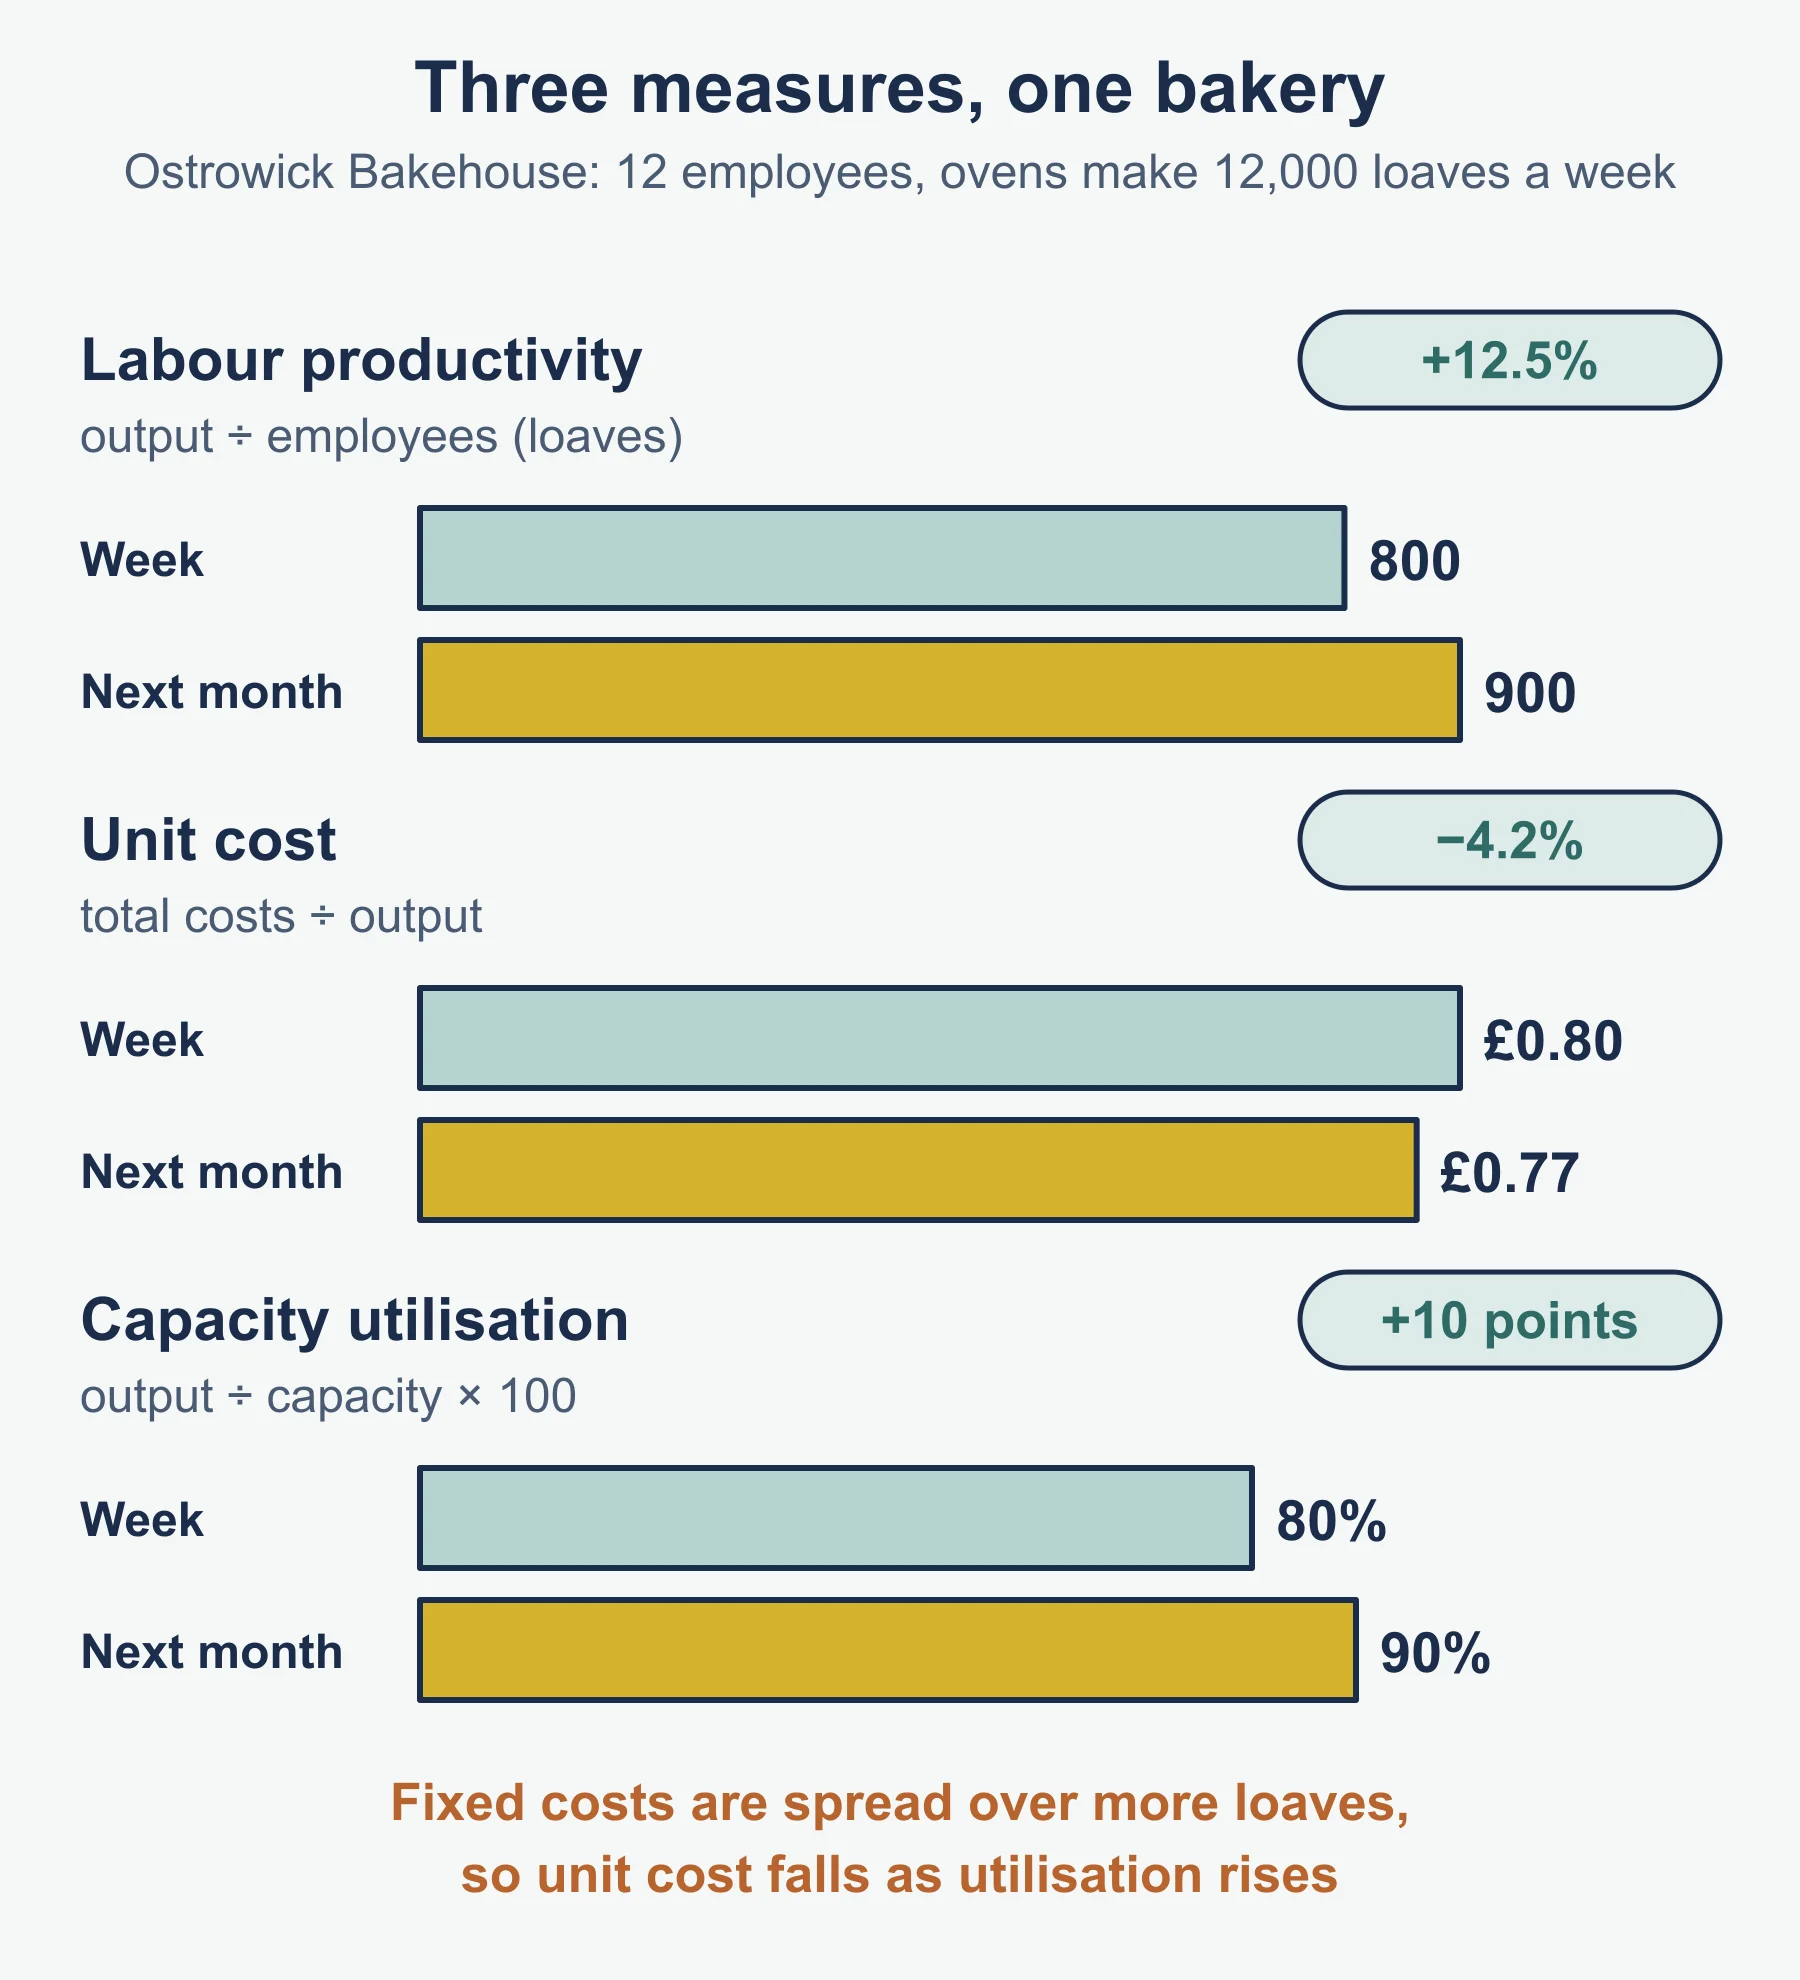
Worked example 1. Ostrowick Bakehouse produced 9,600 loaves in a week with 12 employees. Total costs were £7,680 (fixed costs £2,880 plus variable costs of £0.50 per loaf). The ovens can produce 12,000 loaves a week.
- Employee productivity = 9,600 ÷ 12 = 800 loaves per employee.
- Unit cost = £7,680 ÷ 9,600 = £0.80 per loaf.
- Capacity utilisation = 9,600 ÷ 12,000 × 100 = 80%.
Next month output rises to 10,800 loaves with the same 12 employees. Total costs become £2,880 + (10,800 × £0.50) = £8,280.
- Productivity = 10,800 ÷ 12 = 900, a rise of 100 ÷ 800 = 12.5%.
- Unit cost = £8,280 ÷ 10,800 = £0.767, about £0.77, a fall of about 4.2%.
- Utilisation = 10,800 ÷ 12,000 = 90%.
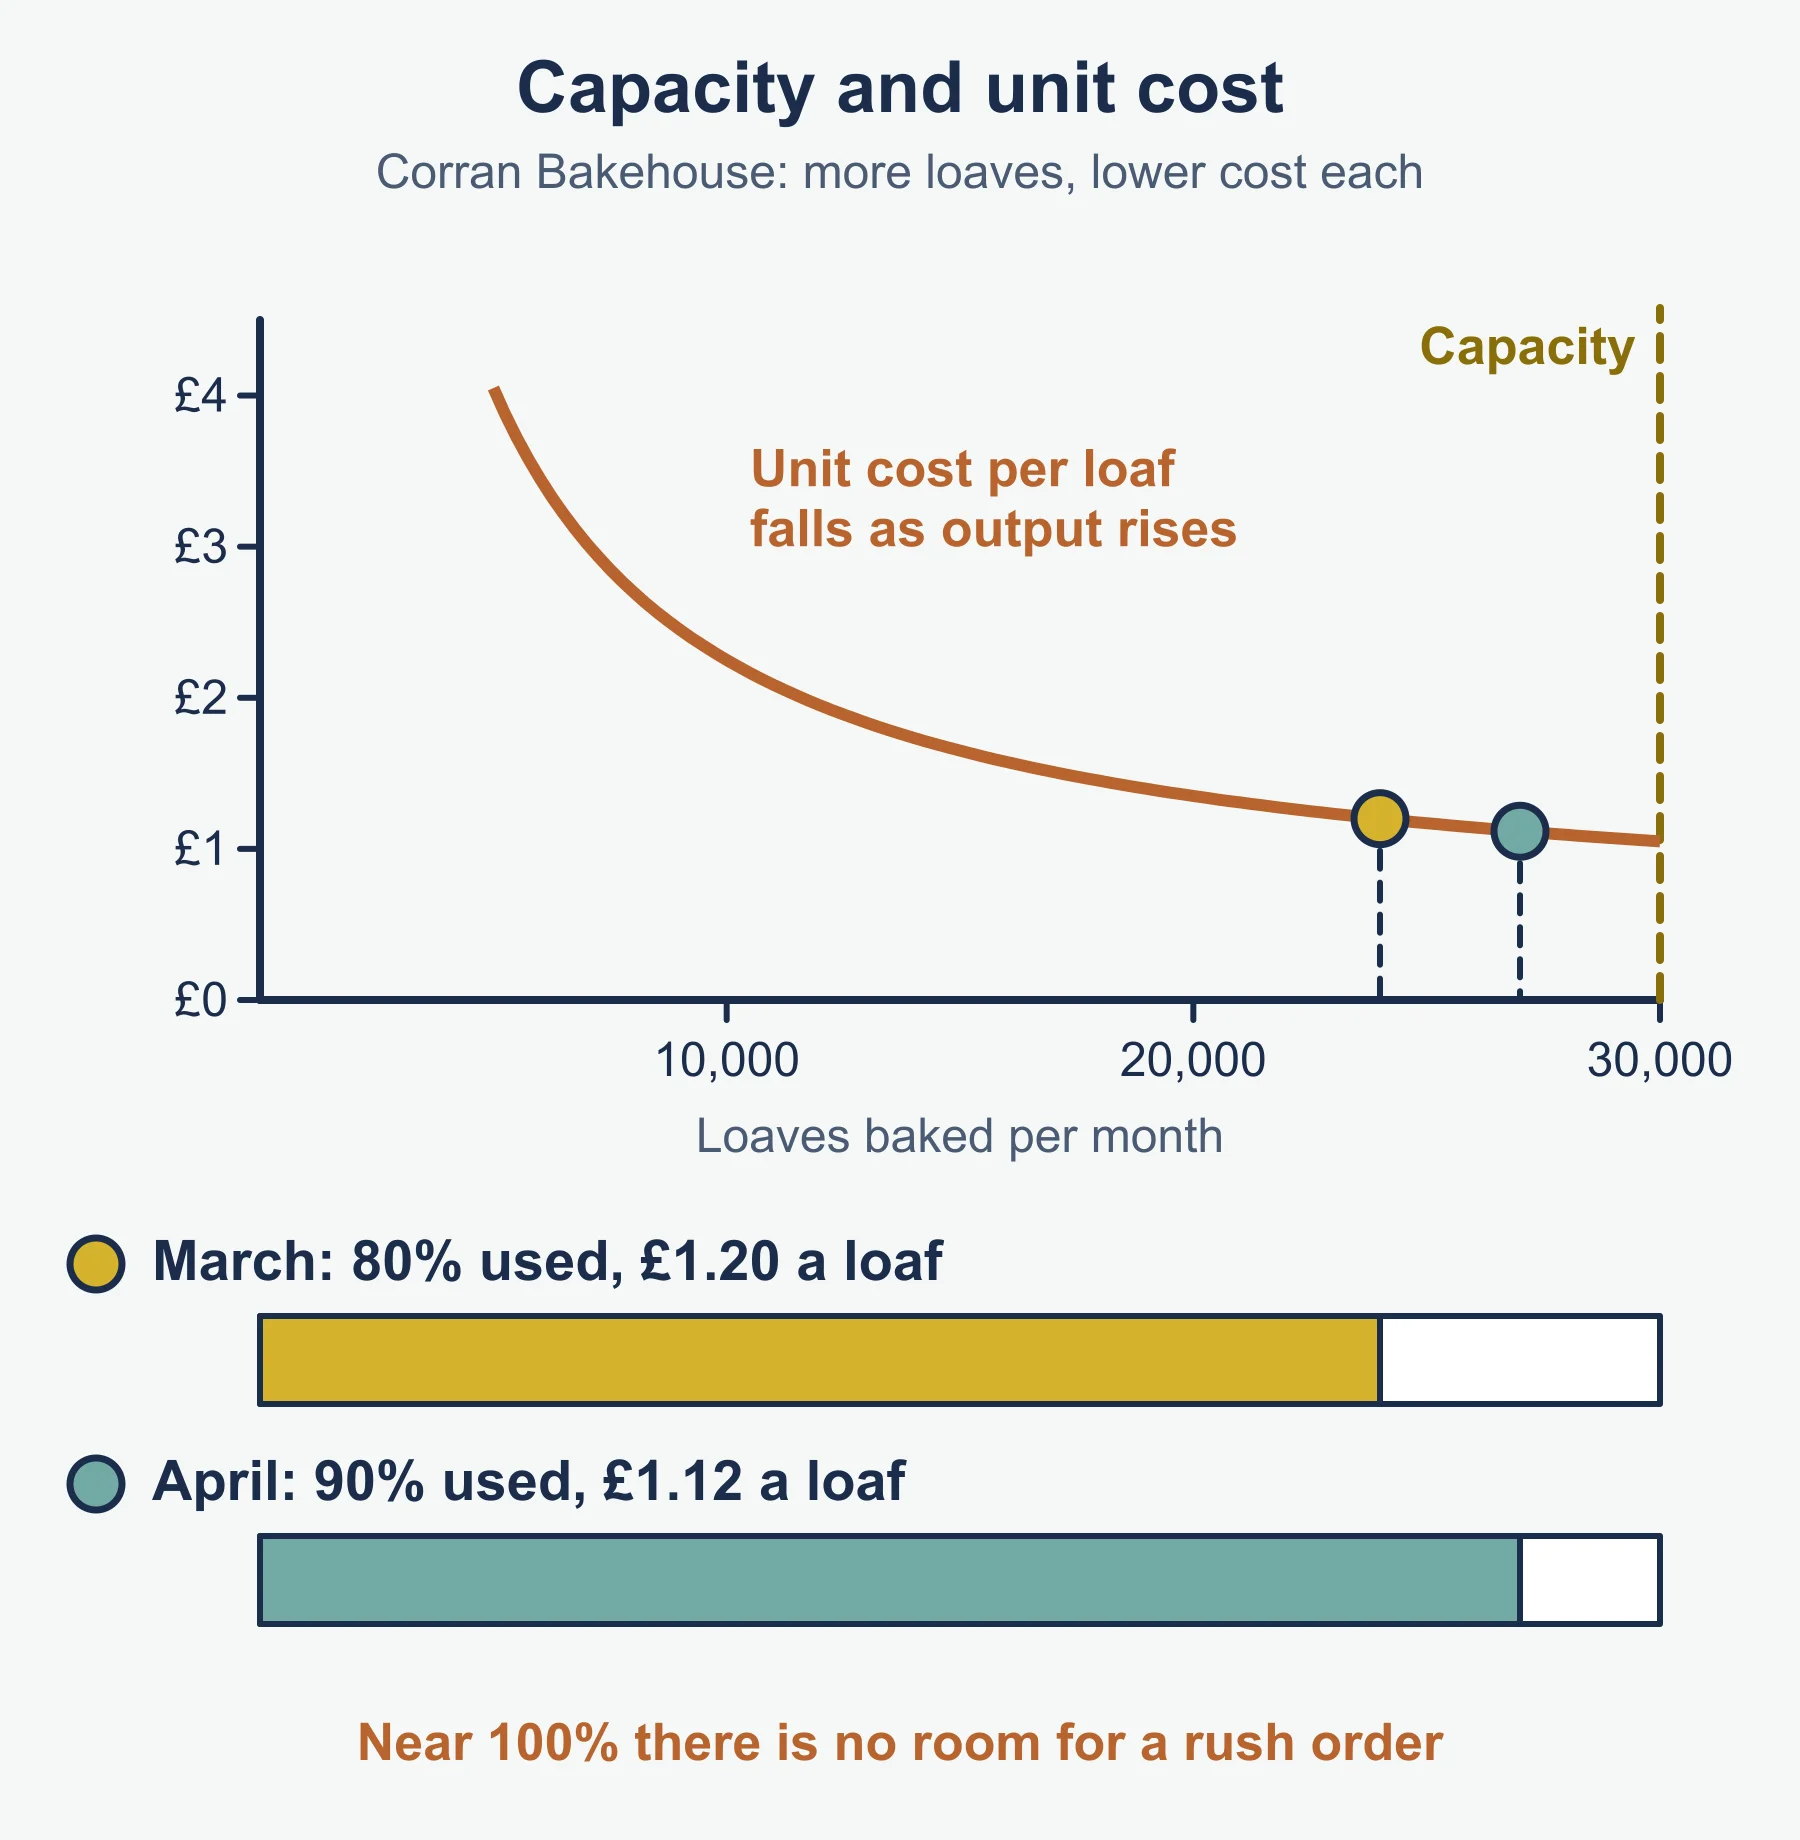
Unit cost fell because fixed costs were spread over more loaves: the link between utilisation and cost.
Other KPIs to interpret (no calculation is required): wait times, returns, defects, complaints, speed of response, delivery times, and customer service or satisfaction ratings, plus measures of environmental impact and sustainability such as waste, energy use or emissions per unit. Compare each with past results, targets and rivals, using index numbers and percentage changes. Data has limits: it may be out of date, hide causes, or need a benchmark.
3. Efficiency
Resource utilisation and efficiency matter because idle resources and waste raise unit costs. The specification’s ways of improving them:
- Improved capacity utilisation: win more orders, share or rent out spare capacity, or cut surplus capacity. Very high utilisation leaves no slack for rush orders.
- Lean production: reducing inventory, reducing re-works, reducing waiting times, reducing transportation times, kaizen (continuous small improvements suggested by staff) and standardised processes.
- Reducing waste, recycling and reusing materials.
- Effective scheduling of staff and machines so work flows without gaps.
- Improving employee productivity and performance, for example through training, motivation or better equipment.
- Improving cost control.
Advantages and disadvantages. These methods lower unit costs and can raise quality, but they often cost money before any gain appears (training, equipment), staff may resist change or fear job losses, gains are small if the business is already efficient, and pushing staff harder can harm quality.
4. Quality
Quality means meeting customer expectations: the product does what is promised, is reliable and comes with good service. It supports repeat purchases, reputation and higher prices.
Costs of poor quality: returns, repairs and re-works, wasted materials, lost sales, damaged reputation, compensation and low staff morale.
| Method | What it means | Watch for |
|---|---|---|
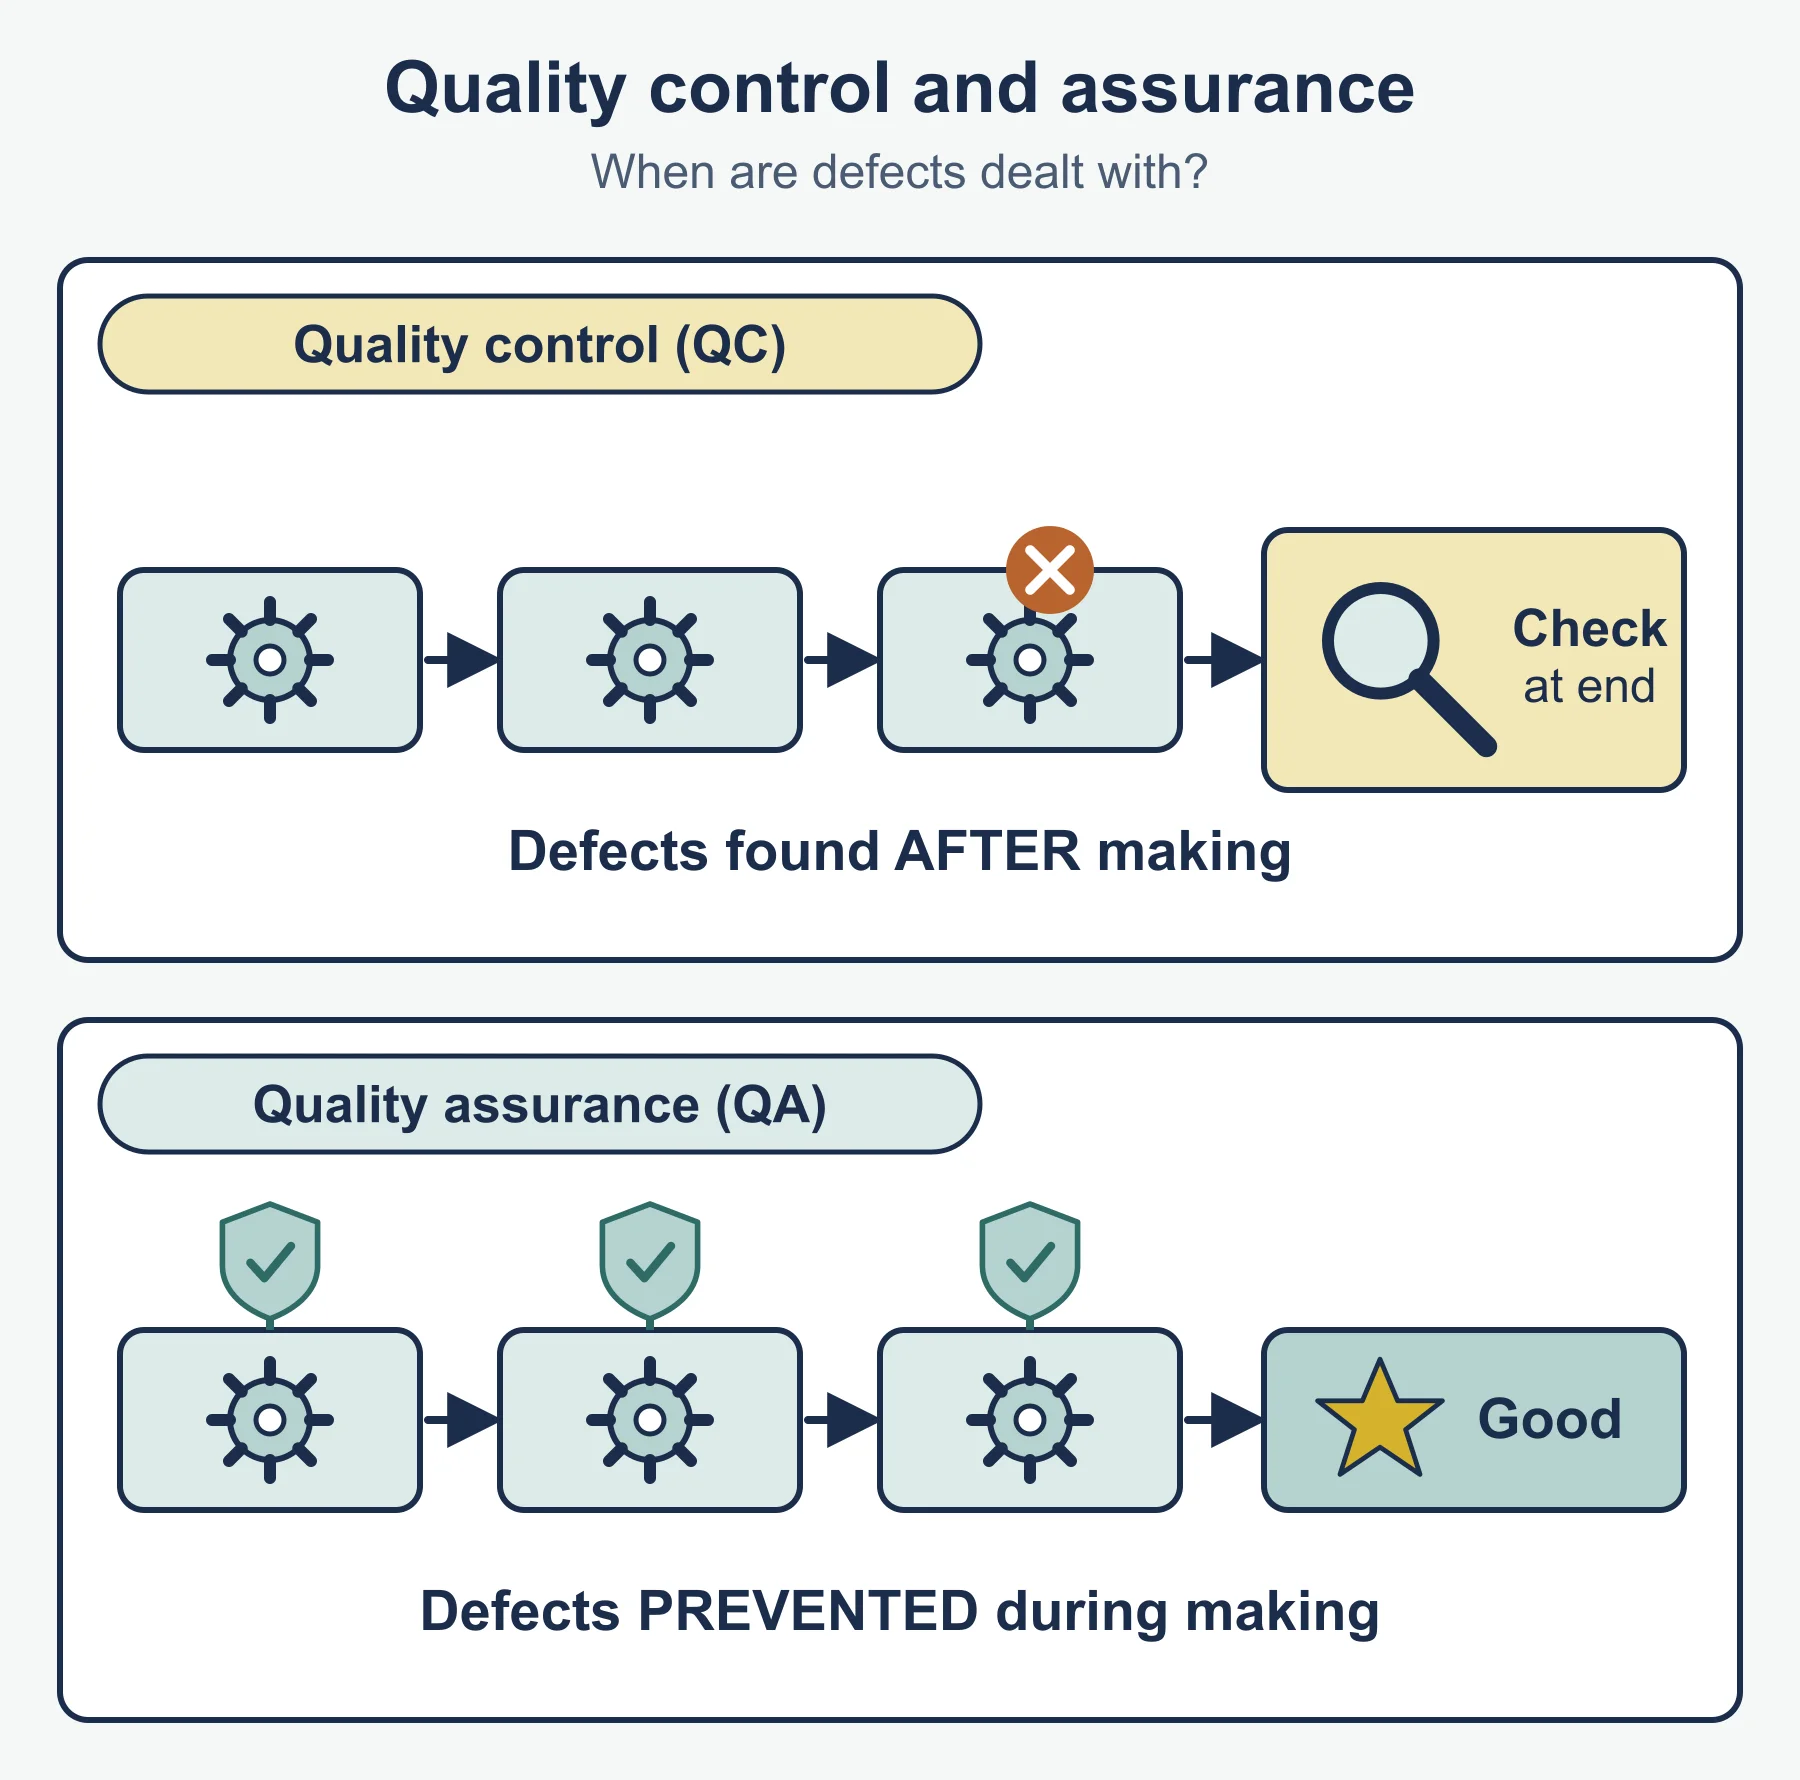
| Quality control | Inspecting output, usually at the end, to find faults | Faults are found after the cost has been incurred |
| Quality assurance | Building quality into every stage, from supplier checks to training, to prevent faults | Set-up and checking costs; needs commitment at every stage |
| Total Quality Management (TQM) | Every employee is responsible for quality, all the time | Needs a culture change and training; slow to take hold |
| Quality circles | Small groups of staff meet regularly to solve quality problems | Takes time from production; ideas must be acted on |
| Benchmarking | Comparing processes with the best businesses and adopting their methods | Rivals may not share data; copying may not fit the business |
Worked example 2. Thornhaugh Print completes 25,000 orders a year and reprints 4% because of errors, at £18 a reprint. Poor quality costs 25,000 × 0.04 × £18 = £18,000 a year before any lost customers are counted, so a £10,000 training programme that halved errors would pay for itself within about a year (£9,000 saved).
5. Environmental impact of operations
Purpose and value: lower energy and material costs, meeting regulations, a better reputation with customers and investors, and access to buyers who demand sustainable suppliers.
Ways to reduce environmental impact: waste reduction, resource efficiency, reducing emissions, cutting the carbon footprint, sustainable sourcing and circularity (designing products and processes so materials are reused or recycled rather than thrown away).
Challenges: the costs of new equipment or materials, supply chain limitations (sustainable inputs may be scarce or dearer) and the operational disruption needed to change processes.
6. Matching output to demand
Demand can be high, low, or fluctuating (cyclical with the economy, or seasonal). Mismatches lose sales when demand is high and leave idle resources or unsold stock when it is low. The specification’s ways of managing supply:
- Changing production scheduling: extra shifts in peaks, fewer in troughs.
- Increasing or decreasing inventory: build stock in quiet months to sell in busy ones (costs storage and cash).
- Different forms of employment: part-time, temporary, zero-hours and freelance staff let labour follow demand, but training is needed and commitment may be lower.
- Outsourcing: another firm does some of the work at peak times, at the cost of control.
- Investment in capital and technology: faster or more flexible equipment raises the ability to respond.
- Increasing or decreasing capacity: a long-term change, worth it only if the change in demand will last.
Failing to match supply to demand risks lost sales and customers, or high unit costs from idle capacity and waste.
7. Supply chain management and inventory
Producing internally or buying in. Making a part yourself gives control of quality and timing and keeps the profit margin; buying in can be cheaper, gives access to specialist skill and needs no capital, but brings dependence on the supplier.
Managing the supply chain means managing relationships with suppliers and the logistics from suppliers and to customers. Its value: lower costs, fewer delays, faster response. Influences on sourcing include the number and choice of suppliers (one supplier gives bulk discounts and close relations; several spread the risk). Supply chain issues such as delays, shortages or price rises can halt production. How profits are shared along the chain depends on the bargaining power of each business. Supply chain transparency and third-party accreditations (for example a recognised sustainability or labour standard) reassure customers and reduce the risk of reputational damage.
Inventory. Businesses hold inventory to meet demand without delay, to cope with late deliveries, and to gain bulk discounts. The amount held depends on storage cost, cash tied up, supplier reliability, how predictable demand is and how quickly goods go out of date.
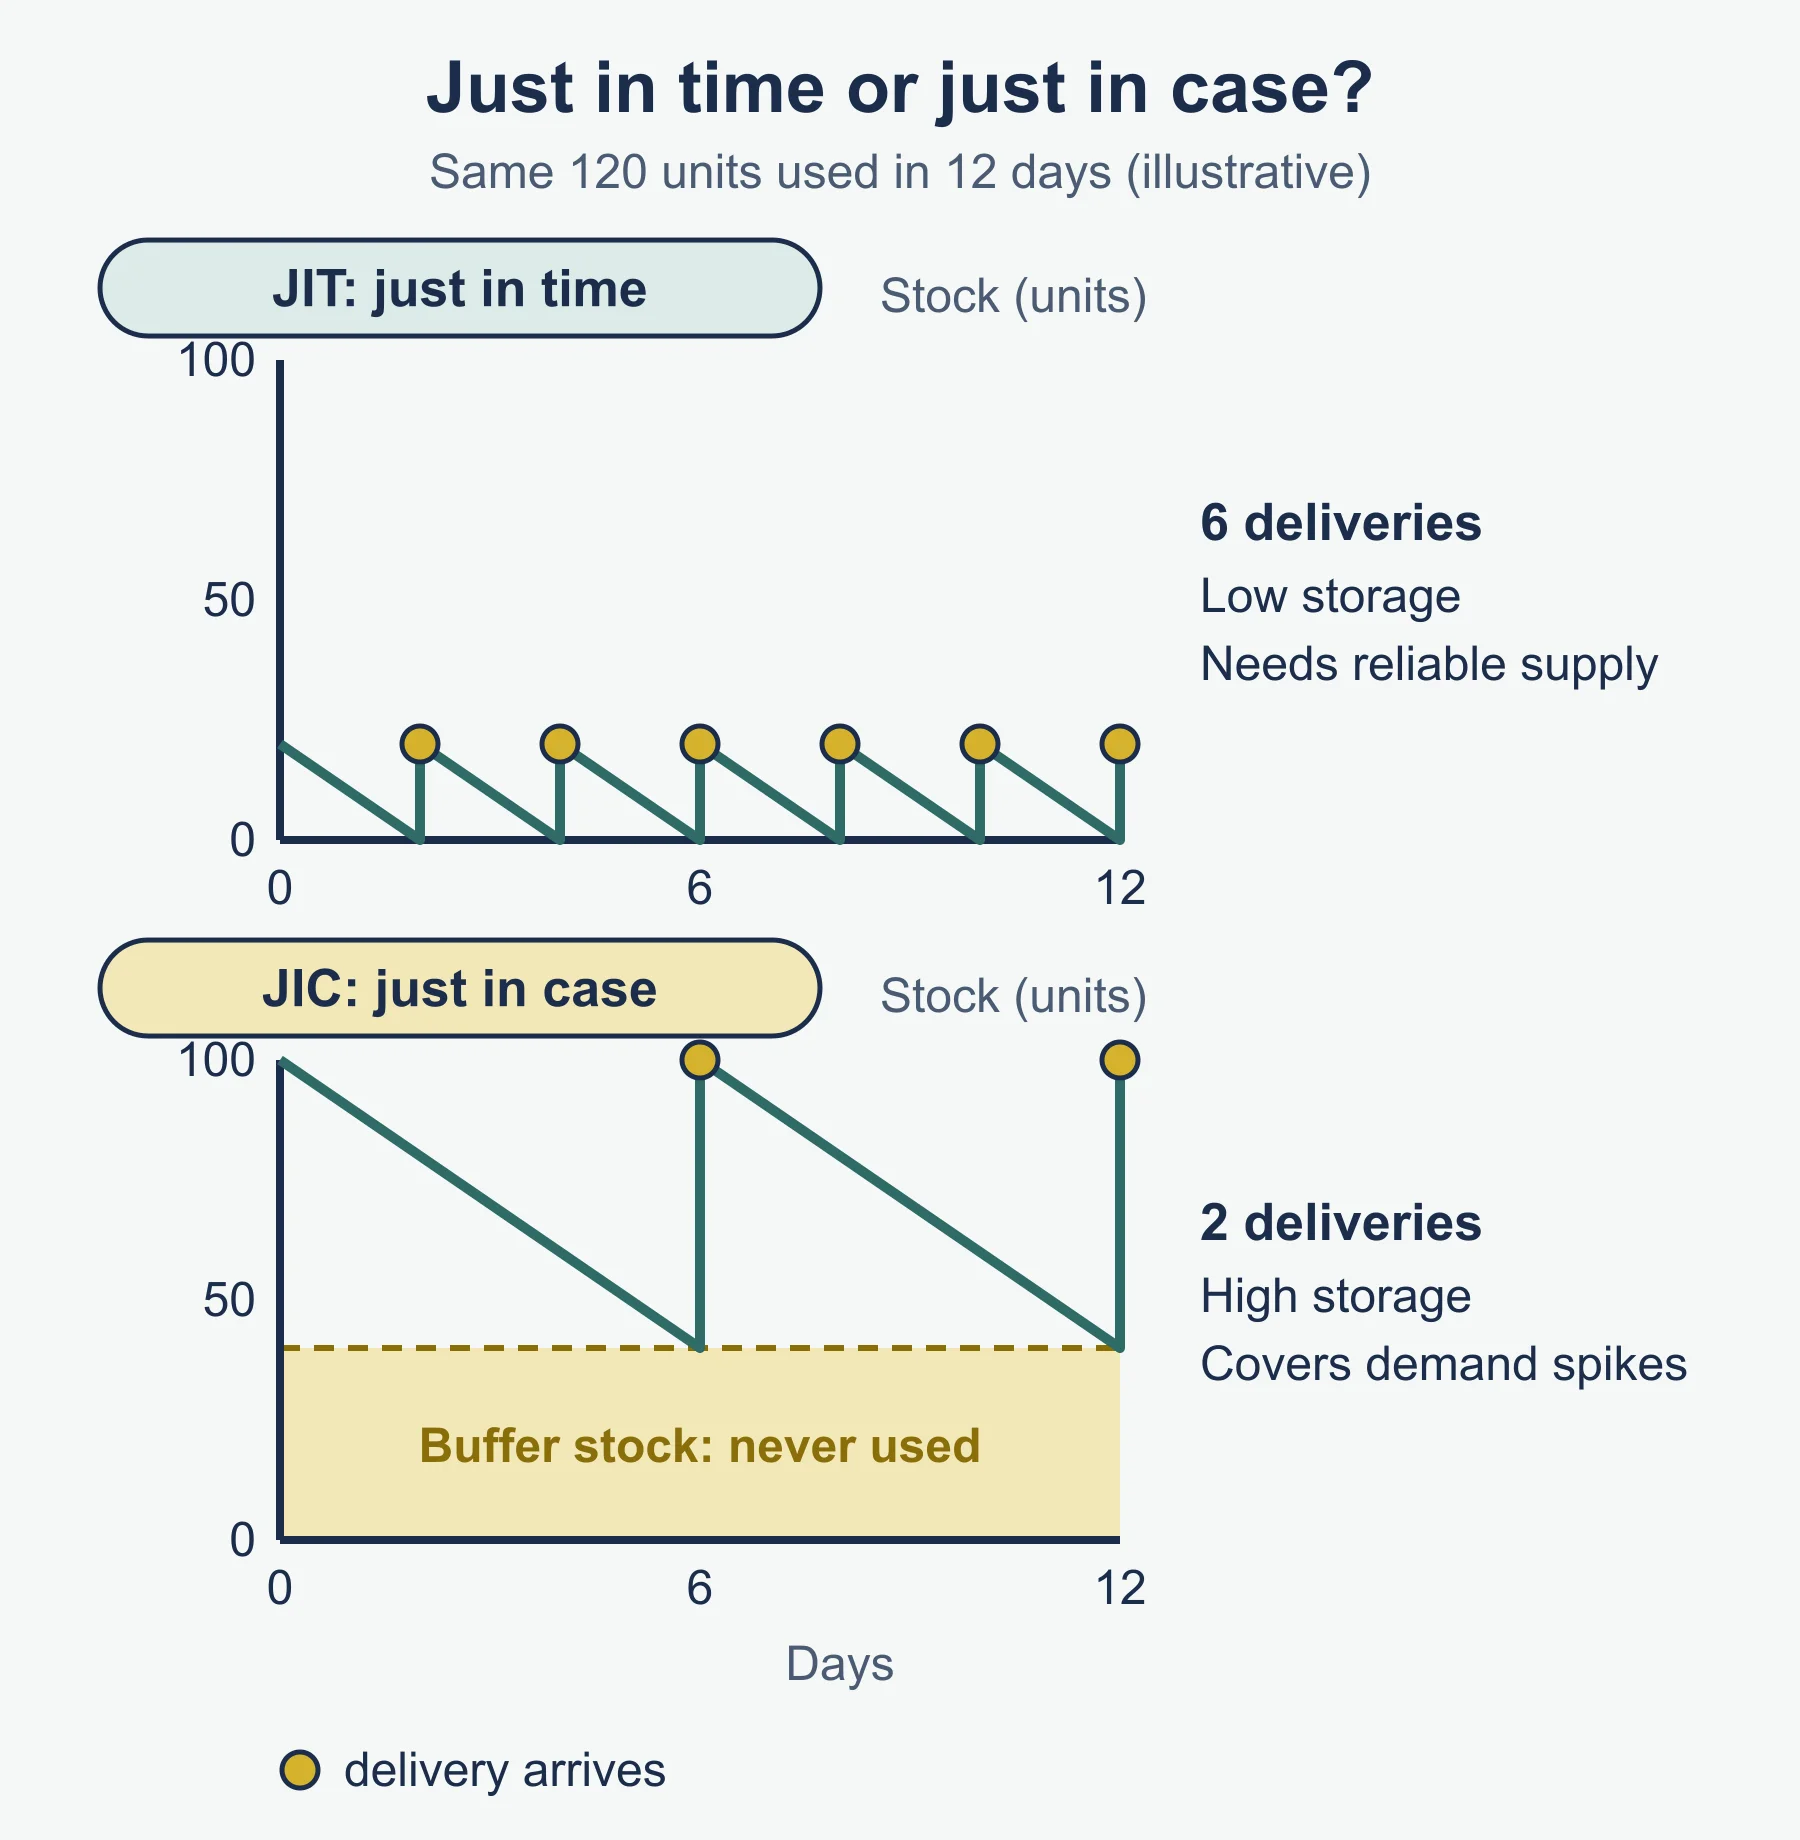
- Just in time (JIT): materials arrive only as needed. Lower holding costs and less cash tied up, but any delivery delay stops production and there is no stock for a sudden rise in demand.
- Just in case (JIC): buffer stock is held. Covers delays and demand spikes, but storage costs and cash tied up are higher and stock may become obsolete.
Inventory turnover = cost of sales ÷ average inventories held.
Worked example 3. Mereton Foods has cost of sales of £480,000 a year. It held inventory of £36,000 at the start of the year and £44,000 at the end, so average inventory is £40,000. Inventory turnover = 480,000 ÷ 40,000 = 12 times a year, so stock is replaced about once a month. A switch towards JIT that halved average inventory would double turnover to 24 times.
8. Innovation
Purpose, value and challenges. New products and processes can create a competitive advantage, open markets and cut costs, but innovation is expensive, slow and risky, since many ideas fail.
Ways of developing innovation: research and development, talent acquisition and retention, cross-functional teams (staff from different functions working together) and intrapreneurship (encouraging employees to act like entrepreneurs inside the business).
Protecting innovation: patents protect an invention and copyrights protect original creative work, so rivals cannot simply copy it.
9. Project management and network analysis
Project management plans and controls a one-off task so it finishes on time and within budget. Network analysis shows the order of activities and which can run at the same time. You must be able to interpret and amend a network diagram and calculate float times and the critical path.
- Earliest start time (EST): the earliest an activity can begin.
- Latest finish time (LFT): the latest an activity can finish without delaying the project.
- Float time = latest finish time − duration − earliest start time.
- The critical path is the chain of activities with zero float: delay any of them and the whole project is late.
Worked example 4. A shop refit has four activities: A (strip out, 3 days) starts first; B (rewire, 4 days) and C (order fittings, 2 days) both follow A; D (install fittings, 5 days) follows both B and C.
| Activity | Duration | EST | LFT | Float |
|---|---|---|---|---|
| A | 3 | 0 | 3 | 3 − 3 − 0 = 0 |
| B | 4 | 3 | 7 | 7 − 4 − 3 = 0 |
| C | 2 | 3 | 7 | 7 − 2 − 3 = 2 |
| D | 5 | 7 | 12 | 12 − 5 − 7 = 0 |
The critical path is A–B–D, taking 12 days. Activity C can be up to 2 days late without delaying the refit.
Value: network analysis identifies the activities to watch, helps plan resources and shows the shortest possible time. Its limits: durations are estimates, and a diagram does not manage people.
10. Scale of operations and technology
Economies of scale lower unit costs as output grows: technical (bigger, more efficient equipment), purchasing (bulk-buying discounts) and financial (larger firms borrow more cheaply). Diseconomies of scale raise unit costs when a business grows too large: problems of control, communication and coordination.
Technology, including AI, in operations improves competitiveness through inventory management (automatic tracking and re-ordering), supply chain management (tracking deliveries, forecasting demand) and automation (robots and automated lines). Costs and risks: investment, training, system failure and job losses.
Common errors
- Using total costs as unit cost, or forgetting to divide by output.
- Writing capacity utilisation as a decimal or as capacity ÷ output.
- Confusing productivity (output per employee) with production (total output).
- Using closing inventory instead of average inventory in inventory turnover.
- Forgetting to subtract the earliest start time when calculating float.
- Saying JIT removes risk, when it moves the risk to the supply chain.
- Listing benefits and difficulties with no judgement.
Next, try the practice questions.
Frequently asked questions
Is ethics in operations part of AQA AS-Level Business (7137)? No. Ethics in operations, such as supplier codes of conduct, audits and product safety, is A-level only in the AQA 7137/7138 specification.
What are the five operations objectives in AQA AS Business? Efficiency, quality, volume of goods and services, flexibility and environmental impact. They can conflict, so a good answer says which should come first and why.
Why does unit cost fall when capacity utilisation rises? Fixed costs are spread over more units of output, so the average cost of each unit falls even if variable cost per unit stays the same.
Does just in time production remove risk? No. It cuts holding costs and the cash tied up in stock, but it moves the risk to the supply chain, because any late delivery can stop production.
How do you find the critical path? Work out the earliest start and latest finish time of each activity, then calculate each float. The chain of activities with zero float is the critical path, and any delay on it delays the whole project.
Official syllabus
AQA AS and A-level Business (7137, 7138) specification, Version 1.1 (November 2025), for first teaching from September 2026: section 3.2.2 Operations management and Annex 7, Formulae and key data. Checked against this guide on 5 November 2026.
Get free revision emails (optional)
Occasional emails with practice questions, worked explanations and links to free resources for the qualification and subjects you choose. No spam, and you can unsubscribe from any email. The free tools on this site never need an email.
Related resources
-
Practice questions
AQA AS-Level Business: Operations management (7137) – Practice Questions
Original practice questions with worked answers on productivity, capacity, inventory, quality, projects and suppliers for AQA AS-Level Business (7137).
Business · AQA · AS Level
Try questions -
Revision notes
AQA AS-Level Business: Operations management (7137) – Revision Notes
Condensed revision notes on operations objectives, KPIs, efficiency, quality, supply chains, inventory, projects and scale for AQA AS-Level Business (7137).
Business · AQA · AS Level
Revise topic -
Study guides
AQA AS-Level Business: People management (7137)
Full study guide to AQA AS Business 7137 section 3.2.1 People management: HR planning, HR data, structures, leadership, motivation, rewards and relations.
Business · AQA · AS Level
Read guide
Related articles
-
teaching
A Level tuition in Dubai: Cambridge or Pearson Edexcel International A Level?
Schools in Dubai and Abu Dhabi teach either Cambridge International AS & A Level or Pearson Edexcel International A Level. How the two are structured, why it matters for tuition, and how online classes from Lahore work.
9 October 2026
-
curriculum guides
Choosing subjects at IGCSE and A Level
How subject choices at 14 and 16 affect university options later, and how to keep pathways open without overloading a timetable.
28 July 2026
Studying this with a teacher
Working through Business AS LEVEL?
This page is free and stays free. If you would rather be taught it, Marlbridge runs Business classes one-to-one and in small groups of up to 15, online in your own time zone. The first trial class is free. WhatsApp replies within an hour (8am–11pm Pakistan time, every day); email the same day.
AQA Business teachers at Marlbridge
