
Study Guides
A Level Business: Financial statements and Analysis of published accounts (Cambridge 9609)
Study guide to financial statements, depreciation, inventory valuation and ratio analysis for Cambridge A Level Business 9609, with worked examples.
- Subject
- Business
- Level
- A LEVEL
- Topic
- Finance and accounting
- Author
- Marlbridge Academic Team
- Updated
- Reviewed by
- Salman Ahmad (what this means)
Aligned to Cambridge A Level Business (9609), For examination in 2026, 2027 and 2028. Official specification .
Syllabus page (what it covers and how it is assessed): Cambridge A Level Business.
Syllabus points this page covers
9609 (A Level)
- 10.1 Financial statements
- 10.2 Analysis of published accounts
Found an error? Report a correction.
Need help with this topic? Request a free trial class for A Level Business (9609).
This guide covers sections 10.1 (Financial statements) and 10.2 (Analysis of published accounts) of the Cambridge International AS & A Level Business 9609 syllabus for examination in 2026, 2027 and 2028. Both are A Level content. The syllabus says you are not expected to draw up a set of accounts. You do need to calculate ratios and use them to inform business decisions. Course links: the Cambridge A Level Business hub, the checklist and the free diagnostics. Next, use the revision notes and the practice questions. Investment appraisal questions are in the finance and accounting practice set.
What this guide covers
| Section | What you must be able to do |
|---|---|
| 10.1.1 | Explain the meaning, purpose and contents of the statement of profit or loss; amend it; assess the impact of a given change |
| 10.1.2 | Explain the meaning, purpose and contents of the statement of financial position; amend it; link it to the statement of profit or loss |
| 10.1.3 | Explain the difficulties of valuing inventory; use the net realisable value method |
| 10.1.4 | Explain the role of depreciation; show its impact (straight-line only) on both statements |
| 10.2.1 to 10.2.5 | Explain, calculate and interpret liquidity, profitability, financial efficiency, gearing and investment ratios; suggest ways to improve each |
Every worked example uses one invented company, Corrabeck Joinery Ltd, which makes fitted kitchens. All figures are in $000 unless stated.
10.1.1 Statement of profit or loss
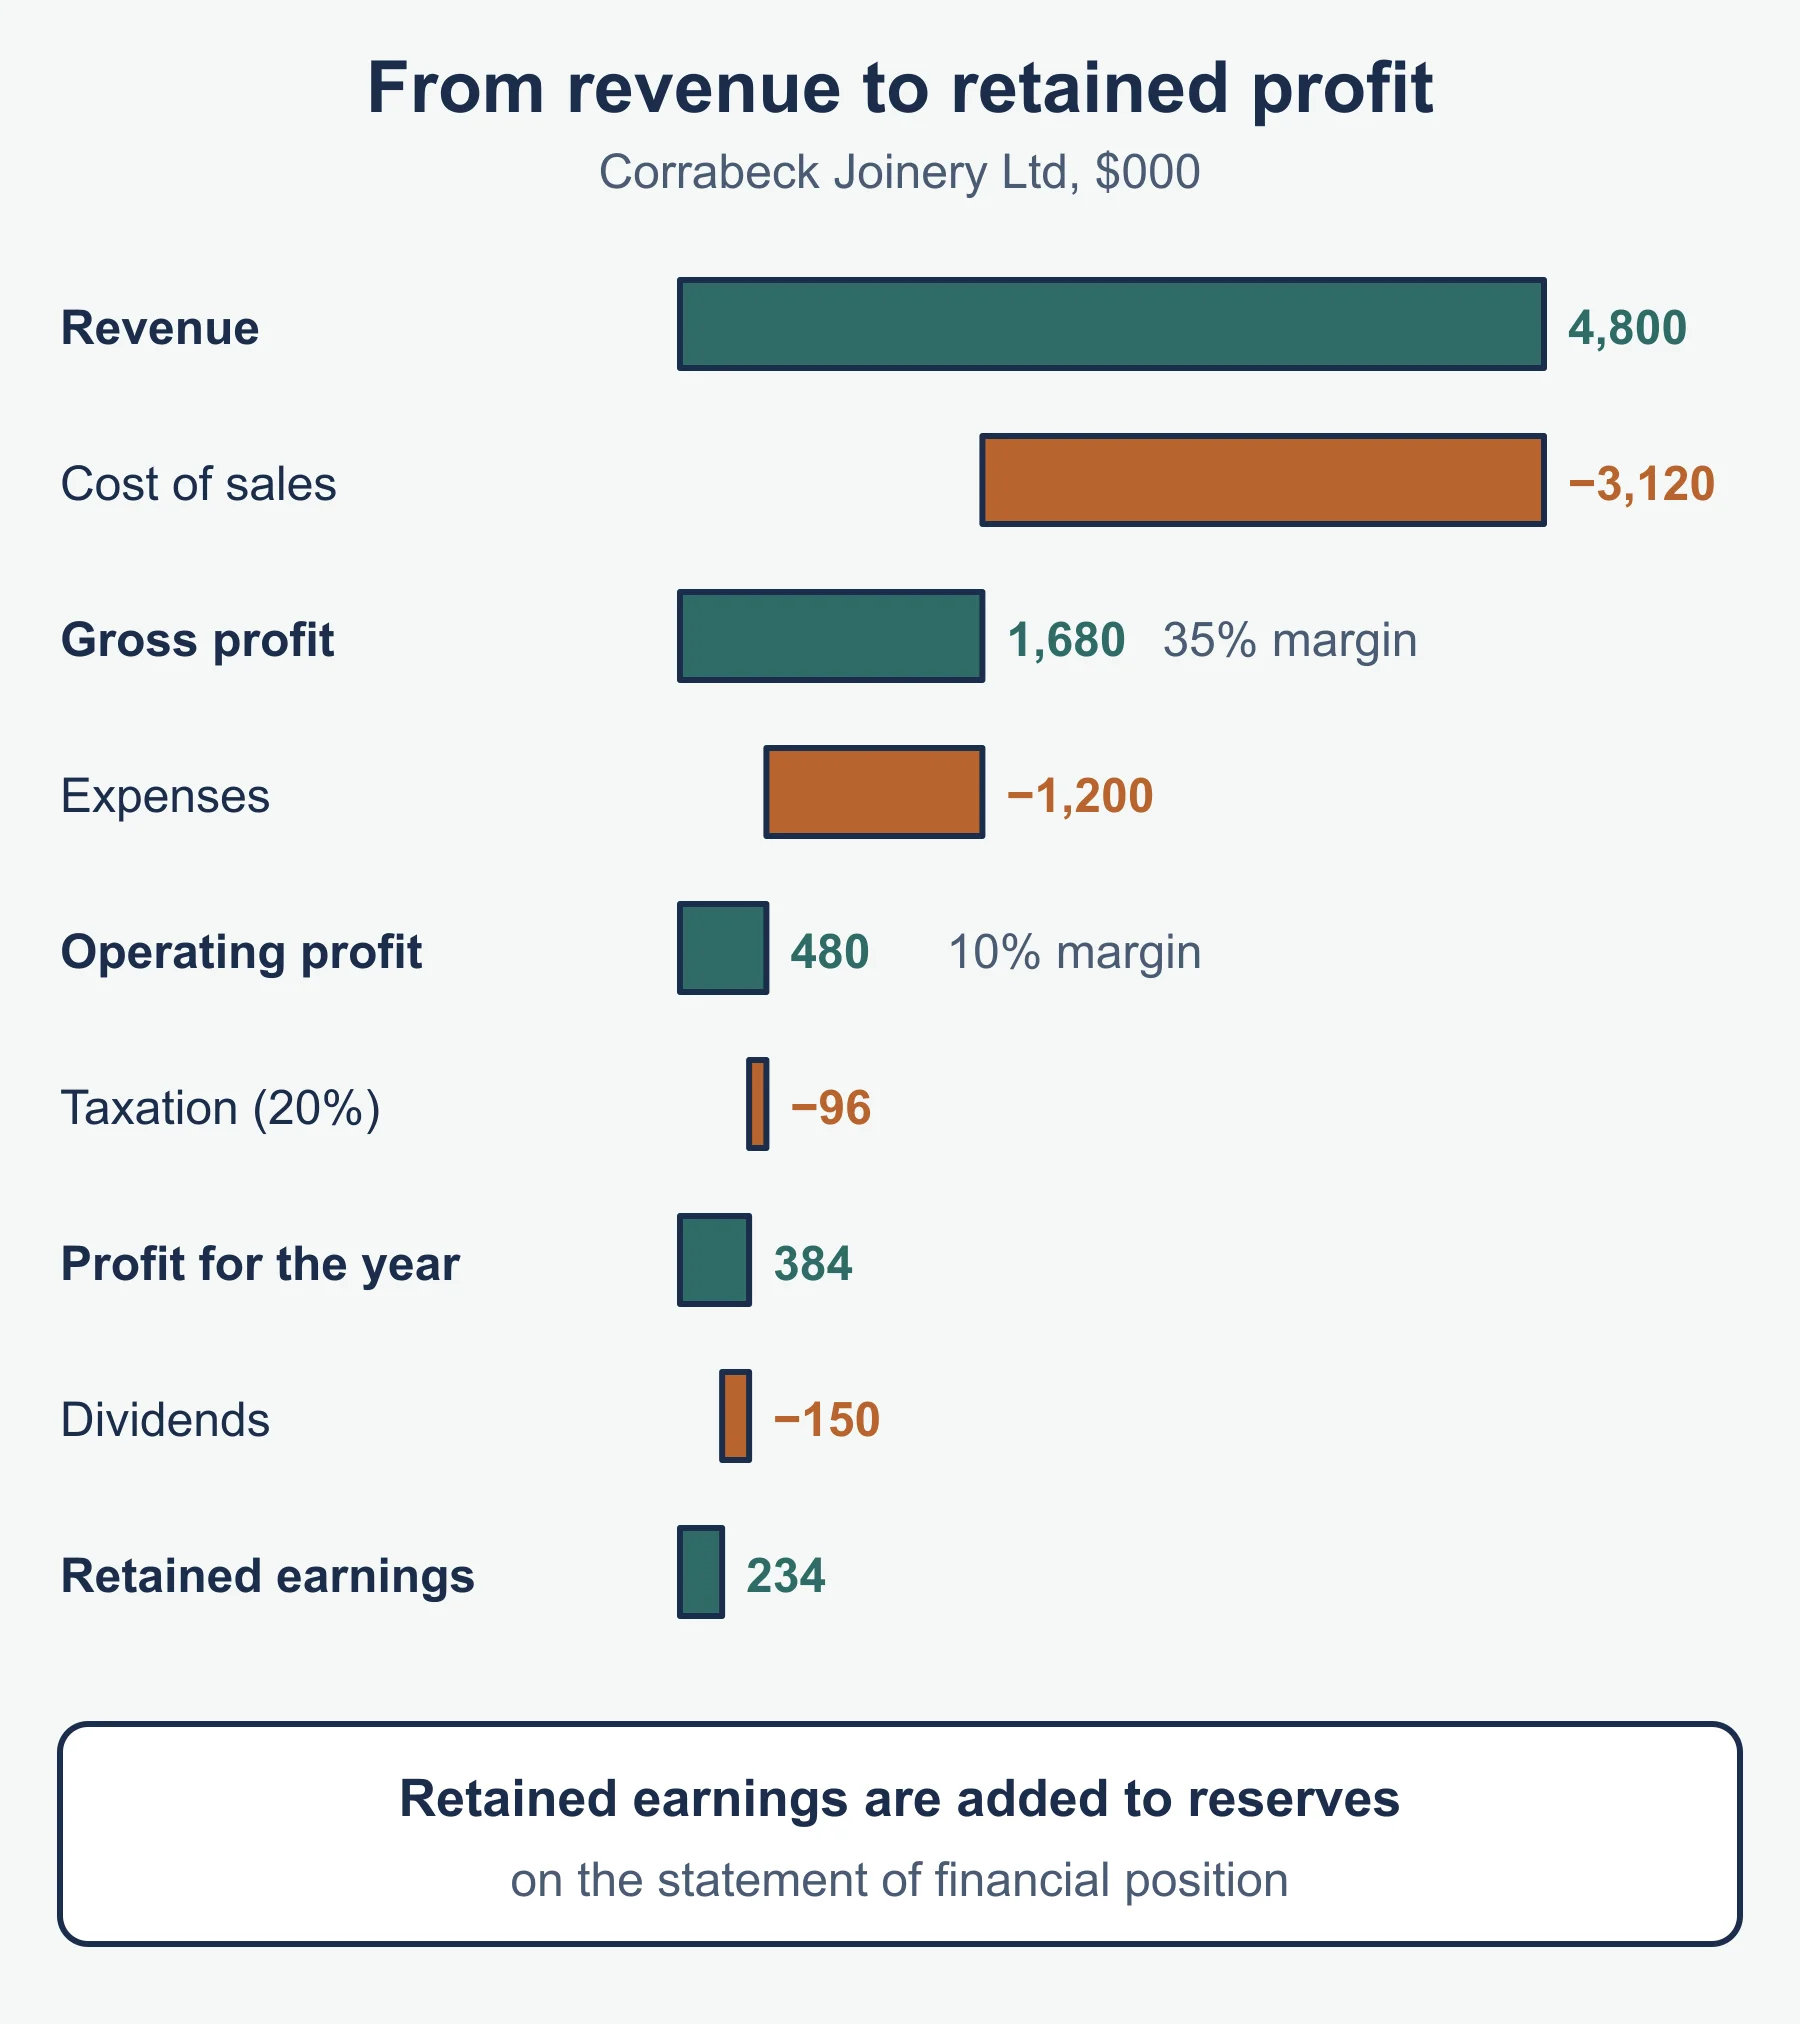
The statement of profit or loss shows how much profit a business made over a period, usually a year. Its purpose is to show owners, lenders and others how revenue was turned into profit and where the money went.
The contents, in order:
| Line | Corrabeck |
|---|---|
| Revenue | 4,800 |
| Cost of sales | 3,120 |
| Gross profit (revenue minus cost of sales) | 1,680 |
| Expenses | 1,200 |
| Profit from operations (operating profit) | 480 |
| Taxation (20%) | 96 |
| Profit for the year | 384 |
| Dividends | 150 |
| Retained earnings for the year | 234 |
Retained earnings are the profit kept in the business after dividends. They add to reserves on the statement of financial position.
Amending the statement. A question may change one line and ask for the new profit. Change the line, then recalculate every line below it. Suppose Corrabeck cuts all prices by 5% and sells the same volume. Revenue falls to 4,560 but cost of sales stays at 3,120, so gross profit is 1,440. Expenses stay at 1,200, so profit from operations is 240. Tax at 20% is 48, so profit for the year is 192. The gross profit margin falls from 35% to 31.6%. A small fall in price causes a large fall in profit because costs have not changed.
10.1.2 Statement of financial position
The statement of financial position shows what a business owns and owes on one date. Its purpose is to show its financial strength: assets, liabilities and the owners’ stake.
| Line | Corrabeck |
|---|---|
| Non-current assets | 2,000 |
| Inventory | 520 |
| Trade receivables | 400 |
| Cash | 80 |
| Current assets | 1,000 |
| Current liabilities (trade payables 300, tax and other 200) | 500 |
| Net current assets (current assets minus current liabilities) | 500 |
| Non-current liabilities (bank loan) | 700 |
| Net assets | 1,800 |
| Issued shares | 1,000 |
| Reserves | 800 |
| Equity | 1,800 |
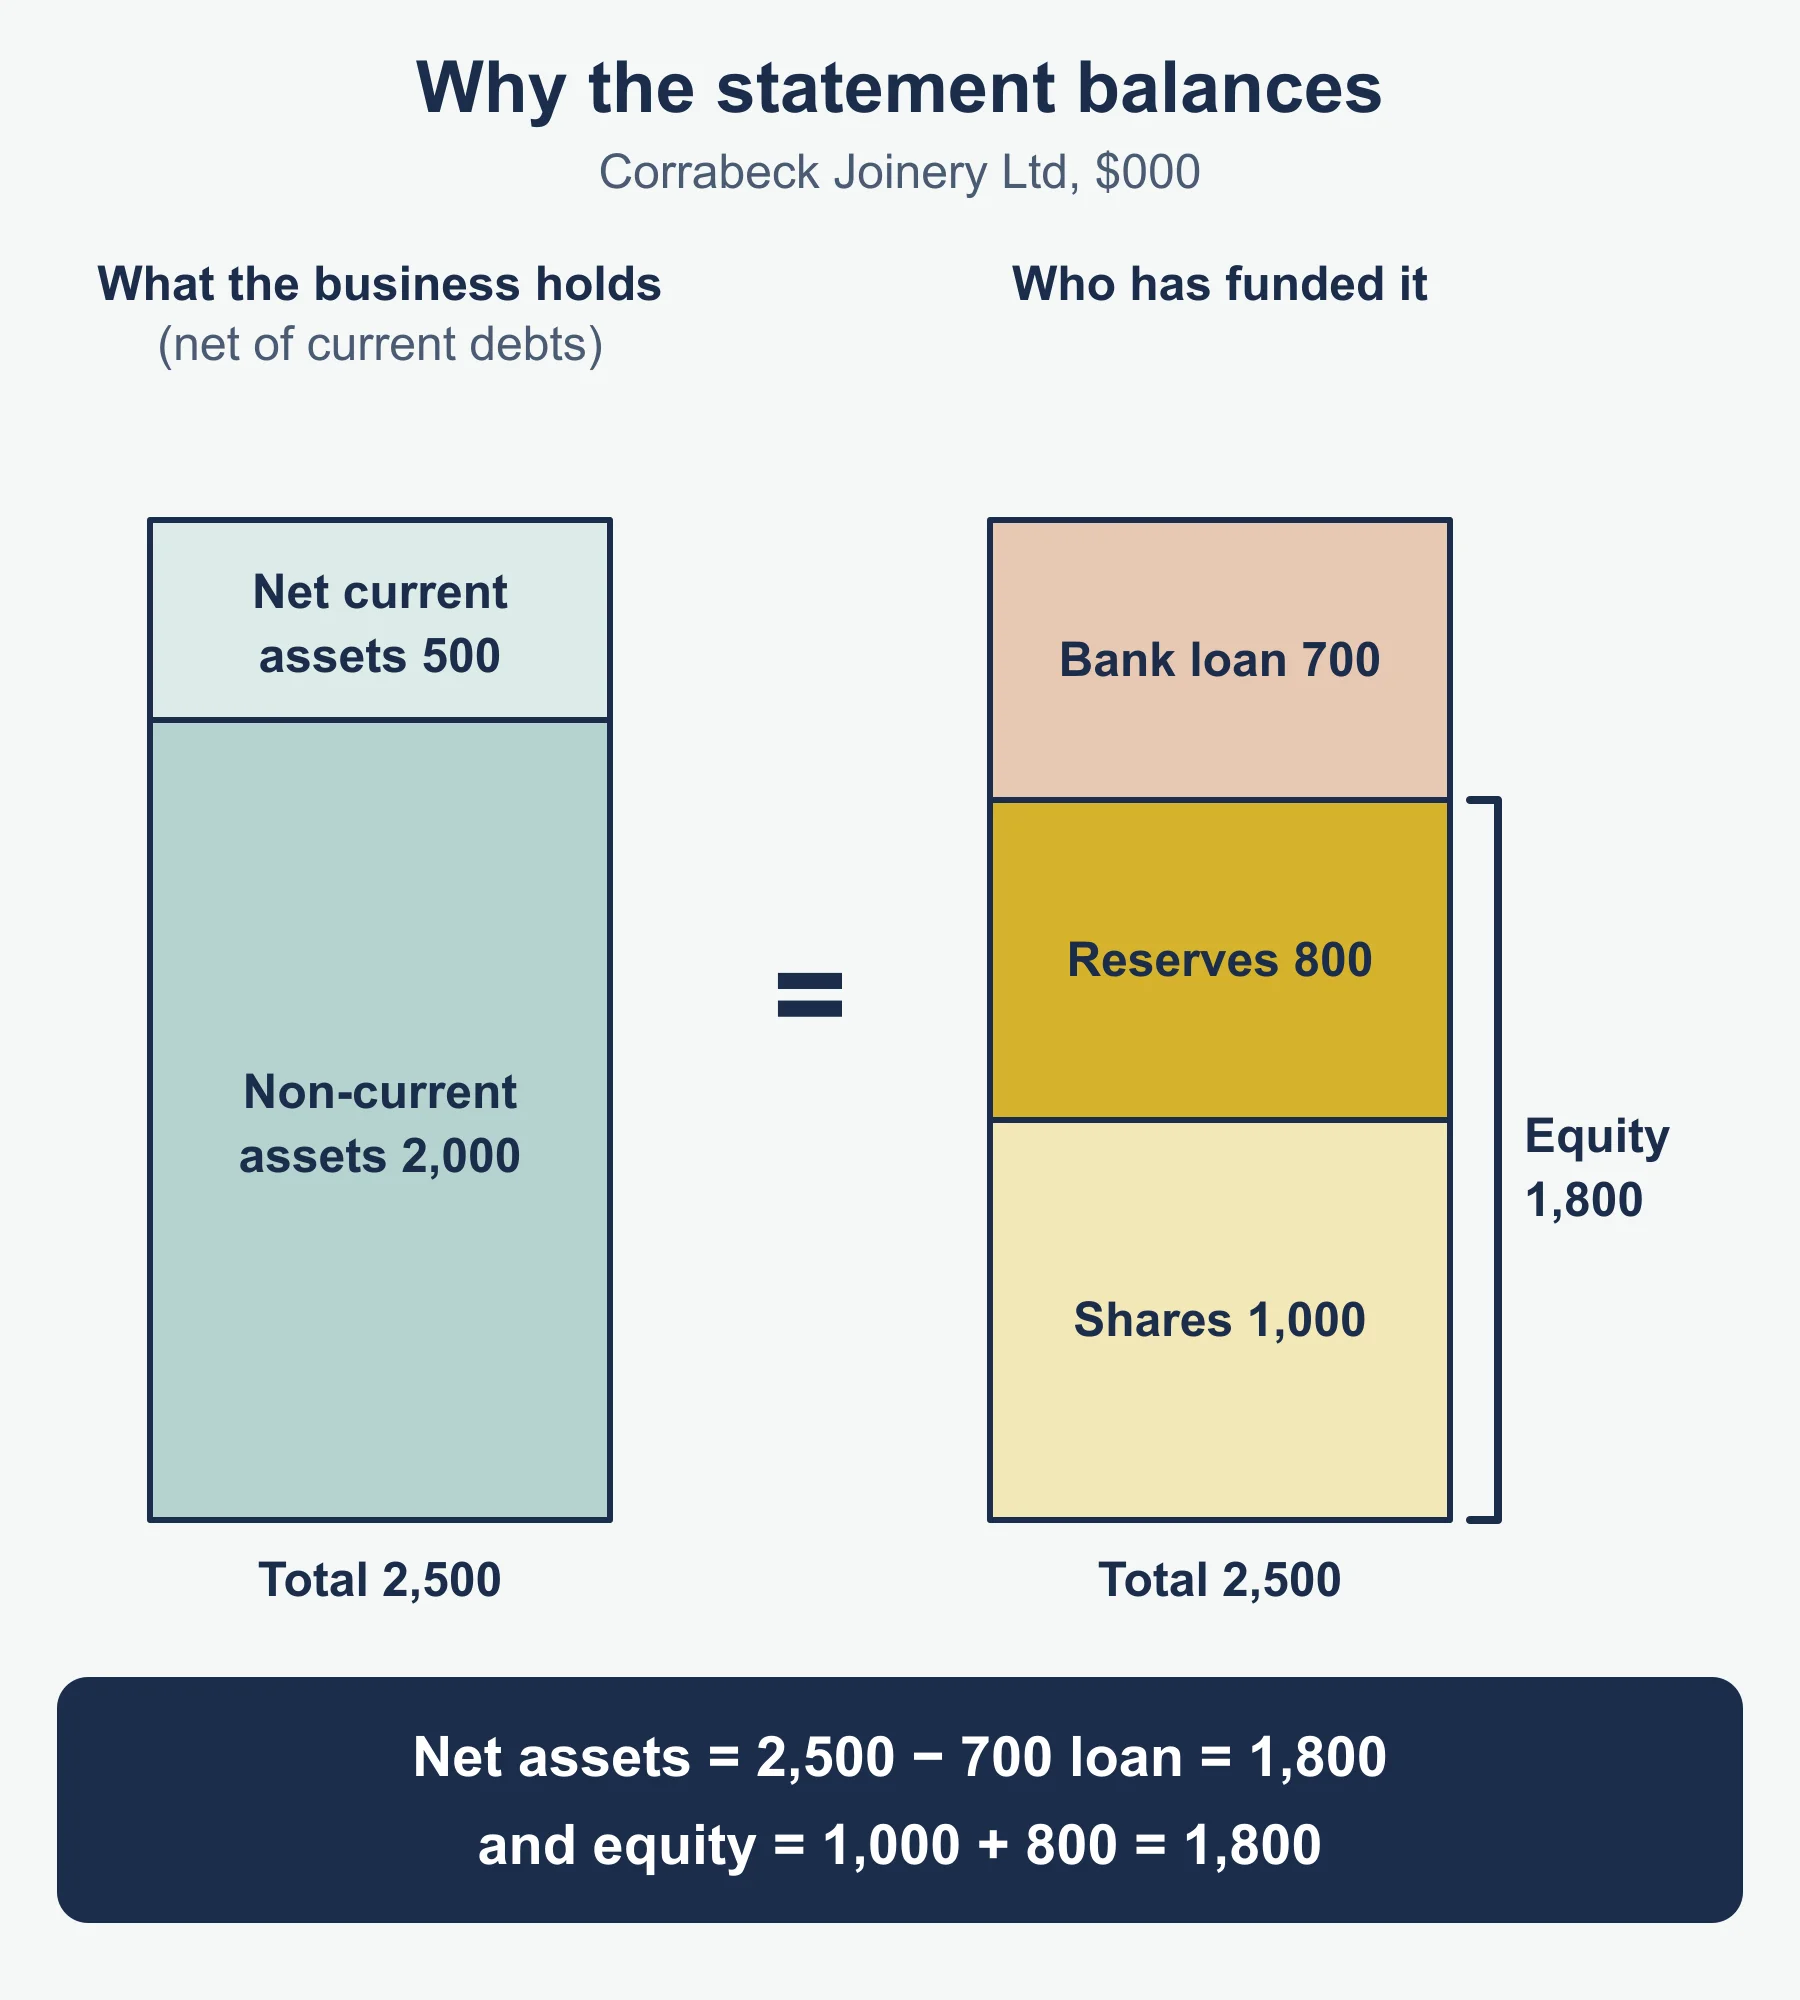
Net assets = non-current assets + net current assets − non-current liabilities. It must equal equity (issued shares + reserves). That is why the statement balances.
Amending the statement. Every change has two sides. Suppose Corrabeck buys a machine for 200, paid for by a new long-term bank loan. Non-current assets rise to 2,200 and non-current liabilities rise to 900. Net assets stay at 1,800. Had it paid cash, cash would fall instead and net current assets would shrink.
Links between the two statements.
- Profit for the year less dividends (retained earnings) is added to reserves.
- Closing inventory is a current asset, and it also sets the cost of sales.
- Trade receivables come from credit sales; trade payables come from credit purchases.
- Tax charged in the statement of profit or loss is a current liability until it is paid.
- Depreciation is an expense in the statement of profit or loss and lowers non-current assets.
10.1.3 Inventory valuation
Valuing inventory is difficult because the true value is uncertain. Goods may be damaged, out of fashion or slow to sell. Prices may change. Counting and valuing large or varied stock takes judgement. The value matters because it changes cost of sales, and so profit, and also current assets.
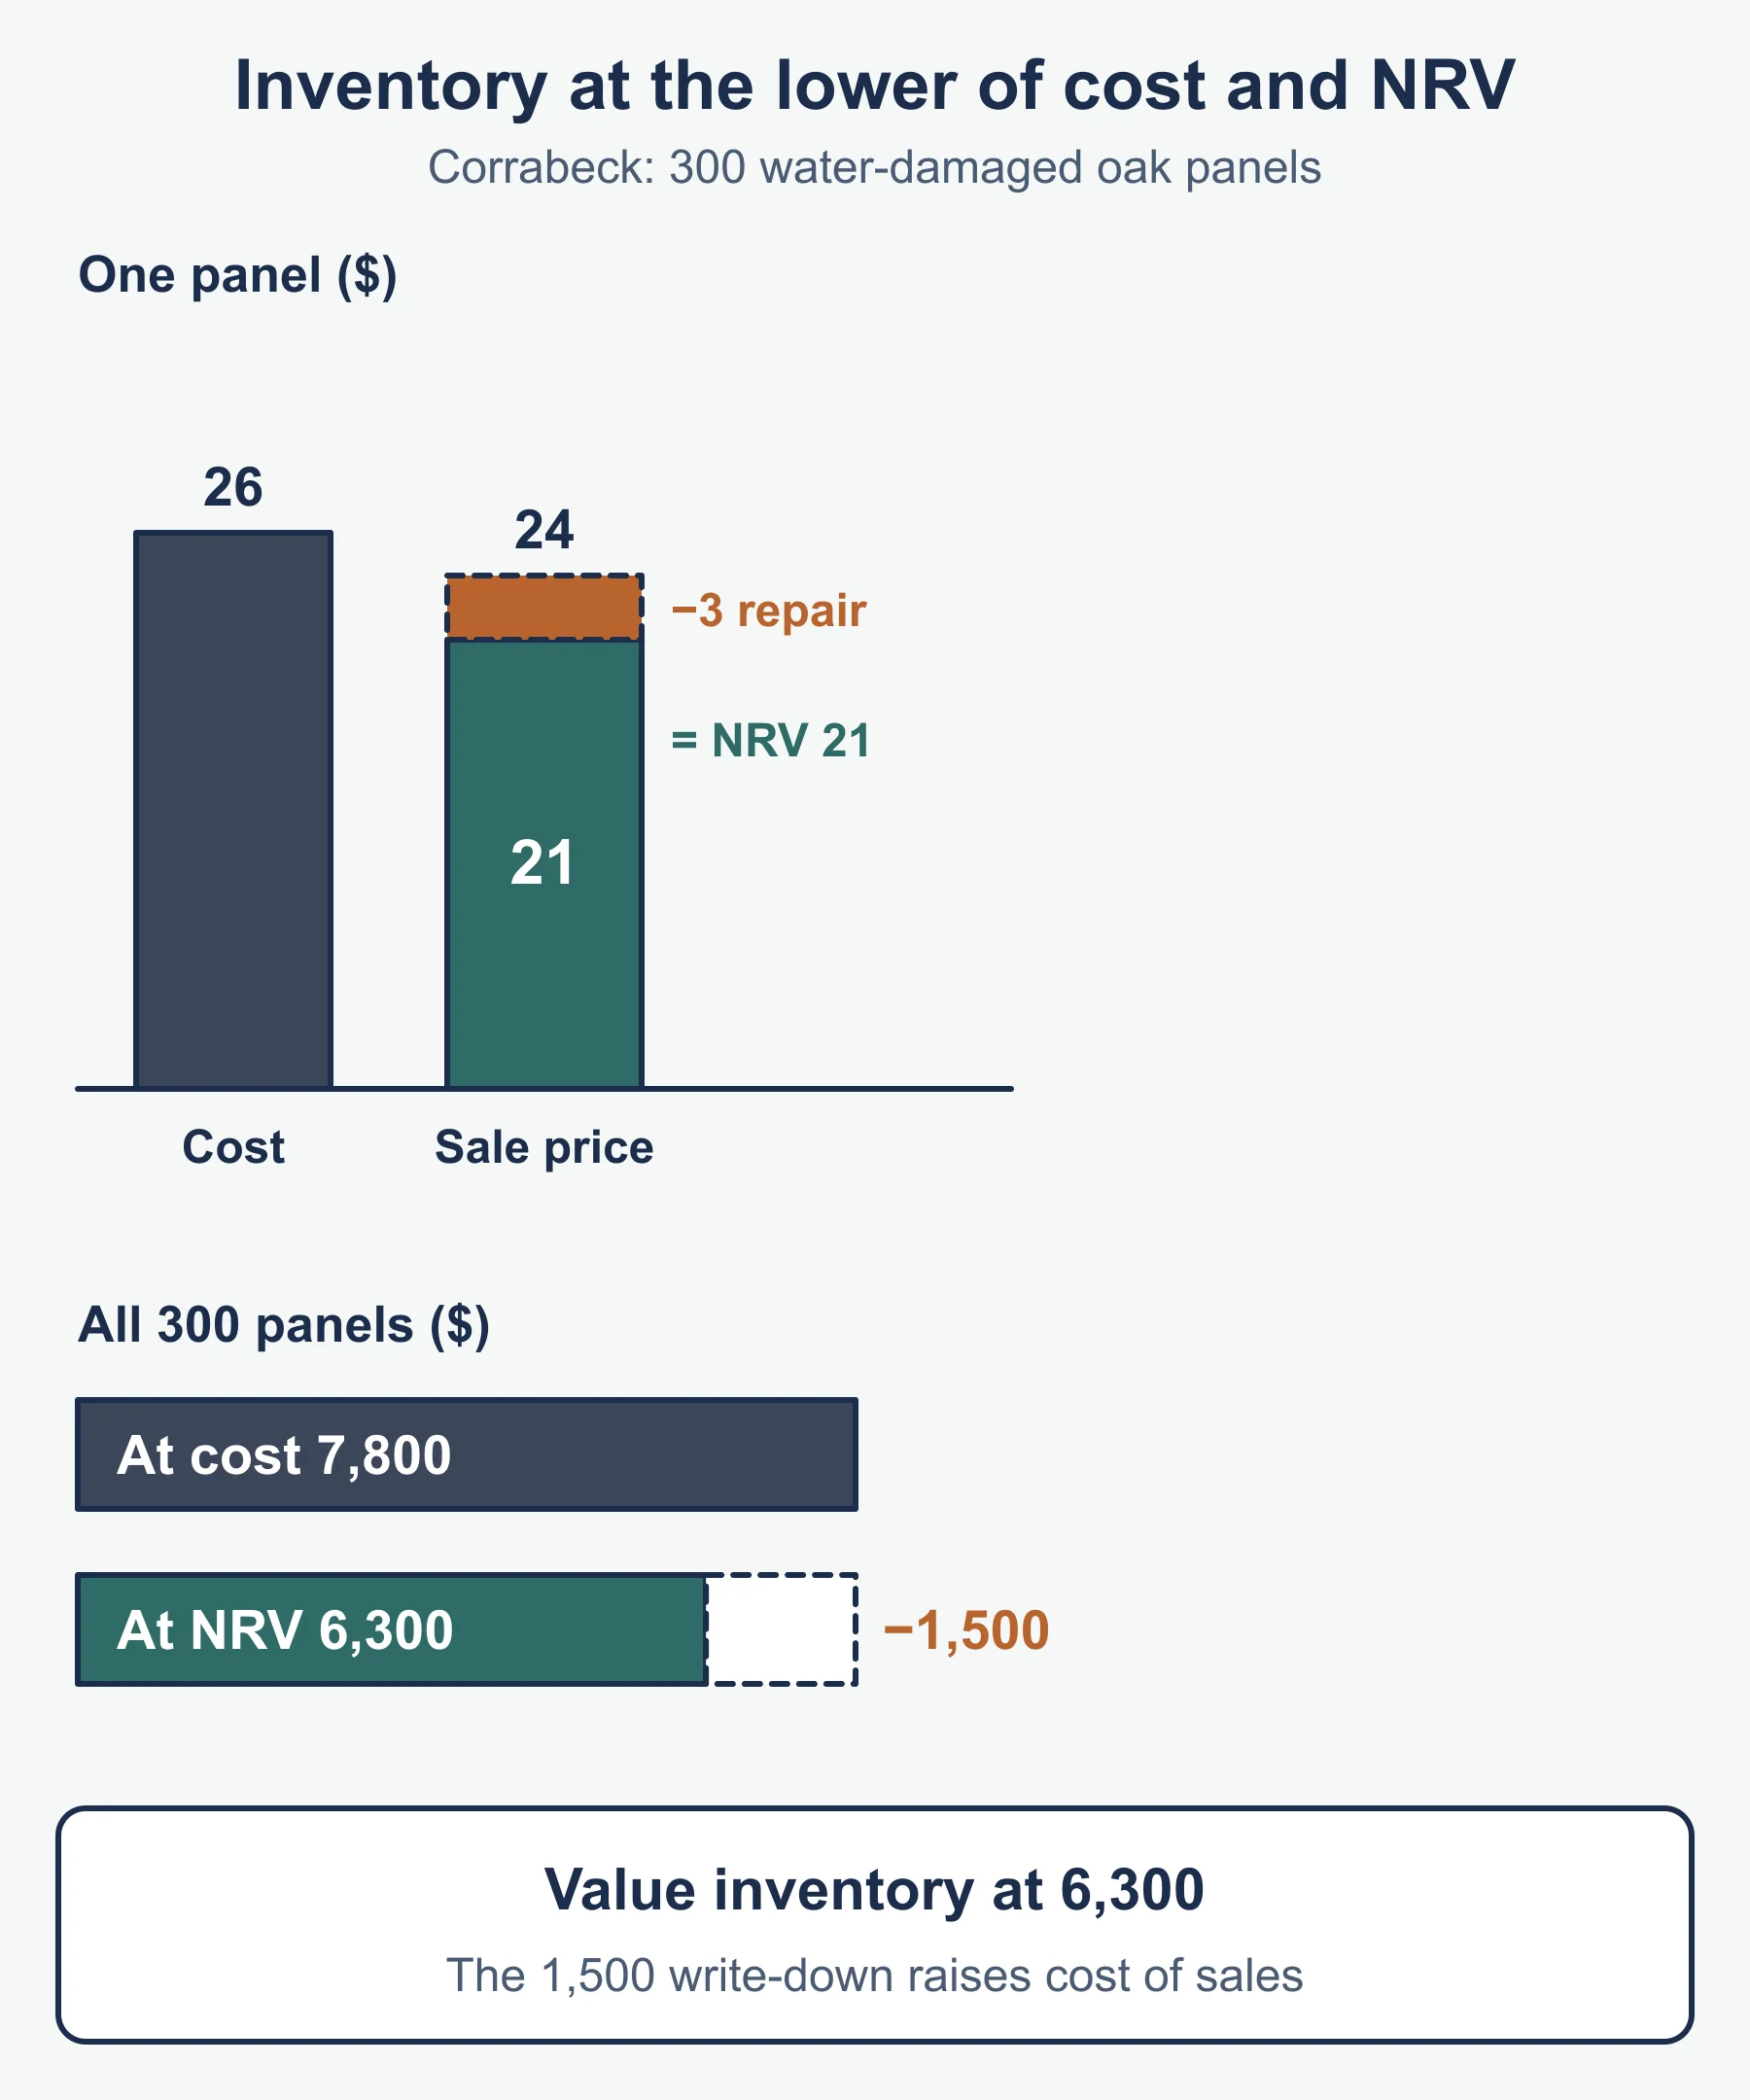
The net realisable value (NRV) method. NRV is the estimated selling price less any costs needed to sell the goods or make them saleable. The standard approach is to value inventory at the lower of cost and NRV, so that assets are not overstated. This is the standard form; the syllabus lists the method by name.
Corrabeck holds 300 oak panels that cost 26 each. Water damage means they can only be sold for 24, and each needs 3 of repair work. NRV per panel is 24 − 3 = 21. Cost is 300 × 26 = 7,800 (in dollars, not thousands) and NRV is 300 × 21 = 6,300. Inventory is valued at the lower figure, 6,300. The write-down of 1,500 increases cost of sales, so profit falls.
10.1.4 Depreciation
Depreciation spreads the cost of a non-current asset over its useful life. It is an expense, so it matches part of the asset’s cost to the revenue it helps to earn. It involves no cash payment in the year and does not set money aside to replace the asset.
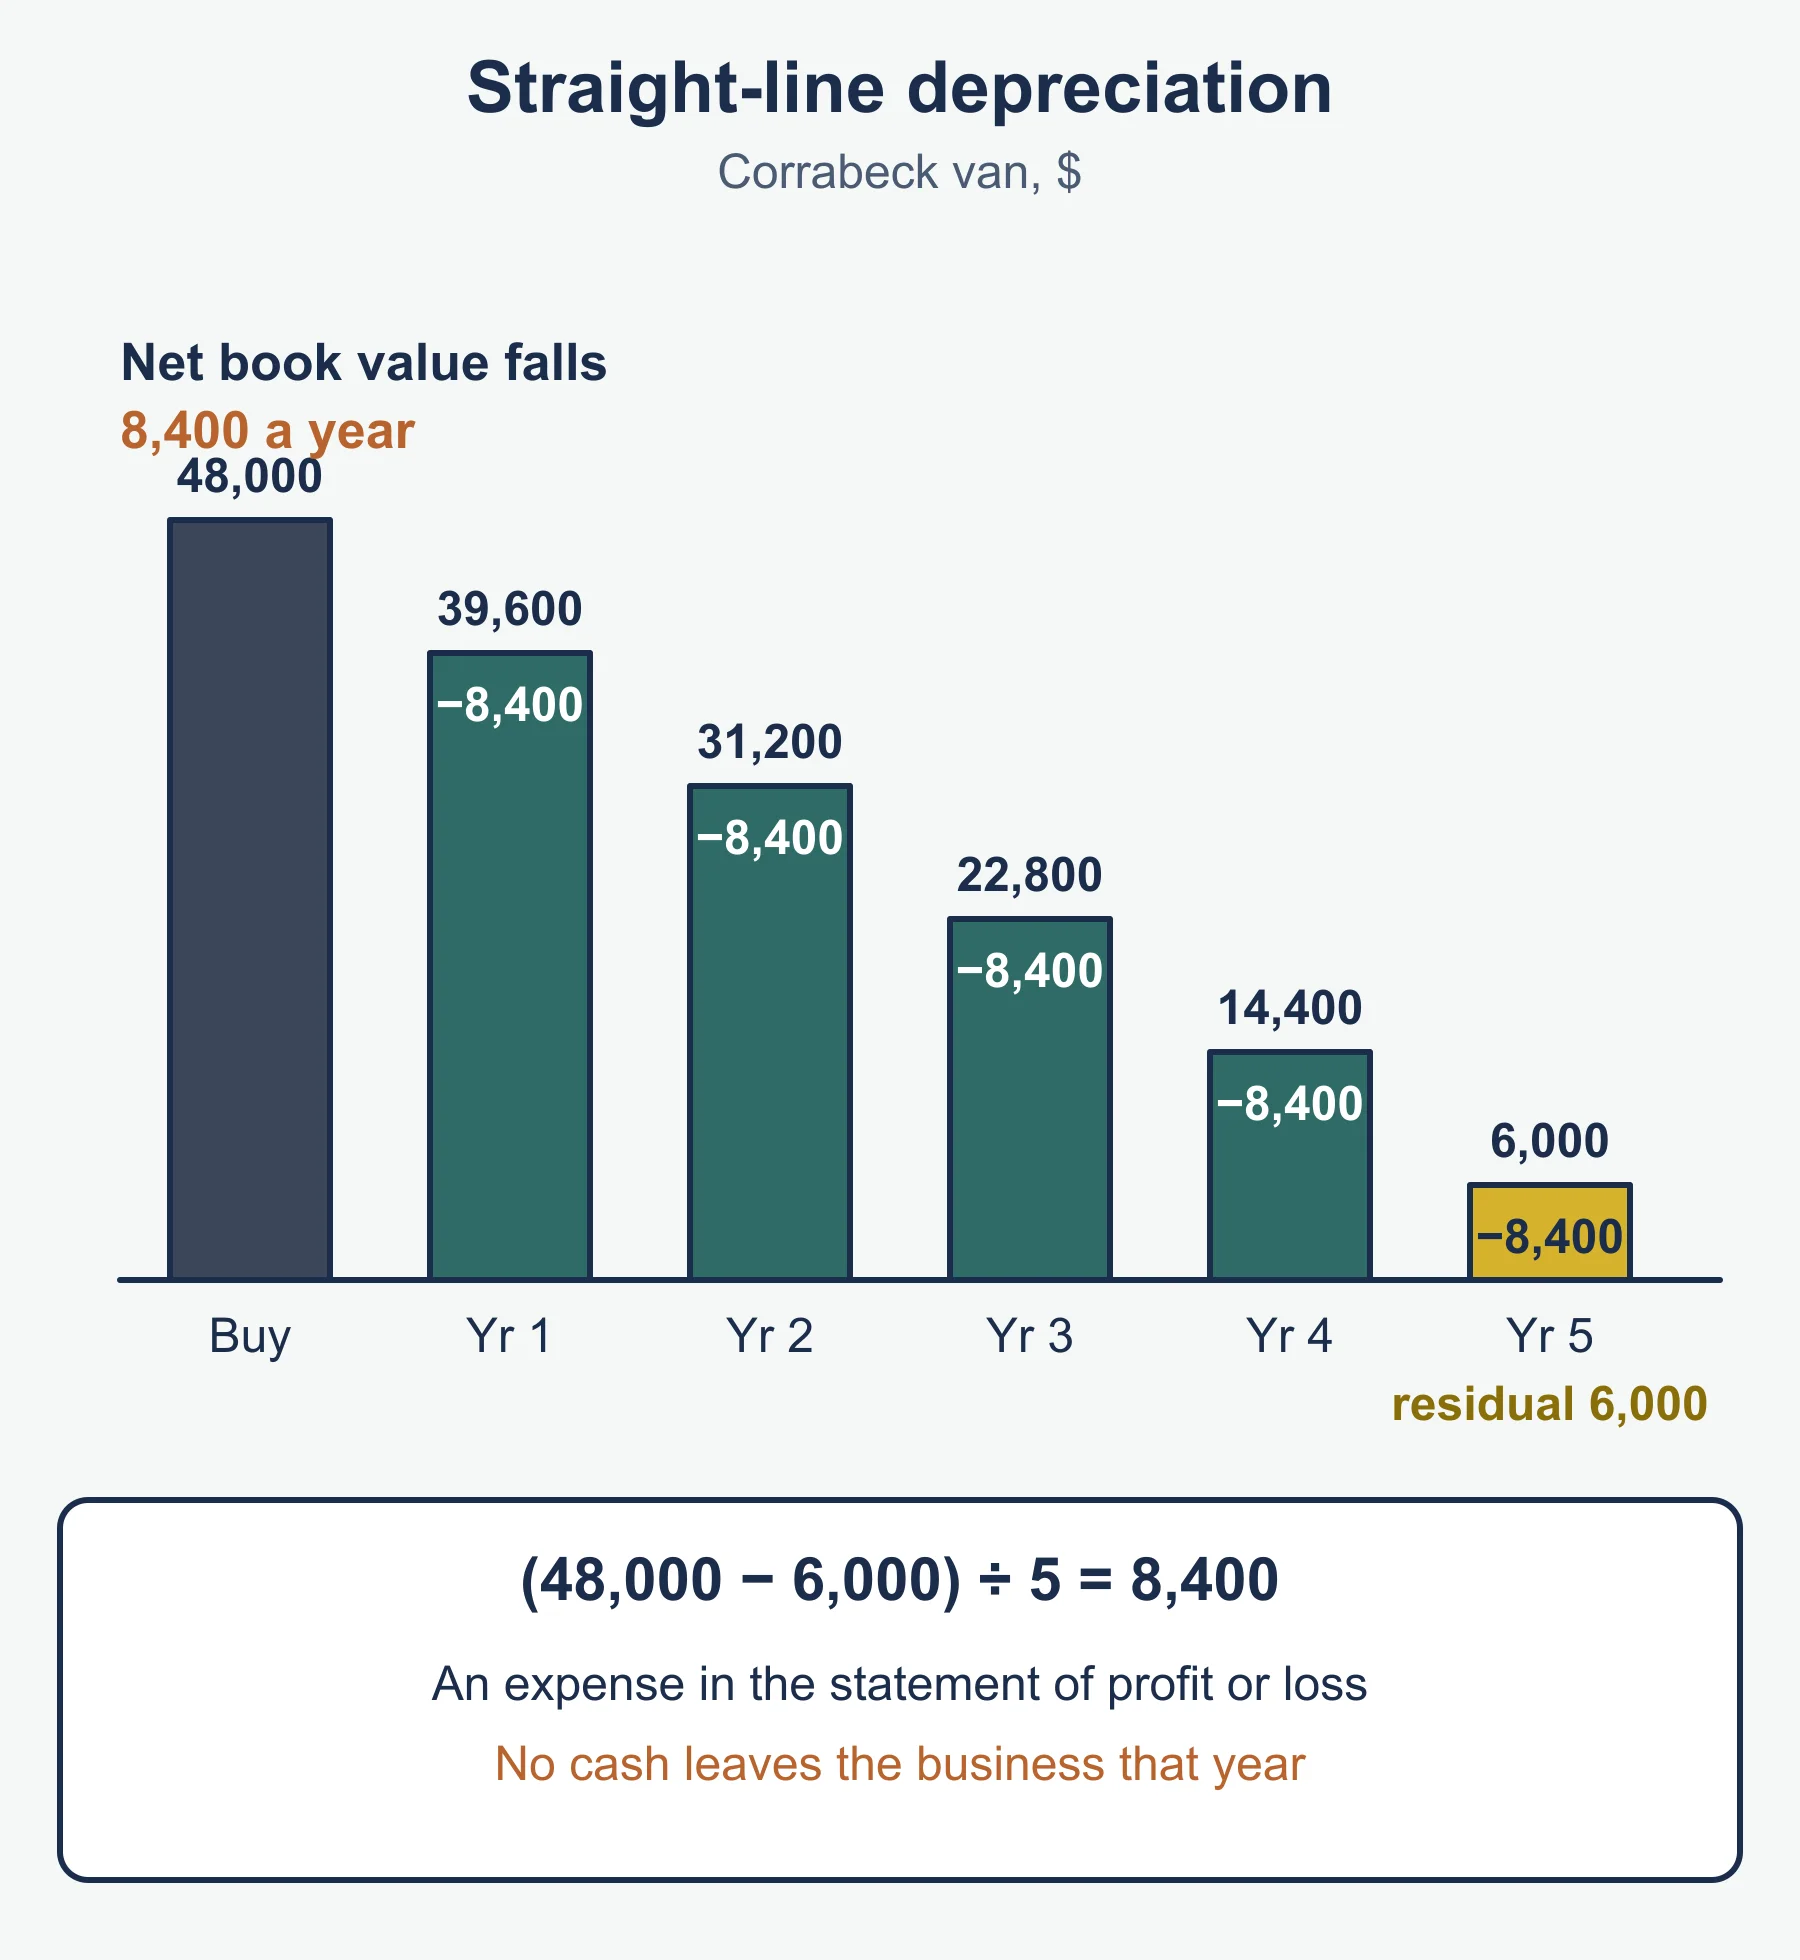
Straight-line method (the only one you need): annual depreciation = (cost − residual value) ÷ useful life.
Corrabeck buys a van for 48,000 (dollars), residual value 6,000, life 5 years. Annual depreciation = 42,000 ÷ 5 = 8,400.
| End of year | Net book value |
|---|---|
| 1 | 39,600 |
| 2 | 31,200 |
Impact: the 8,400 is charged as an expense in the statement of profit or loss each year, reducing profit. On the statement of financial position the van is shown at net book value, which falls by 8,400 a year.
10.2 Analysing published accounts
Ratios turn the figures into comparisons. A single ratio says little. Compare it with the same business in earlier years, with competitors, and with what the business is trying to achieve. Corrabeck’s ratios are worked below, using the formulas the syllabus gives.
10.2.1 Liquidity ratios
Liquidity is the ability to pay short-term debts as they fall due. It matters because profitable firms can still fail if they run out of cash.
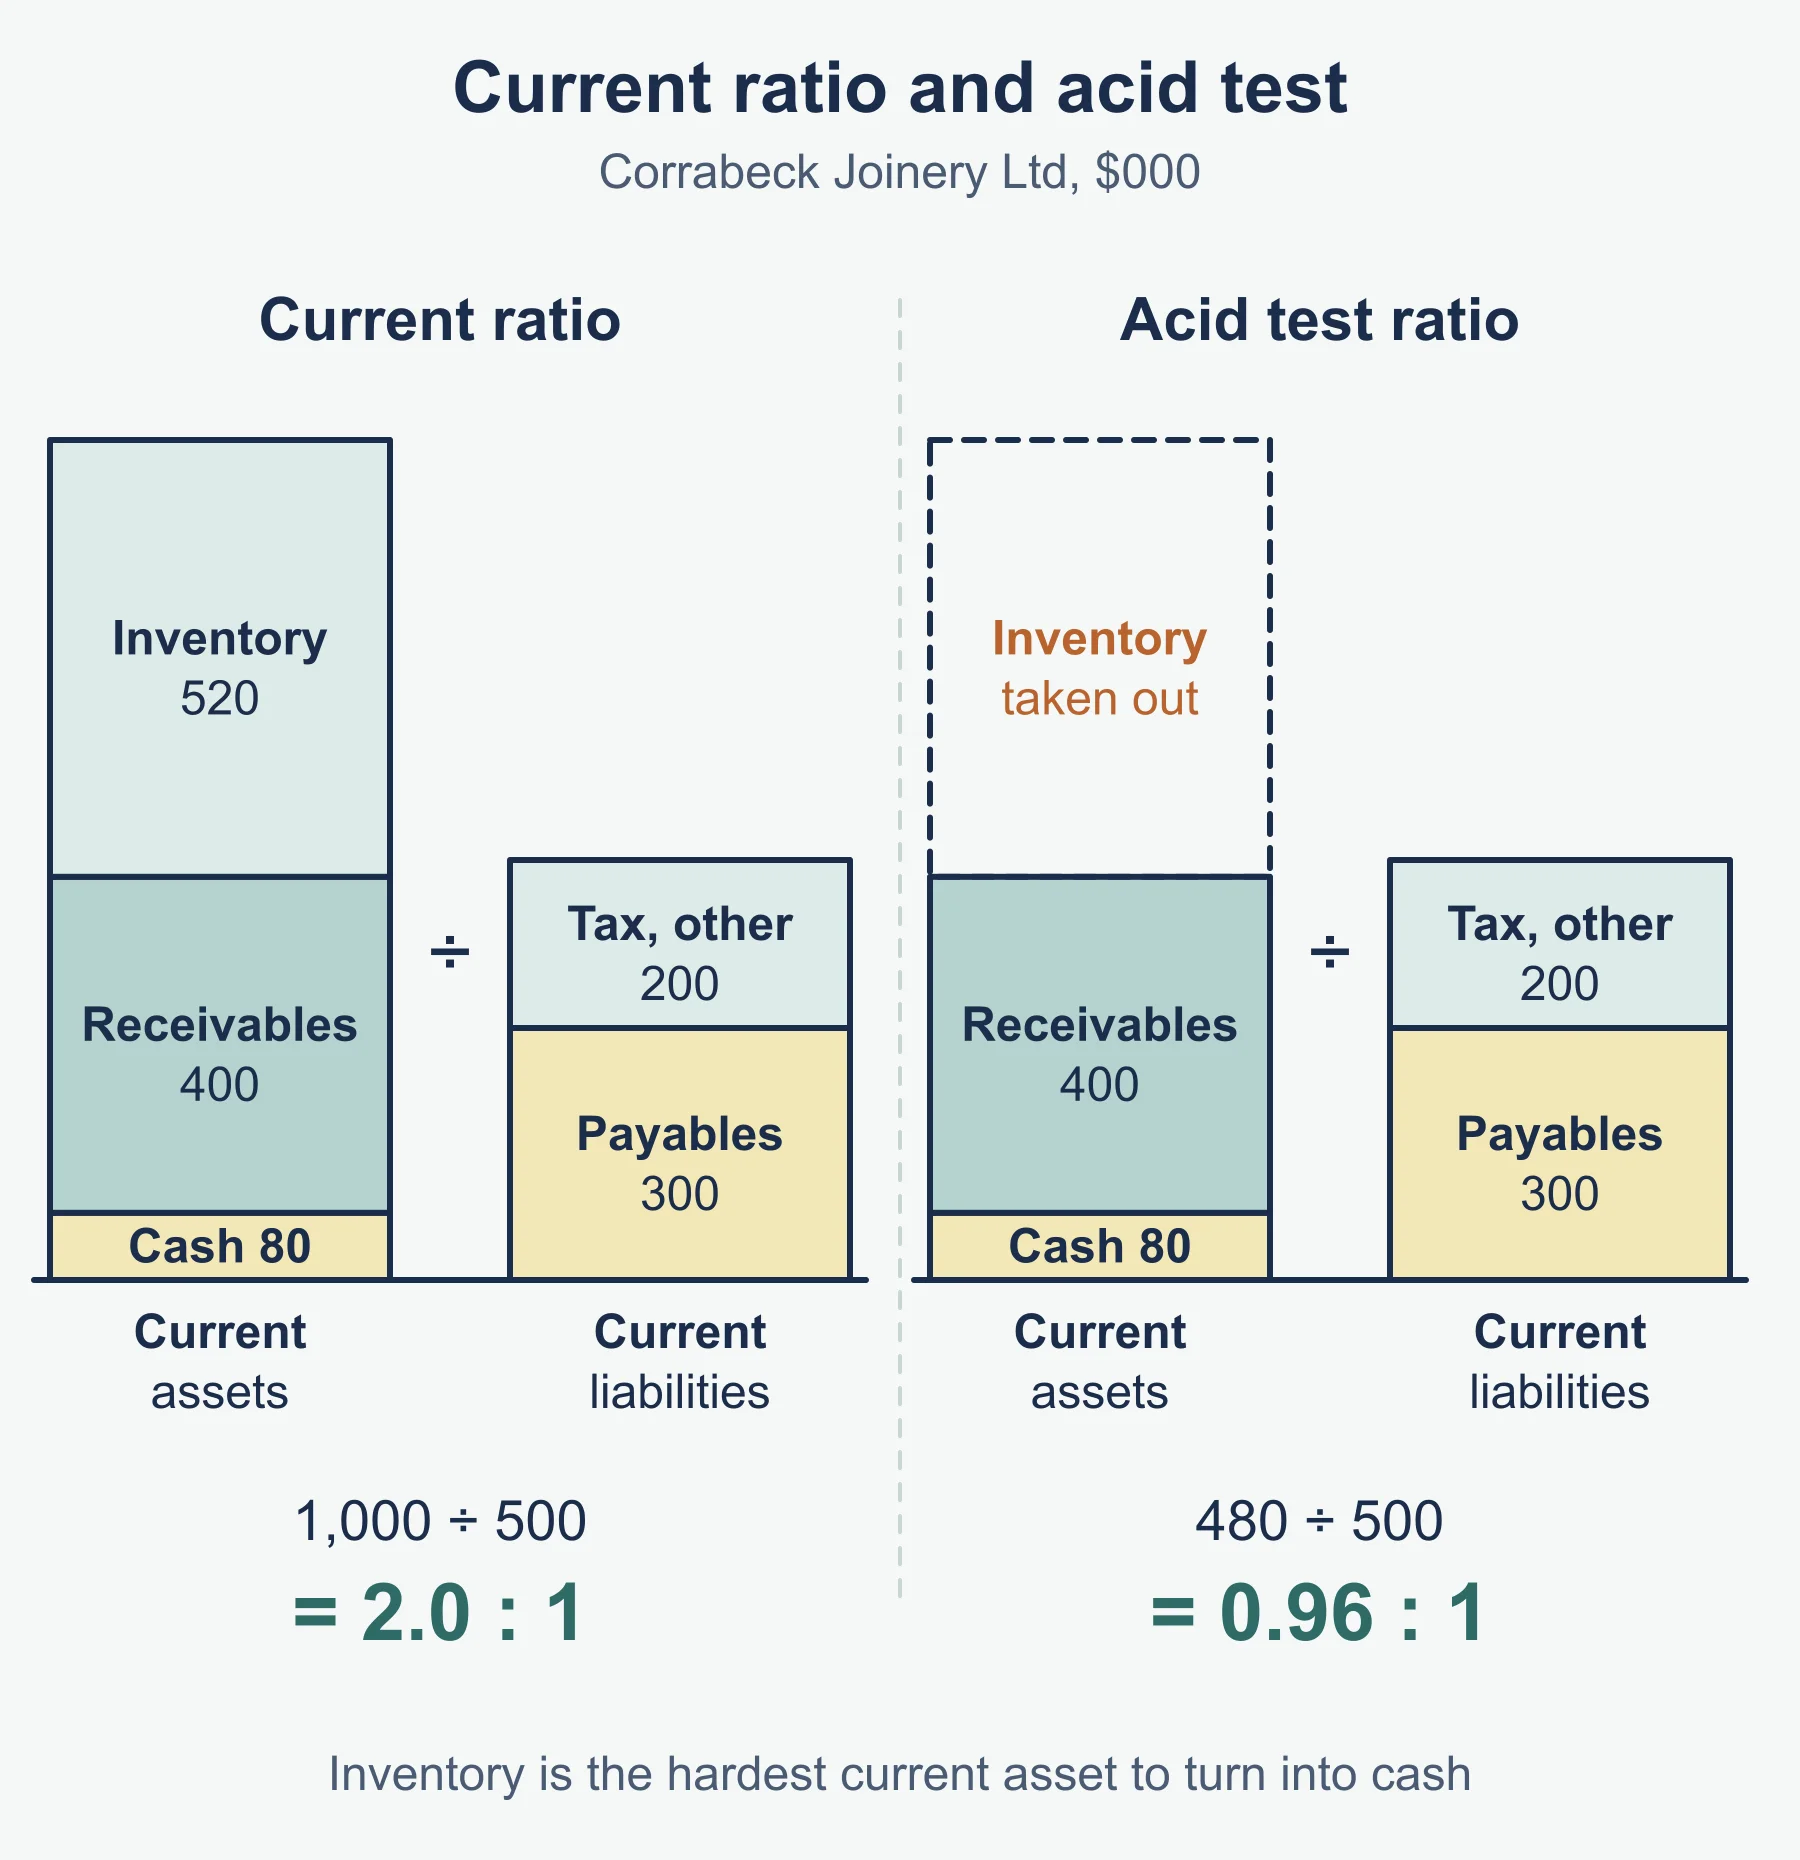
- Current ratio = current assets ÷ current liabilities = 1,000 ÷ 500 = 2.0 : 1.
- Acid test ratio = (current assets − inventory) ÷ current liabilities = 480 ÷ 500 = 0.96 : 1.
Both are presented as ratios. The acid test strips out inventory because it is the hardest current asset to turn into cash quickly. Some people quote a current ratio near 2 and an acid test near 1 as comfortable, but these are rules of thumb, not syllabus requirements, and the right level depends on the industry. Too high may mean cash or stock is sitting idle.
Methods of improving liquidity: reduce inventory; collect receivables faster; negotiate longer payment terms with suppliers; replace short-term borrowing with long-term borrowing; issue shares; sell and lease back an asset.
10.2.2 Profitability ratios
Profitability is the ability to earn profit from the resources used. It matters to owners, lenders and managers.
- Gross profit margin = gross profit ÷ revenue × 100 = 1,680 ÷ 4,800 × 100 = 35%.
- Operating profit margin (profit margin) = profit from operations ÷ revenue × 100 = 10%.
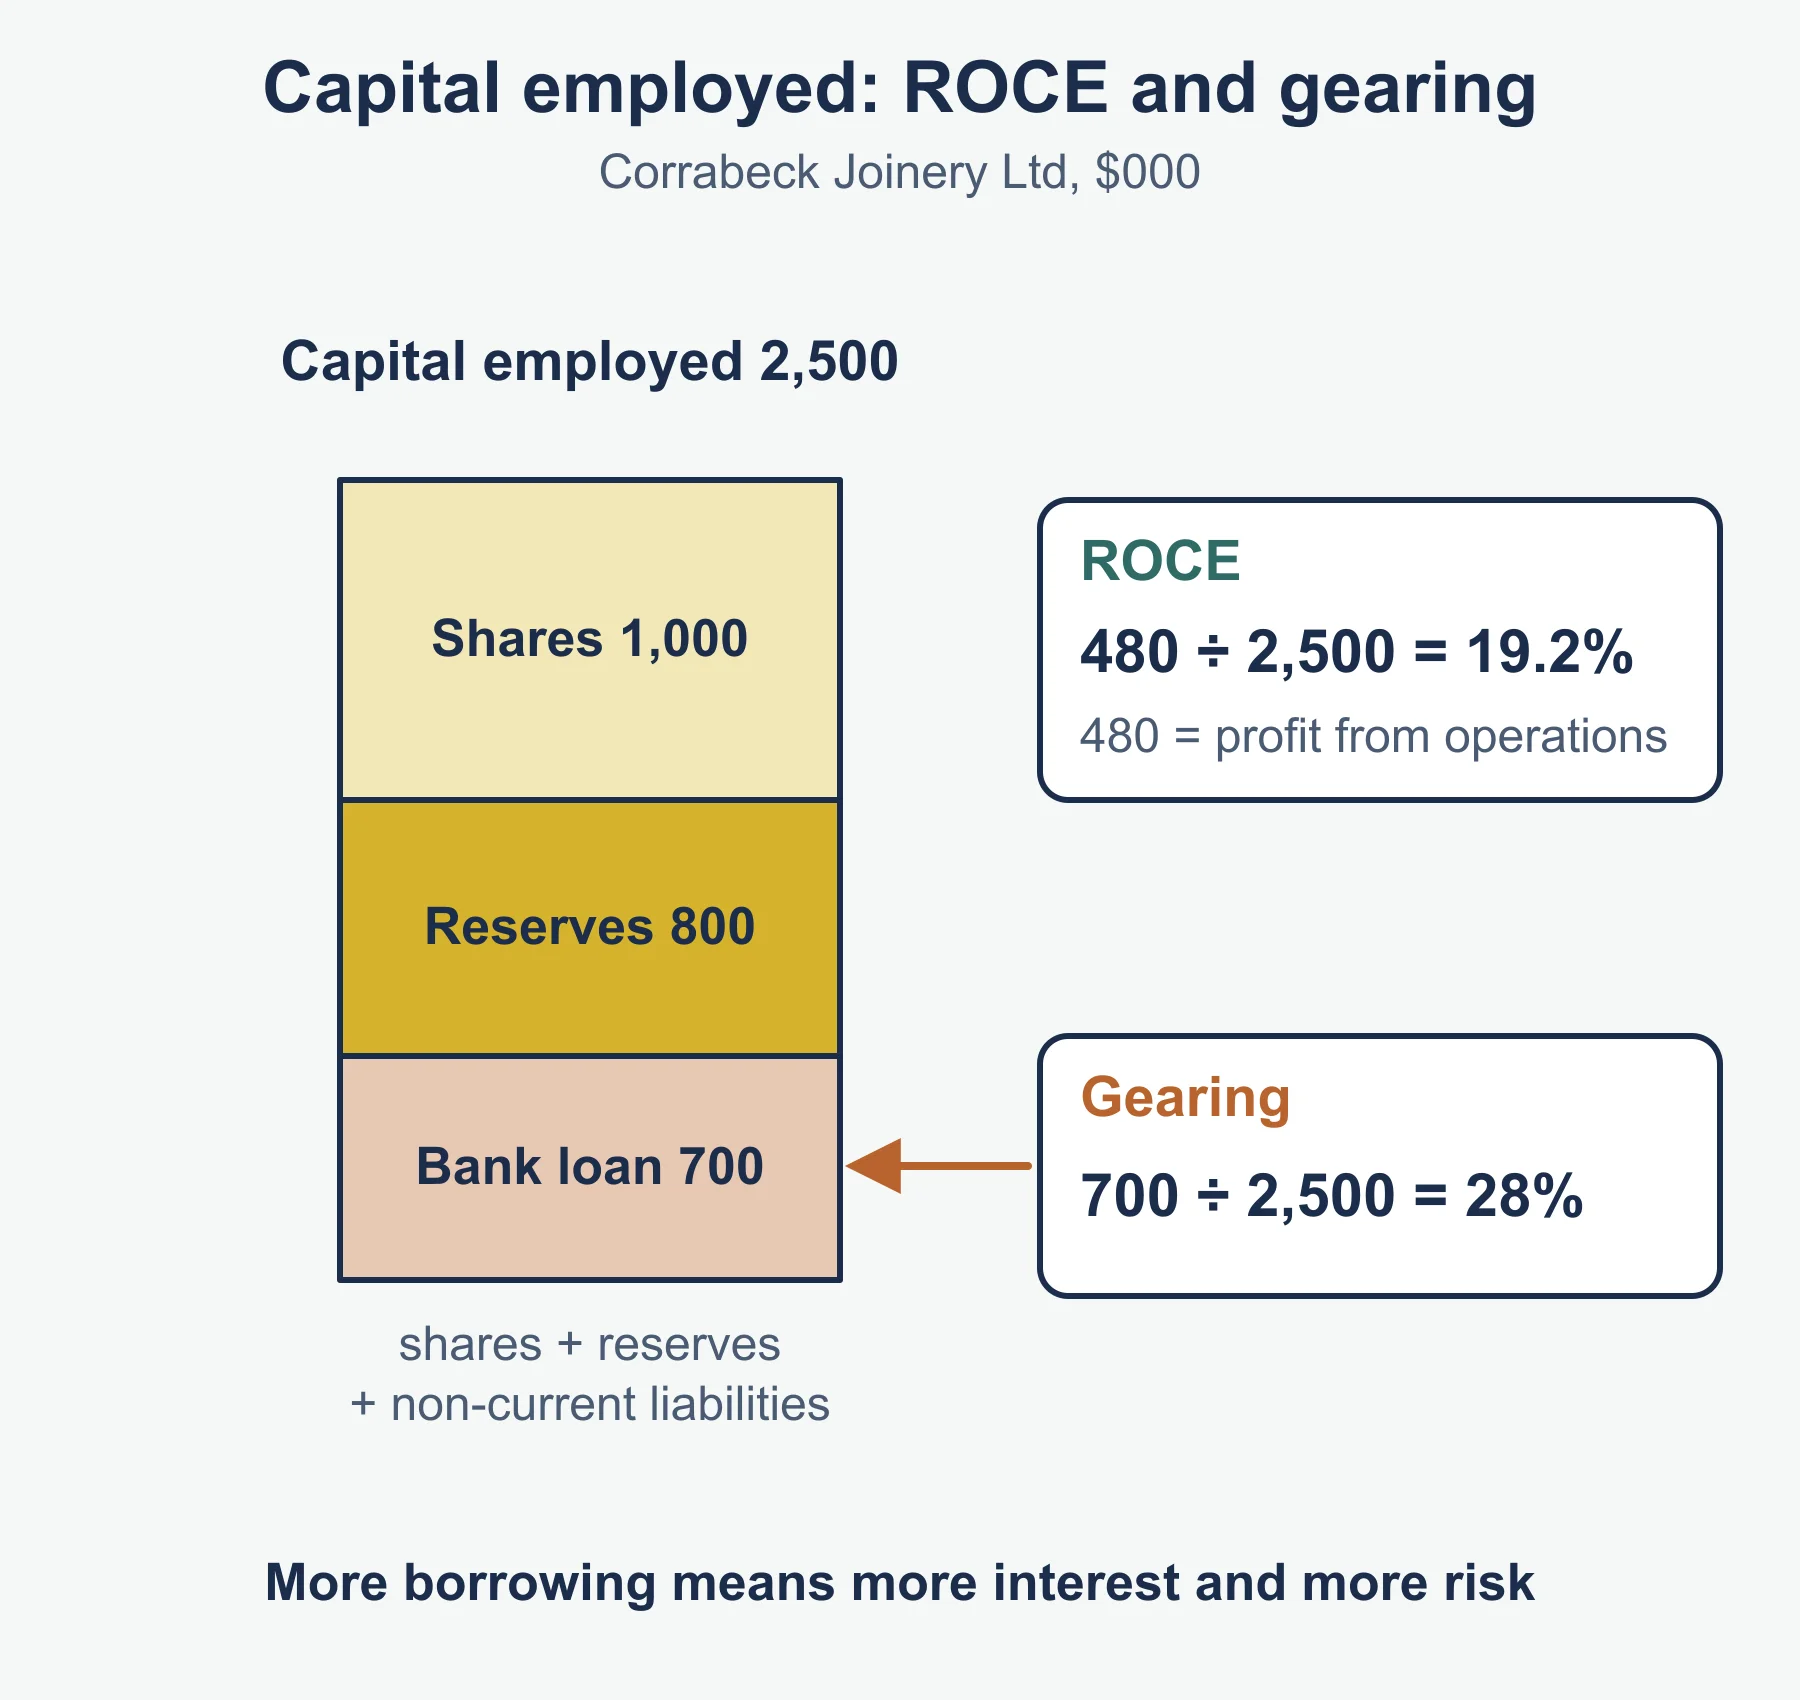
- Return on capital employed (ROCE) = profit from operations ÷ capital employed × 100, where capital employed = issued shares + reserves + non-current liabilities = 1,000 + 800 + 700 = 2,500. ROCE = 480 ÷ 2,500 × 100 = 19.2%.
A gap between the two margins shows how heavy the expenses are. ROCE should be compared with the cost of borrowing and with other uses of the money.
Methods of improving profitability: raise prices (if demand allows), cut cost of sales through cheaper suppliers, cut expenses, increase volume, or reduce capital employed by selling unused assets.
10.2.3 Financial efficiency ratios
Financial efficiency is how well a business manages inventory, receivables and payables. It matters because cash tied up in stock or unpaid bills cannot be used elsewhere.
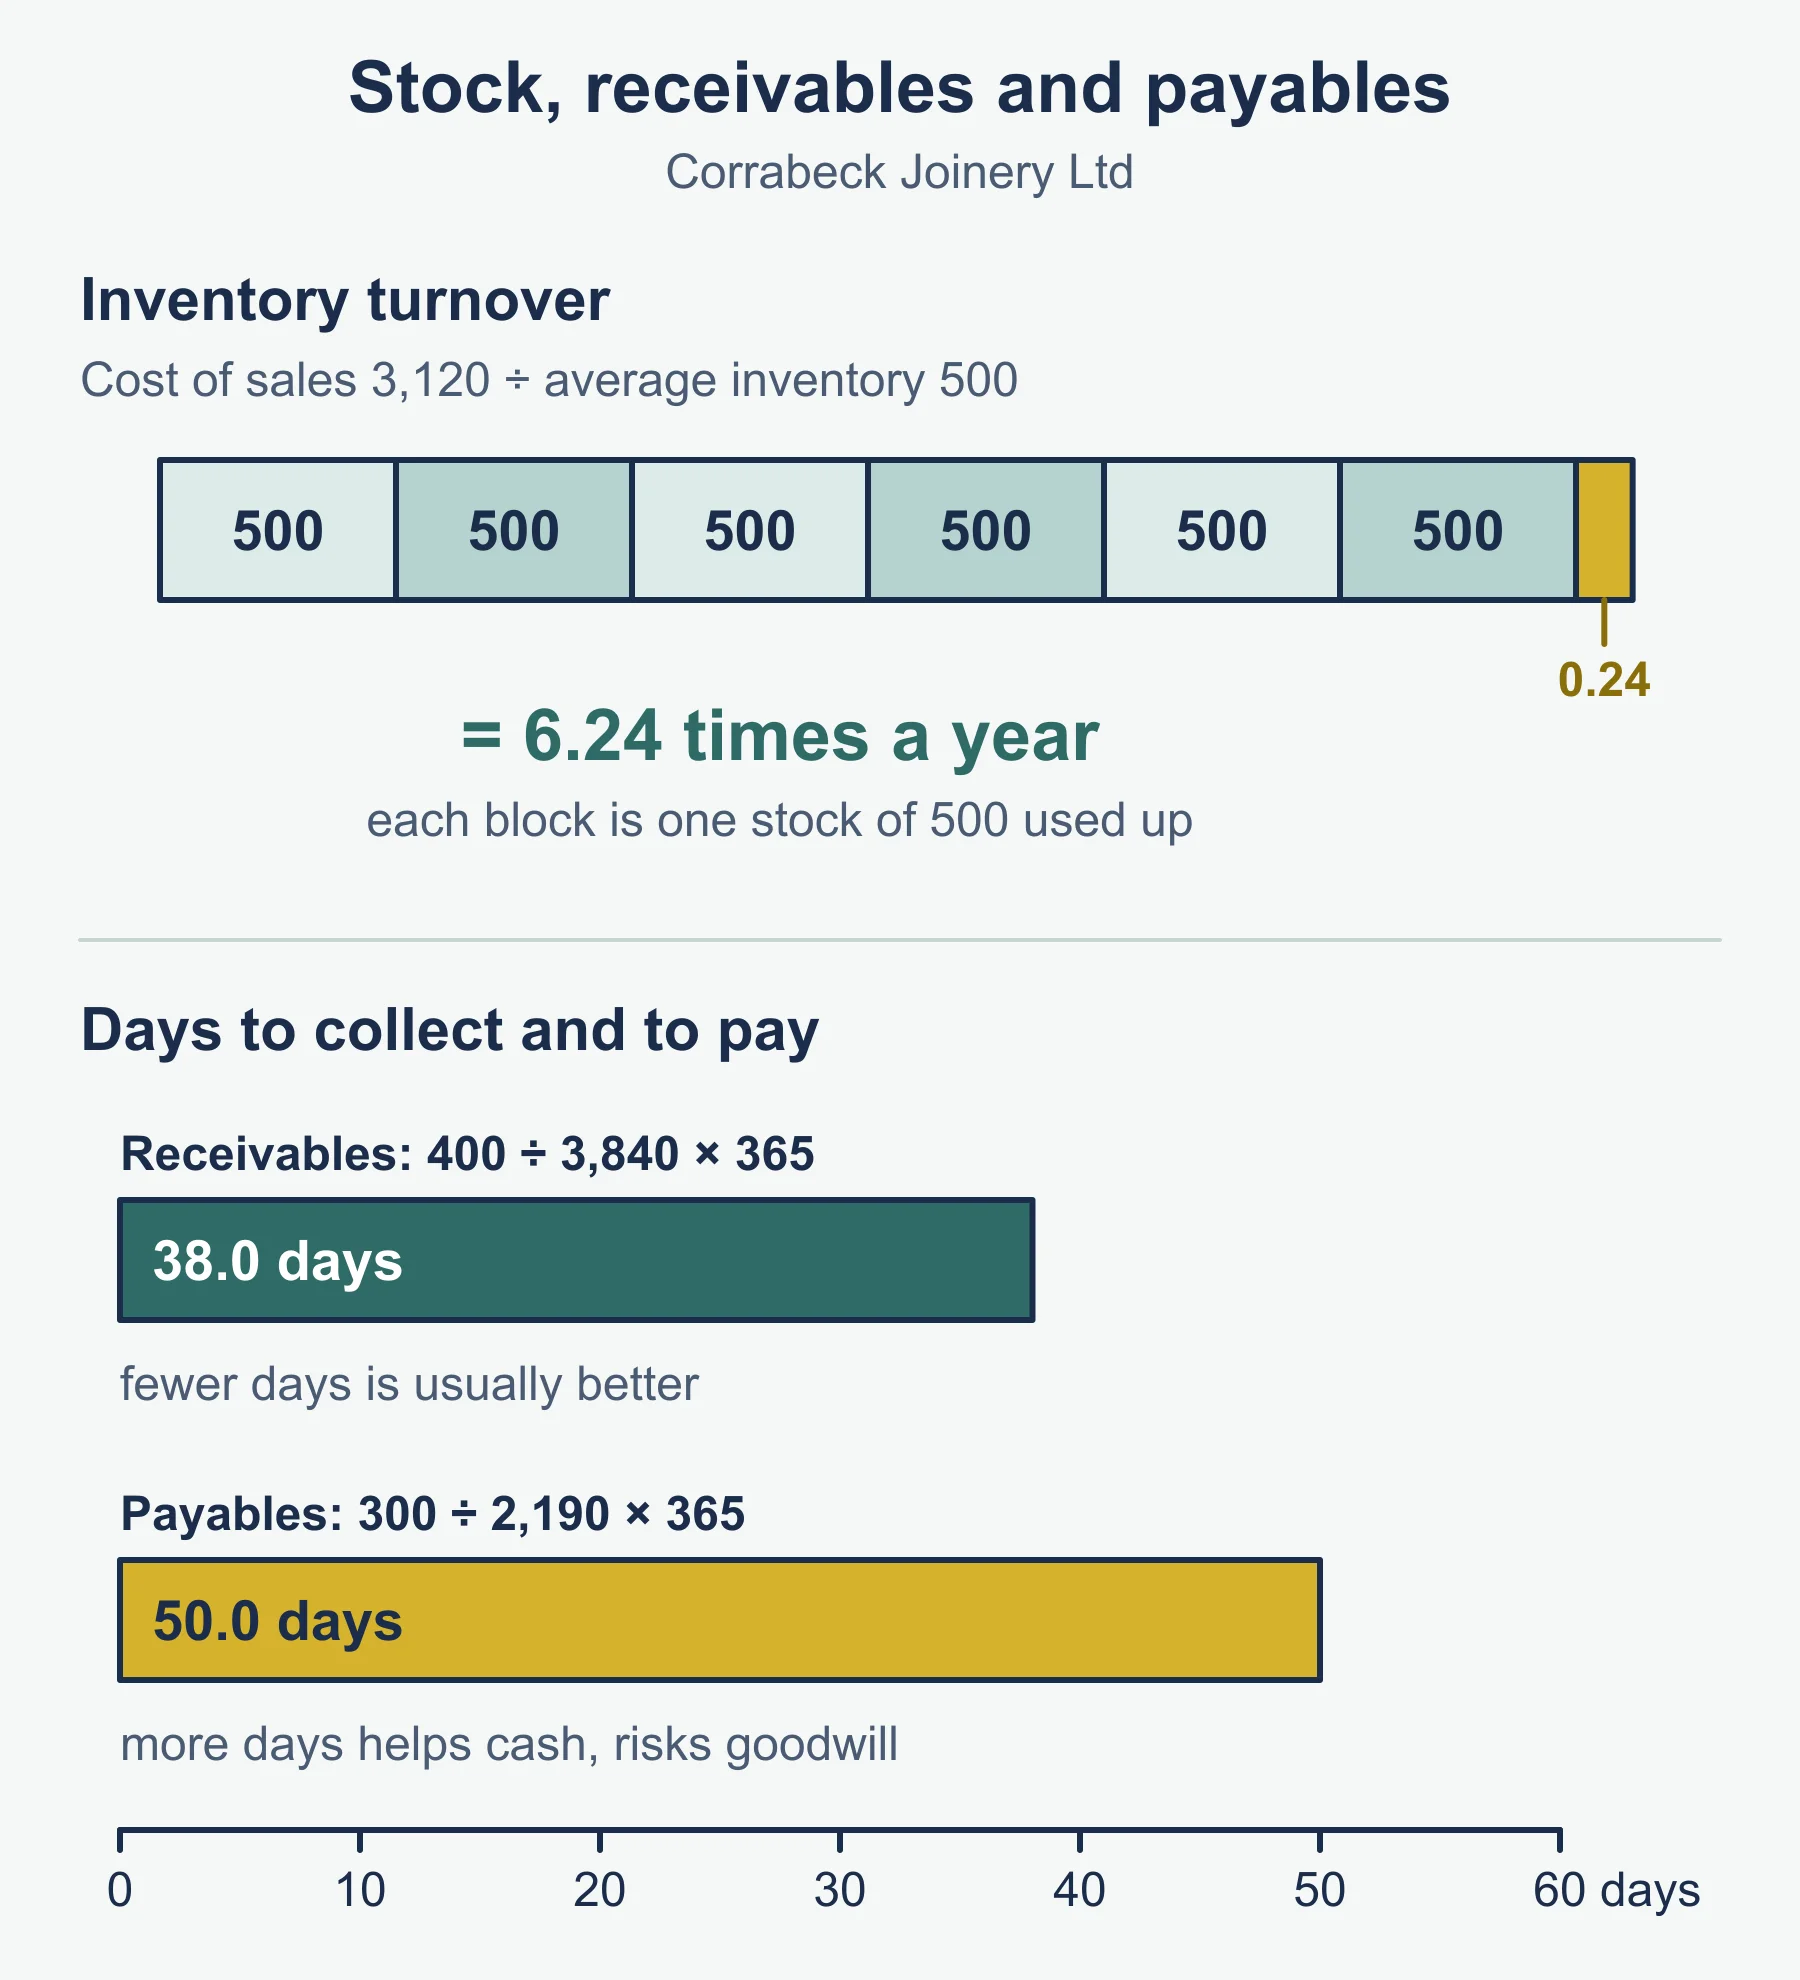
- Rate of inventory turnover = cost of sales ÷ average inventory. Opening inventory was 480, so average = 500 and turnover = 3,120 ÷ 500 = 6.24 times.
- Trade receivables turnover (days) = trade receivables ÷ credit sales × 365. If credit sales were 3,840: 400 ÷ 3,840 × 365 = 38.0 days.
- Trade payables turnover (days) = trade payables ÷ credit purchases × 365. If credit purchases were 2,190: 300 ÷ 2,190 × 365 = 50.0 days.
Fewer receivable days and faster inventory turnover are usually better. More payable days helps cash but risks supplier goodwill. Methods of improving efficiency: tighter credit control, early-settlement discounts, just-in-time ordering, and agreeing longer supplier terms.
10.2.4 Gearing ratio
Gearing shows how far a business relies on long-term borrowing. Gearing = non-current liabilities ÷ capital employed × 100 = 700 ÷ 2,500 × 100 = 28%. A high figure means more interest to pay and more risk, especially if profits fall. A low figure means less risk but possibly slower growth. Methods of improving (lowering) gearing: repay loans, issue shares, retain more profit.
10.2.5 Investment ratios
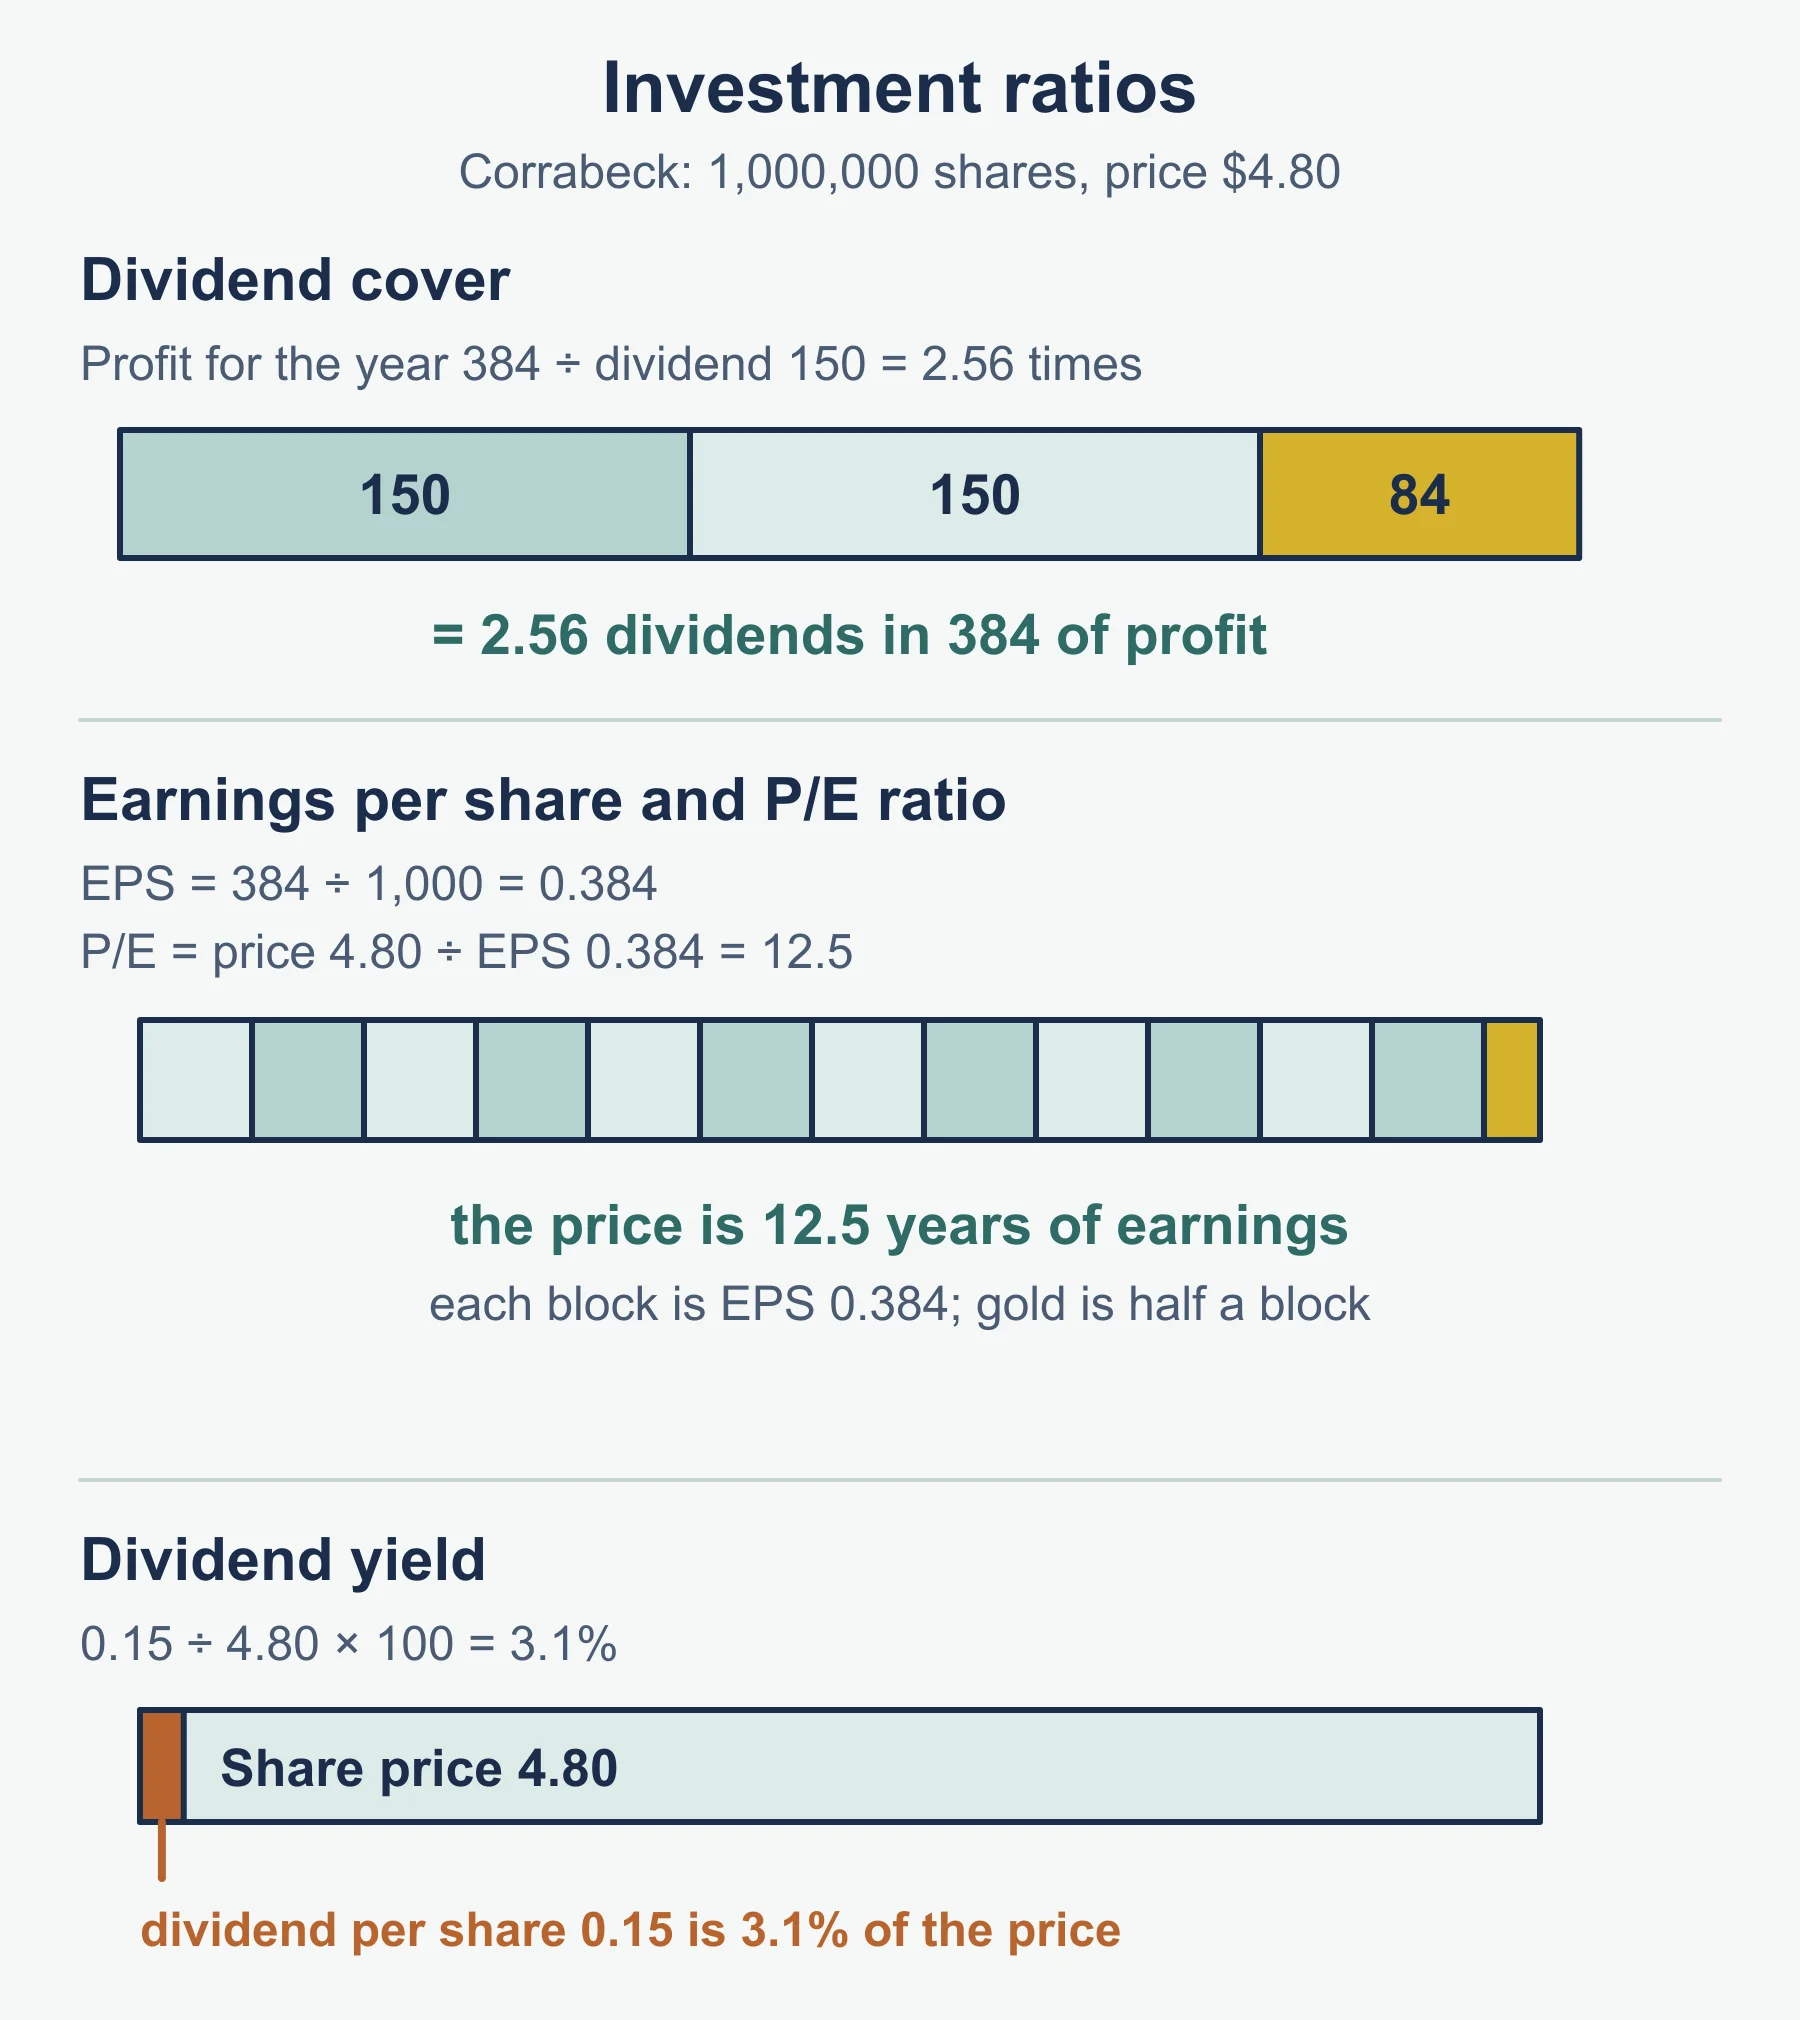
These show the return to investors, which matters because shareholders and potential buyers of shares judge whether the business is worth backing. Corrabeck has 1,000,000 shares (1,000 thousand) and a market price of 4.80 (dollars). Earnings per share = 384 ÷ 1,000 = 0.384 (this is the standard form).
- Dividend yield = dividend per share ÷ market price × 100 = 0.15 ÷ 4.80 × 100 = 3.1%.
- Dividend cover = profit for the year ÷ annual dividend = 384 ÷ 150 = 2.56 times.
- Price/earnings ratio = market price ÷ earnings per share = 4.80 ÷ 0.384 = 12.5.
A low cover means little profit is retained for growth. A high P/E suggests investors expect growth. Methods of improving investor return: raise profit, raise the dividend (if cash allows), and build confidence so the share price rises.
Comparing with a competitor
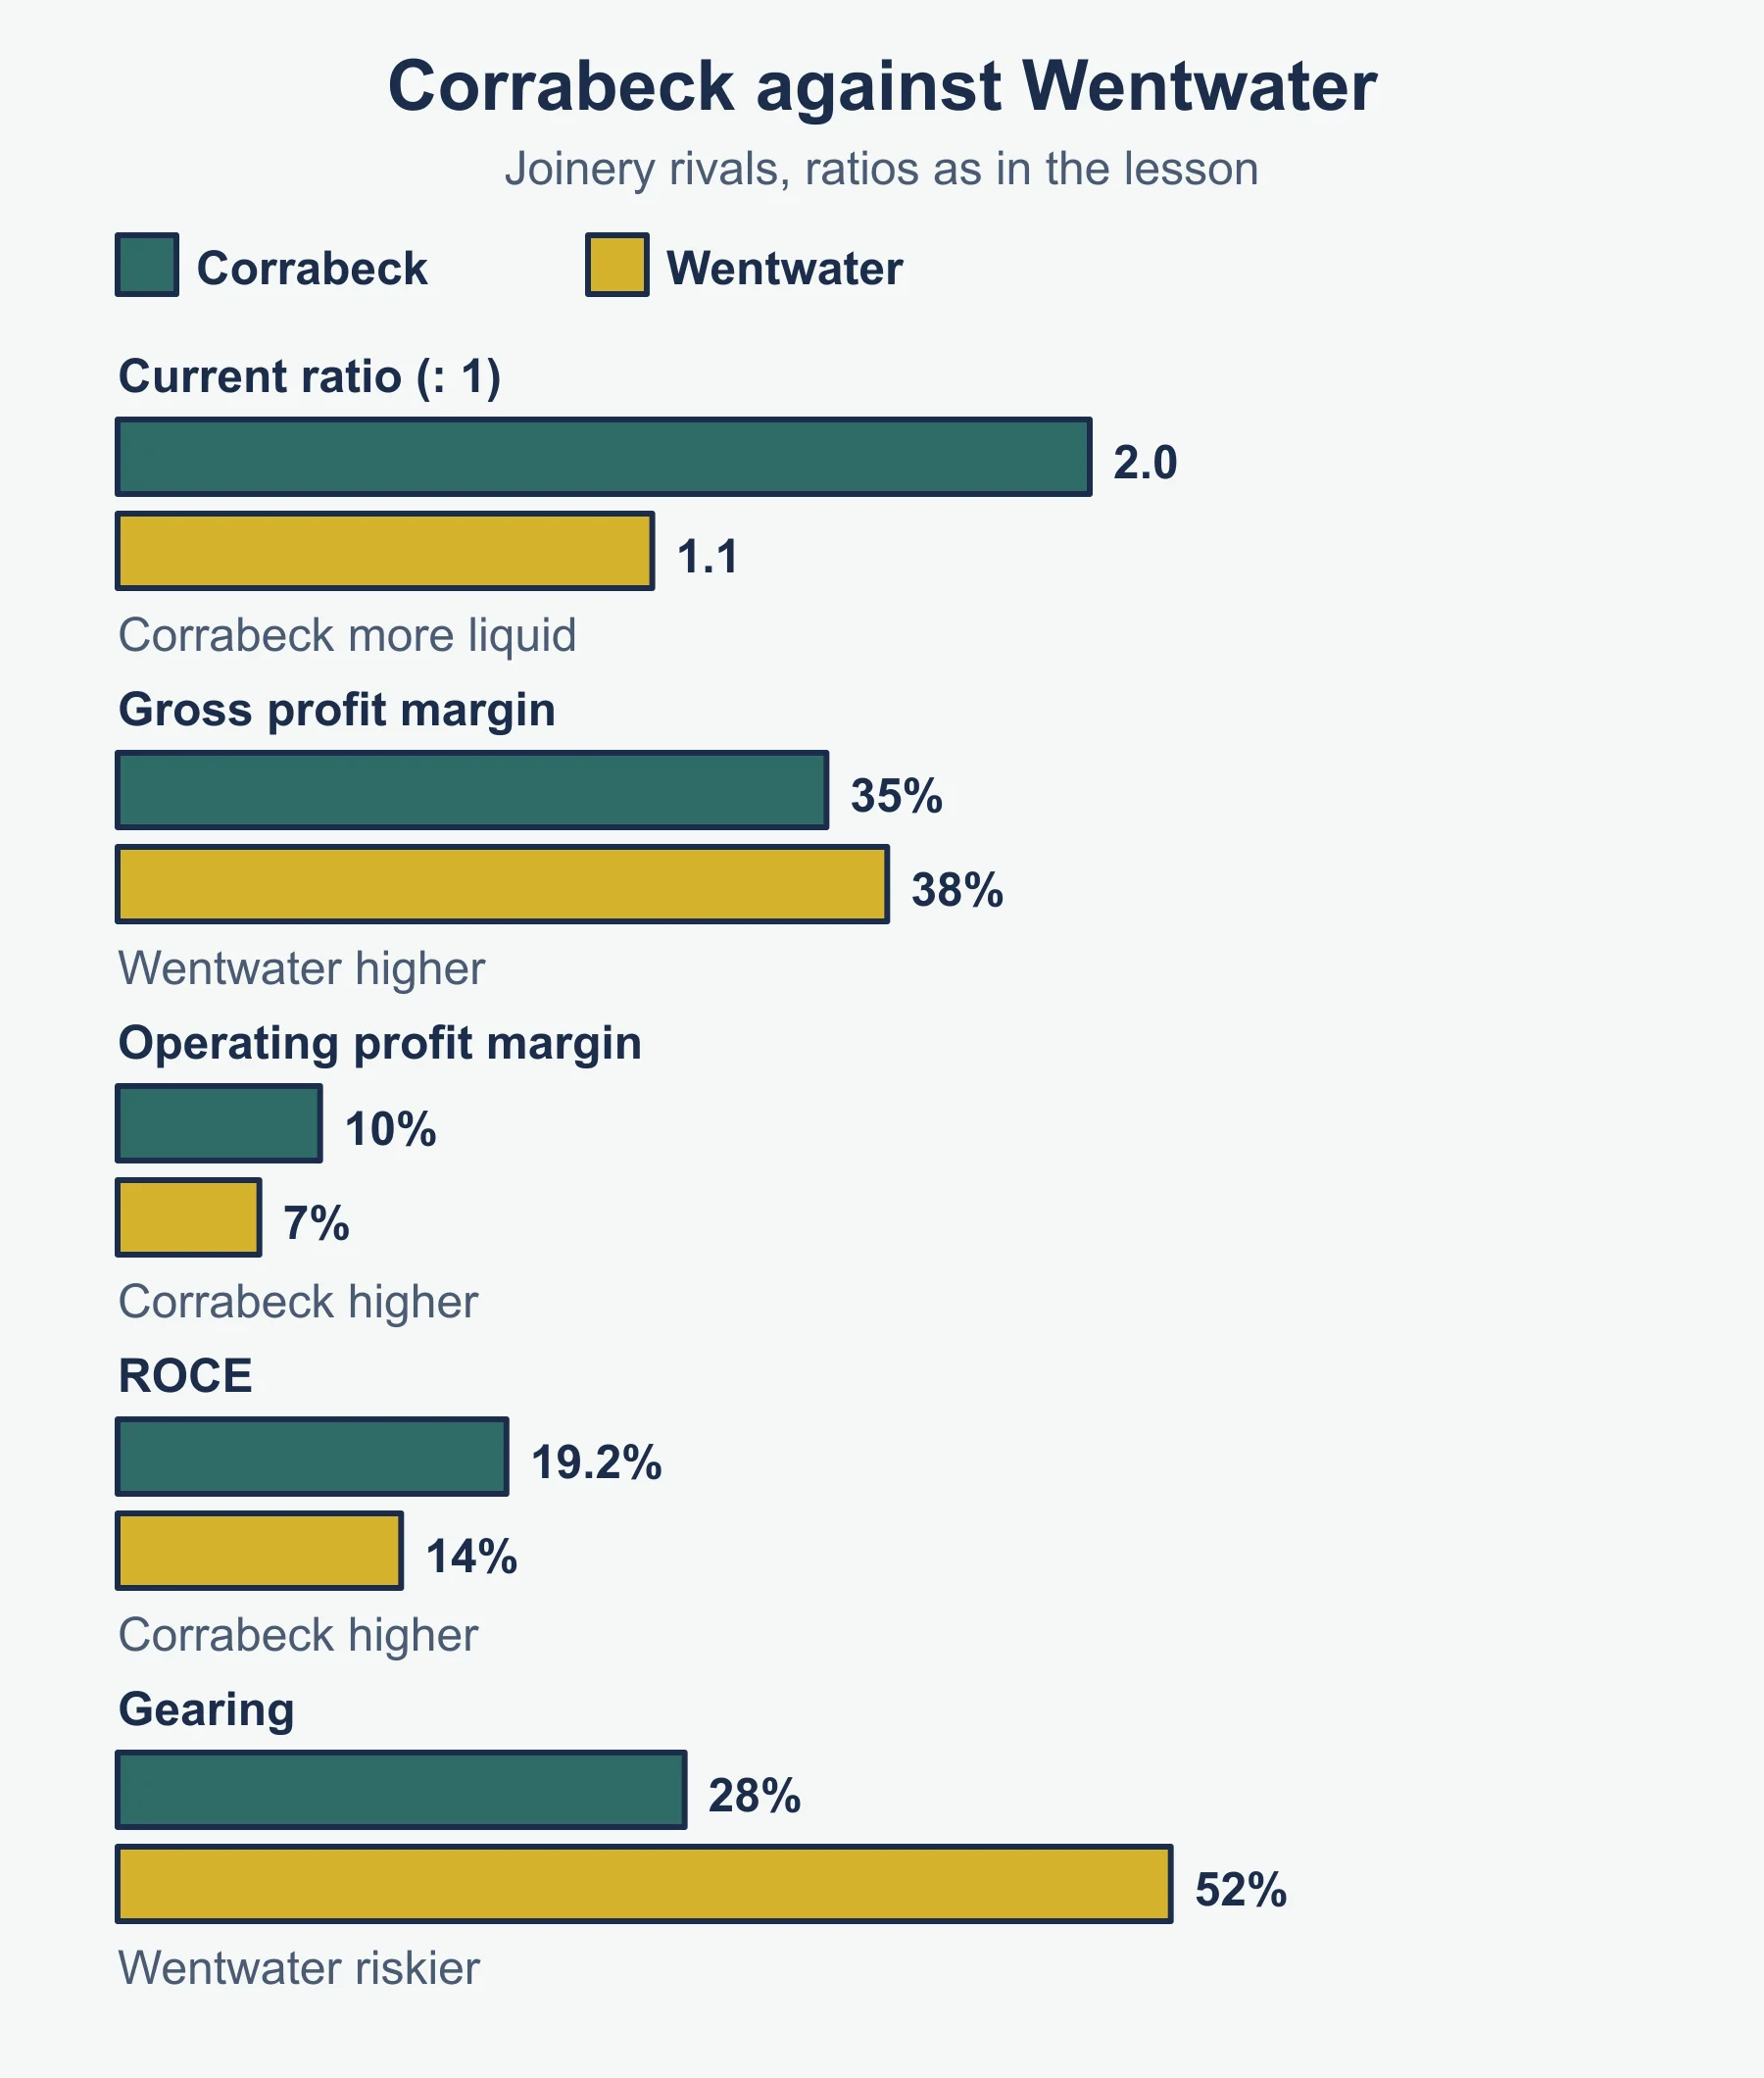
| Ratio | Corrabeck | Wentwater Joinery Ltd |
|---|---|---|
| Current ratio | 2.0 | 1.1 |
| Gross profit margin | 35% | 38% |
| Operating profit margin | 10% | 7% |
| ROCE | 19.2% | 14% |
| Gearing | 28% | 52% |
Corrabeck is more liquid, more profitable overall and less risky. Wentwater earns a better gross margin but loses it in expenses, and its high gearing means higher interest.
Common errors
- Using revenue instead of credit sales or credit purchases in the days ratios.
- Using closing instead of average inventory when the data gives both.
- Leaving out non-current liabilities when finding capital employed.
- Forgetting that dividend cover uses profit for the year, not profit from operations.
- Giving a ratio with no unit or interpretation. Say what the figure means for this business.
- Treating depreciation as cash leaving the business.
Frequently asked questions
How do you calculate capital employed? Capital employed is issued shares plus reserves plus non-current liabilities. Leaving out non-current liabilities is a common error in ROCE and gearing questions.
What does the gearing ratio show? Gearing shows how far a business relies on long-term borrowing: non-current liabilities divided by capital employed, multiplied by 100. High gearing raises interest costs and risk.
How are the statement of profit or loss and statement of financial position linked? Retained earnings are added to reserves, closing inventory is a current asset, trade receivables and payables come from credit sales and purchases, unpaid tax is a current liability, and depreciation lowers non-current assets.
Is one ratio enough to judge a business? No. A single ratio says little on its own. Compare it with previous years, with a competitor or with a target, and look at several ratios together.
Official syllabus
Cambridge International AS & A Level Business 9609 syllabus for examination in 2026, 2027 and 2028, published by Cambridge University Press & Assessment (Cambridge International Education): sections 10.1 and 10.2, with the ratio formulas from the syllabus appendix.
Get free revision emails (optional)
Occasional emails with practice questions, worked explanations and links to free resources for the qualification and subjects you choose. No spam, and you can unsubscribe from any email. The free tools on this site never need an email.
Related resources
-
Practice questions
A Level Business: Financial statements and Analysis of published accounts (Cambridge 9609) – Practice Questions
Original practice questions with worked answers on financial statements and ratio analysis for Cambridge A Level Business 9609 sections 10.1 and 10.2.
Business · Cambridge · A Level
Try questions -
Revision notes
A Level Business: Financial statements and Analysis of published accounts (Cambridge 9609) – Revision Notes
Condensed revision notes on financial statements, depreciation, inventory and ratio analysis for Cambridge A Level Business 9609, with a self-test.
Business · Cambridge · A Level
Revise topic -
Study guides
A Level Business: Forecasting and managing cash flows (Cambridge 9609)
Study guide to 5.3 Forecasting and managing cash flows for Cambridge AS & A Level Business 9609, with worked forecasts and ways to improve cash flow.
Business · Cambridge · AS Level
Read guide
Related articles
-
teaching
A Level tuition in Dubai: Cambridge or Pearson Edexcel International A Level?
Schools in Dubai and Abu Dhabi teach either Cambridge International AS & A Level or Pearson Edexcel International A Level. How the two are structured, why it matters for tuition, and how online classes from Lahore work.
9 October 2026
-
curriculum guides
Choosing subjects at IGCSE and A Level
How subject choices at 14 and 16 affect university options later, and how to keep pathways open without overloading a timetable.
28 July 2026
Studying this with a teacher
Working through Business A LEVEL?
This page is free and stays free. If you would rather be taught it, Marlbridge runs Business classes one-to-one and in small groups of up to 15, online in your own time zone. The first trial class is free. WhatsApp replies within an hour (8am–11pm Pakistan time, every day); email the same day.
Cambridge Business teachers at Marlbridge

