
Revision Notes
Edexcel International A Level Business: Marketing mix and strategy (YBS11) – Revision Notes
Condensed recall notes, formulas and a self-test on objectives, the Boston Matrix, pricing and distribution for Edexcel International A Level Business.
- Subject
- Business
- Level
- AS LEVEL
- Topic
- Marketing and people
- Author
- Marlbridge Academic Team
- Updated
- Reviewed by
- Salman Ahmad (what this means)
Aligned to Pearson Edexcel A Level Business (YBS11), Issue 1, September 2017. Official specification .
Syllabus page (what it covers and how it is assessed): Pearson Edexcel A Level Business.
Syllabus points this page covers
YBS11 (AS Level)
- 1.3.3 Marketing mix and strategy
Found an error? Report a correction.
Need help with this topic? Request a free trial class for A Level Business (YBS11).
These are condensed notes for section 1.3.3, Marketing mix and strategy, in Unit 1 (Marketing and people) of the Pearson Edexcel International Advanced Subsidiary/Advanced Level in Business specification, Issue 1, September 2017. Full explanations and worked examples are in the study guide. Test yourself with the practice set, the free diagnostics and the Unit 1 revision notes. The course hub is at /boards/edexcel/a-level/business/ and the printable checklist at /checklists/edexcel/a-level/business/.
1 Marketing objectives and strategy
Marketing objectives (specification list): increase market share, increase revenue, build a brand.
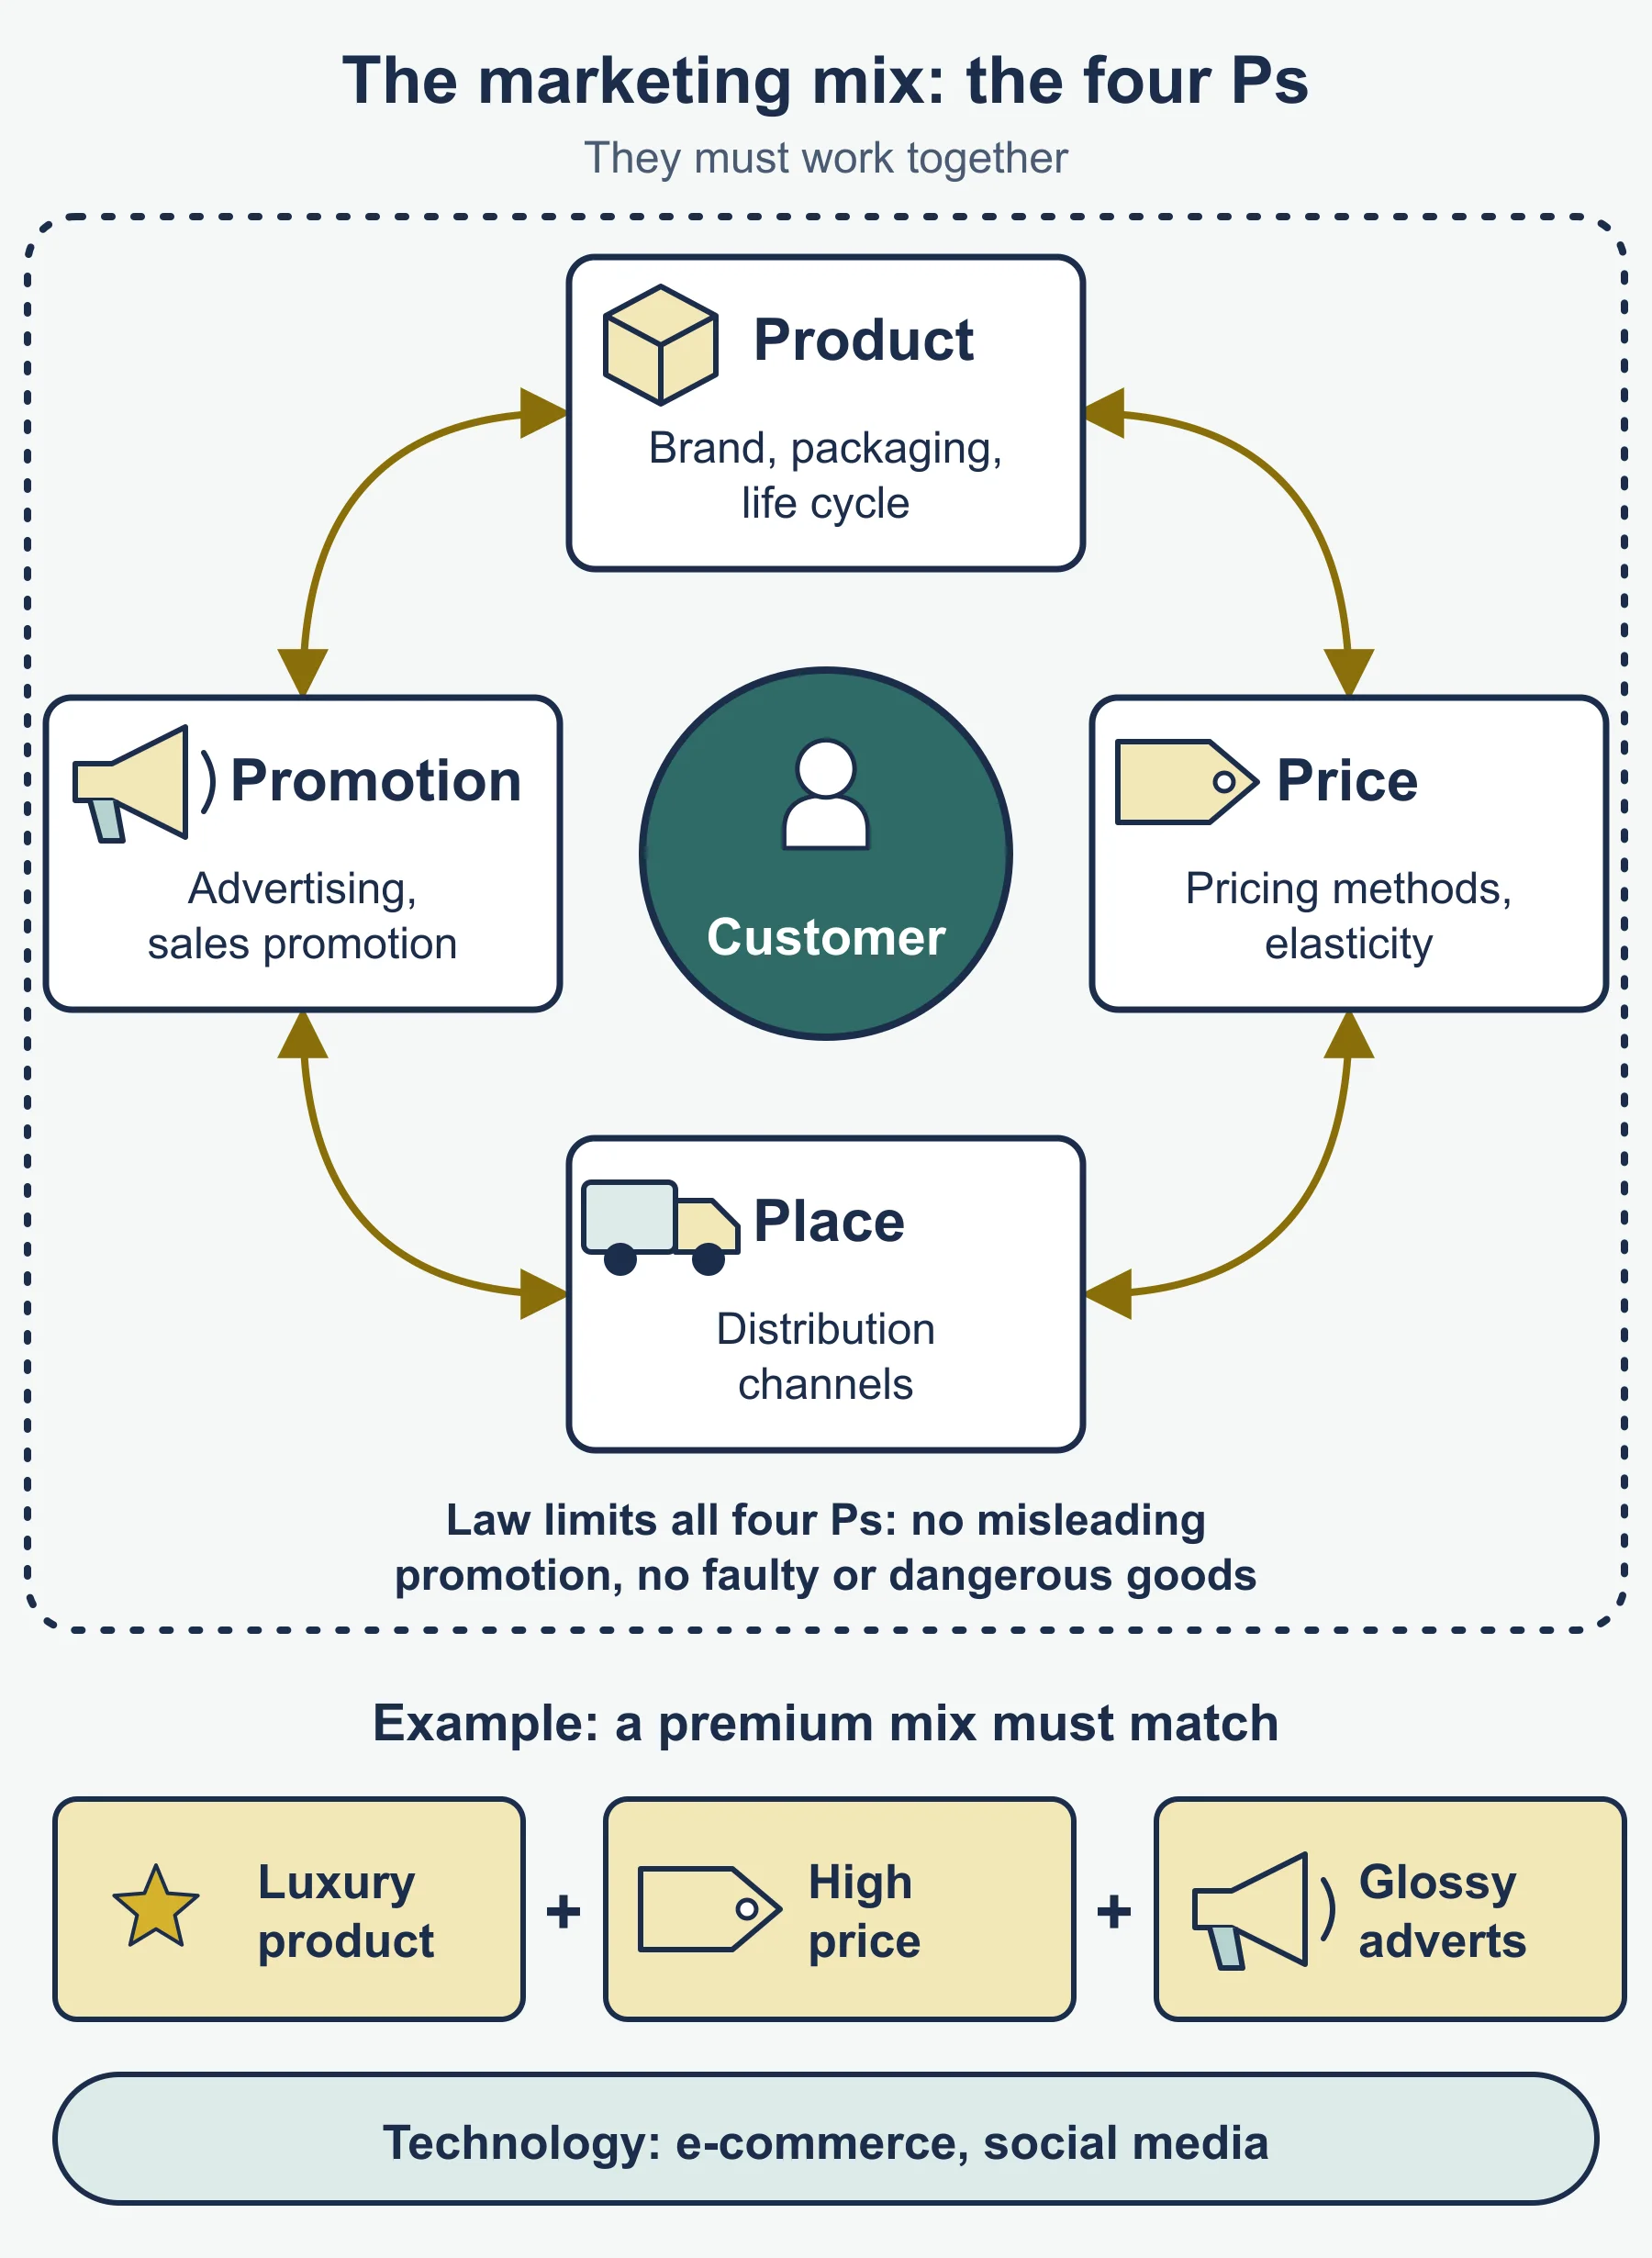
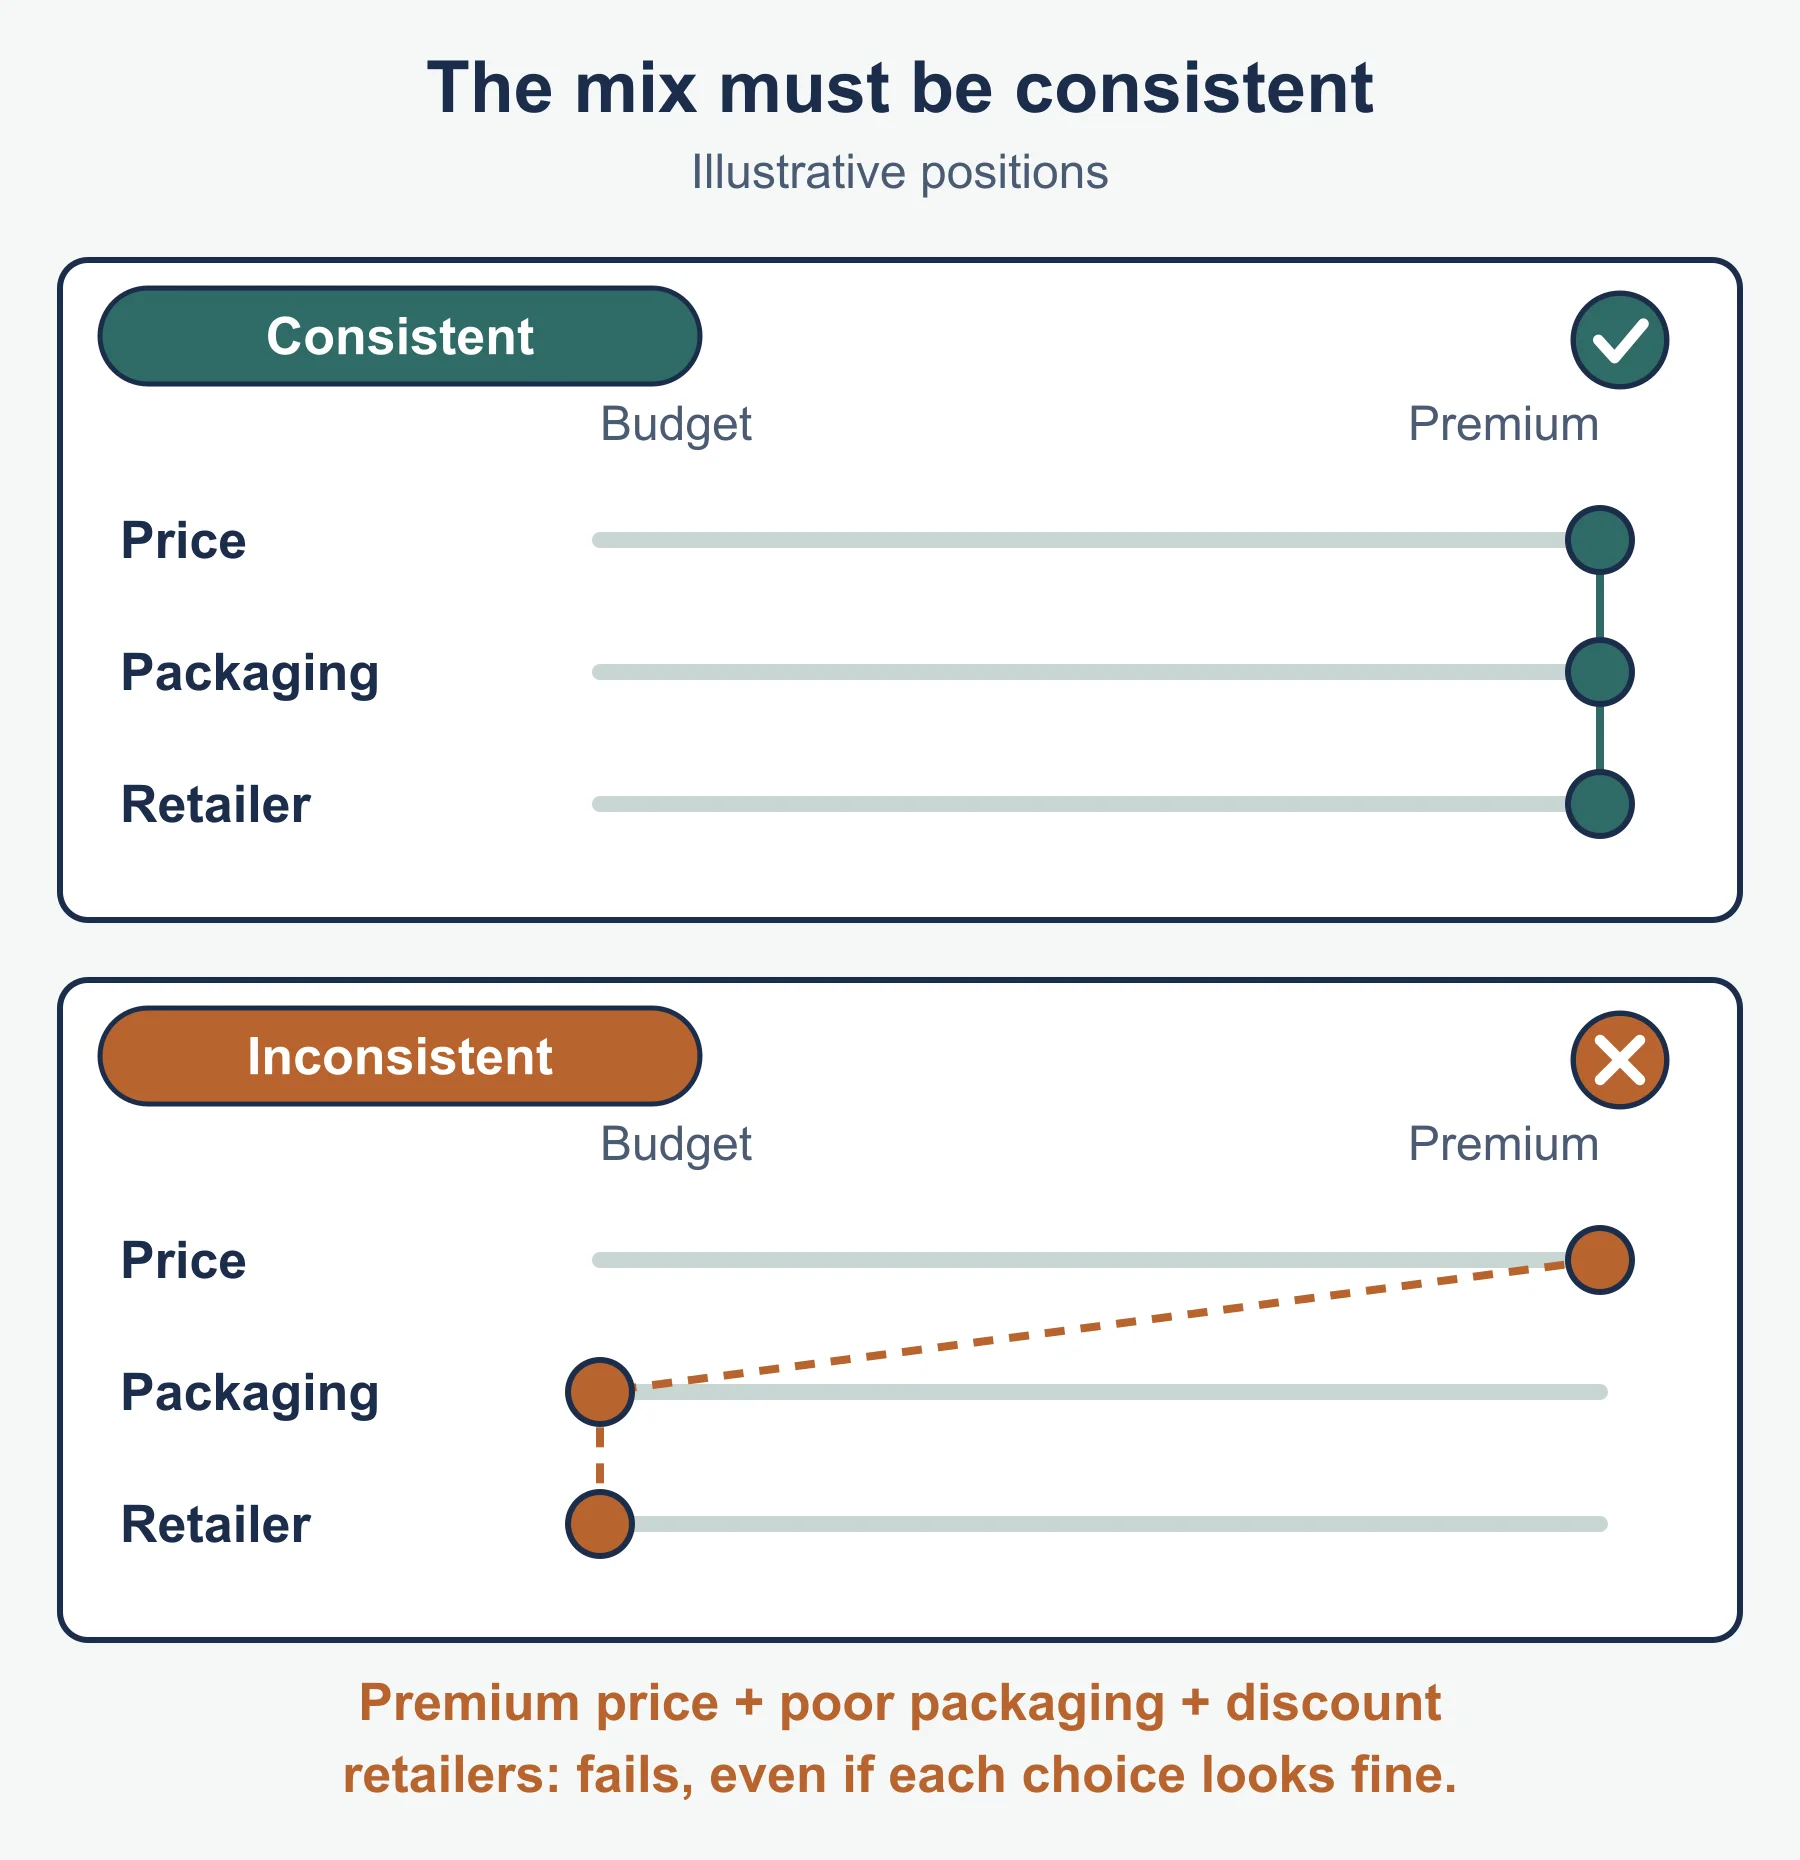
Marketing mix: the combination of marketing decisions used to meet the objectives. Standard four Ps: product, promotion, price, place. The mix must be consistent and tied to the objective.
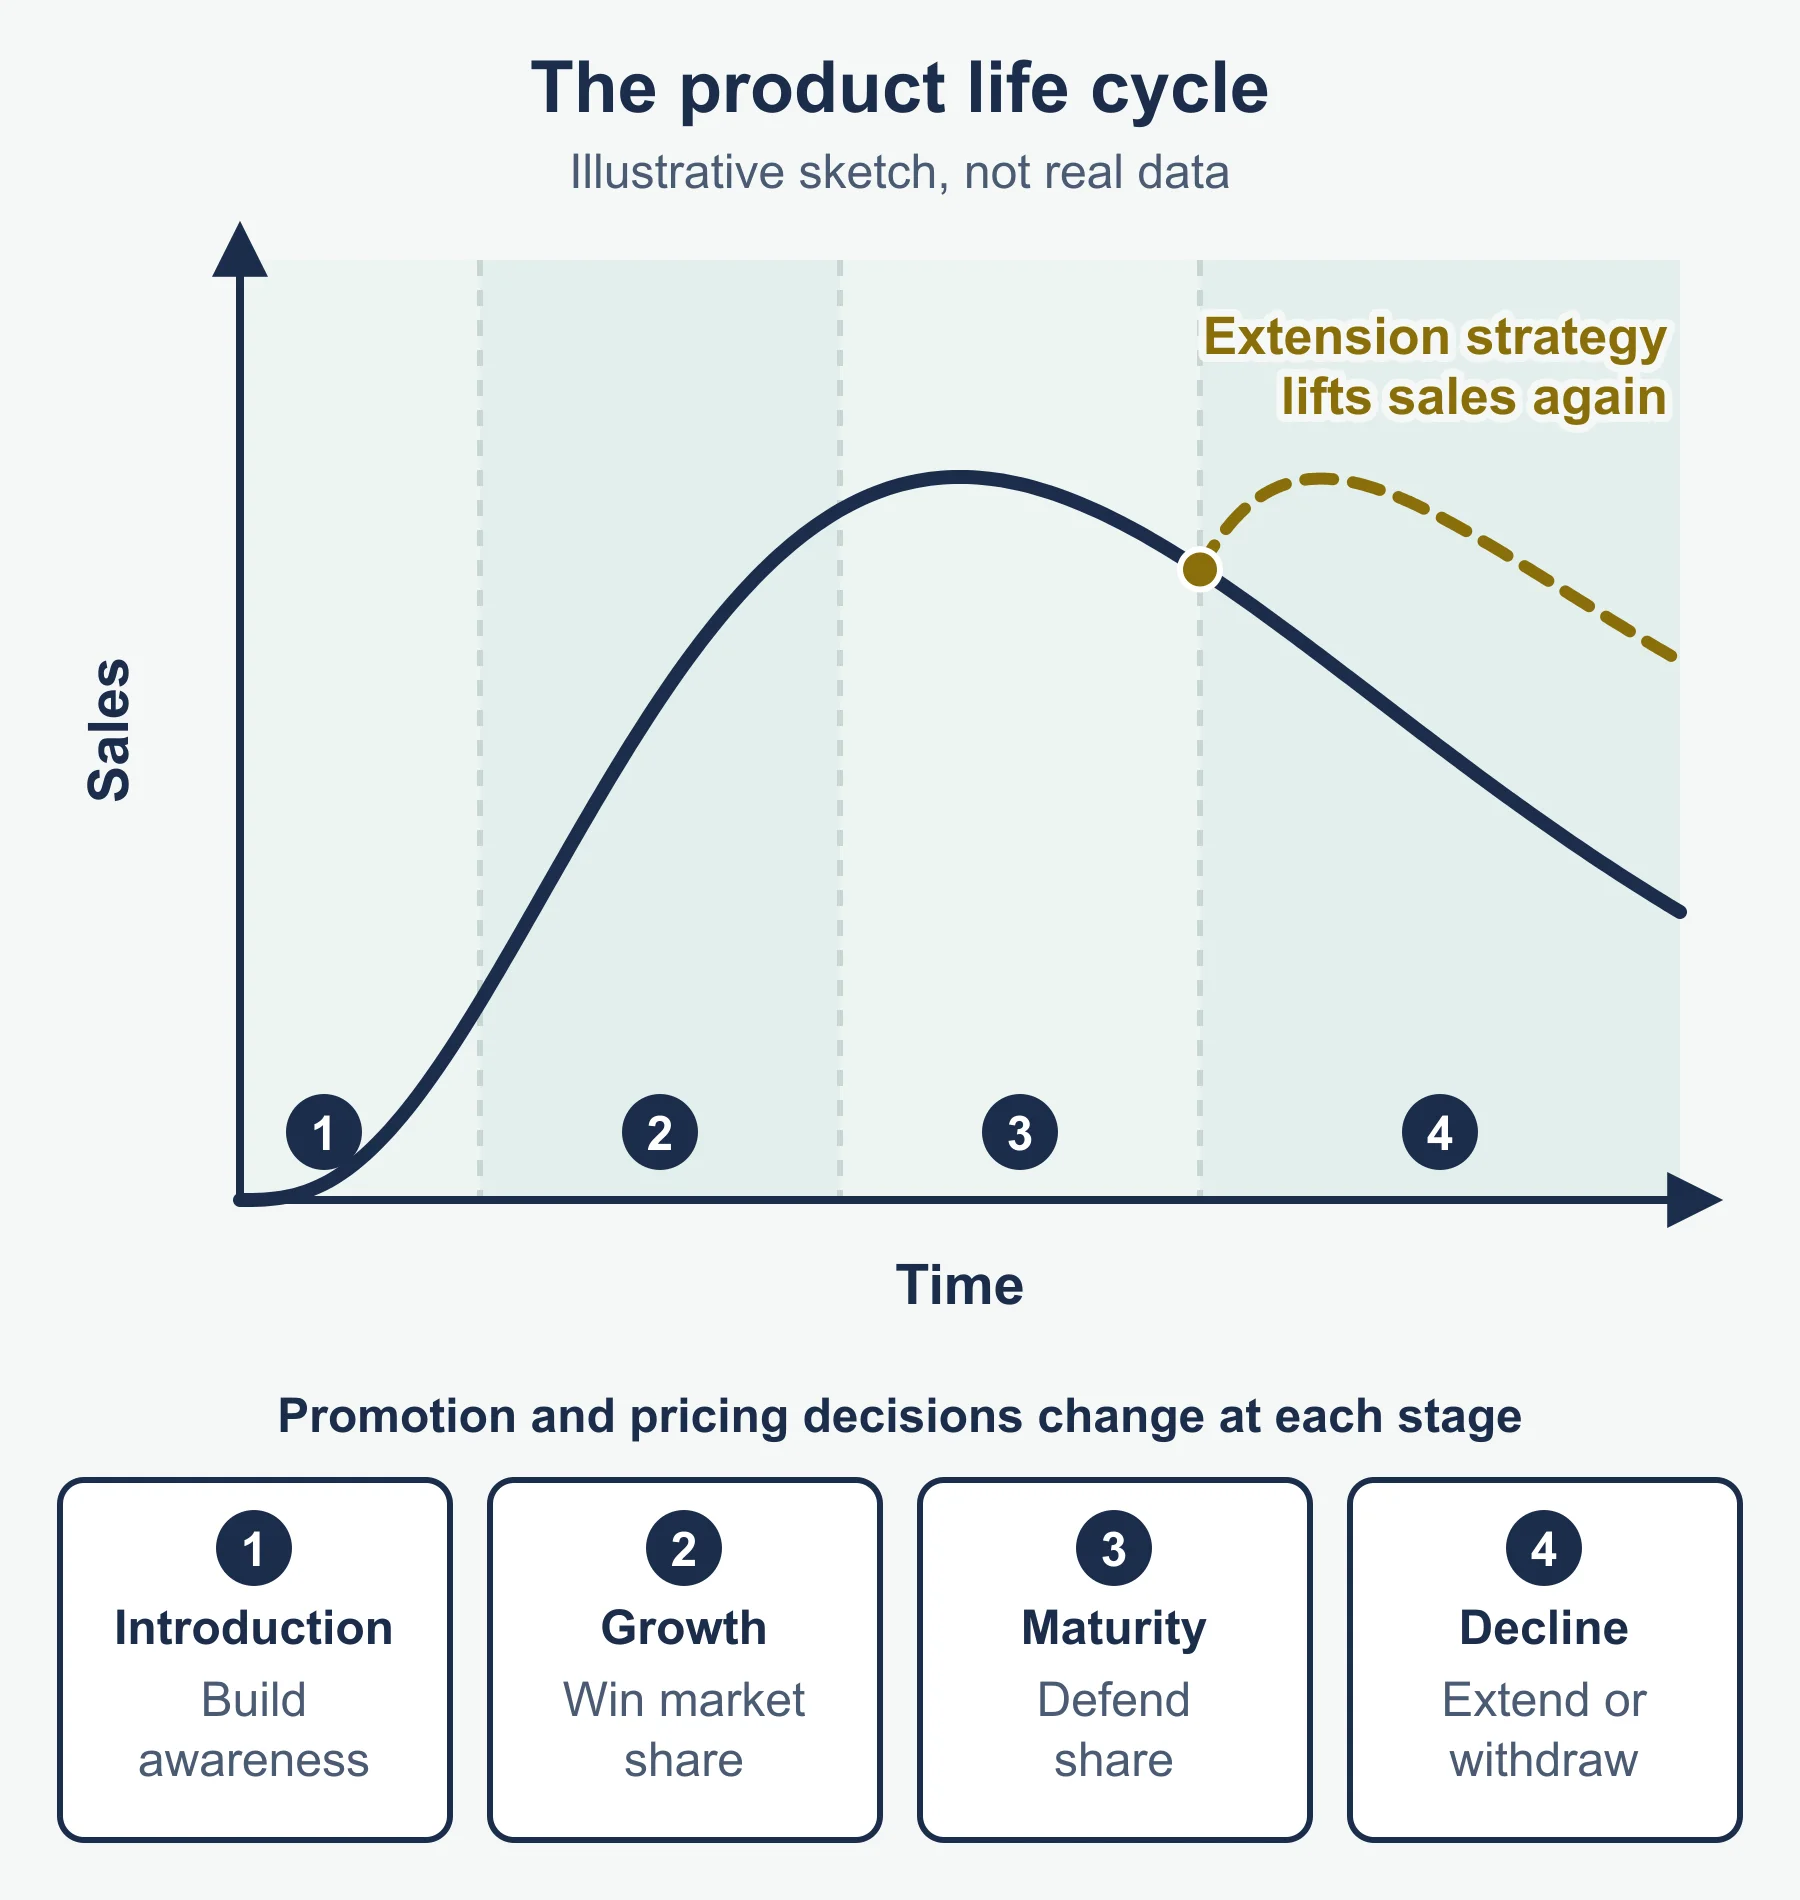
Product life cycle (standard stages): development, introduction, growth, maturity, decline.
| Stage | Sales | Typical response |
|---|---|---|
| Development | None, costs only | Research and testing |
| Introduction | Low, slow rise | Awareness-building, often high or low launch price |
| Growth | Rising fast | Widen distribution, build brand |
| Maturity | Flat | Competitive pricing, extension strategies |
| Decline | Falling | Harvest, replace or withdraw |
Extension strategies: new packaging, new market, new use, new promotion, price change, new variant. Judge them by whether they fix the cause of the stalled sales.
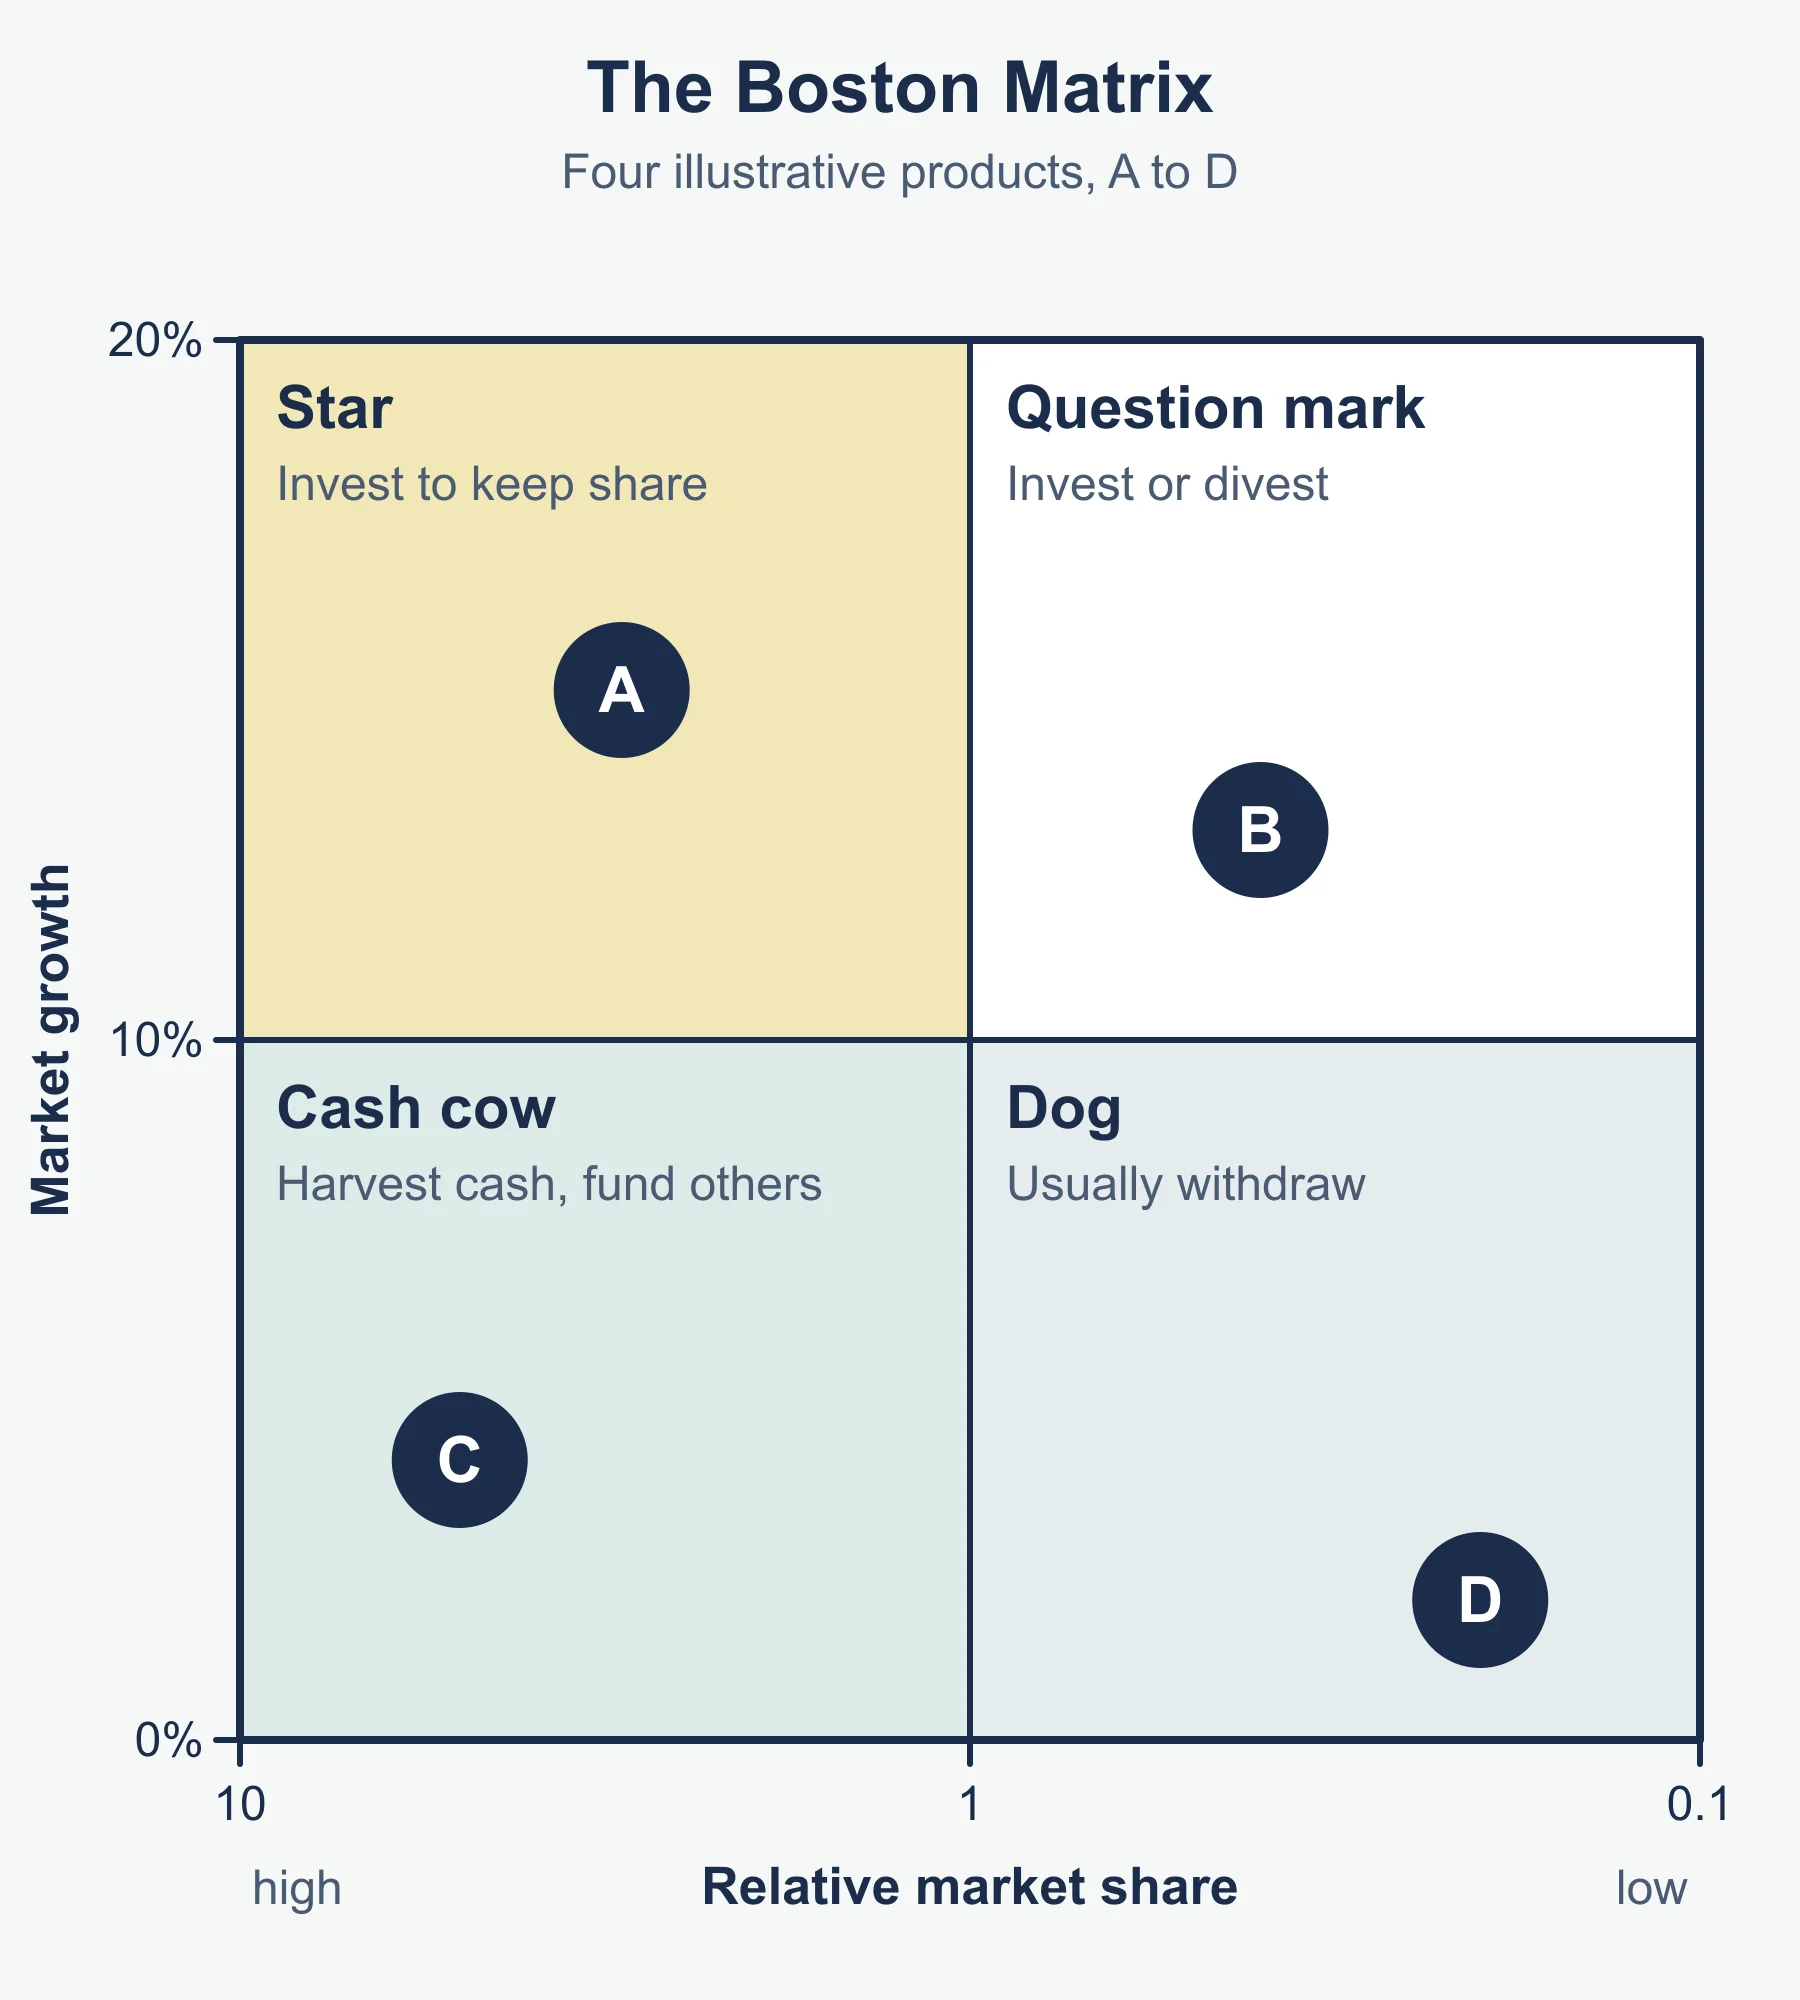
Boston Matrix: method in steps
- Find market growth for each product.
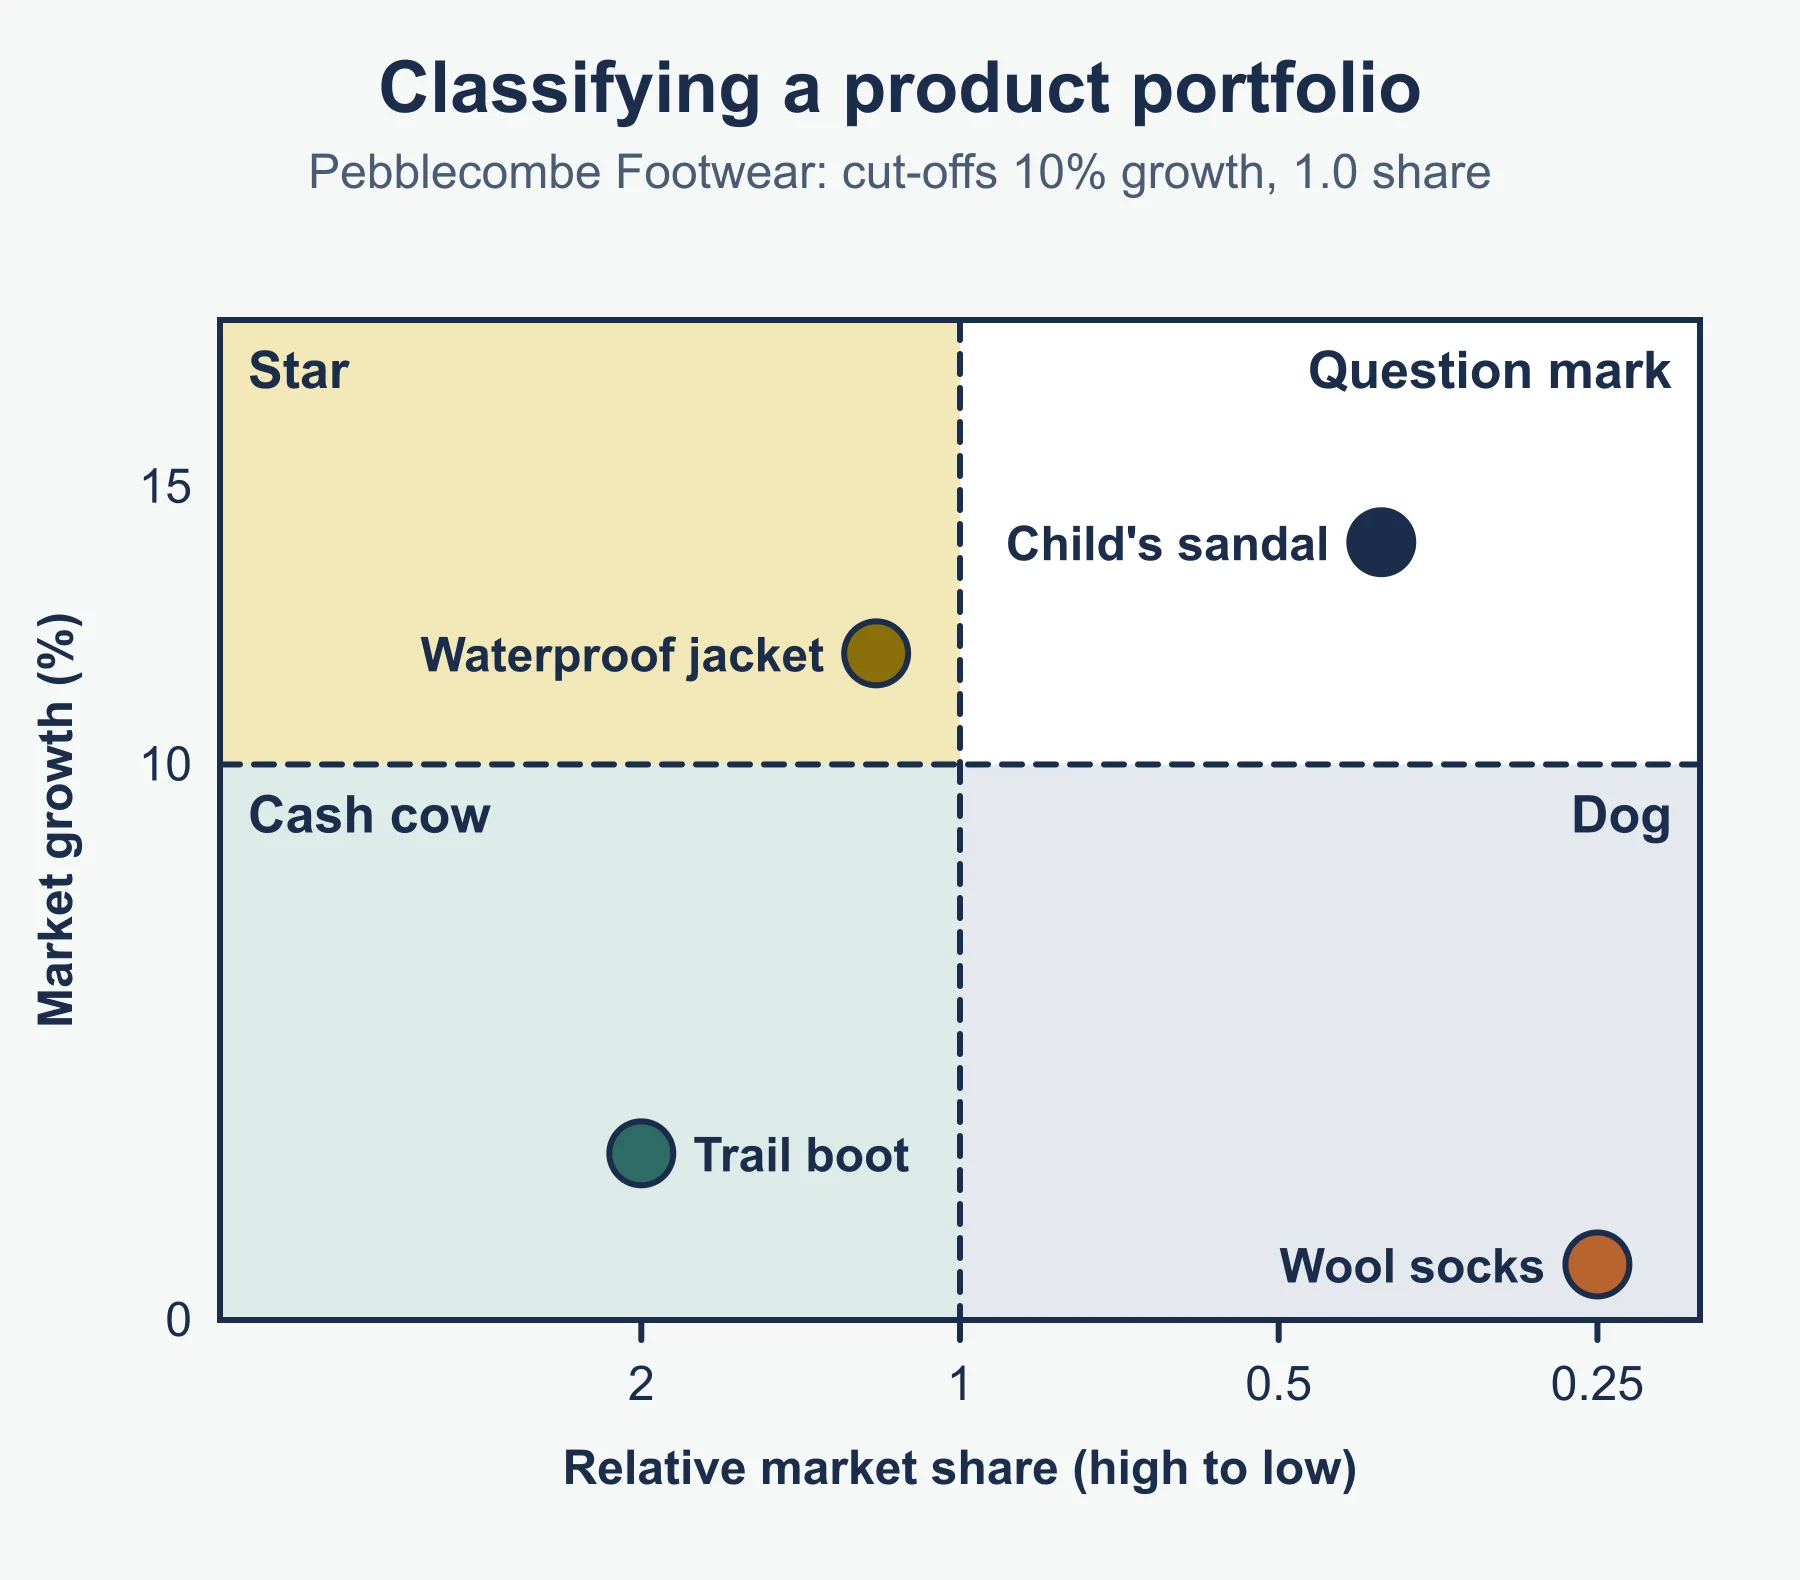
- Calculate relative market share (standard form): product’s share ÷ largest rival’s share.
- Compare with the cut-offs given (growth line, and 1.0 for share).
- Classify: star, cash cow, question mark or dog.
- Make the portfolio decision: use cash cows to fund stars and question marks, and decide whether to invest in, harvest or drop the rest.
| Relative share above 1 | Relative share below 1 | |
|---|---|---|
| High growth | Star | Question mark |
| Low growth | Cash cow | Dog |
Market types
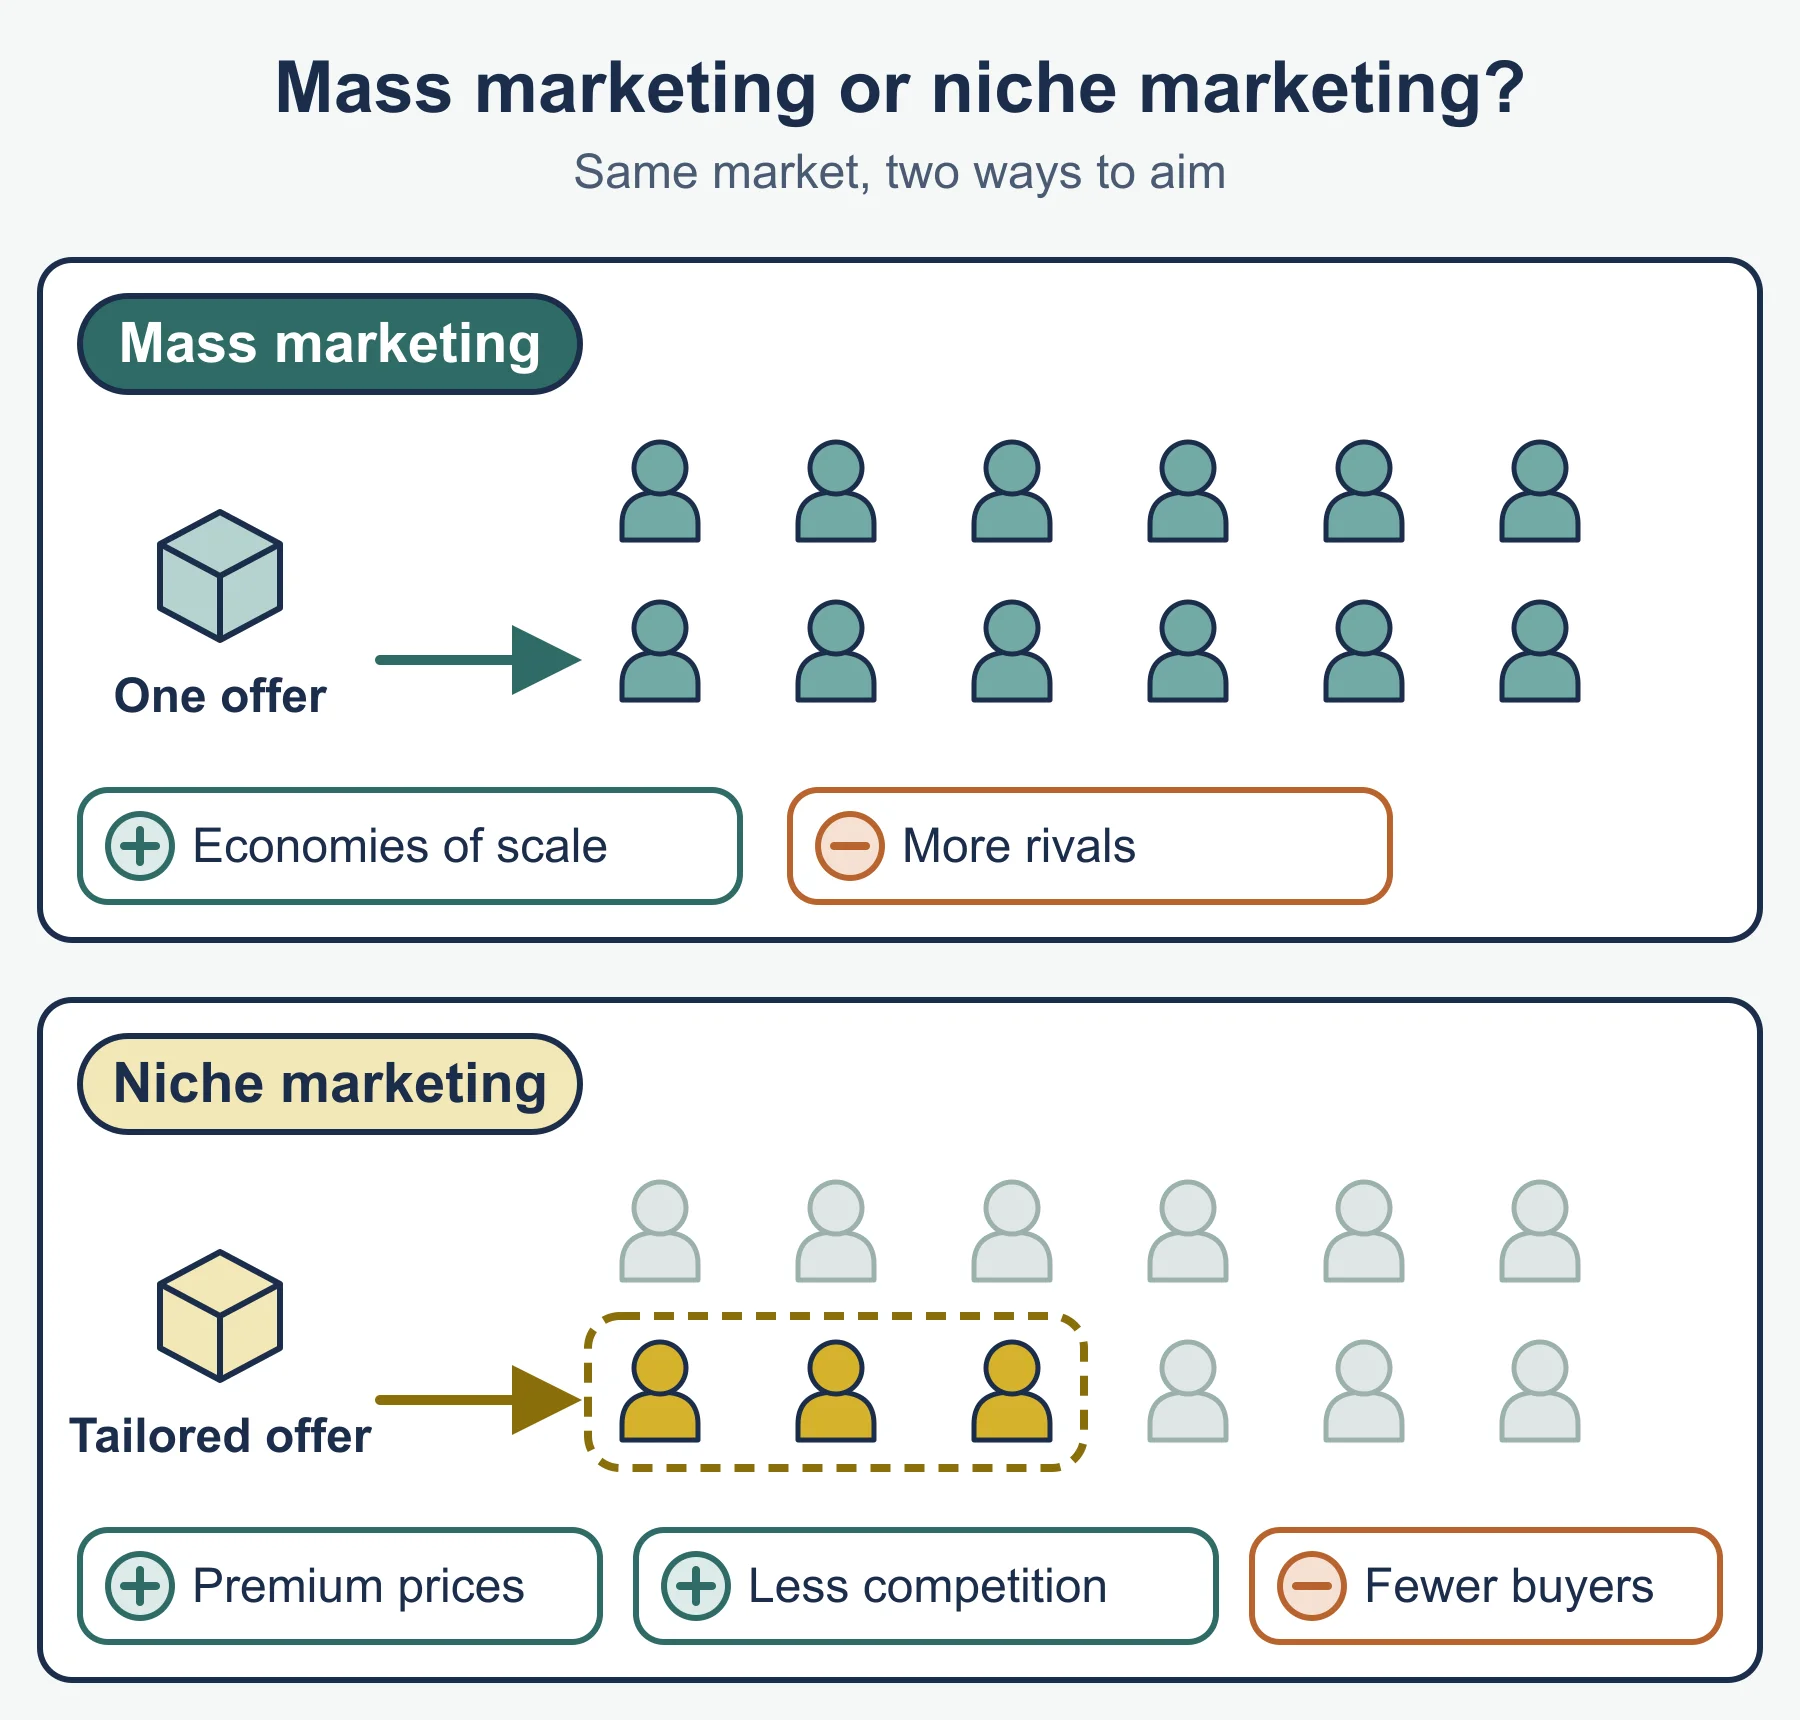
| Market | Key features | Typical strategy |
|---|---|---|
| Mass | Many customers, standard product | Scale, low costs, wide distribution, broad media |
| Niche | Small specific segment | Specialist product, higher price, targeted promotion |
| B2B | Few buyers, large orders, several decision-makers | Personal selling, relationships, technical detail |
| B2C | Many individual buyers | Brand, social media, retail presence, emotion |
Customer loyalty: built through quality, after-sales service, loyalty schemes, personalisation, a trusted brand and ease of purchase. Benefits: repeat sales, lower cost of winning sales, support for premium prices.
2 Product/service design
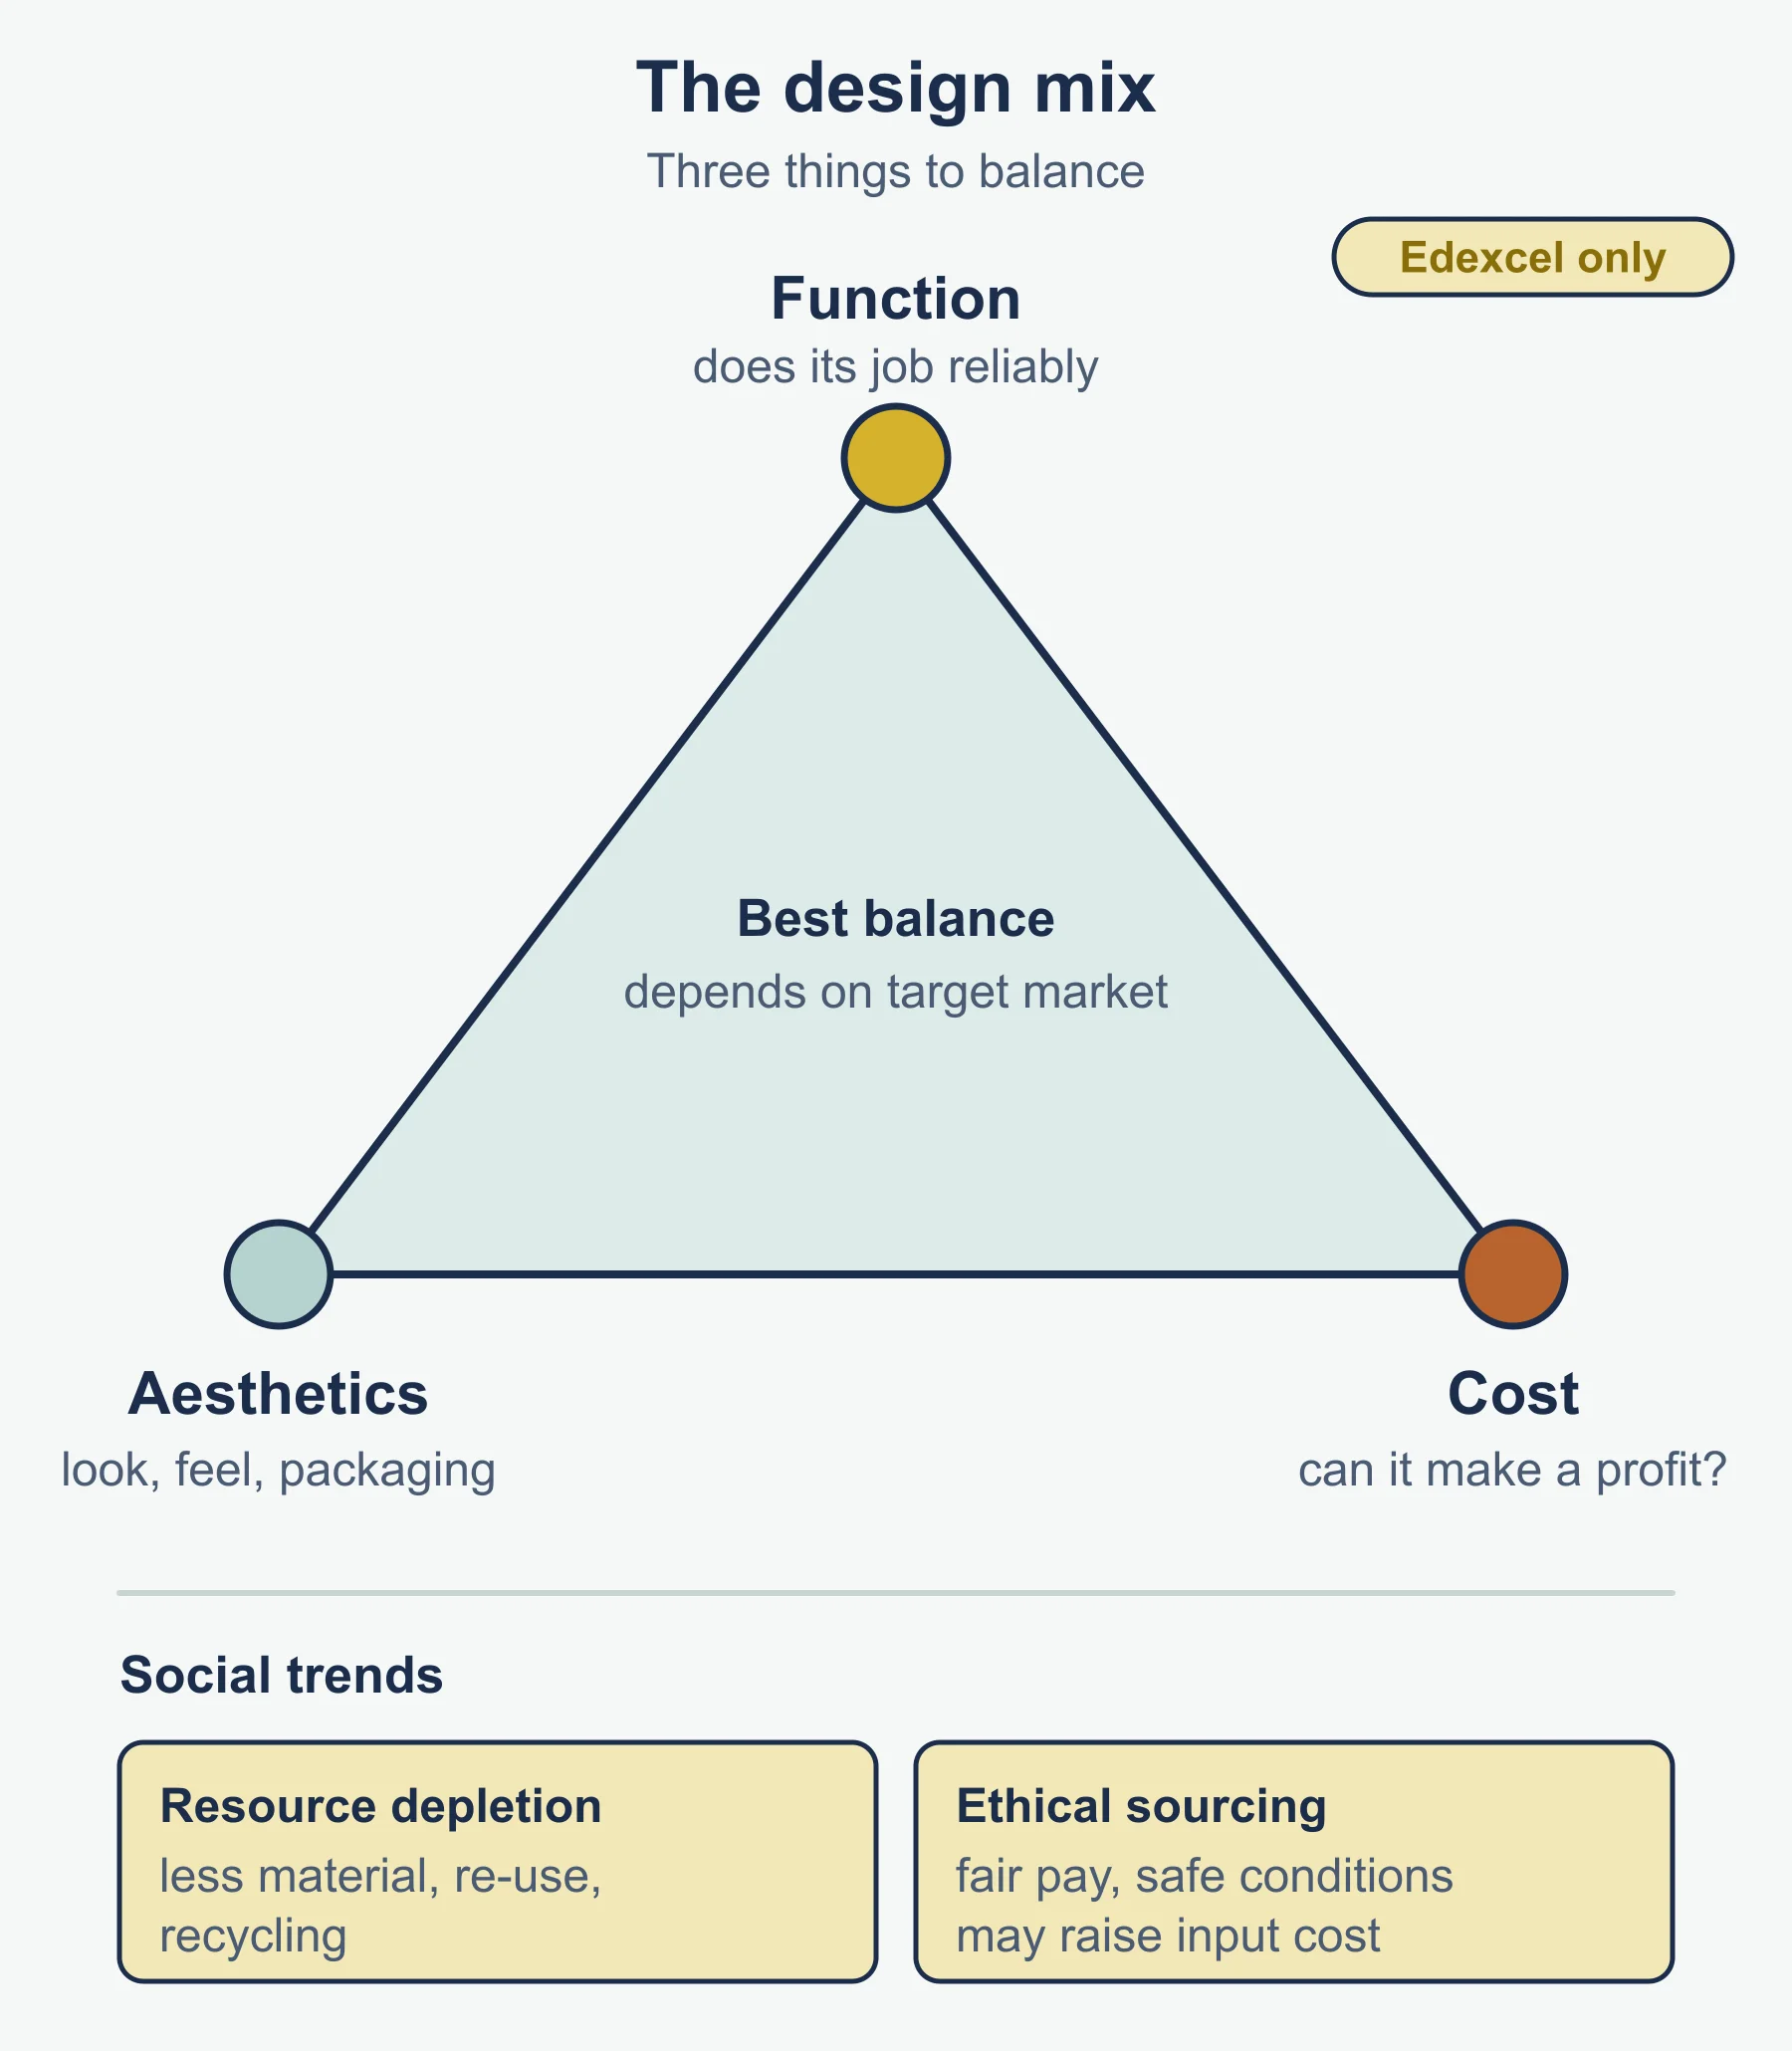
Design mix: function, aesthetics, cost/economic manufacture.
- Function: does the job reliably.
- Aesthetics: appearance, feel, packaging.
- Cost/economic manufacture: can be made at a cost that allows a profit at an acceptable price.
Social trends
| Trend | Design response | Likely effect |
|---|---|---|
| Concern over resource depletion | Waste minimisation, re-use, recycling | Redesign cost; less material later; appeals to green buyers |
| Ethical sourcing | Fair-trade or audited suppliers | Higher input cost; stronger brand |
3 Promotion and branding
Types of promotion (standard forms): advertising, sales promotion, personal selling, public relations, sponsorship, direct and digital marketing.
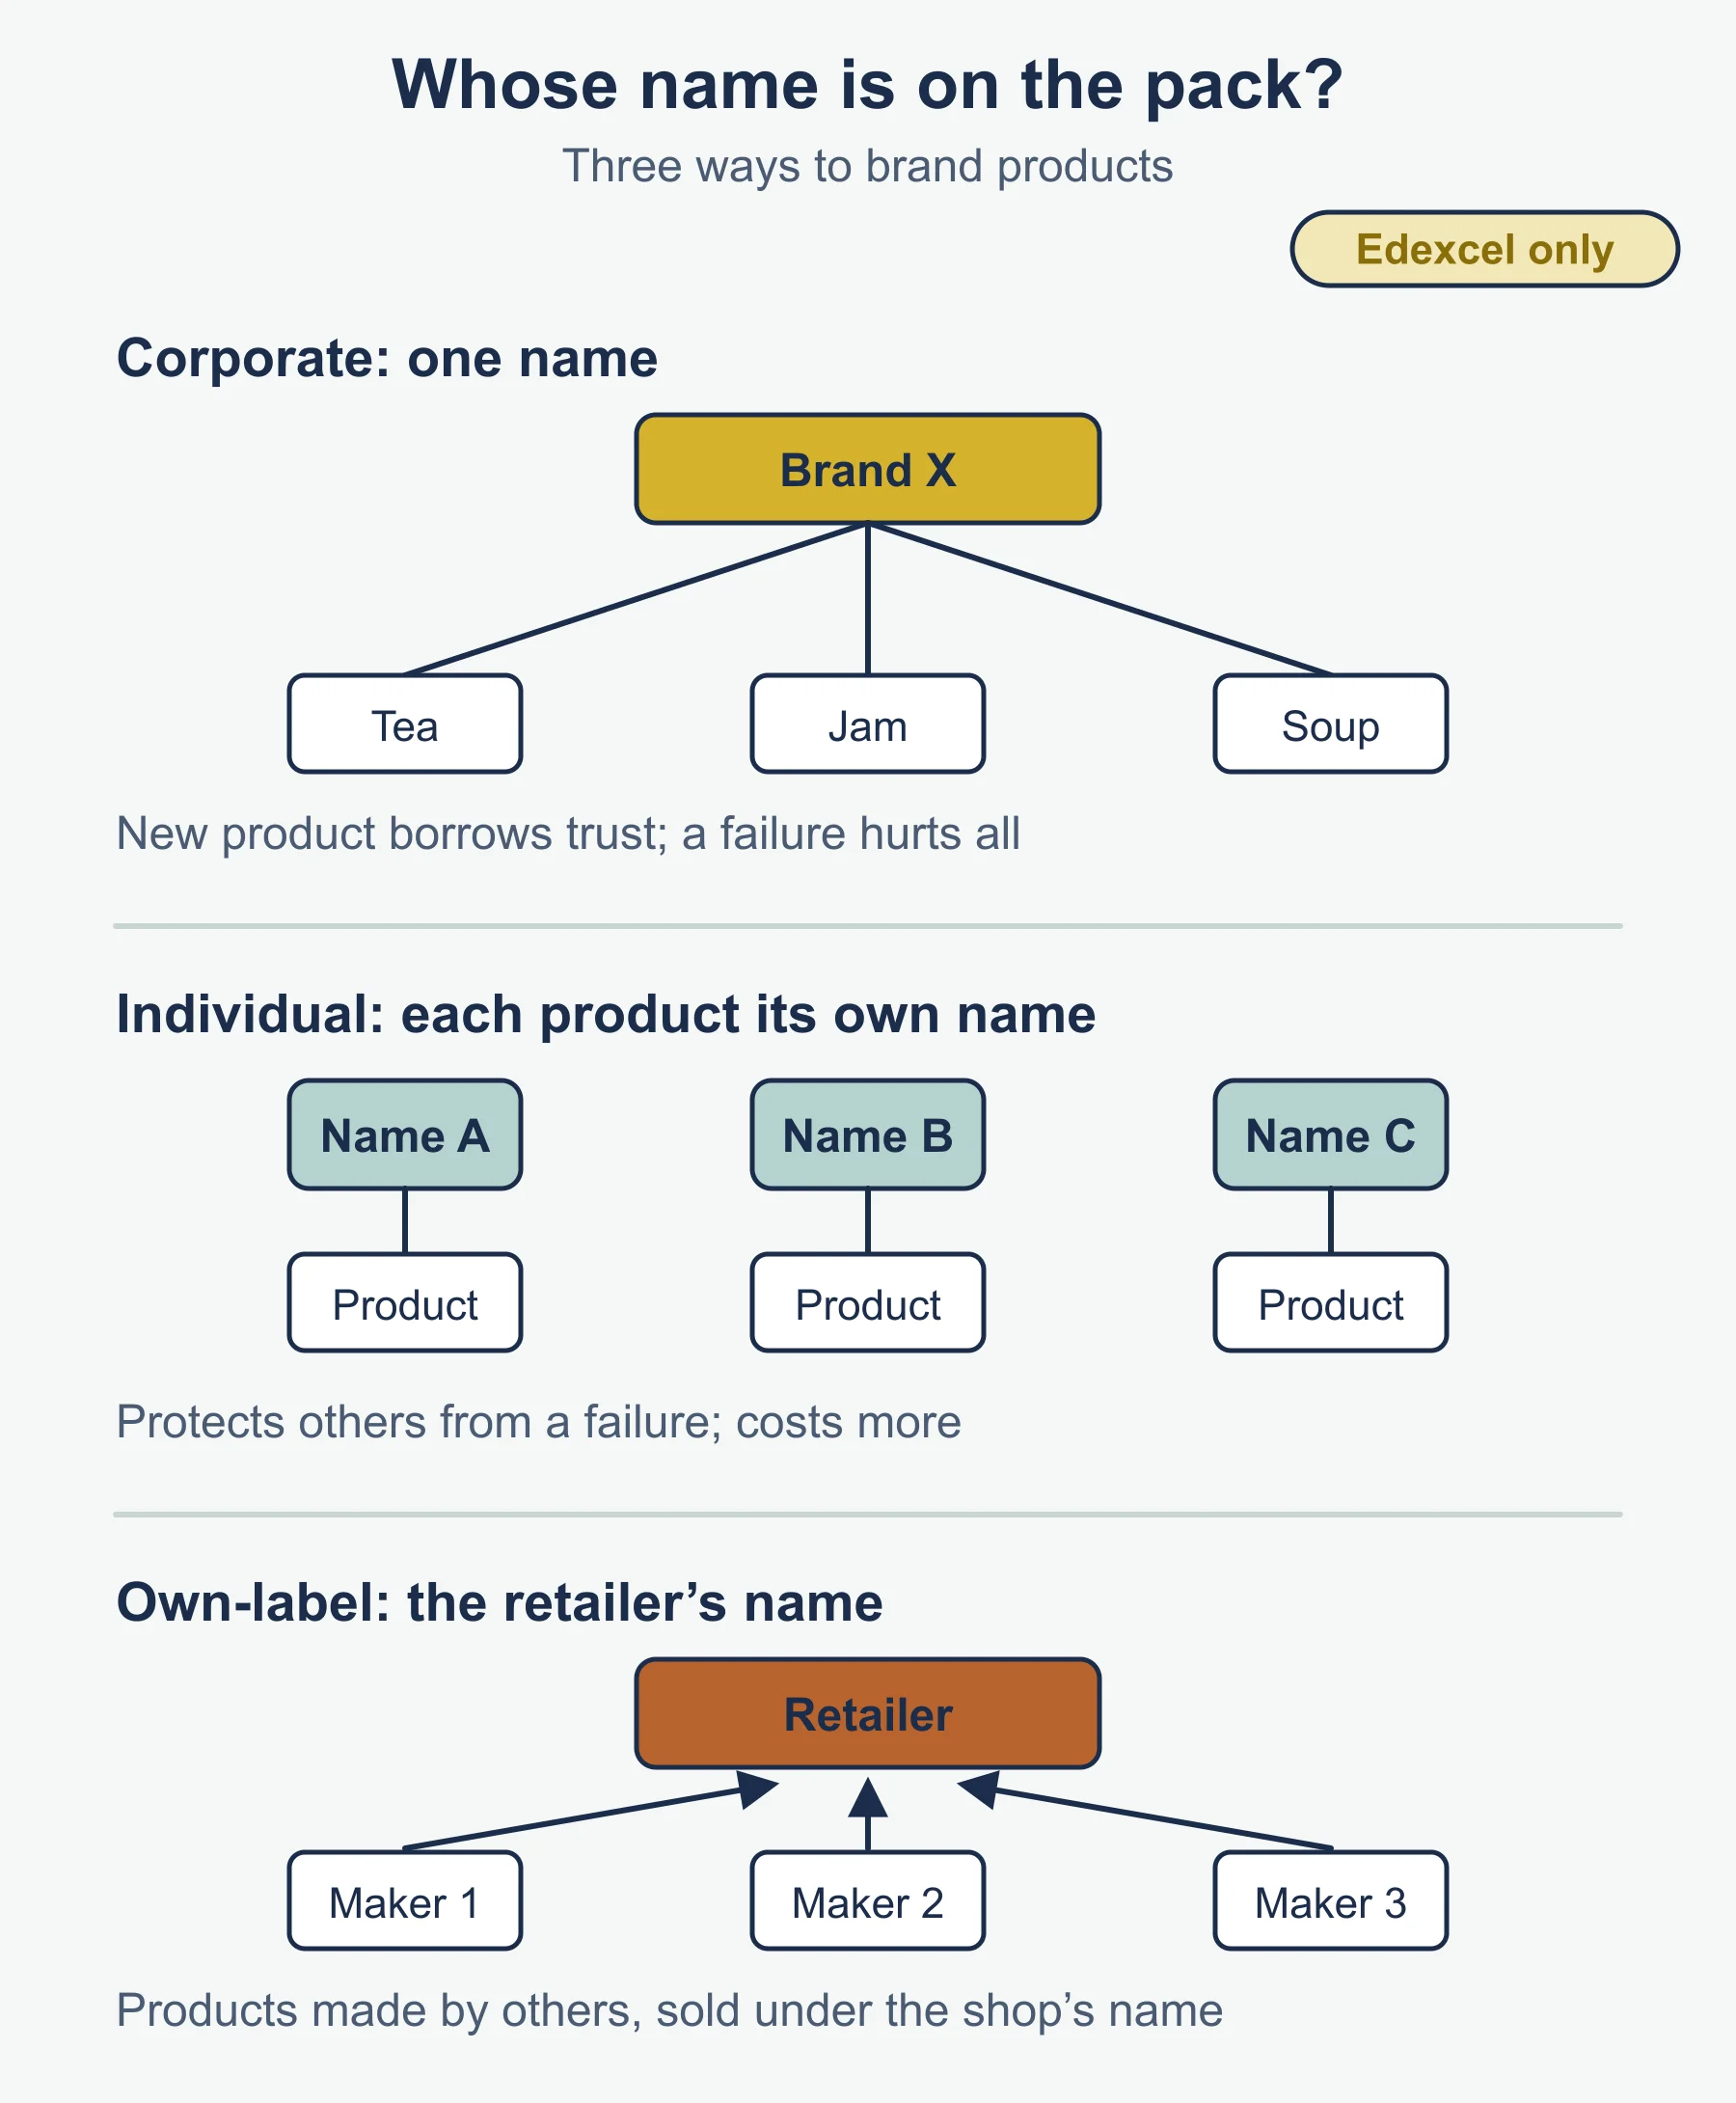
Types of branding (standard forms): corporate (family), individual, own-label.
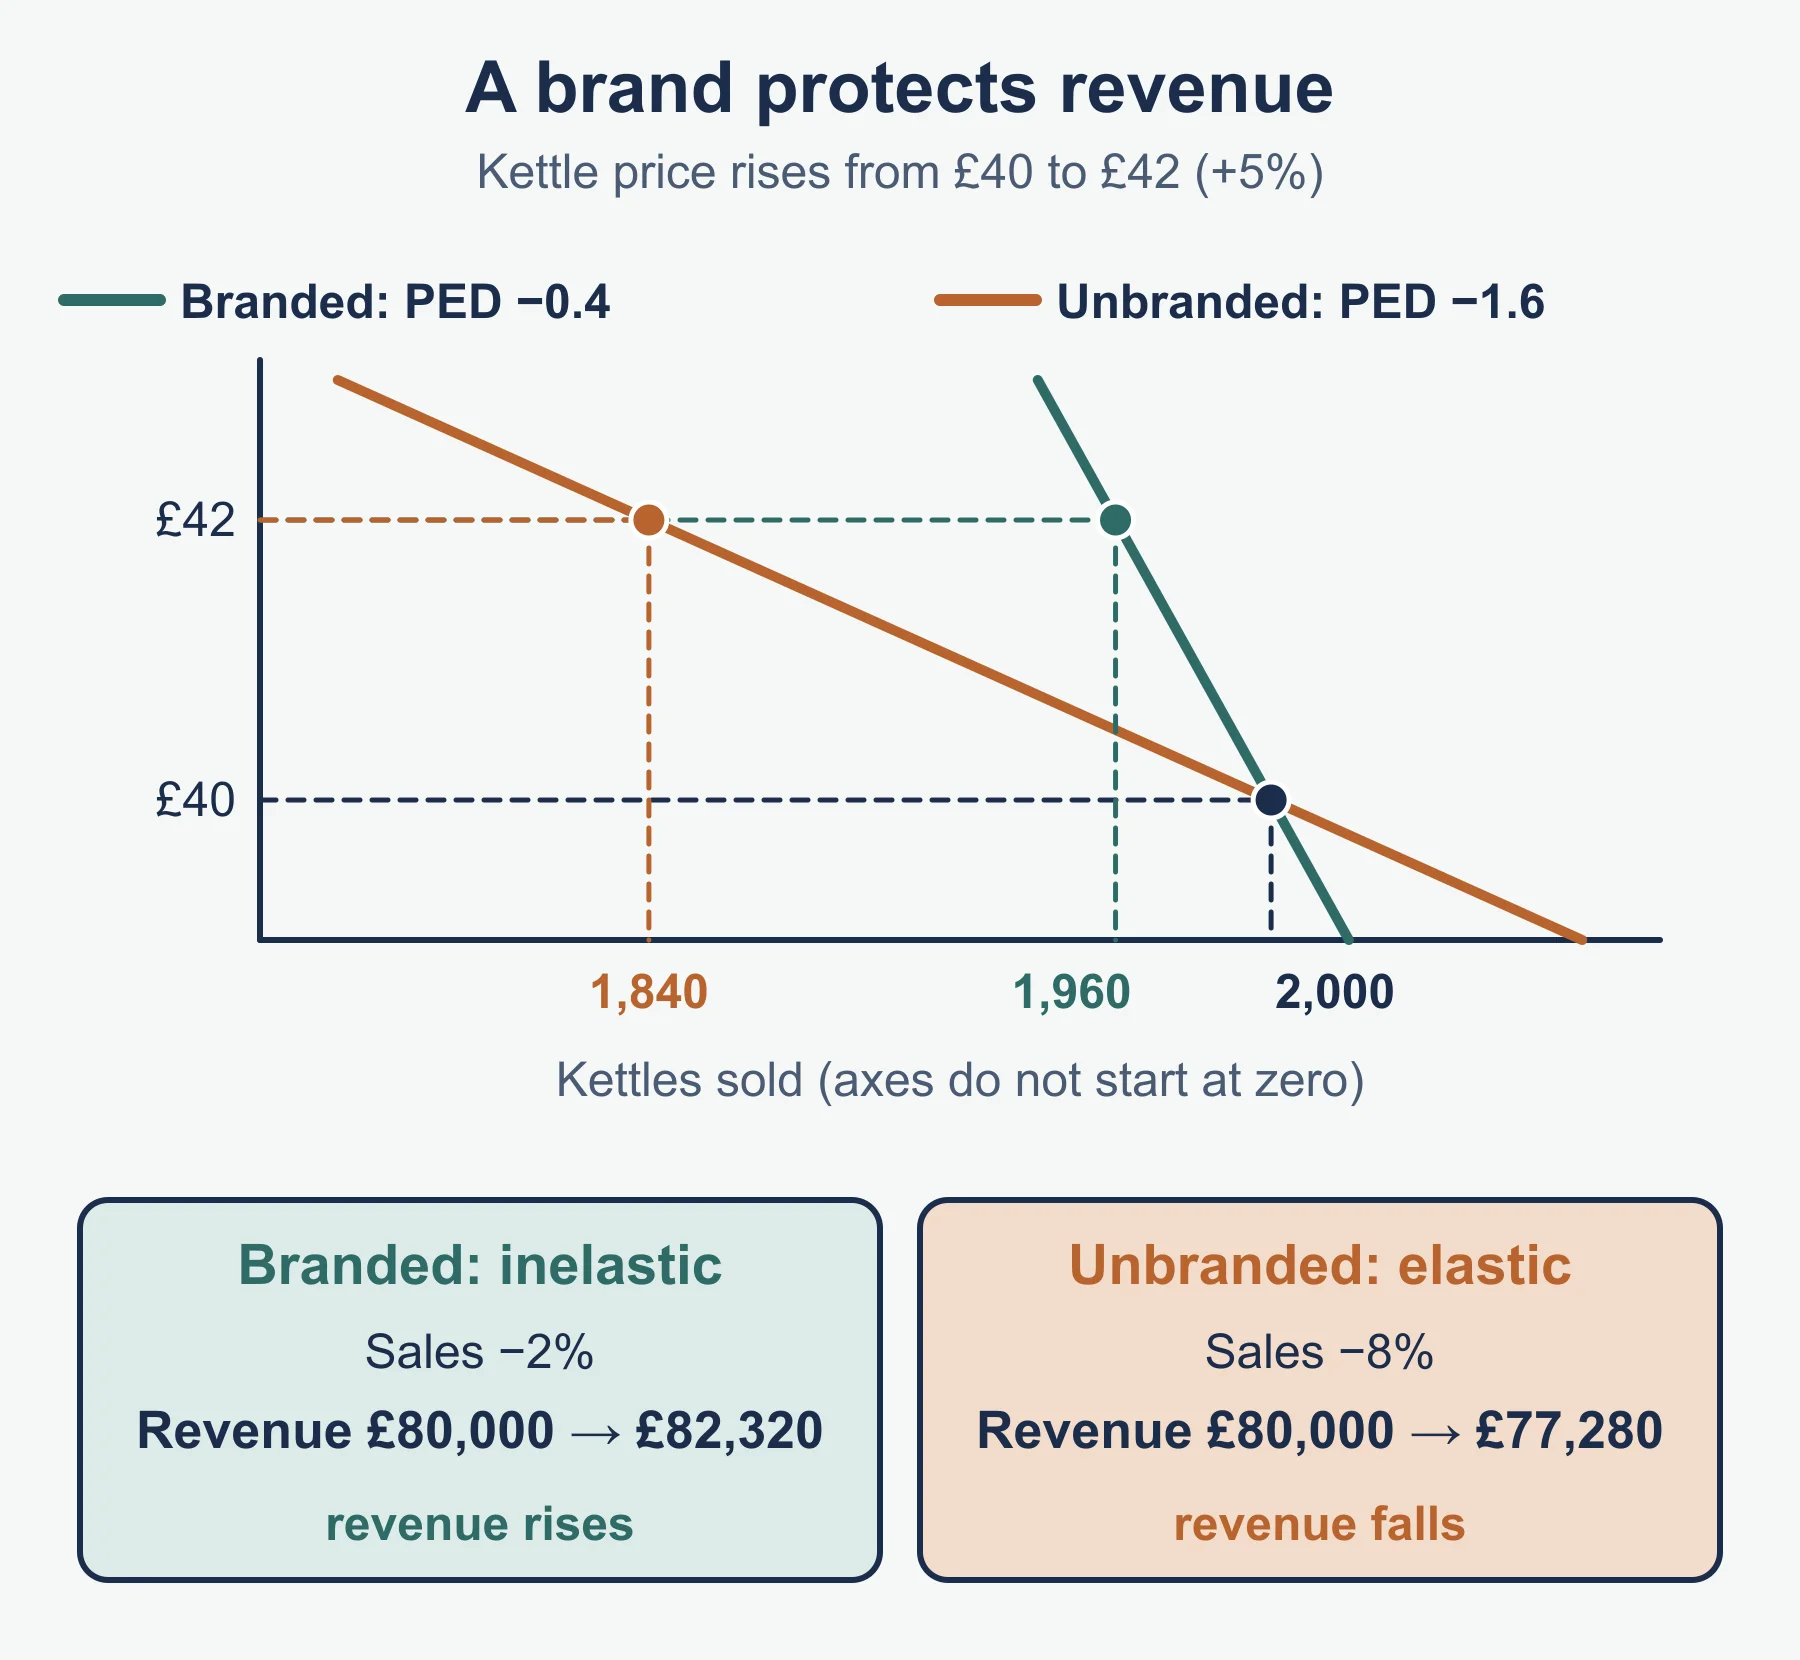
Benefits of strong branding (specification list): added value; ability to charge premium prices; reduced price elasticity of demand.
Ways to build a brand (specification list): USPs/differentiation, advertising, sponsorship, social media.
Social trends: viral marketing, social media, emotional branding.
| Term | Meaning | Main risk |
|---|---|---|
| Viral marketing | Customers share content themselves | No control of the message |
| Social media | Platform promotion and two-way contact | Public complaints |
| Emotional branding | Appeals to feelings, not features | Can seem insincere if the product does not match |
4 Pricing
| Strategy | Core idea | Best when |
|---|---|---|
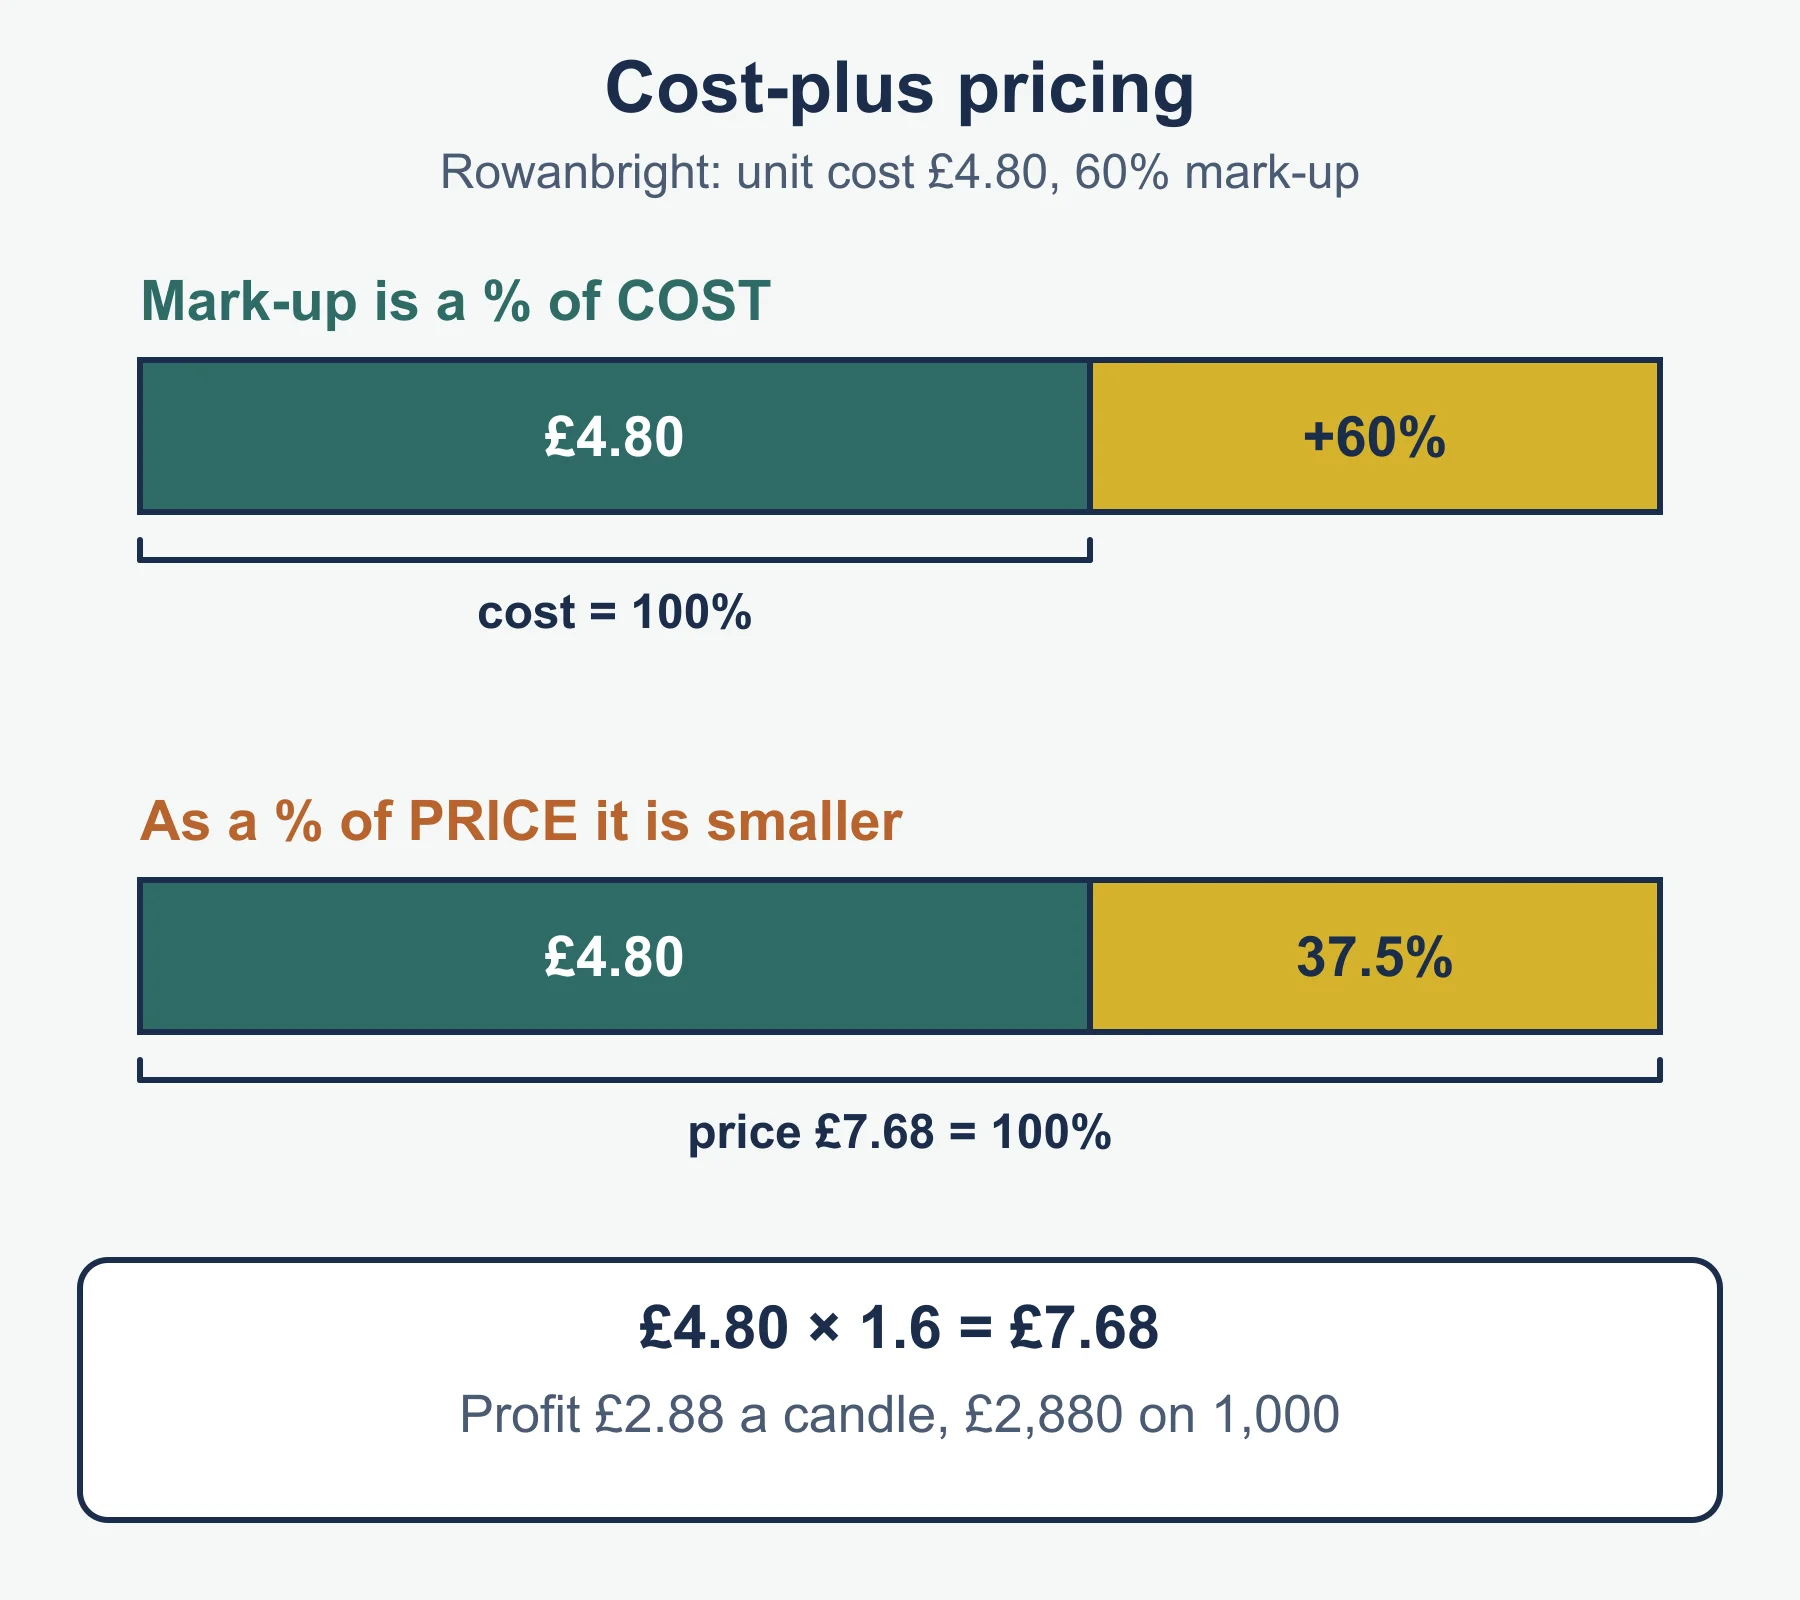
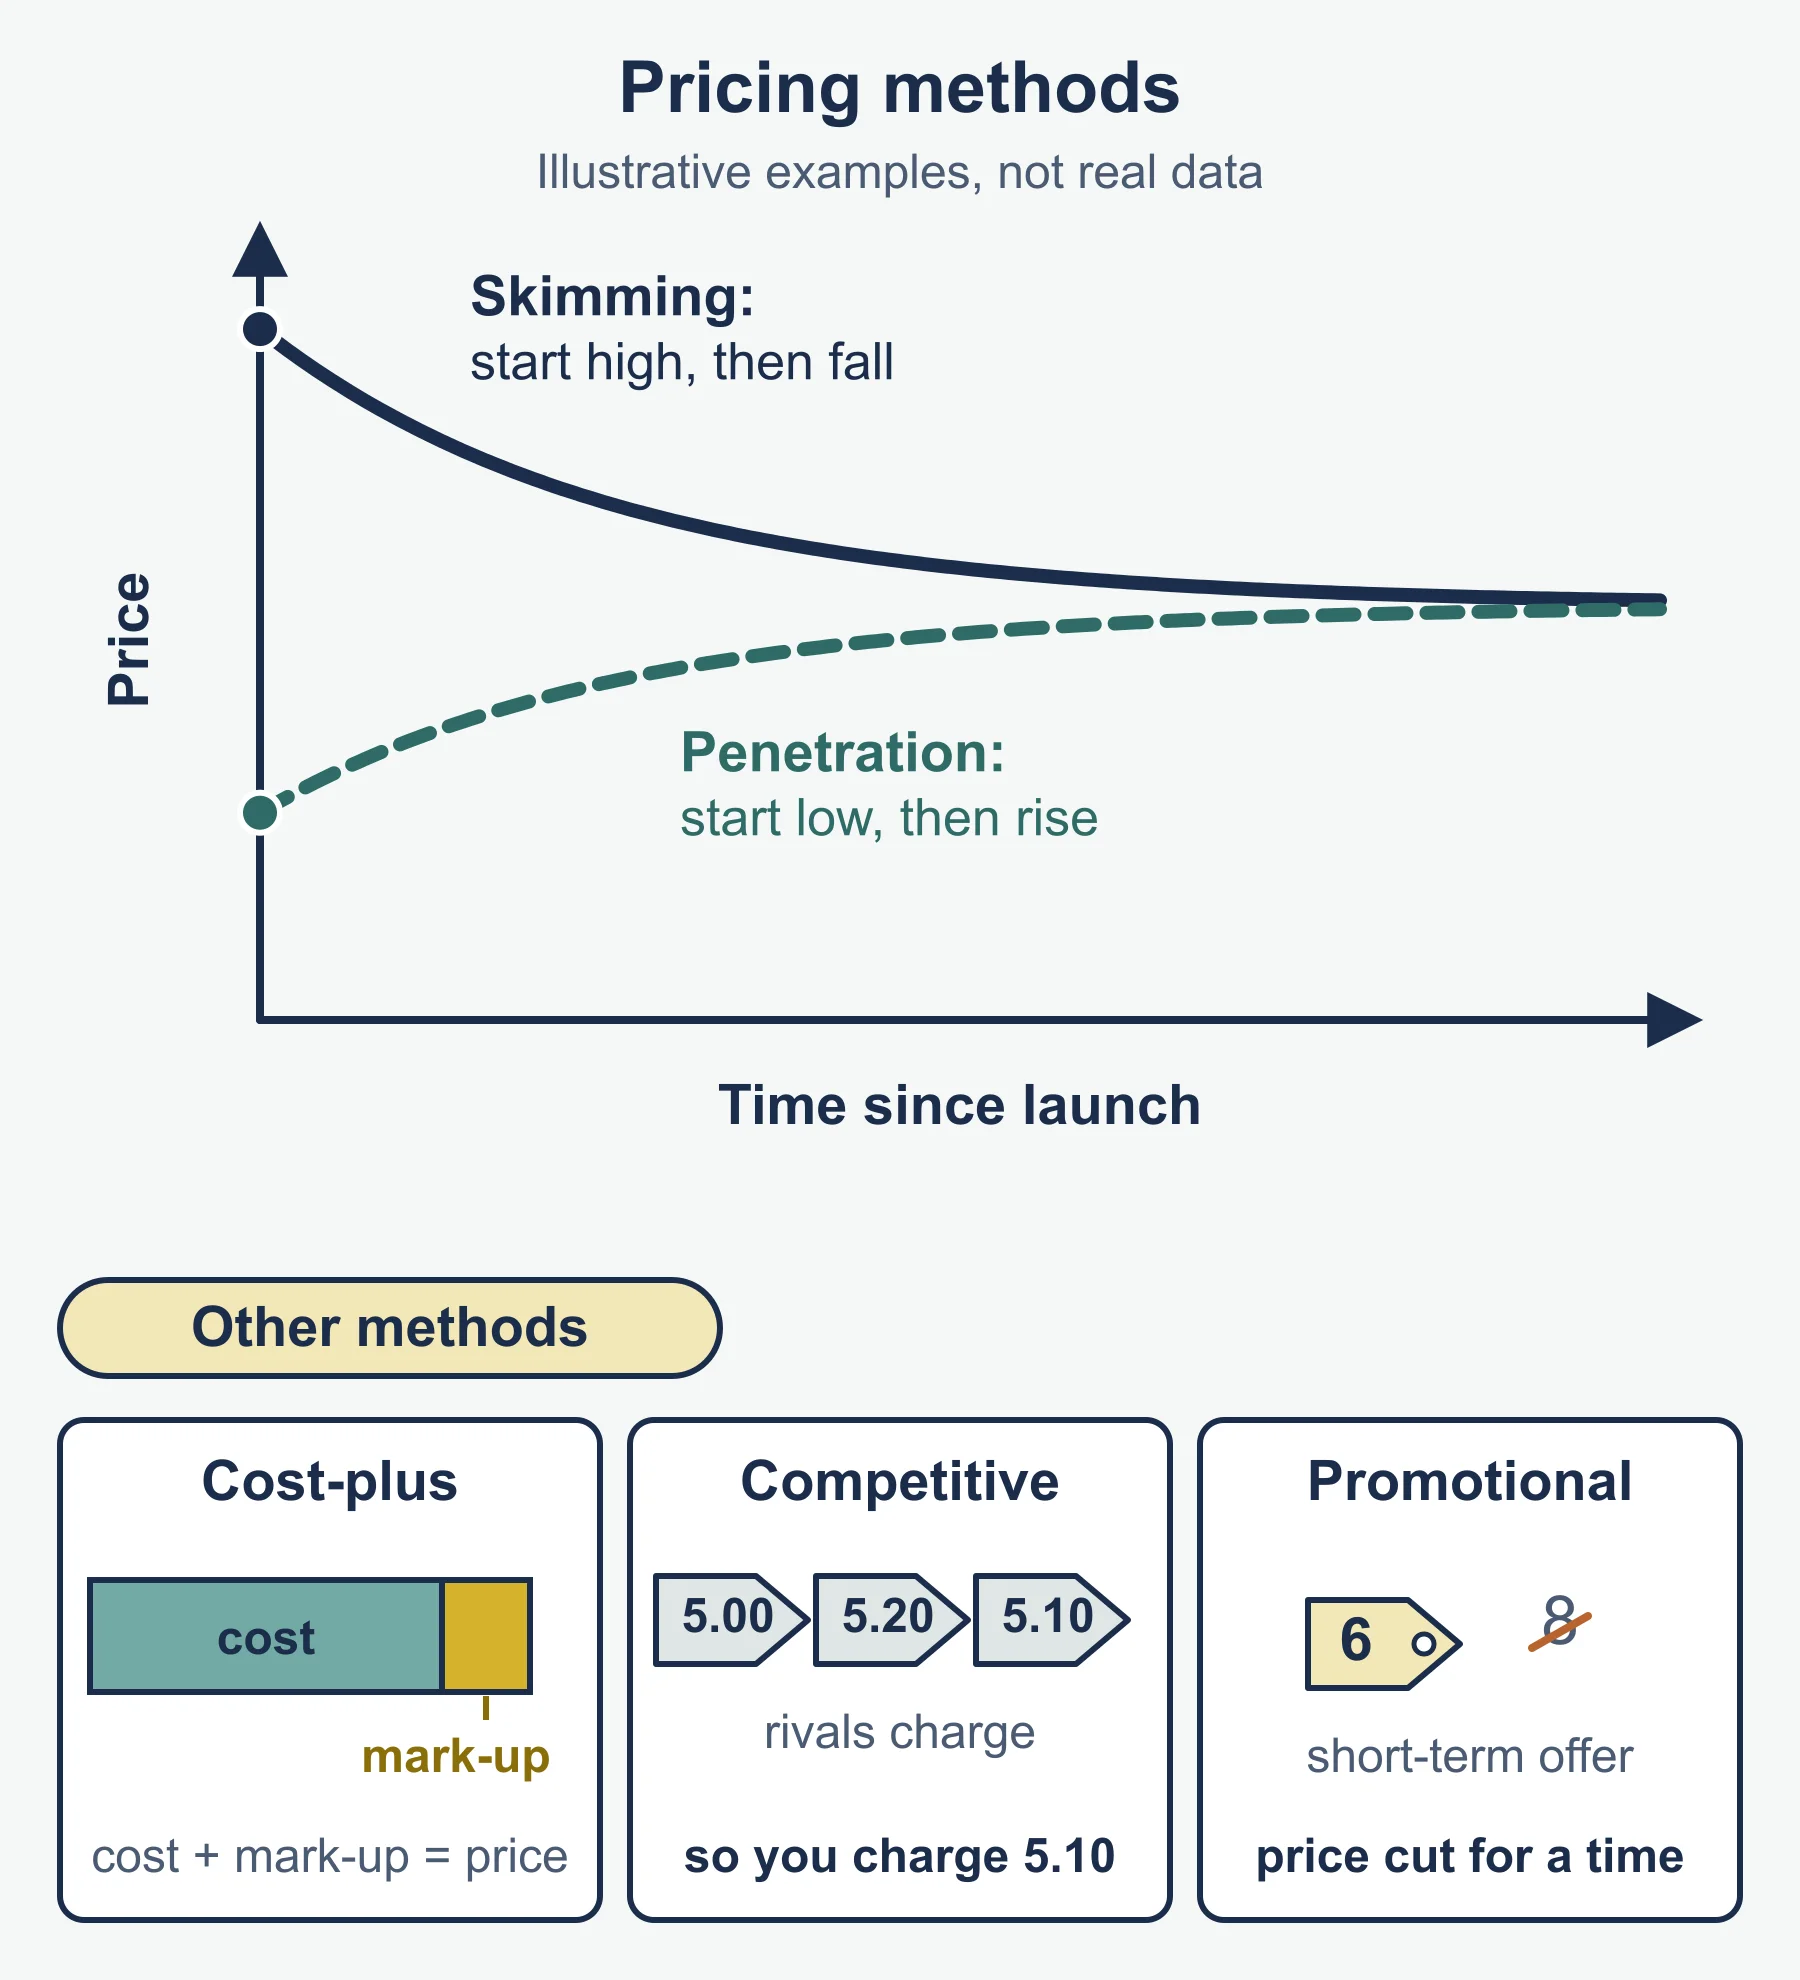
| Cost plus | Unit cost + mark-up % | Costs stable, little differentiation |
| Skimming | High launch price, lowered later | Strong USPs, inelastic demand, strong brand |
| Penetration | Low launch price | Elastic demand, rivals many, scale economies |
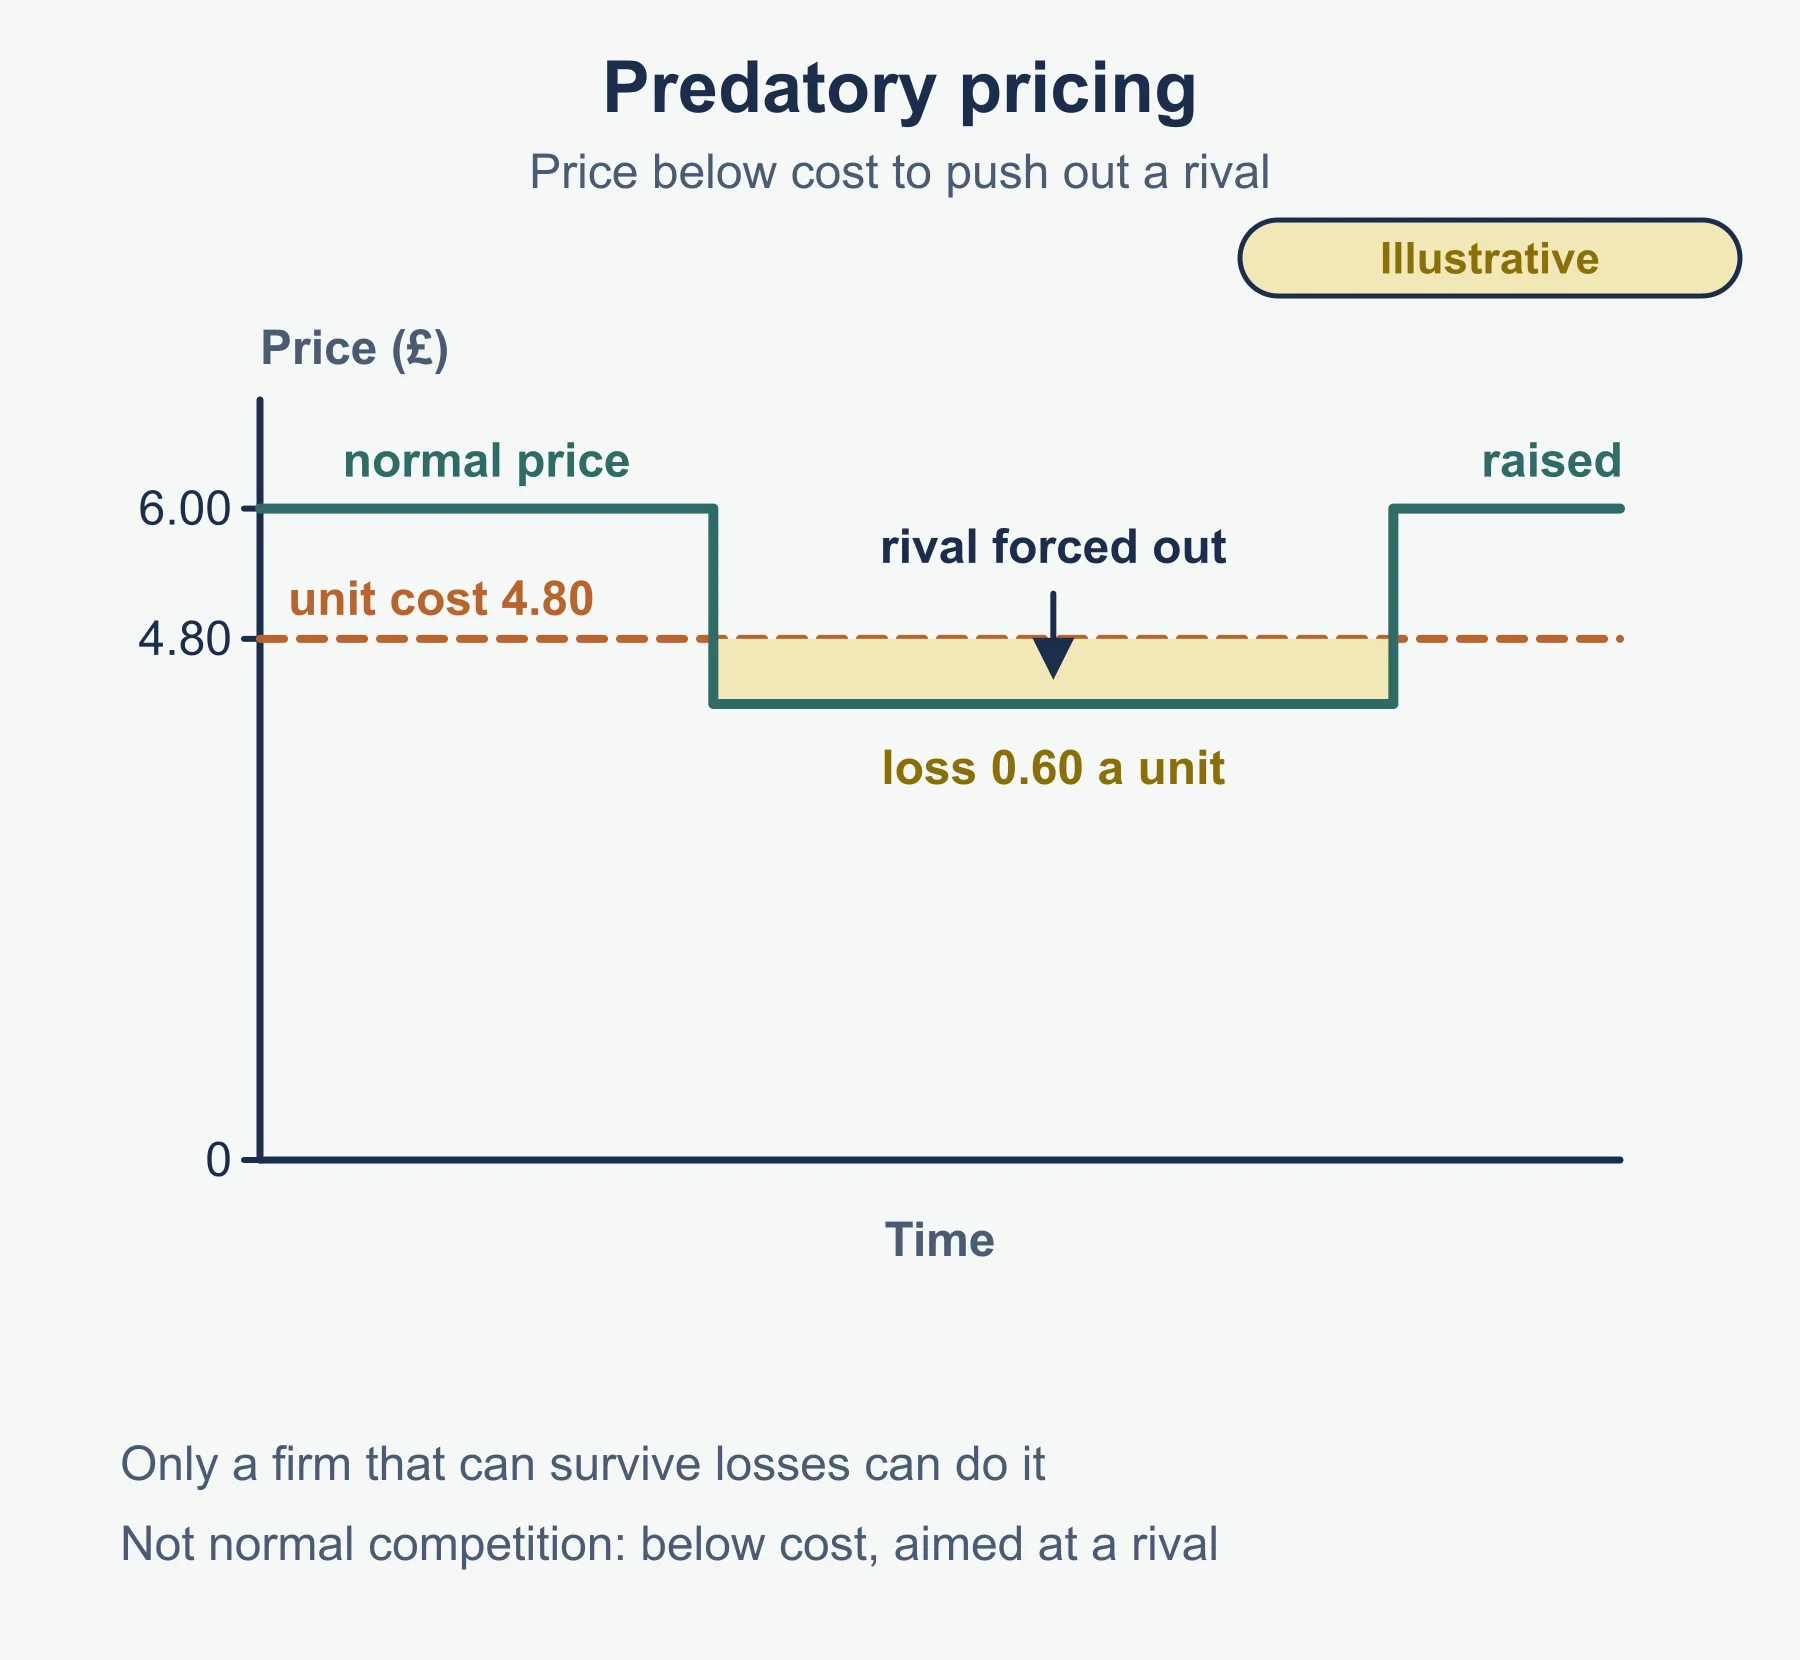
| Predatory | Below cost to force out a rival | Firm can afford losses |
| Competitive | Close to rivals’ prices | Many similar rivals, maturity |
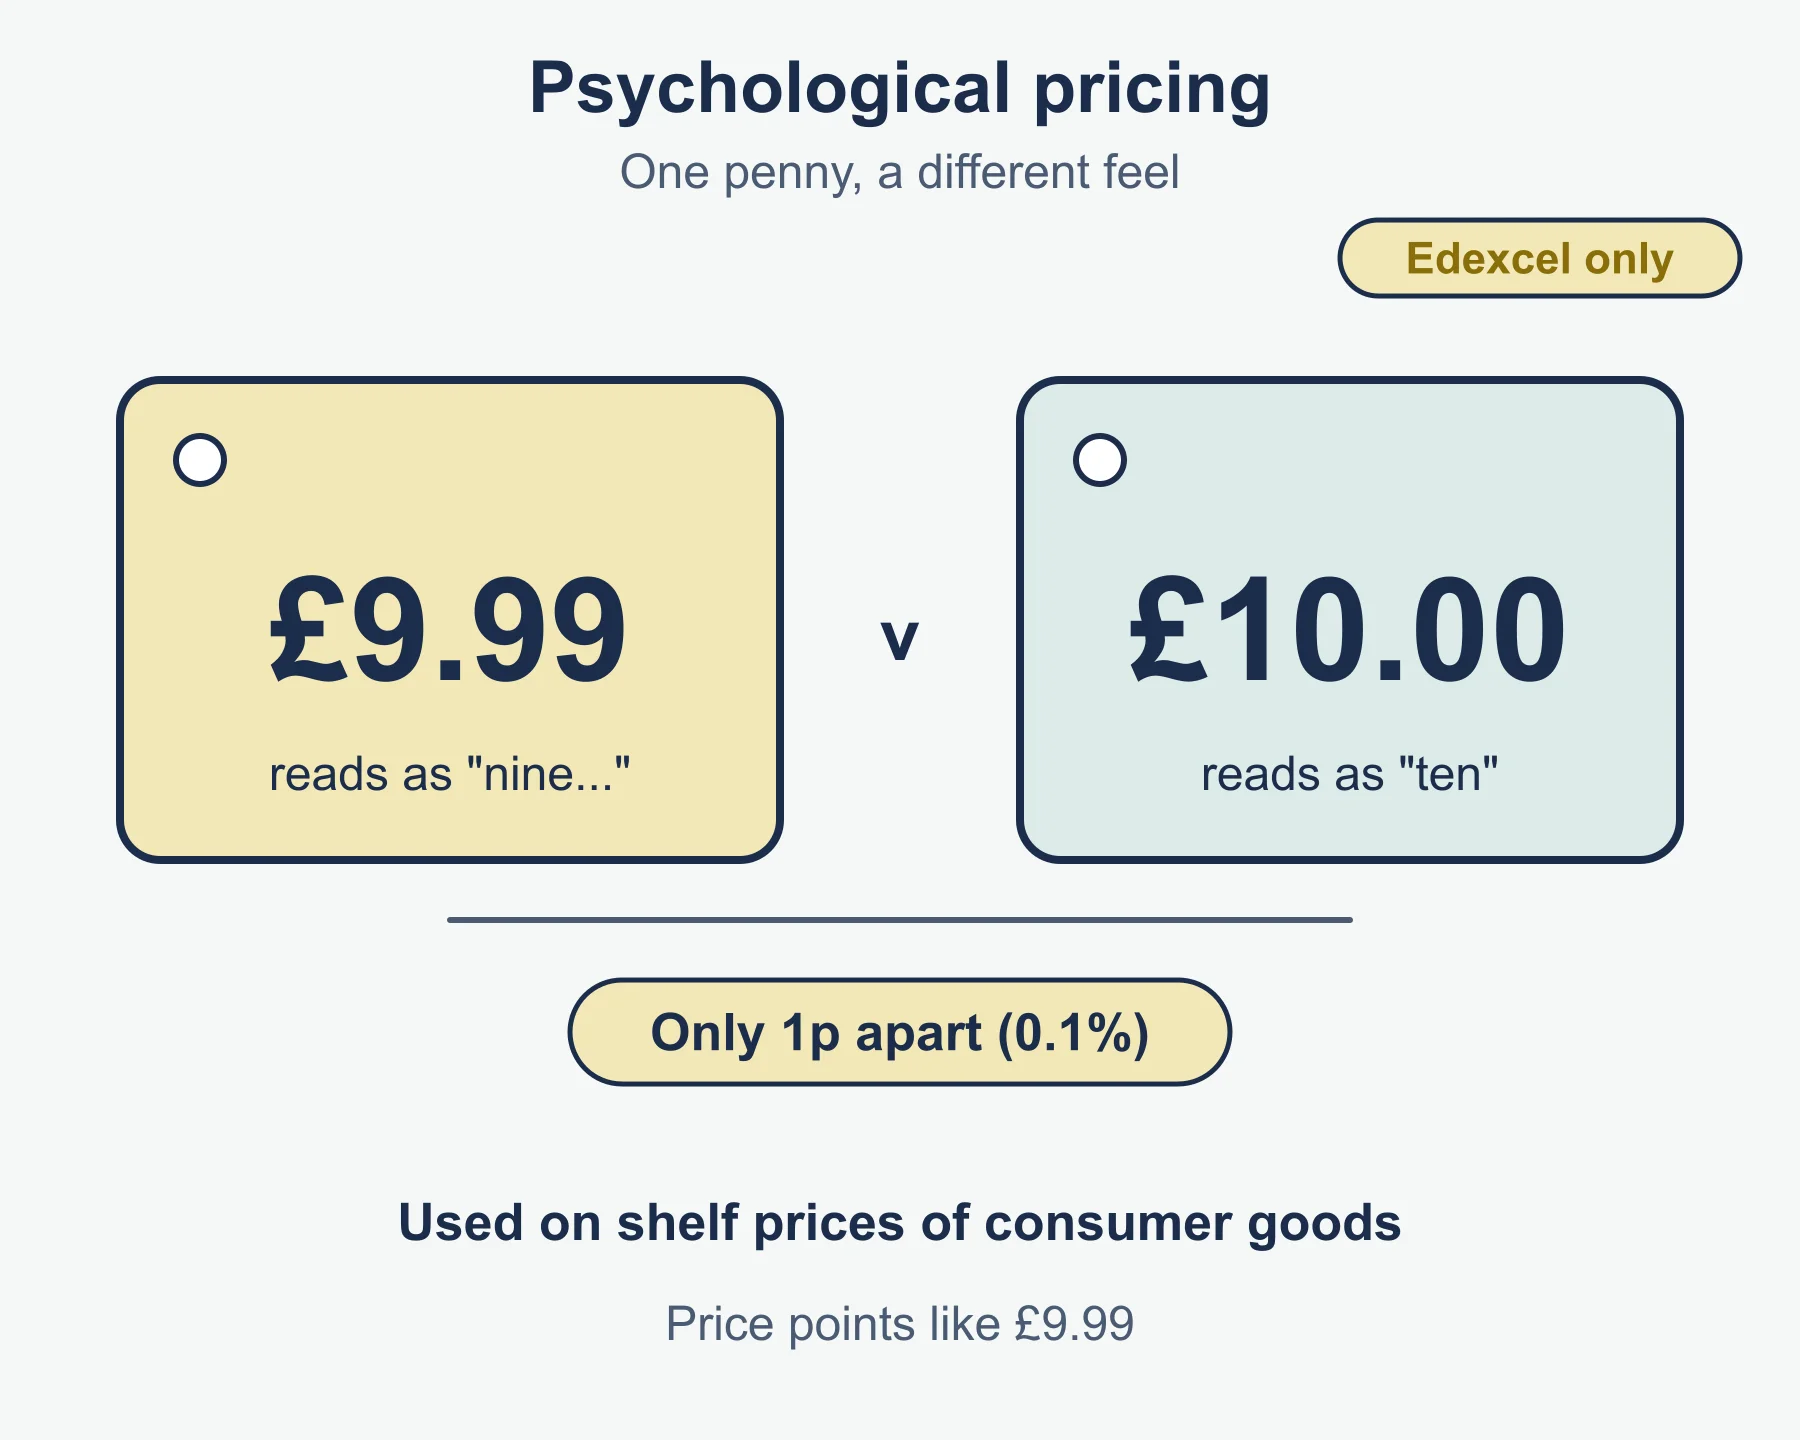
| Psychological | Prices such as £4.99 | Visible shelf prices |
Factors in choosing (specification list): number of USPs/amount of differentiation; price elasticity of demand; level of competition; strength of brand; stage in the product life cycle; costs and the need to make a profit.
Social trends: online sales (flexible, direct pricing) and price comparison sites (price transparency, so demand becomes more elastic for similar goods).
5 Distribution
| Channel | Route |
|---|---|
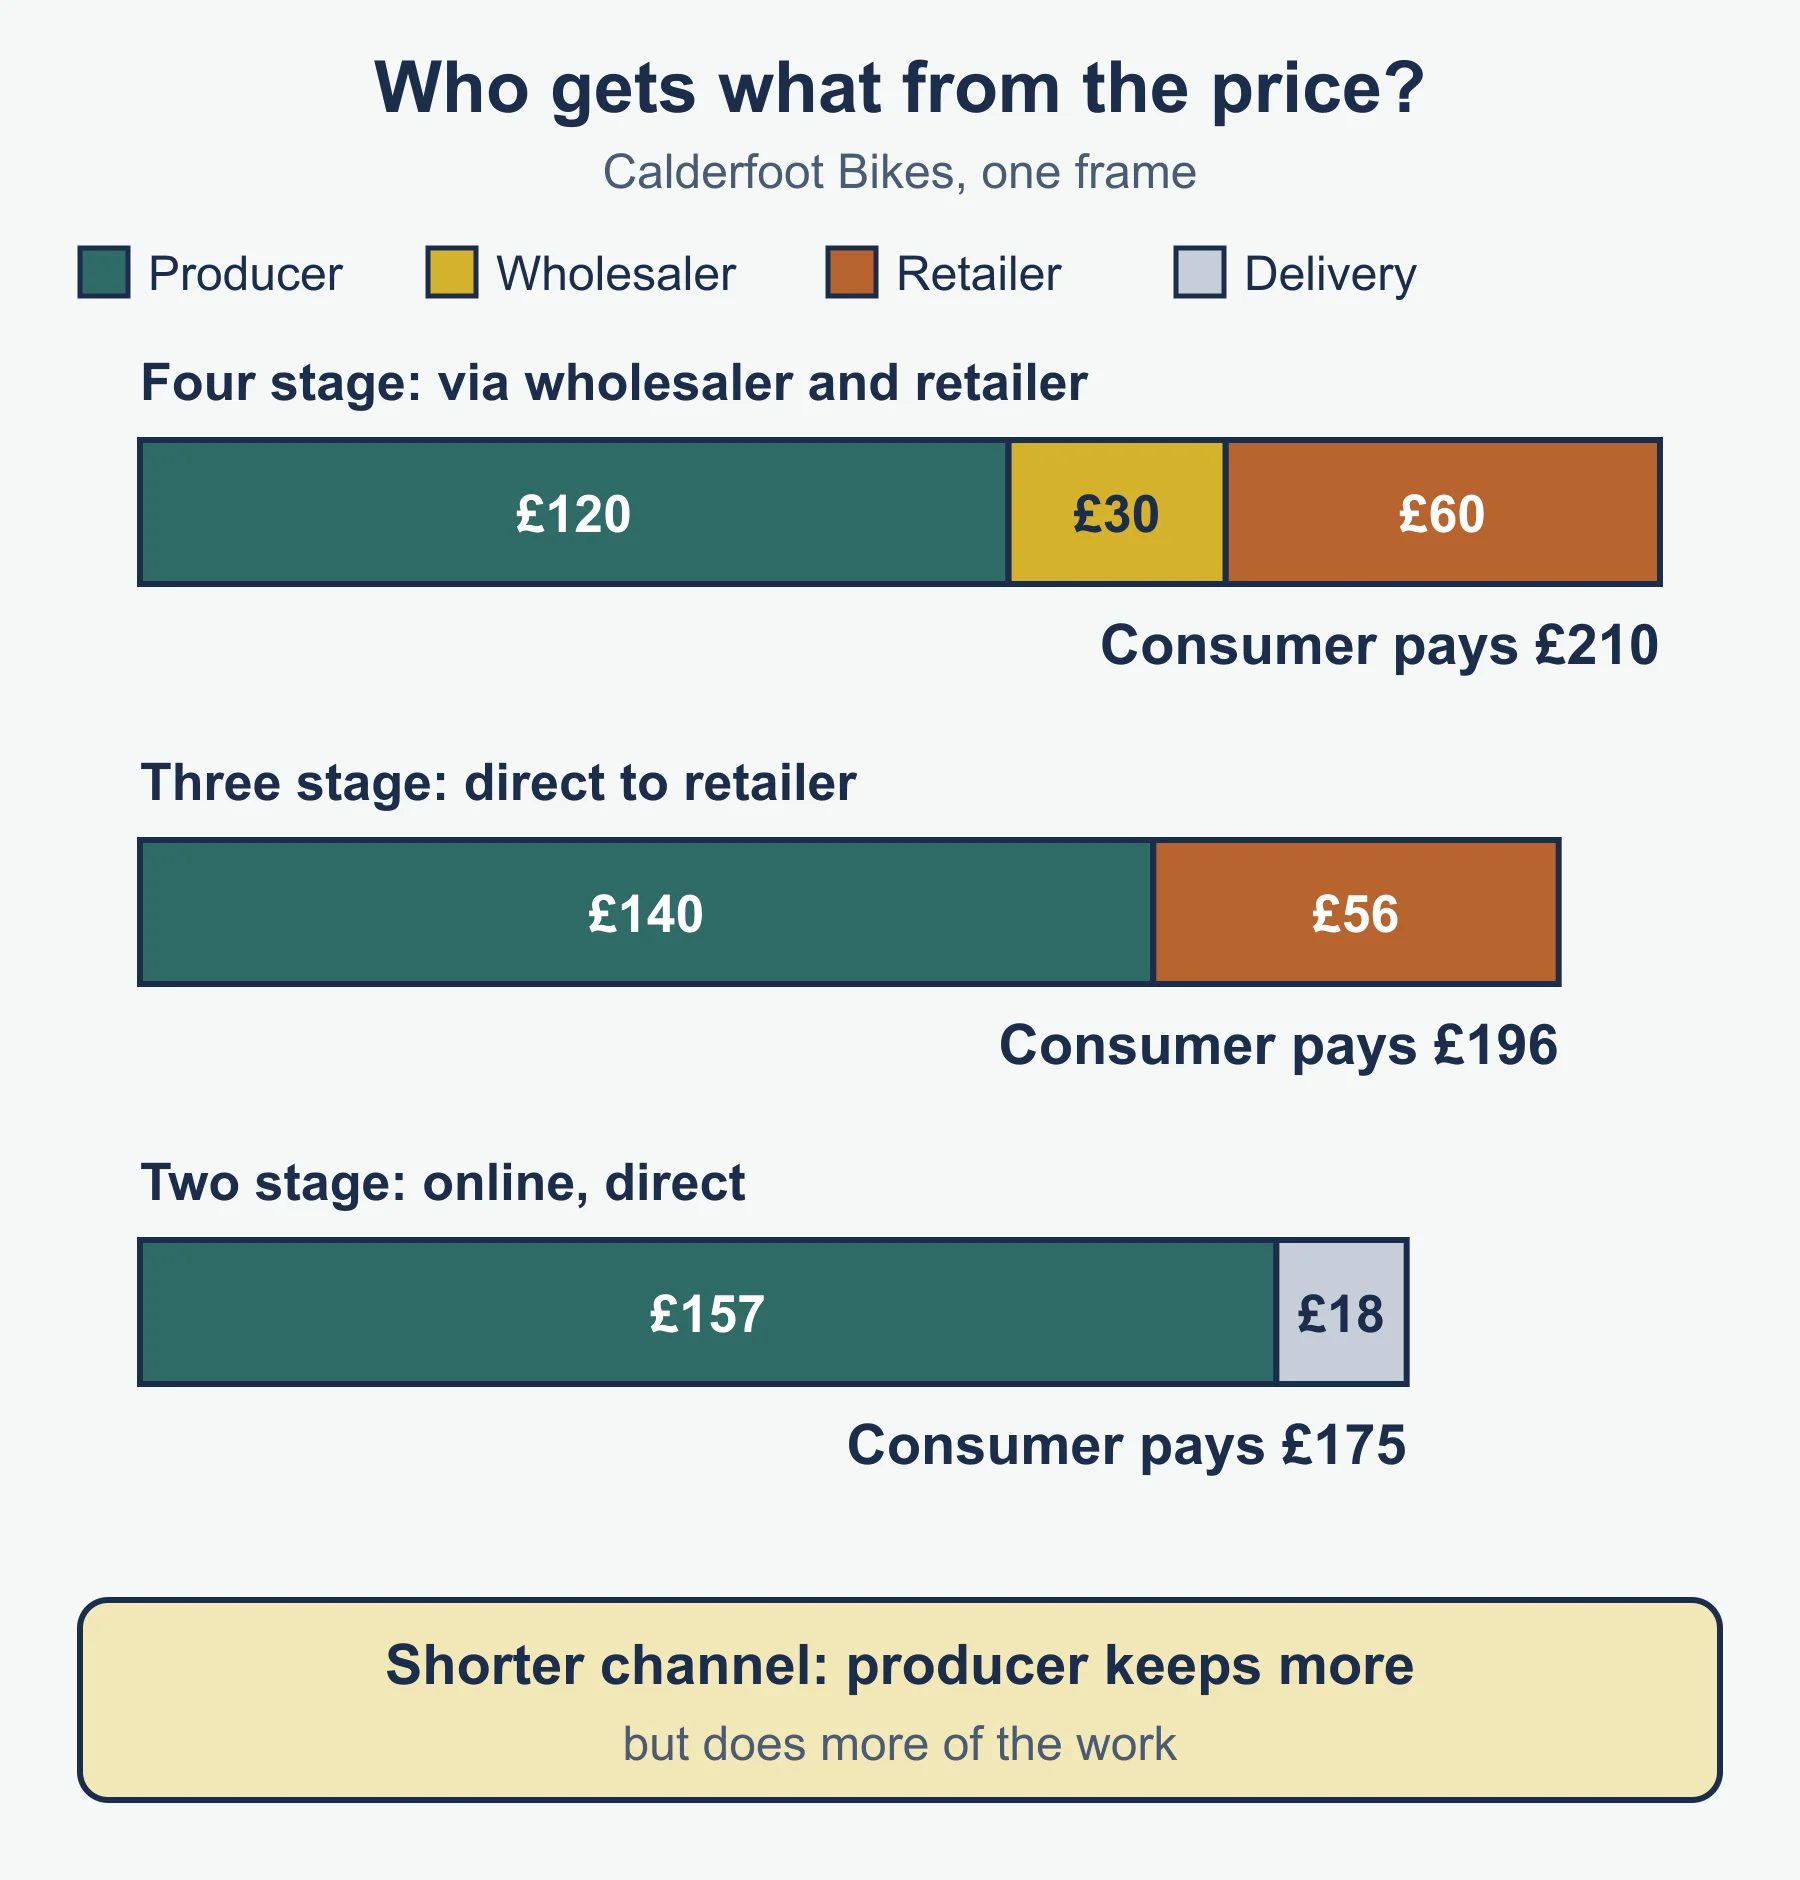
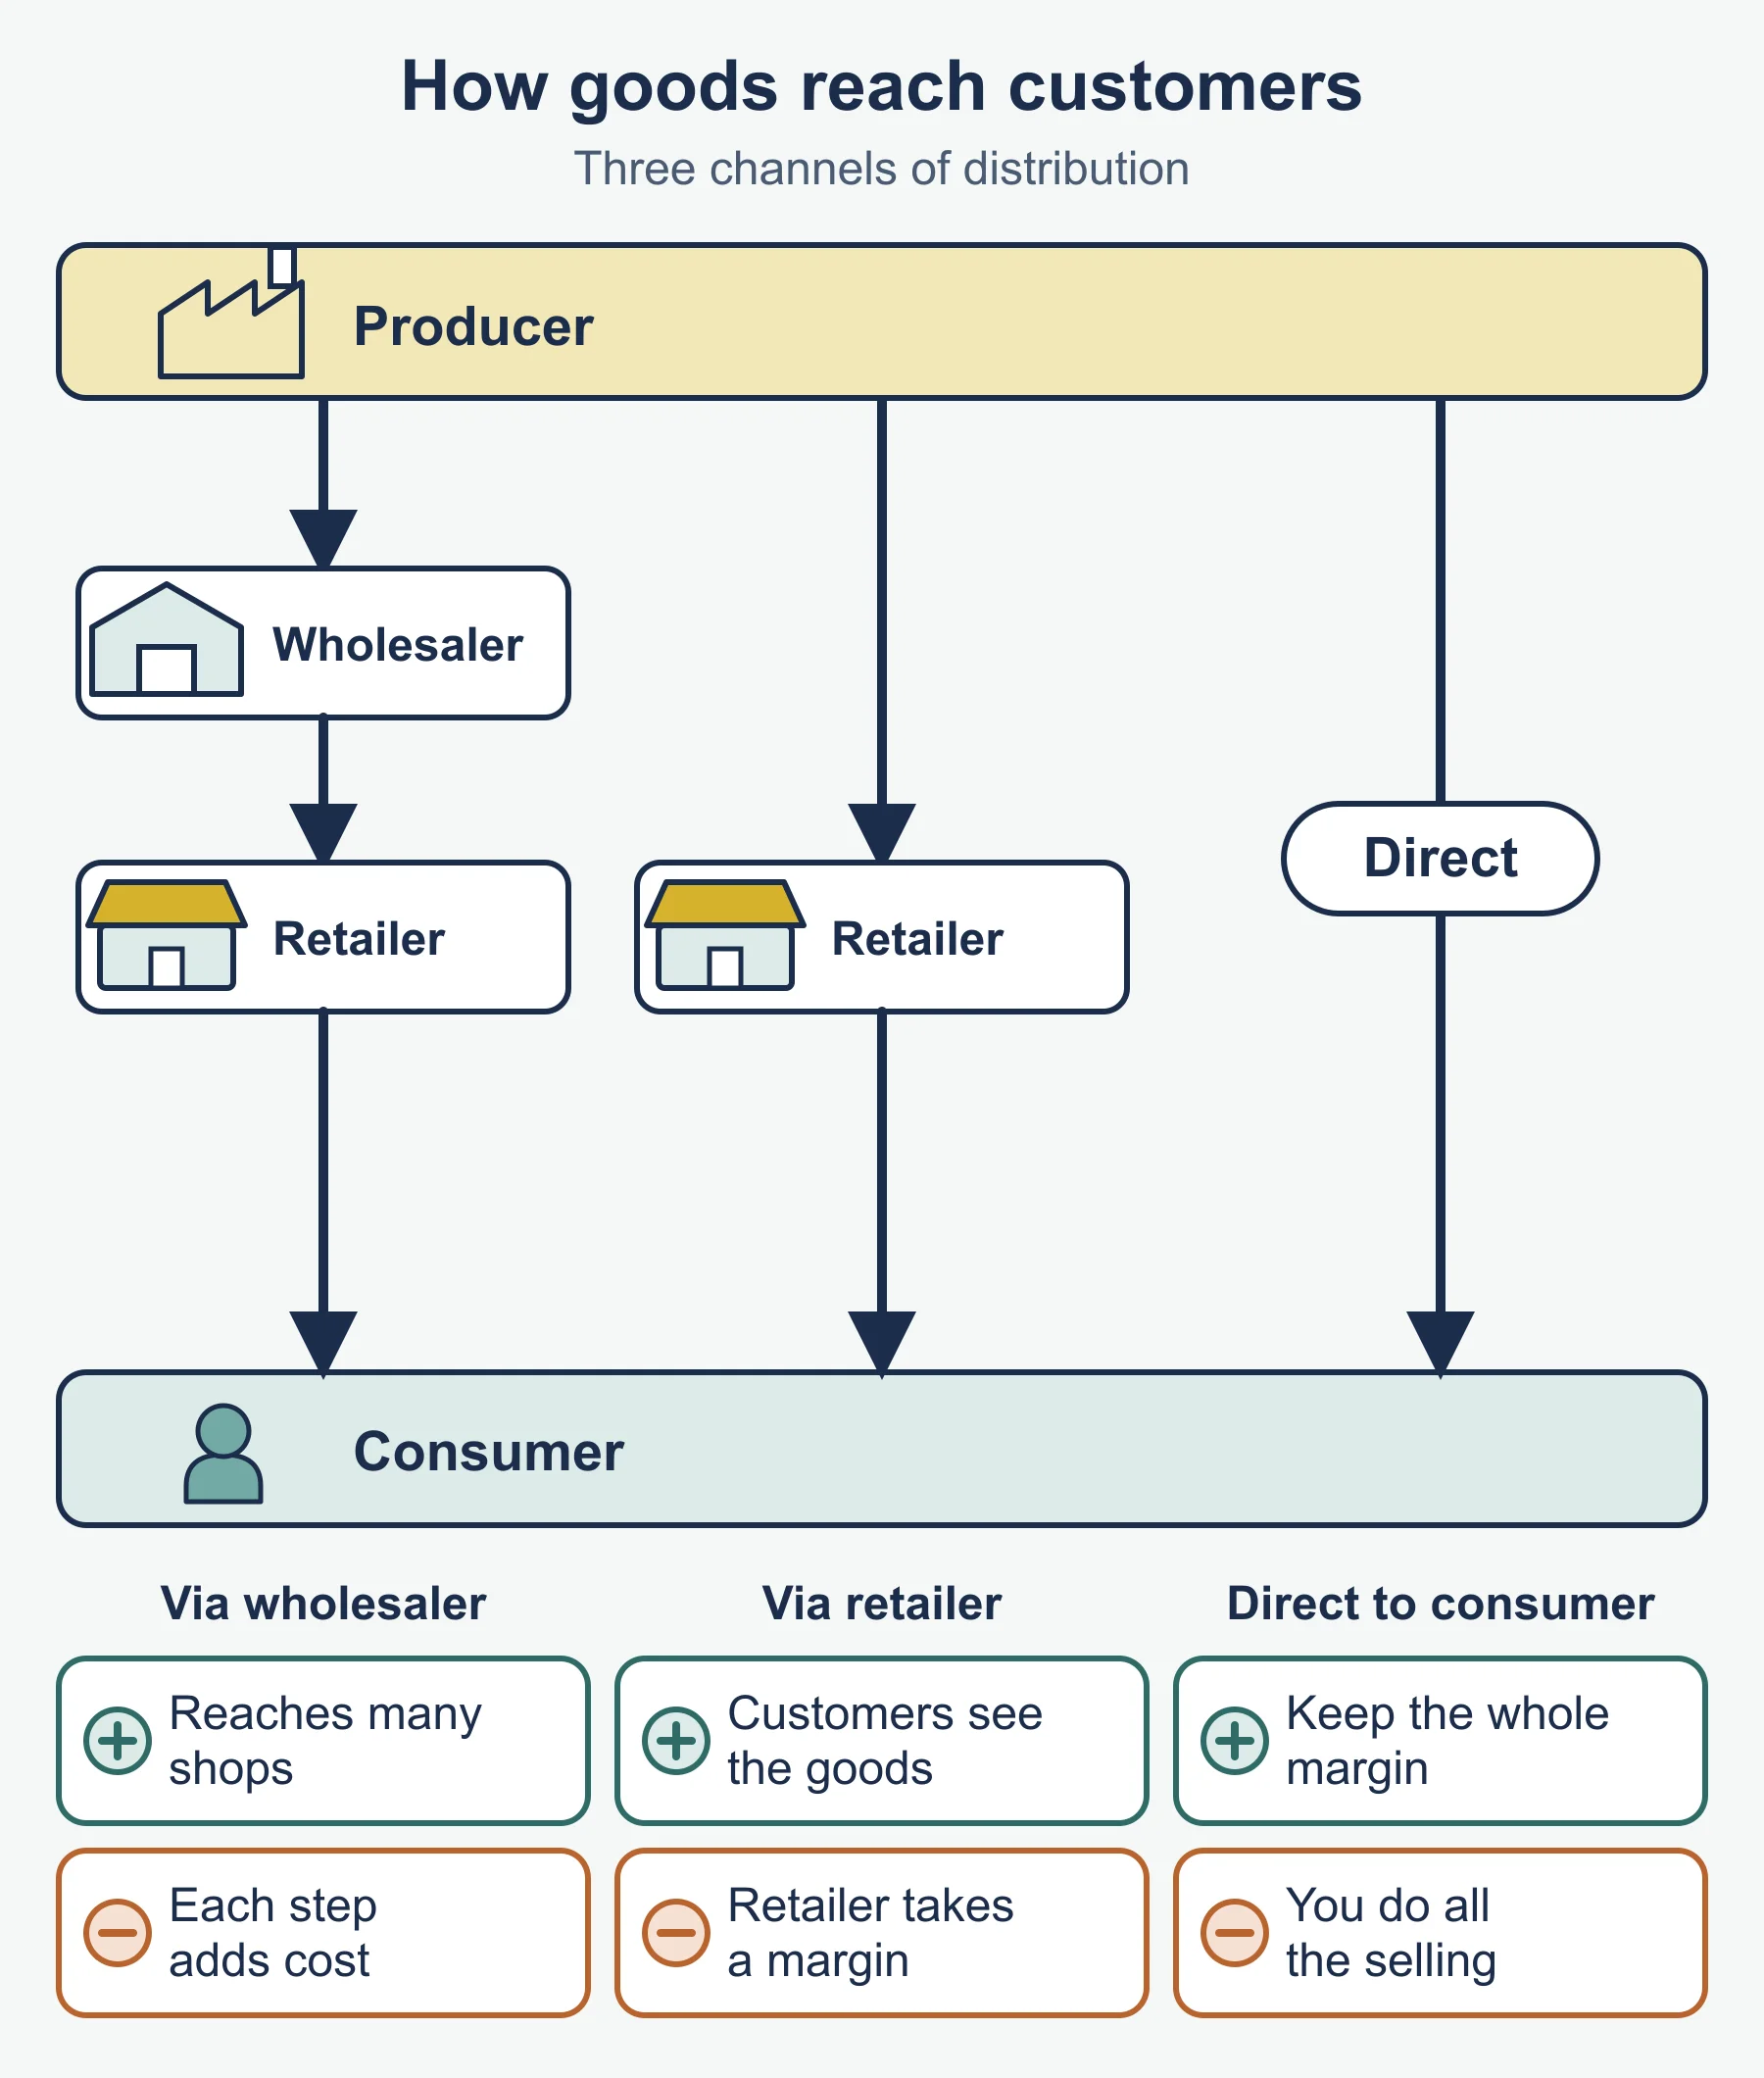
| Four stage | Producer → wholesaler → retailer → consumer |
| Three stage | Producer → retailer → consumer |
| Two stage | Producer → consumer |
Shorter channel: more income per unit and more control for the producer, but it takes on storage, delivery and service. Longer channel: wider reach with less effort, but each middleman takes a margin.
Formulas (standard forms)
| Item | Formula |
|---|---|
| Market share | firm’s sales ÷ total market sales × 100 |
| Relative market share | product’s share ÷ largest rival’s share |
| Cost-plus price | unit cost × (1 + mark-up %) |
| Price elasticity of demand | (% change in quantity demanded) ÷ (% change in price) |
| Added value | price charged − cost of materials and services bought in |
| Revenue | price × quantity |
Worked reminders
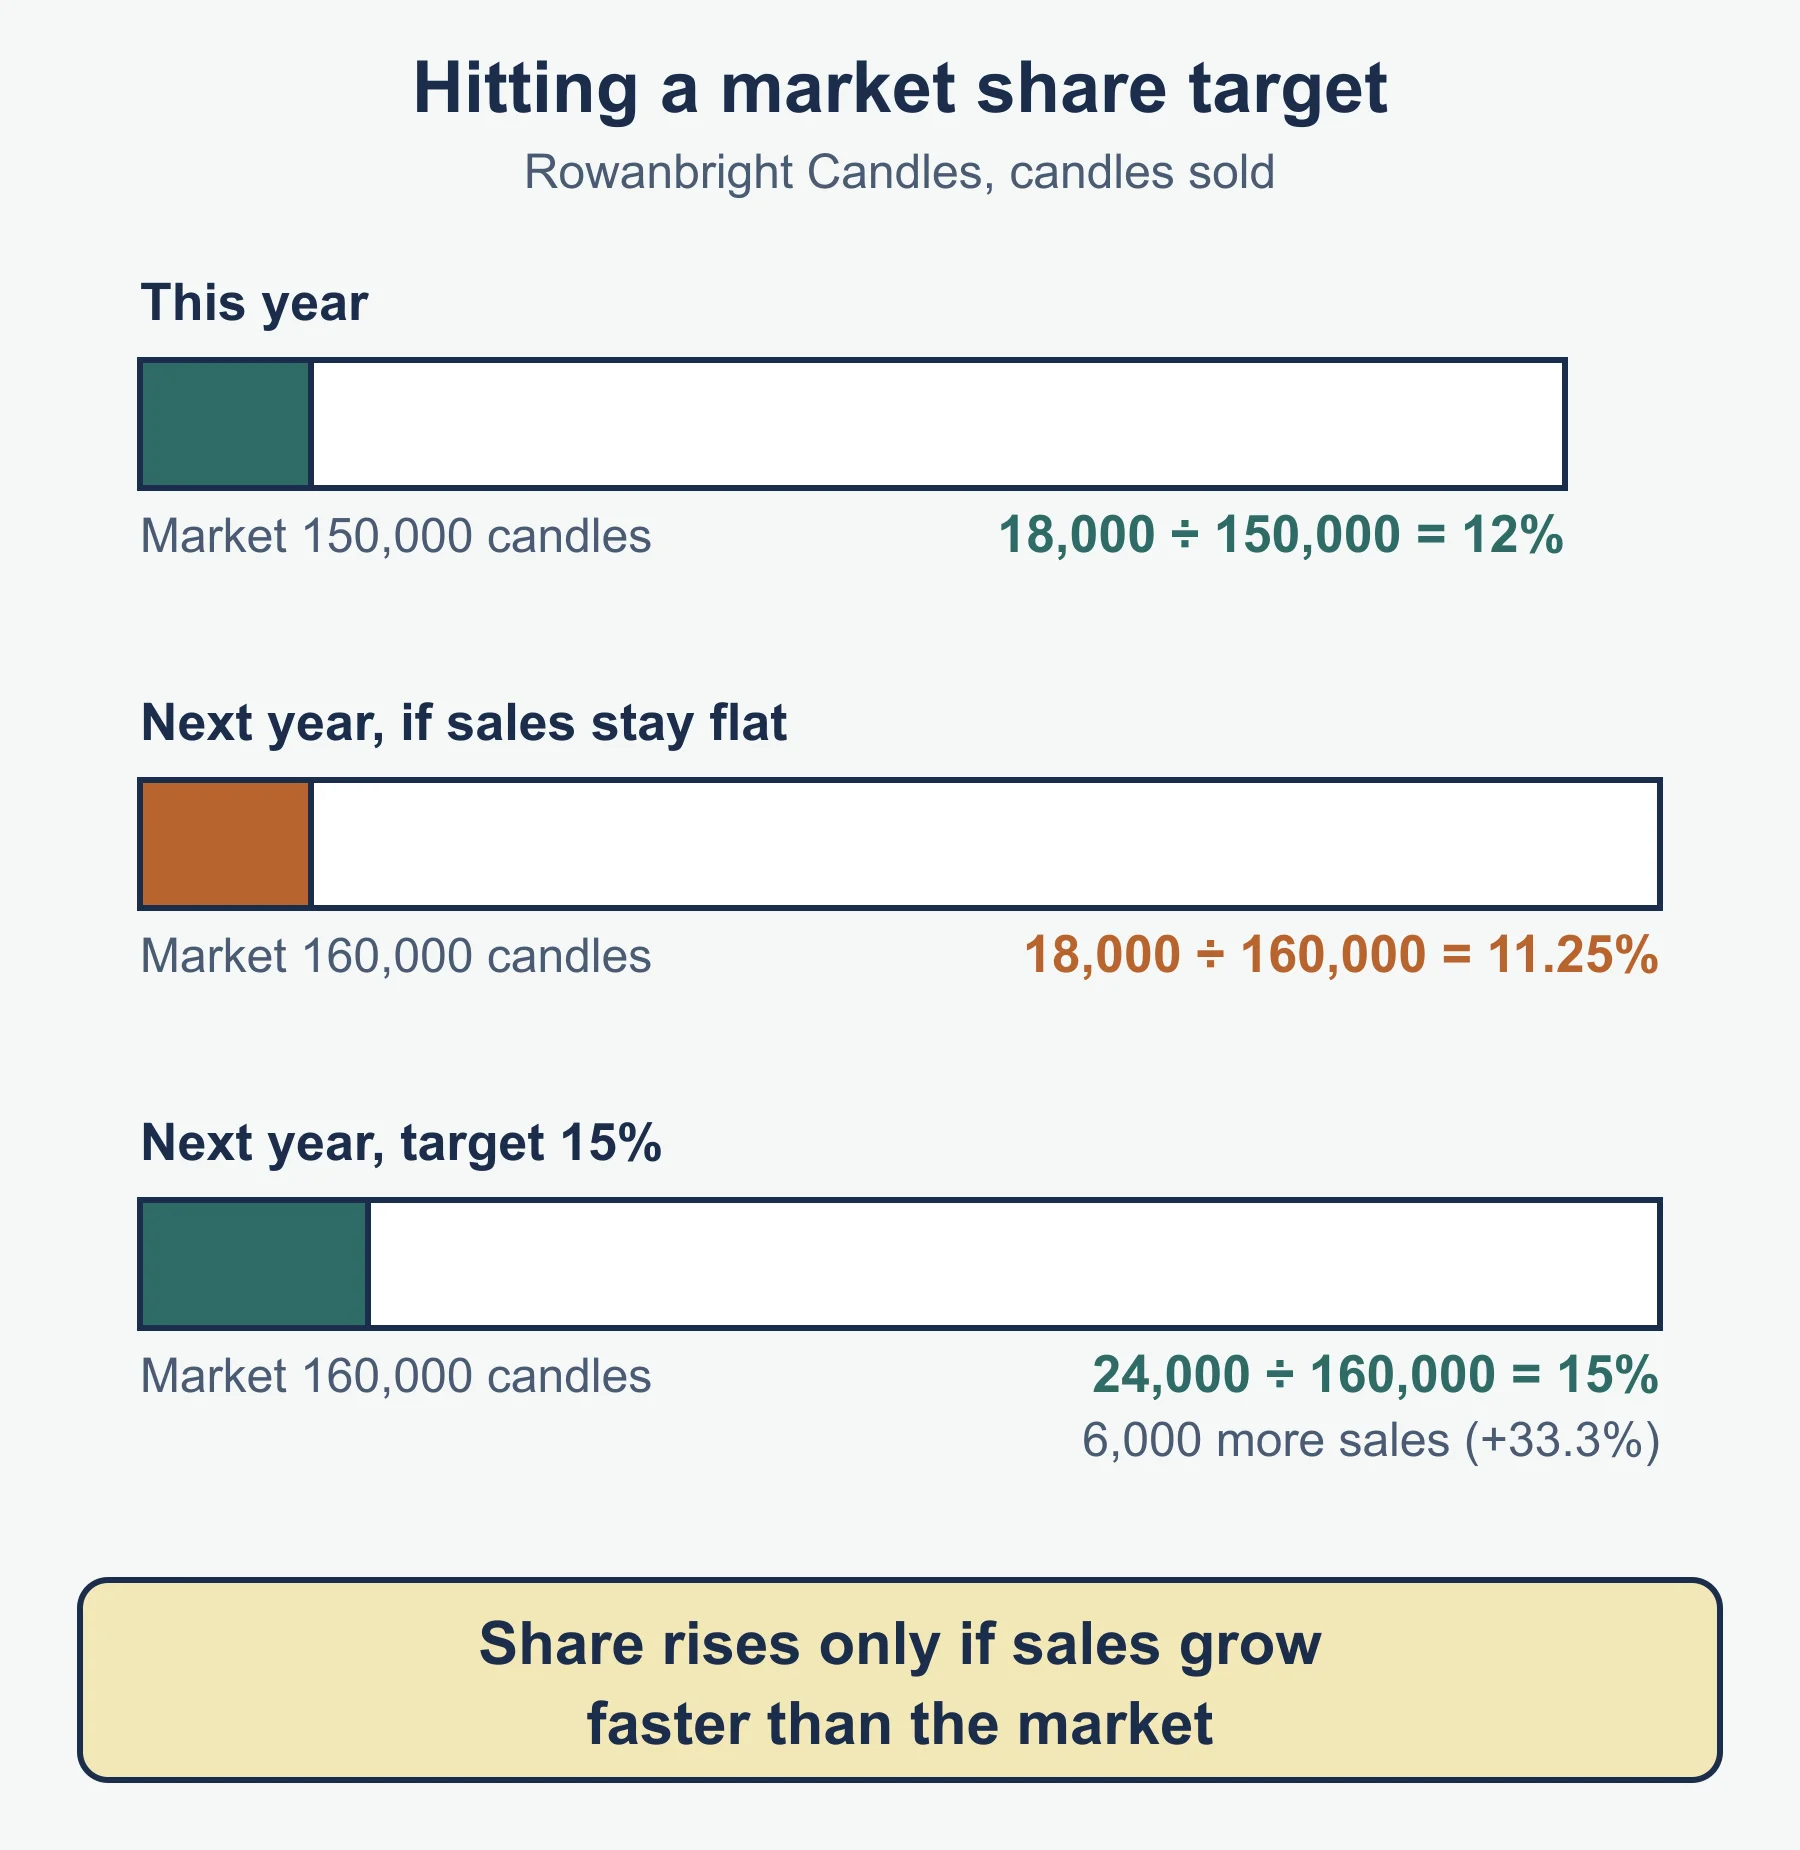
Share target. A business has sales of £2.4m in a £30m market, so its share is 2.4 ÷ 30 × 100 = 8%. A target of 10% in a market forecast at £32m needs sales of 0.10 × 32 = £3.2m. That is £0.8m more, a rise of 0.8 ÷ 2.4 × 100 = 33.3%.
Relative share. A product has 6% of the market and the largest rival has 24%. Relative share = 6 ÷ 24 = 0.25. With low growth it is a dog, and the question to ask is whether it supports sales of other products before deciding to drop it.
Growth rate. Sales rise from 40,000 to 46,000 units: (46,000 − 40,000) ÷ 40,000 × 100 = 15%. In a 10% growth market that is faster than the market, so share is rising.
Elasticity and revenue. If demand is elastic, a price rise cuts quantity by a larger percentage and revenue falls. If it is inelastic, revenue rises. Branding aims to move demand towards inelastic.
Must-know distinctions
- Market share (the firm’s slice of the whole market) versus relative market share (compared with the largest rival).
- Skimming (high then lower) versus penetration (low to gain share).
- Predatory (below cost, aimed at a rival) versus competitive (in line with rivals).
- Corporate branding (one name for all) versus individual branding (name per product).
- Mark-up (percentage of cost) versus margin (percentage of price).
- Added value (price less bought-in inputs) versus profit (after all costs).
Quick self-test
- Define the term marketing mix.
- Veldtmann Audio sells 45,000 speakers in a market of 360,000. Calculate its market share.
- A product has unit cost £30 and a 50% mark-up. Calculate the cost-plus price.
- A product with unit cost £42 sells for £63. Calculate the mark-up as a percentage of cost.
- A product has an 18% share, the largest rival has 36%, and market growth is 14% with a cut-off of 10%. Calculate relative market share and classify it.
- A price rises 10% and quantity demanded falls 4%. Calculate price elasticity of demand and state the effect on revenue.
- Demand has a price elasticity of −1.5. By how much does quantity fall if price rises 6%?
- A producer sells at £50 to a wholesaler, who adds 30%, and the retailer adds 60%. Give the consumer price.
- State the three elements of the design mix.
- State two ways of building a brand and two social trends in pricing.
Answers
- The combination of marketing decisions (product, promotion, price, place) a business uses to meet its marketing objectives.
- 45,000 ÷ 360,000 × 100 = 12.5%.
- 30 × 1.5 = £45.
- (63 − 42) ÷ 42 × 100 = 50%.
- 18 ÷ 36 = 0.5. Share is below 1 and growth is above the cut-off, so a question mark.
- −4 ÷ 10 = −0.4, inelastic, so revenue rises.
- −1.5 × 6 = −9%, so quantity falls by 9%.
- 50 × 1.3 = £65; 65 × 1.6 = £104.
- Function, aesthetics, cost/economic manufacture.
- Any two of USPs/differentiation, advertising, sponsorship, social media; and online sales and price comparison sites.
Where marks are usually lost
- Giving a definition of the Boston Matrix categories without using the figures to classify the product.
- Using the wrong base for relative market share (dividing by total market, not the largest rival).
- Applying a mark-up to the selling price instead of the unit cost.
- Dropping the negative sign or the unit in elasticity answers, or not saying what the value means.
- Choosing a pricing strategy without linking it to a factor from the specification list, such as elasticity, competition or stage in the life cycle.
- Listing the four Ps for the business without saying how they meet the stated objective.
- Treating extension strategies as always successful, with no judgement about the cause of the stalled sales.
- Ignoring that a shorter distribution channel moves costs and tasks on to the producer.
- Writing about viral marketing or social media in general terms, with no link to the product and its target market.
Frequently asked questions
What are the four categories of the Boston Matrix? Stars have high relative market share in a high-growth market, cash cows have high share in a low-growth market, question marks have low share in a high-growth market, and dogs have low share in a low-growth market.
What is the difference between price skimming and penetration pricing? Price skimming sets a high launch price, lowered later, and suits a new product with strong USPs. Penetration pricing sets a low launch price to gain market share and suits elastic demand.
What is predatory pricing? Predatory pricing sets a price below cost to push a rival out of the market. It is not normal competition and suits only a firm that can survive the losses.
What are the distribution channels in Edexcel IAL Business? A four-stage channel runs producer to wholesaler to retailer to consumer, a three-stage channel cuts out the wholesaler, and a two-stage channel sells direct from producer to consumer.
Official syllabus
Pearson Edexcel International Advanced Subsidiary/Advanced Level in Business, Specification, Issue 1, September 2017, Pearson Education Limited, section 1.3.3.
Get free revision emails (optional)
Occasional emails with practice questions, worked explanations and links to free resources for the qualification and subjects you choose. No spam, and you can unsubscribe from any email. The free tools on this site never need an email.
Related resources
-
Study guides
Edexcel International A Level Business: Meeting customer needs and The market (YBS11)
Study guide to Edexcel International A Level Business Unit 1 sections 1.3.1 and 1.3.2: markets, research, positioning, demand, supply, PED and YED.
Business · Pearson Edexcel · AS Level
Read guide -
Practice questions
Edexcel International A Level Business: Meeting customer needs and The market (YBS11) – Practice Questions
Original practice questions with worked answers for Edexcel International A Level Business Unit 1, sections 1.3.1 and 1.3.2: PED, YED, research.
Business · Pearson Edexcel · AS Level
Try questions -
Revision notes
Edexcel International A Level Business: Meeting customer needs and The market (YBS11) – Revision Notes
Condensed recall notes for Edexcel International A Level Business Unit 1 sections 1.3.1 and 1.3.2, with formula tables and a ten-question self-test.
Business · Pearson Edexcel · AS Level
Revise topic
Related articles
-
teaching
A Level tuition in Dubai: Cambridge or Pearson Edexcel International A Level?
Schools in Dubai and Abu Dhabi teach either Cambridge International AS & A Level or Pearson Edexcel International A Level. How the two are structured, why it matters for tuition, and how online classes from Lahore work.
9 October 2026
-
curriculum guides
Choosing subjects at IGCSE and A Level
How subject choices at 14 and 16 affect university options later, and how to keep pathways open without overloading a timetable.
28 July 2026
Studying this with a teacher
Working through Business AS LEVEL?
This page is free and stays free. If you would rather be taught it, Marlbridge runs Business classes one-to-one and in small groups of up to 15, online in your own time zone. The first trial class is free. WhatsApp replies within an hour (8am–11pm Pakistan time, every day); email the same day.
Pearson Edexcel Business teachers at Marlbridge

