
Revision Notes
Edexcel International A Level Business: Meeting customer needs and The market (YBS11) – Revision Notes
Condensed recall notes for Edexcel International A Level Business Unit 1 sections 1.3.1 and 1.3.2, with formula tables and a ten-question self-test.
- Subject
- Business
- Level
- AS LEVEL
- Topic
- Marketing and people
- Author
- Marlbridge Academic Team
- Updated
- Reviewed by
- Salman Ahmad (what this means)
Aligned to Pearson Edexcel A Level Business (YBS11), Issue 1, September 2017. Official specification .
Syllabus page (what it covers and how it is assessed): Pearson Edexcel A Level Business.
Syllabus points this page covers
YBS11 (AS Level)
- 1.3.1 Meeting customer needs
- 1.3.2 The market
Found an error? Report a correction.
Need help with this topic? Request a free trial class for A Level Business (YBS11).
These notes condense sections 1.3.1 (Meeting customer needs) and 1.3.2 (The market) of Unit 1, Marketing and people, from the Pearson Edexcel International Advanced Subsidiary/Advanced Level in Business specification, Issue 1, September 2017. For full explanations, use the study guide. Then test yourself with the practice set.
Related: Unit 1 revision notes and the Unit 1 overview guide. Course hub: Edexcel A Level Business. Checklist: printable checklist. Not sure where to start? Try a free diagnostic.
Key definitions
| Term | Meaning |
|---|---|
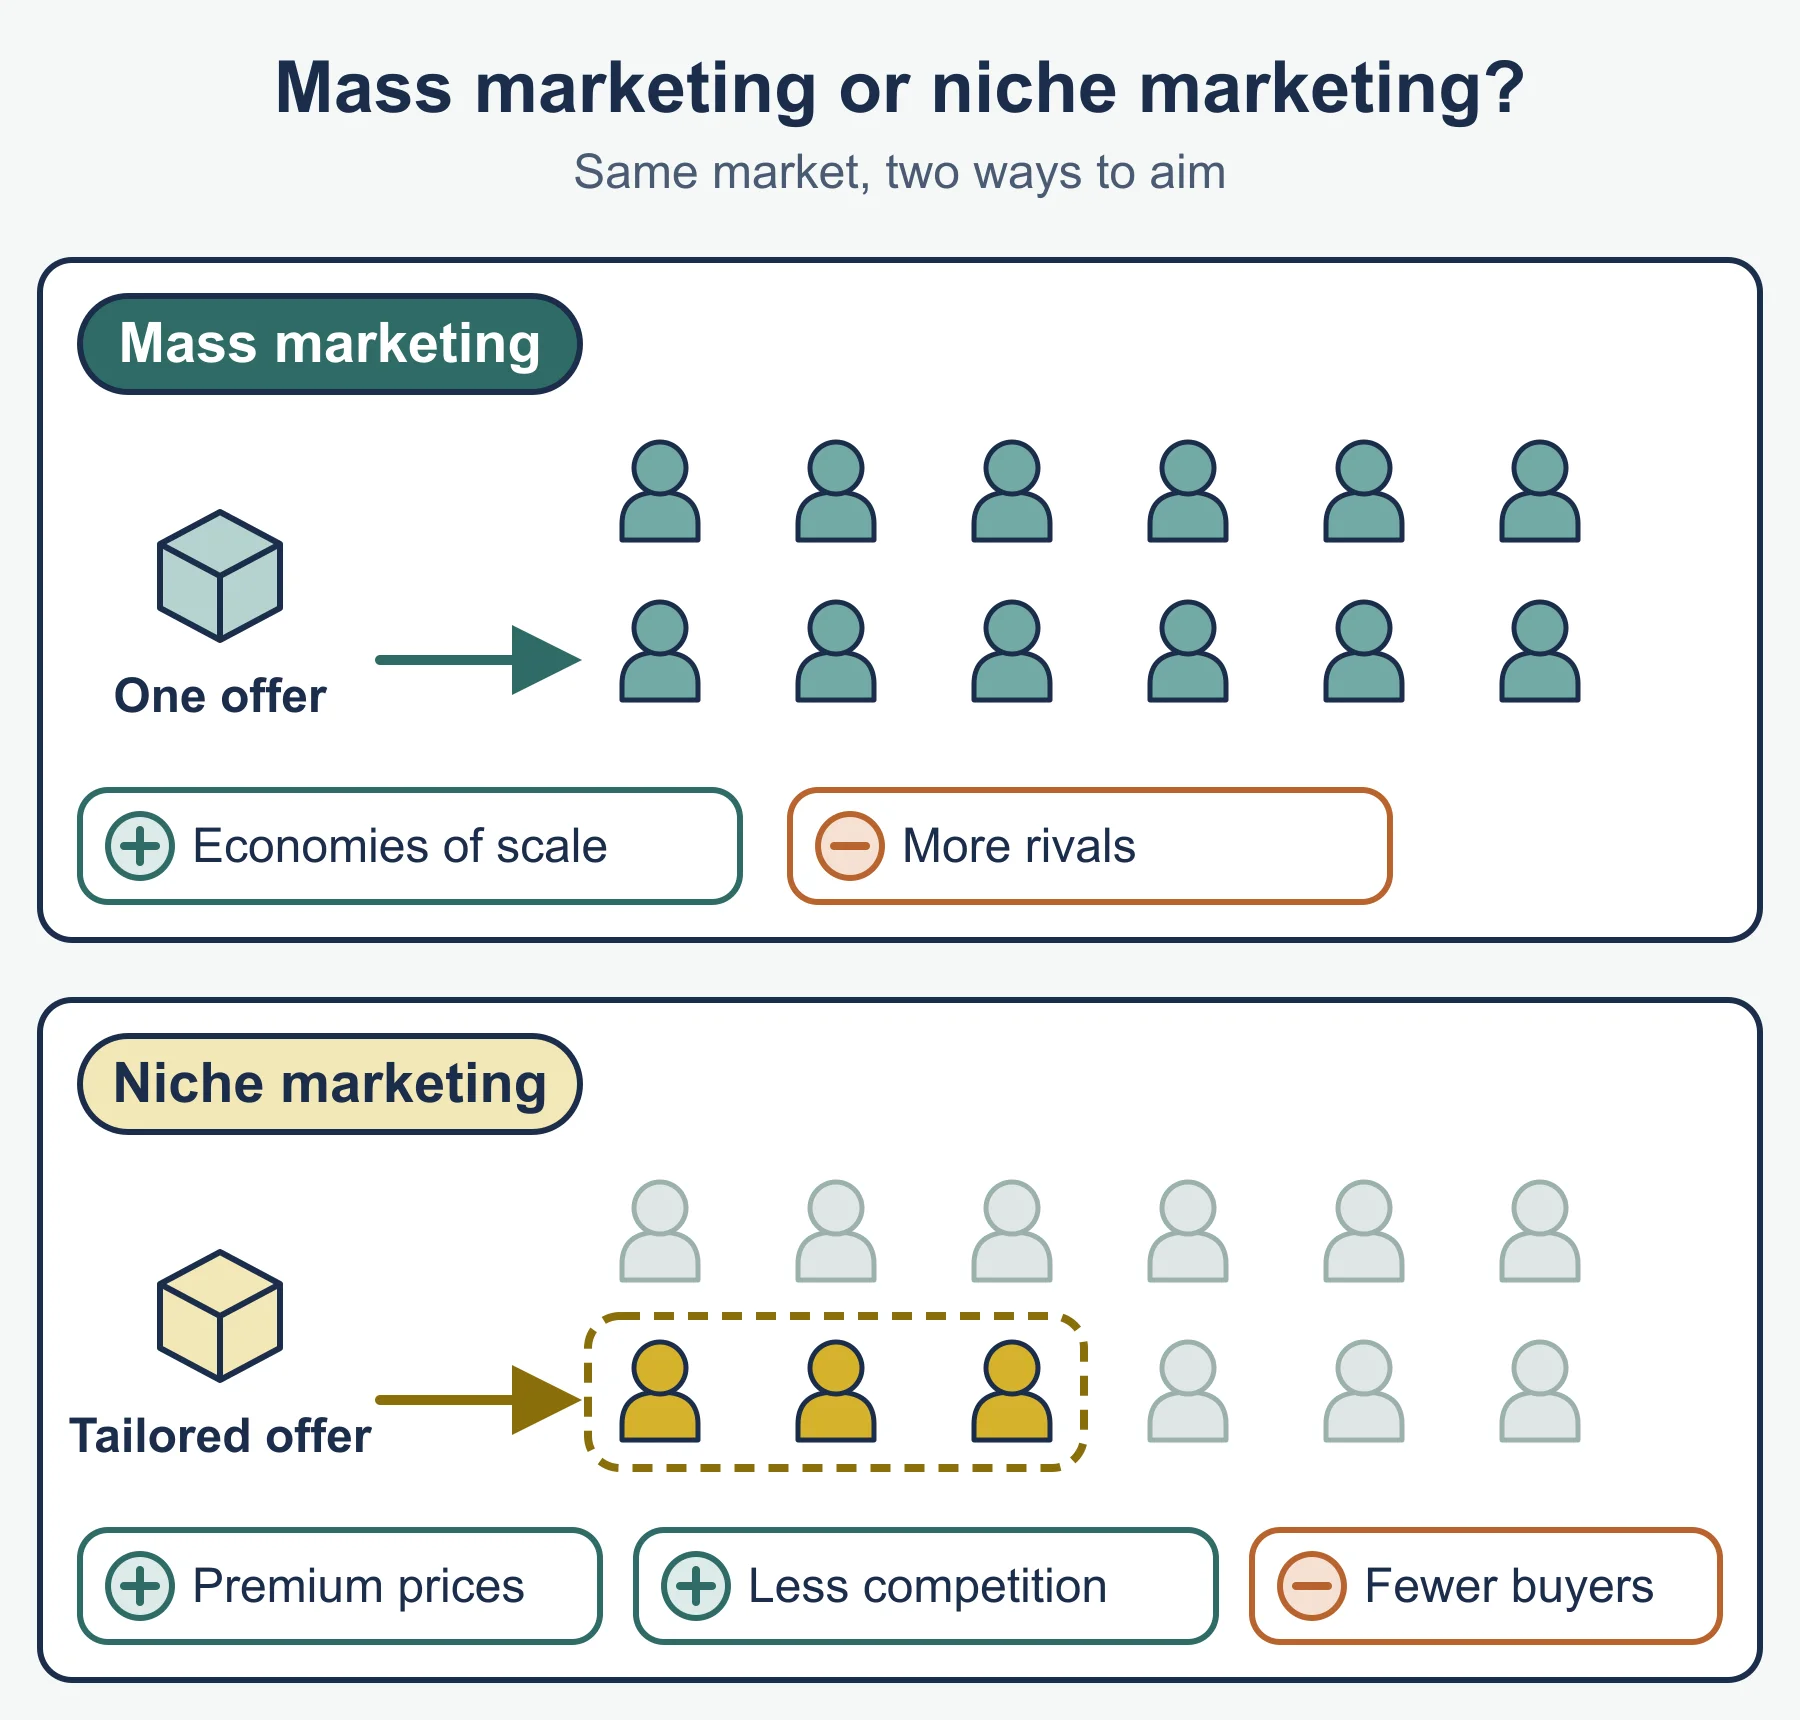
| Mass market | Large number of customers, standardised product, competitive pricing |
| Niche market | Small, specialised segment; lower volume, often higher price |
| Market size | Total sales of all firms, by value or volume |
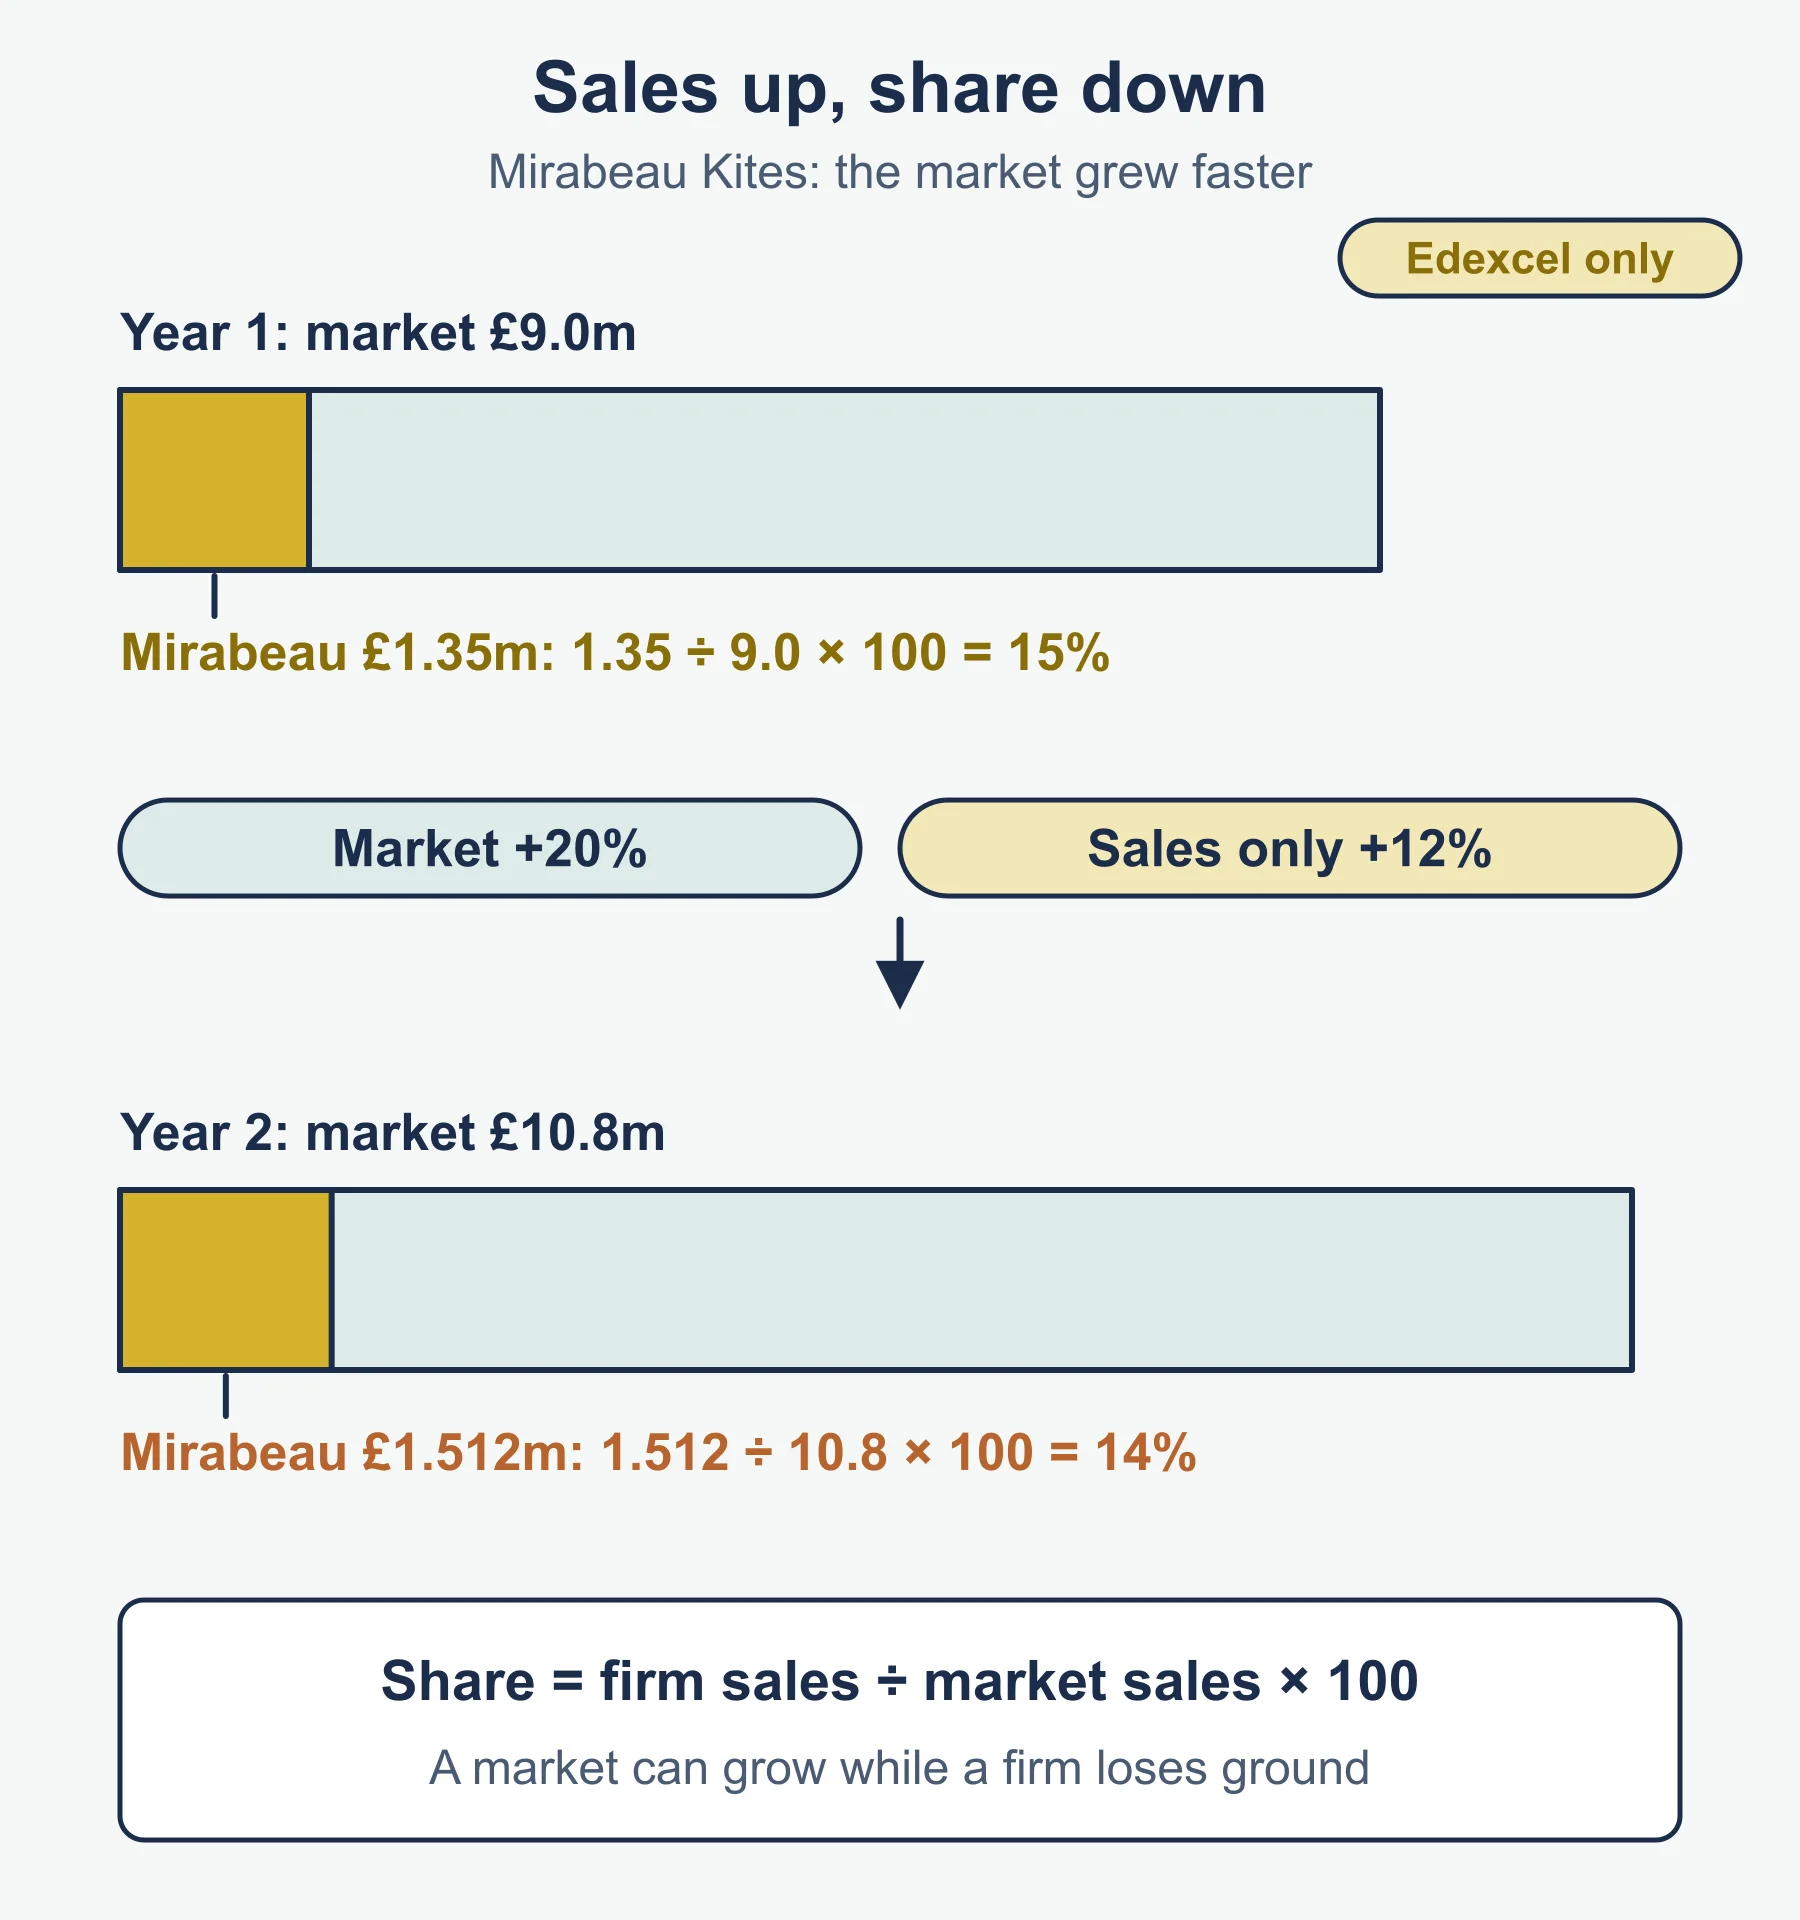
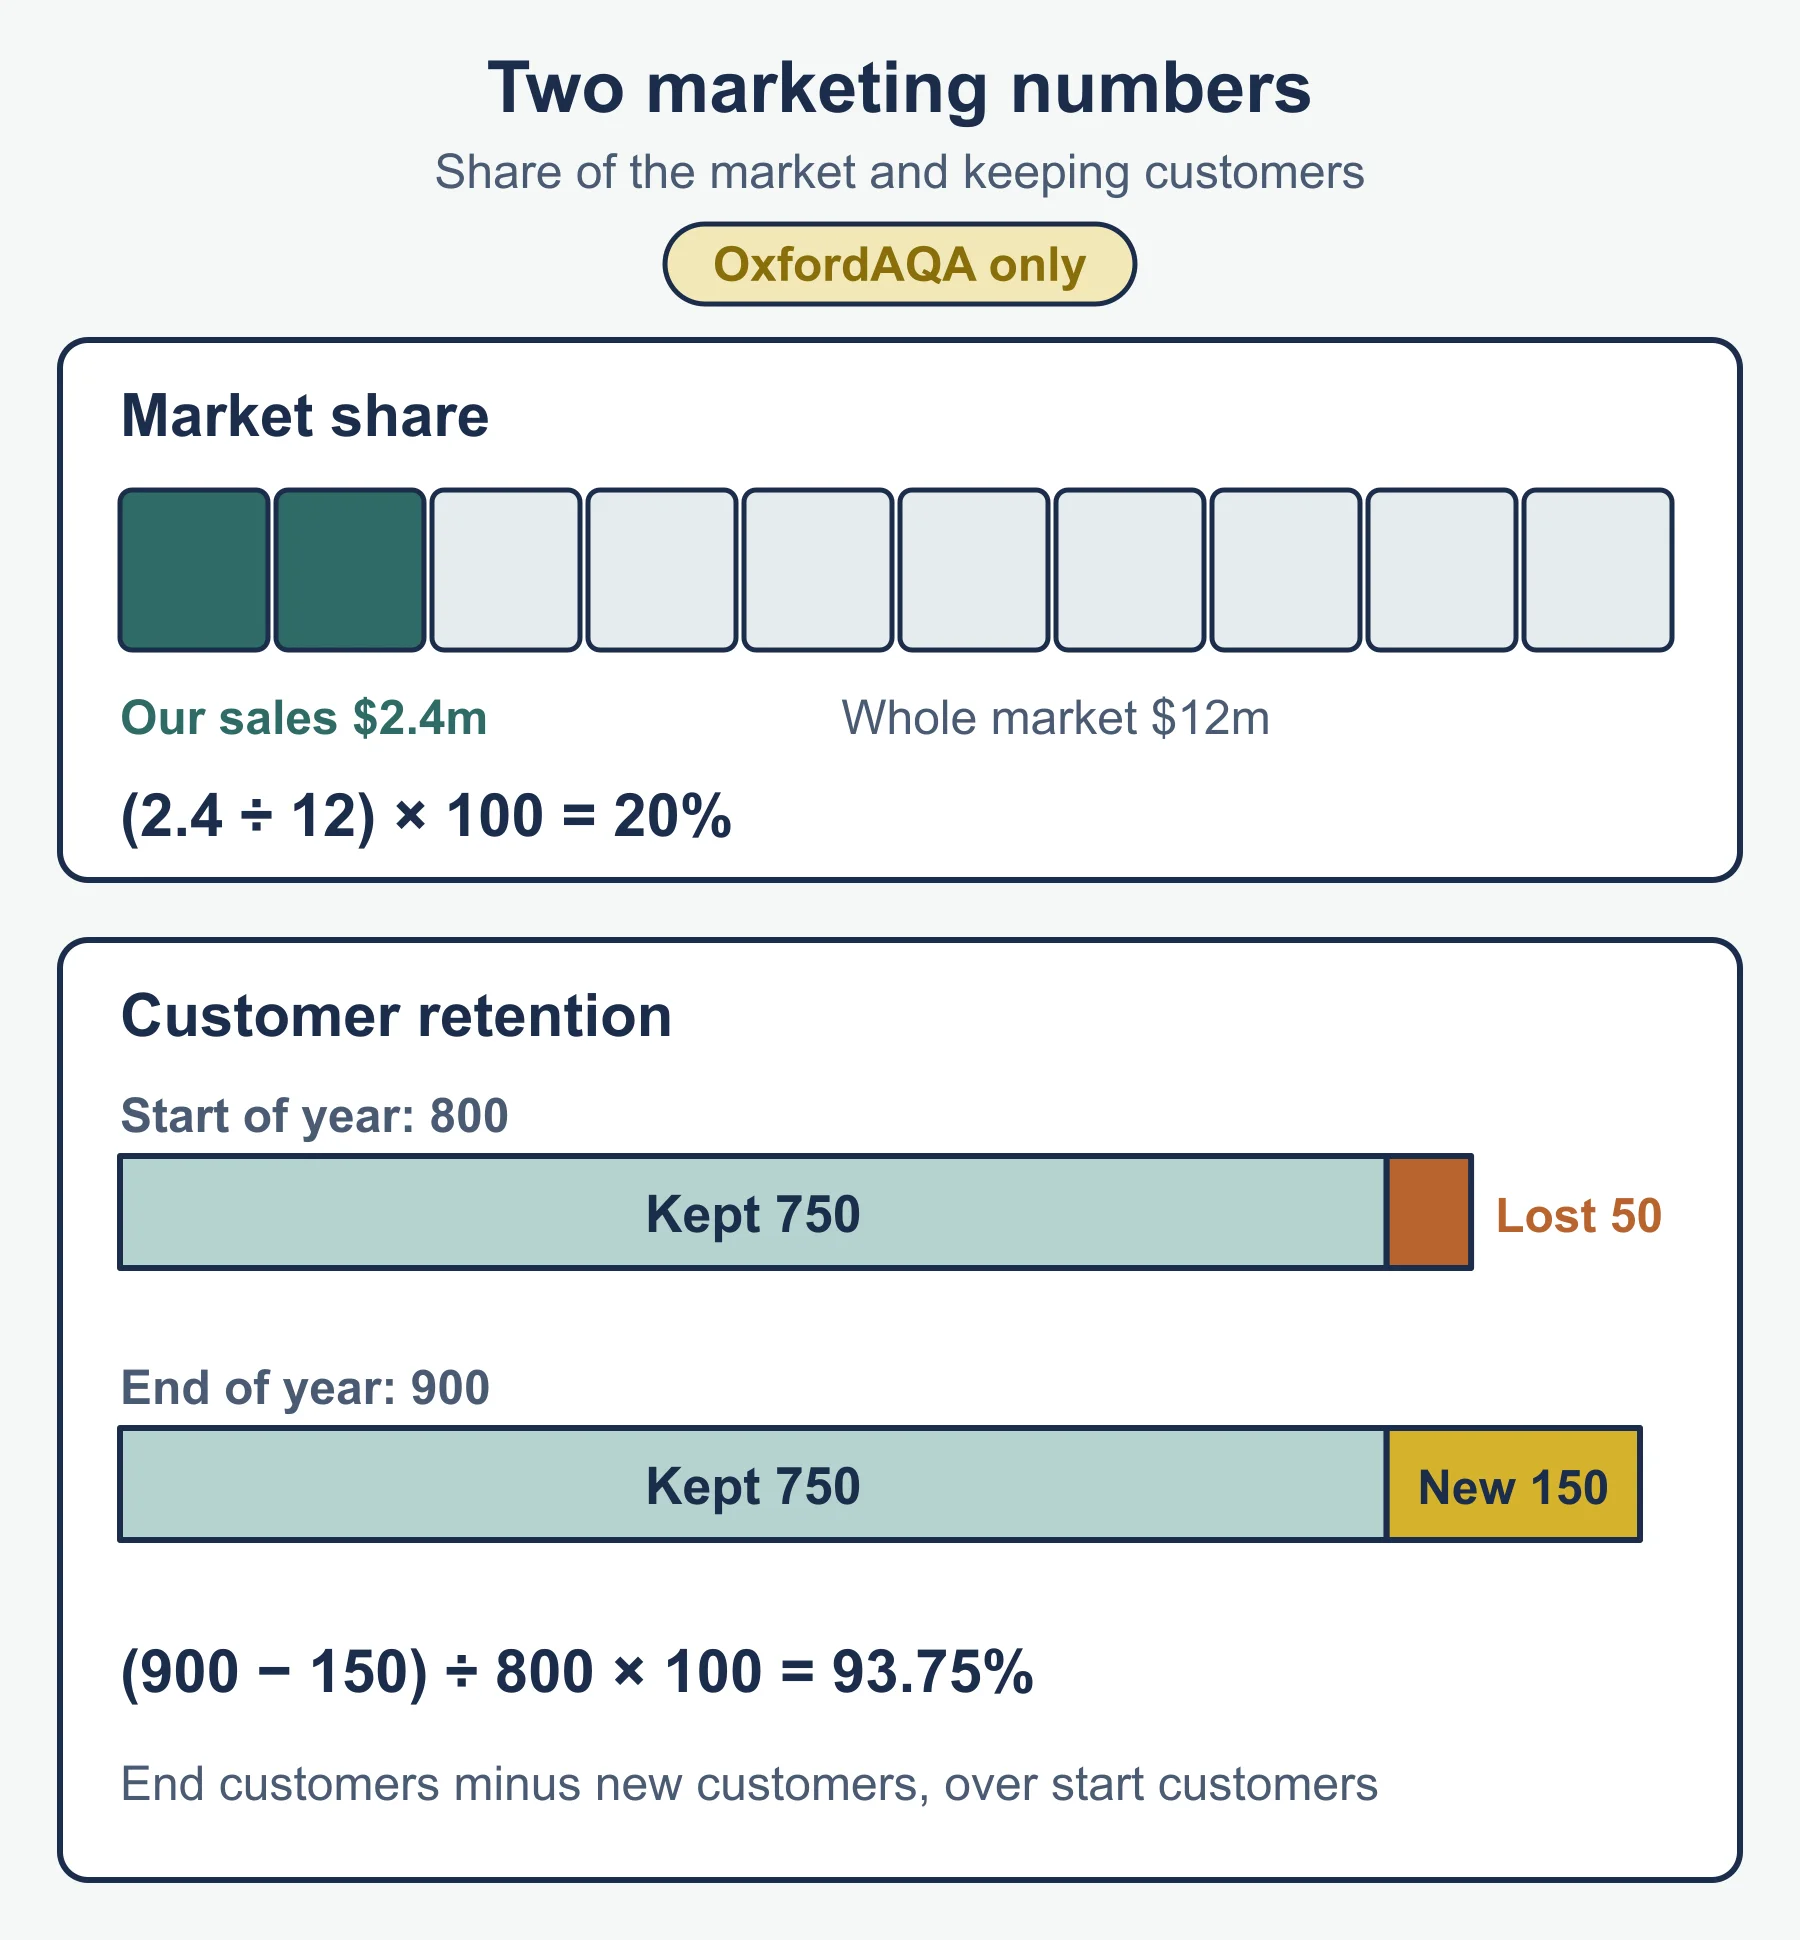
| Market share | A firm’s sales as a percentage of market size |
| Brand | Name, symbol or image that identifies and differentiates a product |
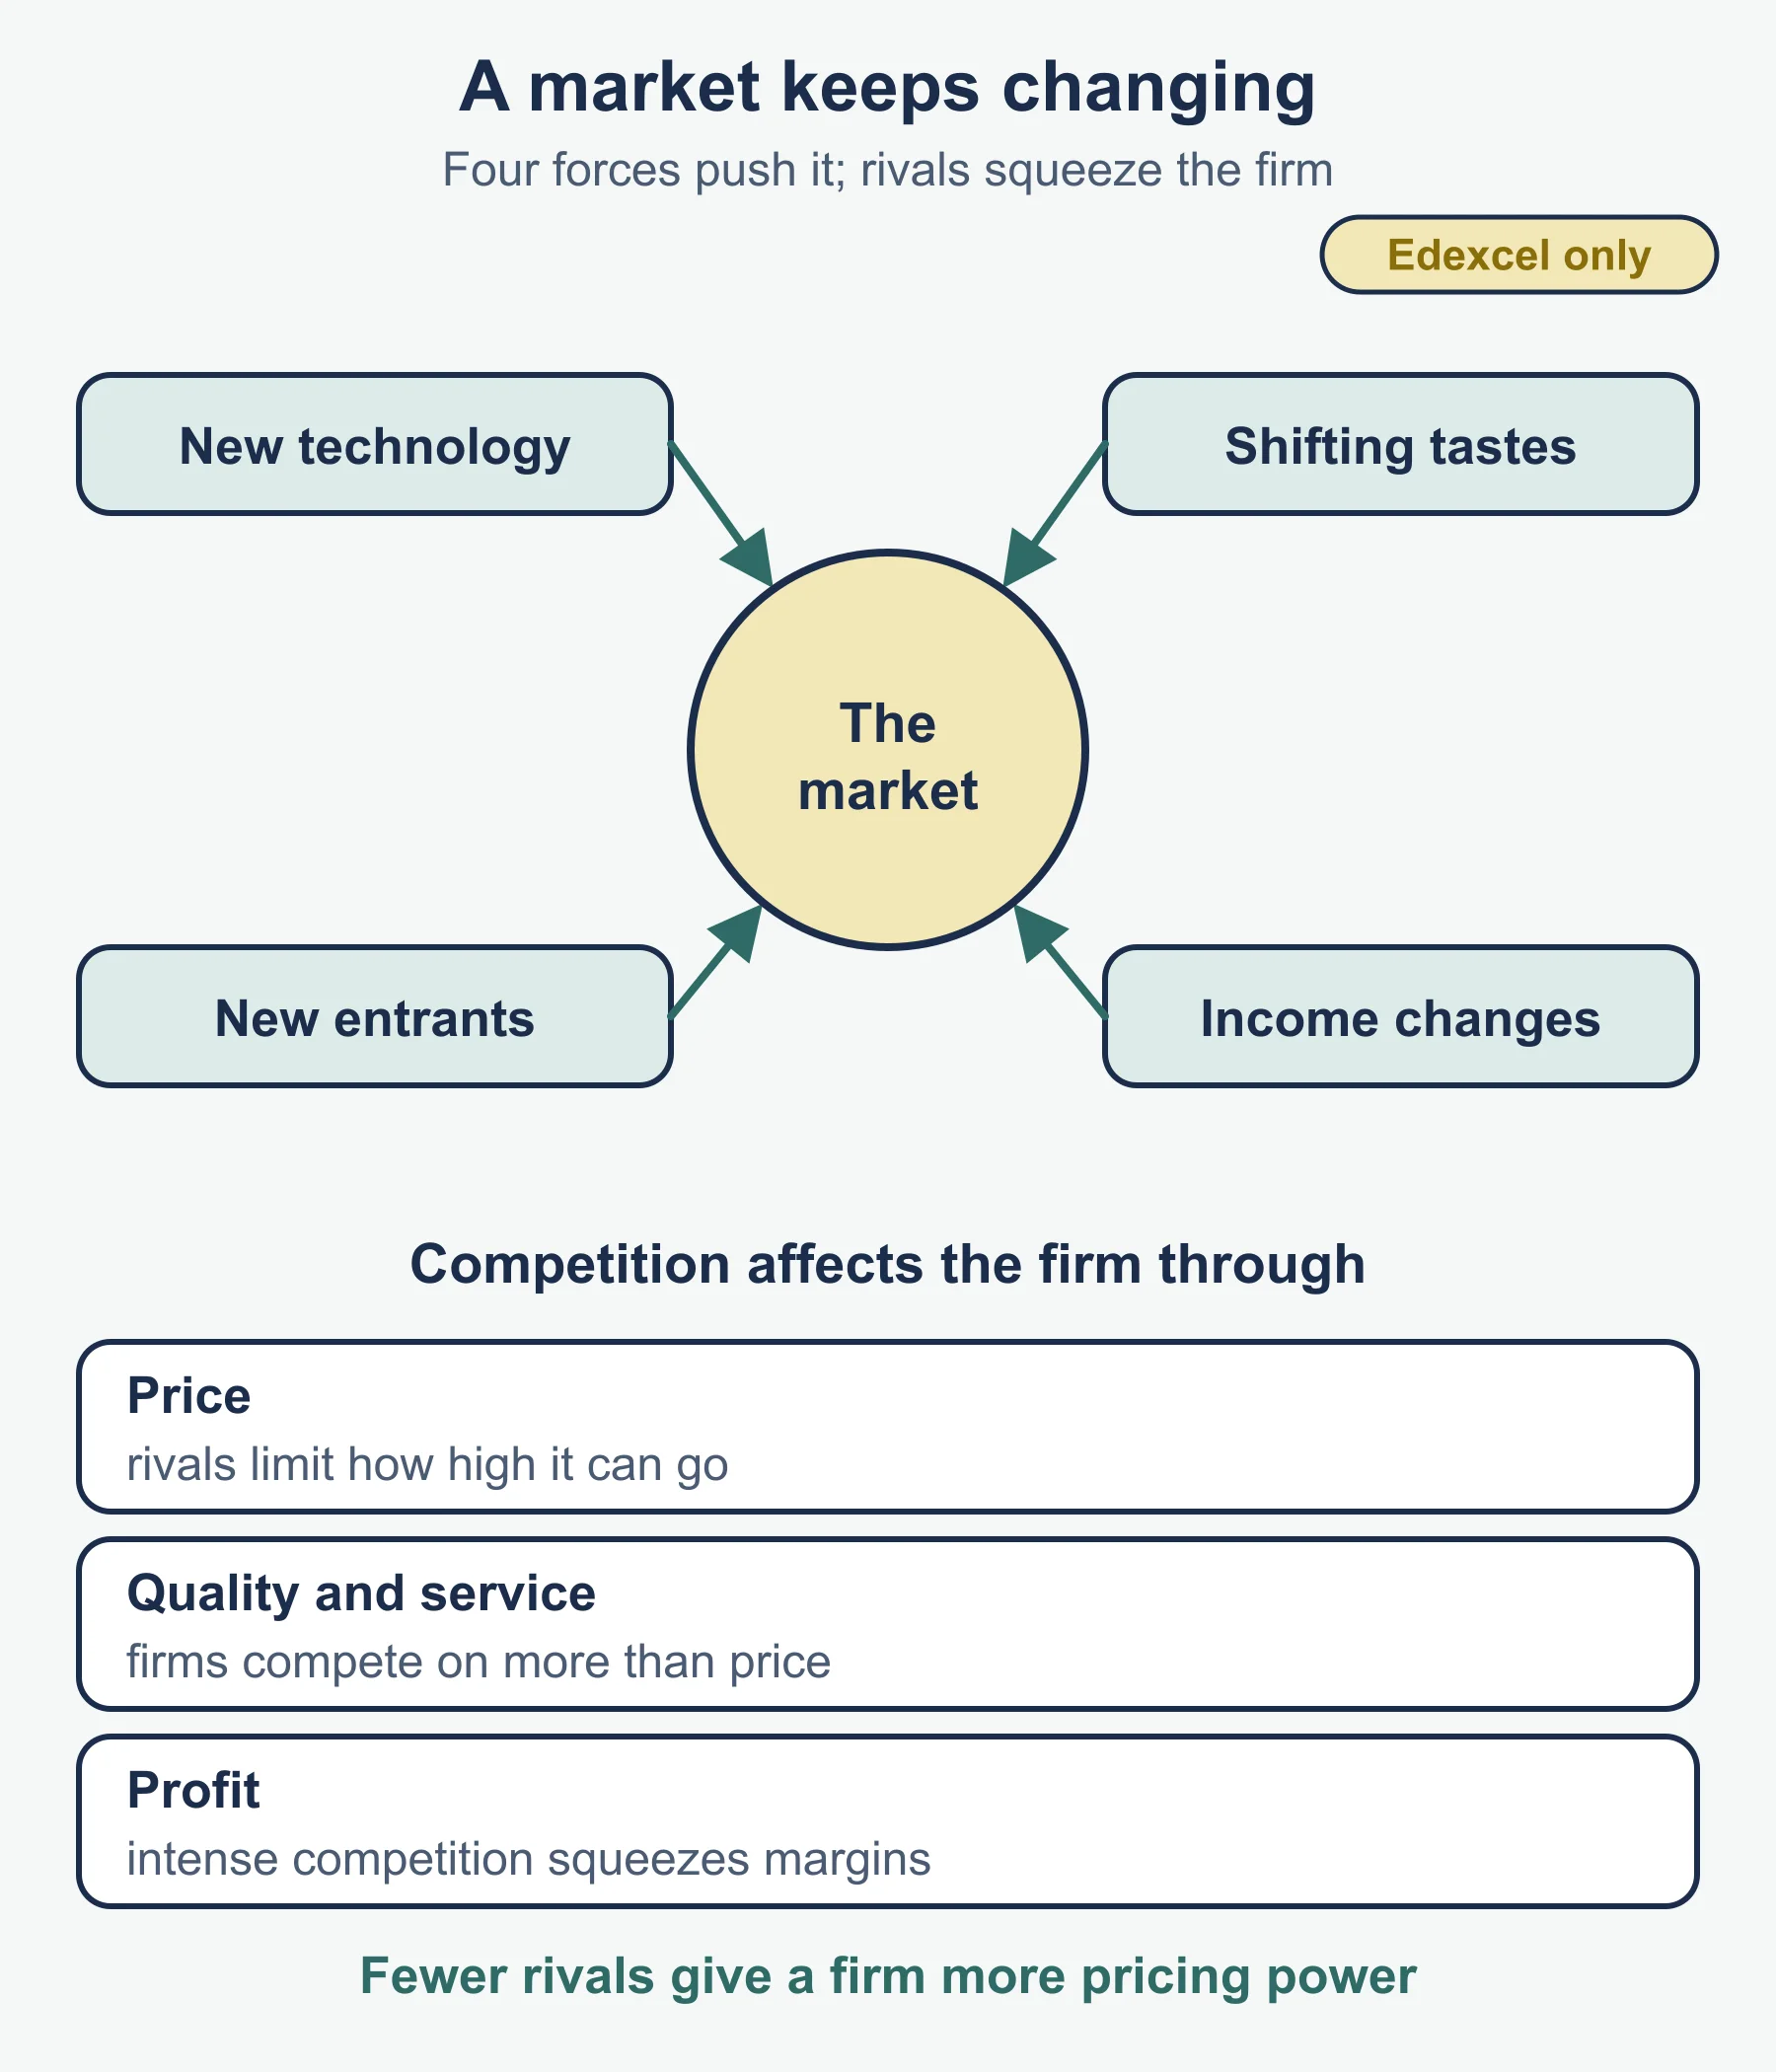
| Dynamic market | One that changes through technology, tastes, entrants and online selling |
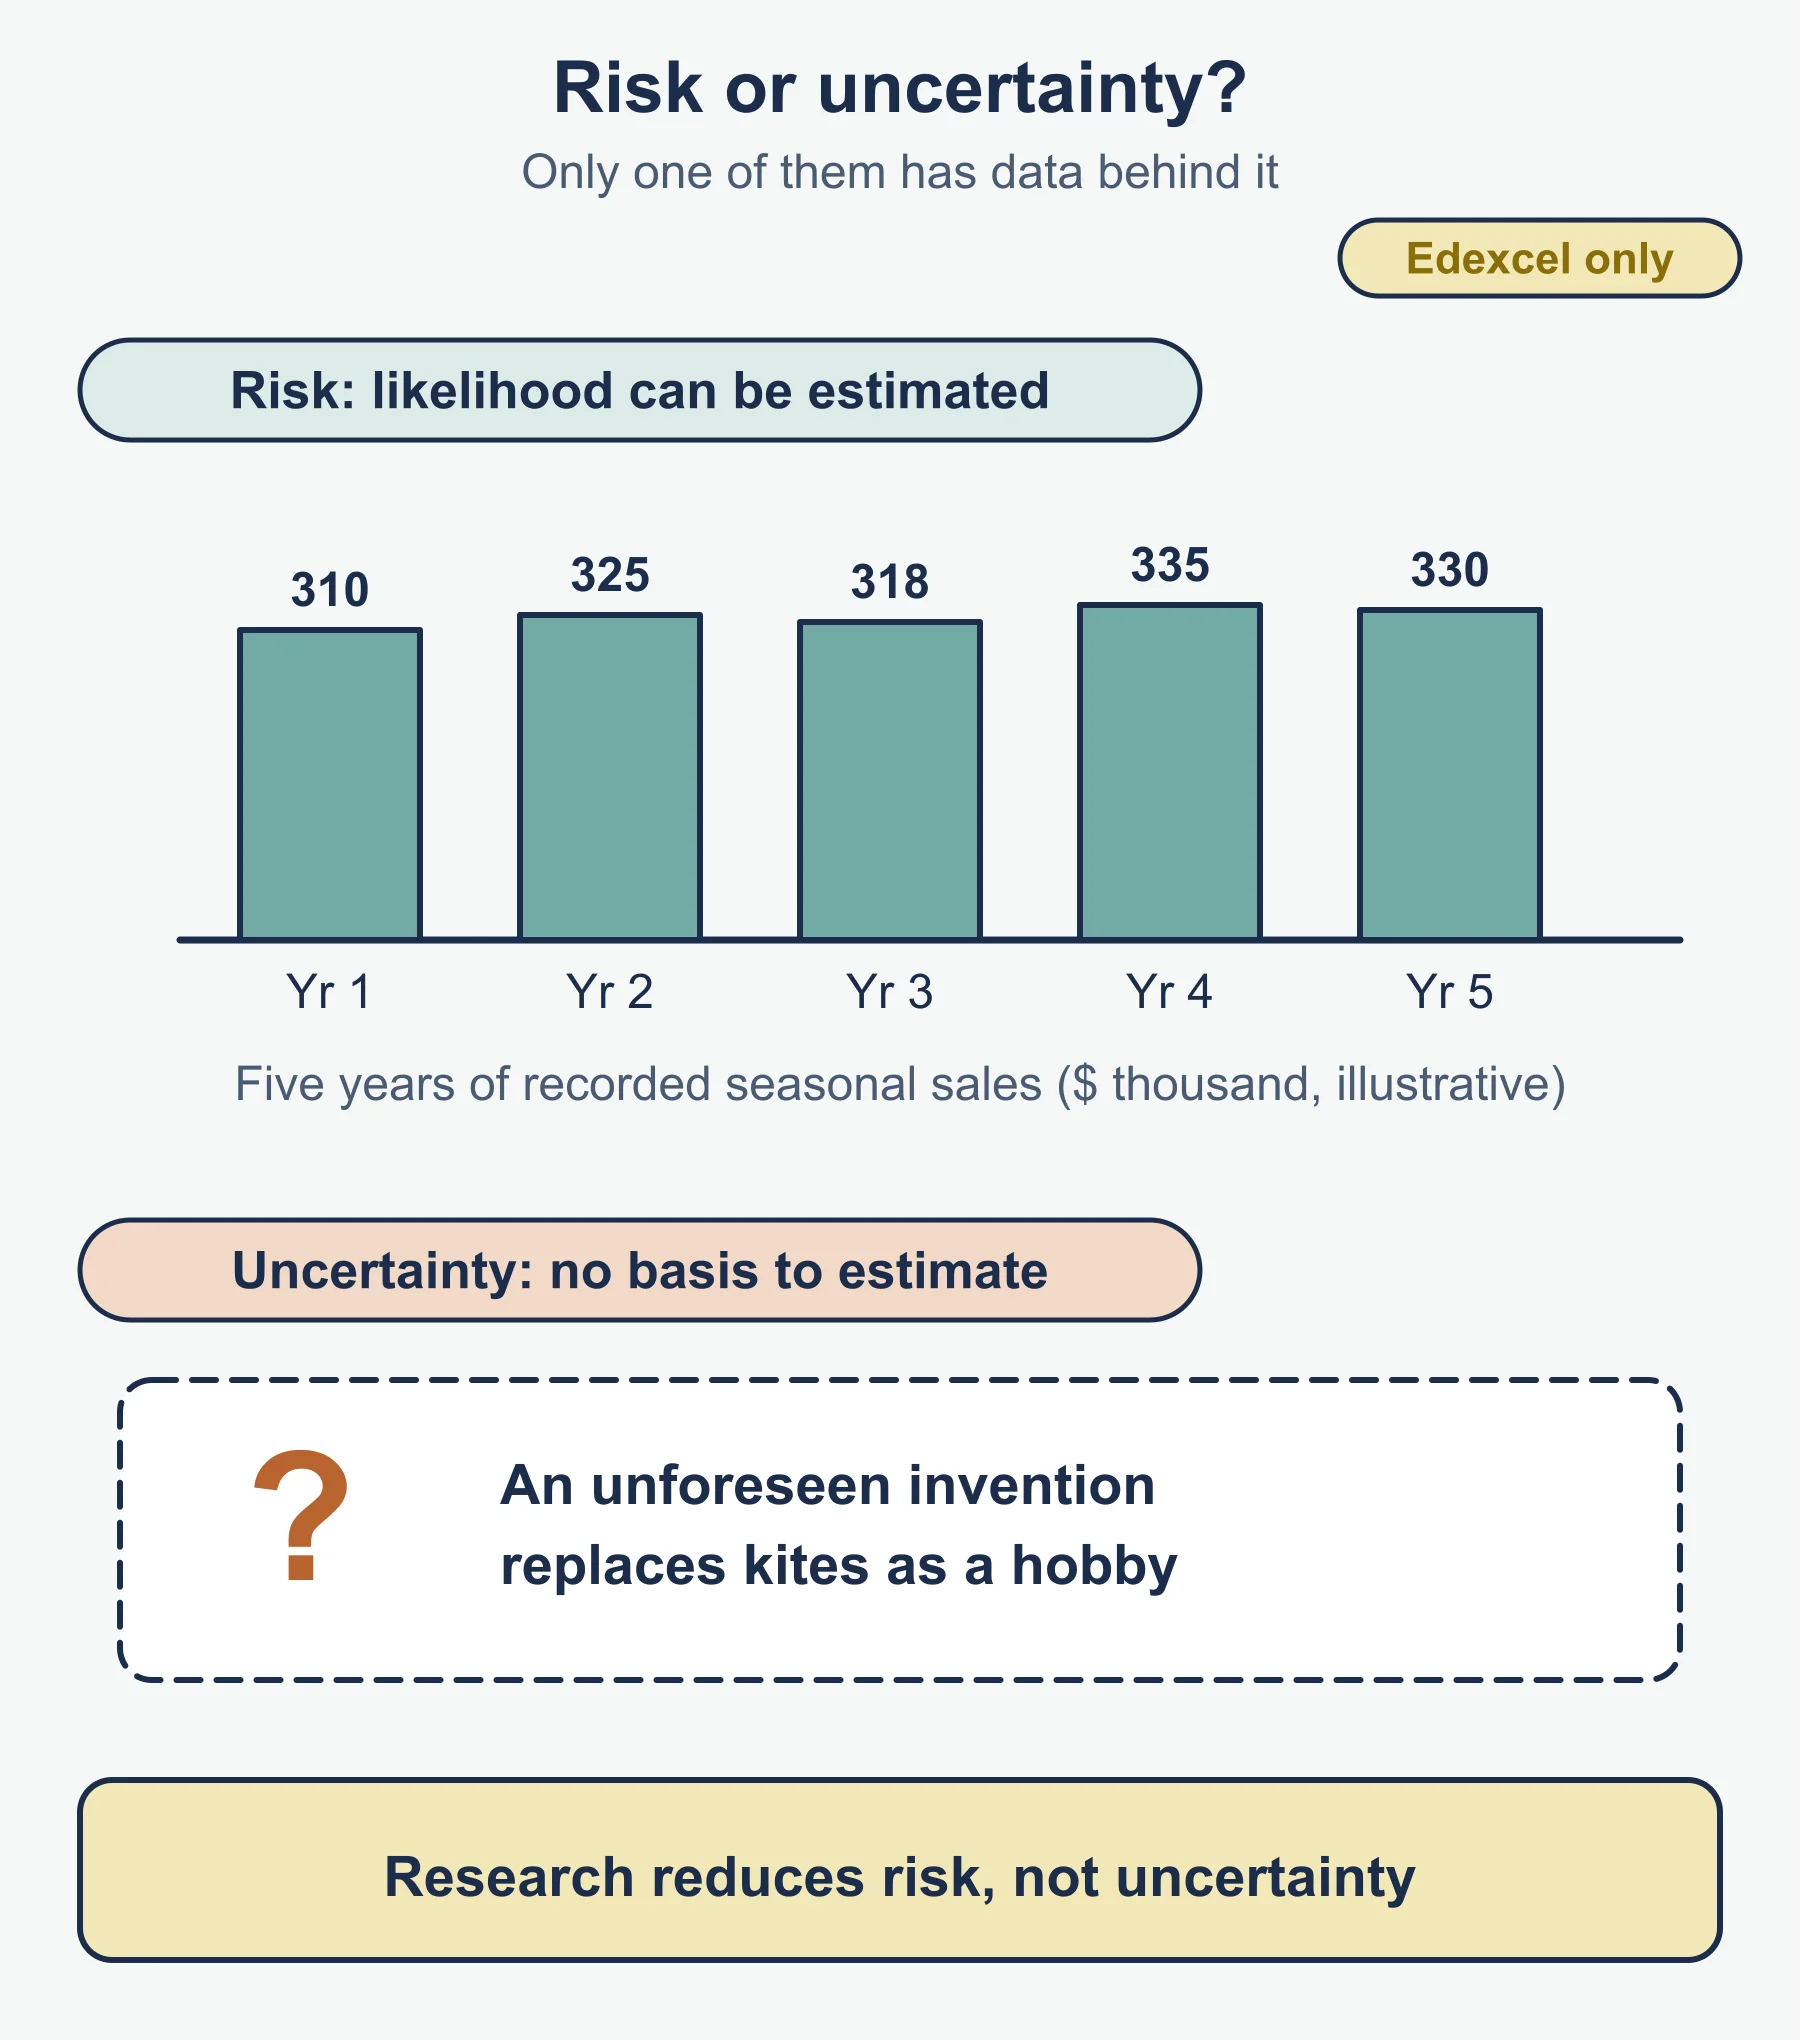
| Risk | Outcome whose chance can be estimated from data |
| Uncertainty | Outcome whose chance cannot be reliably estimated |
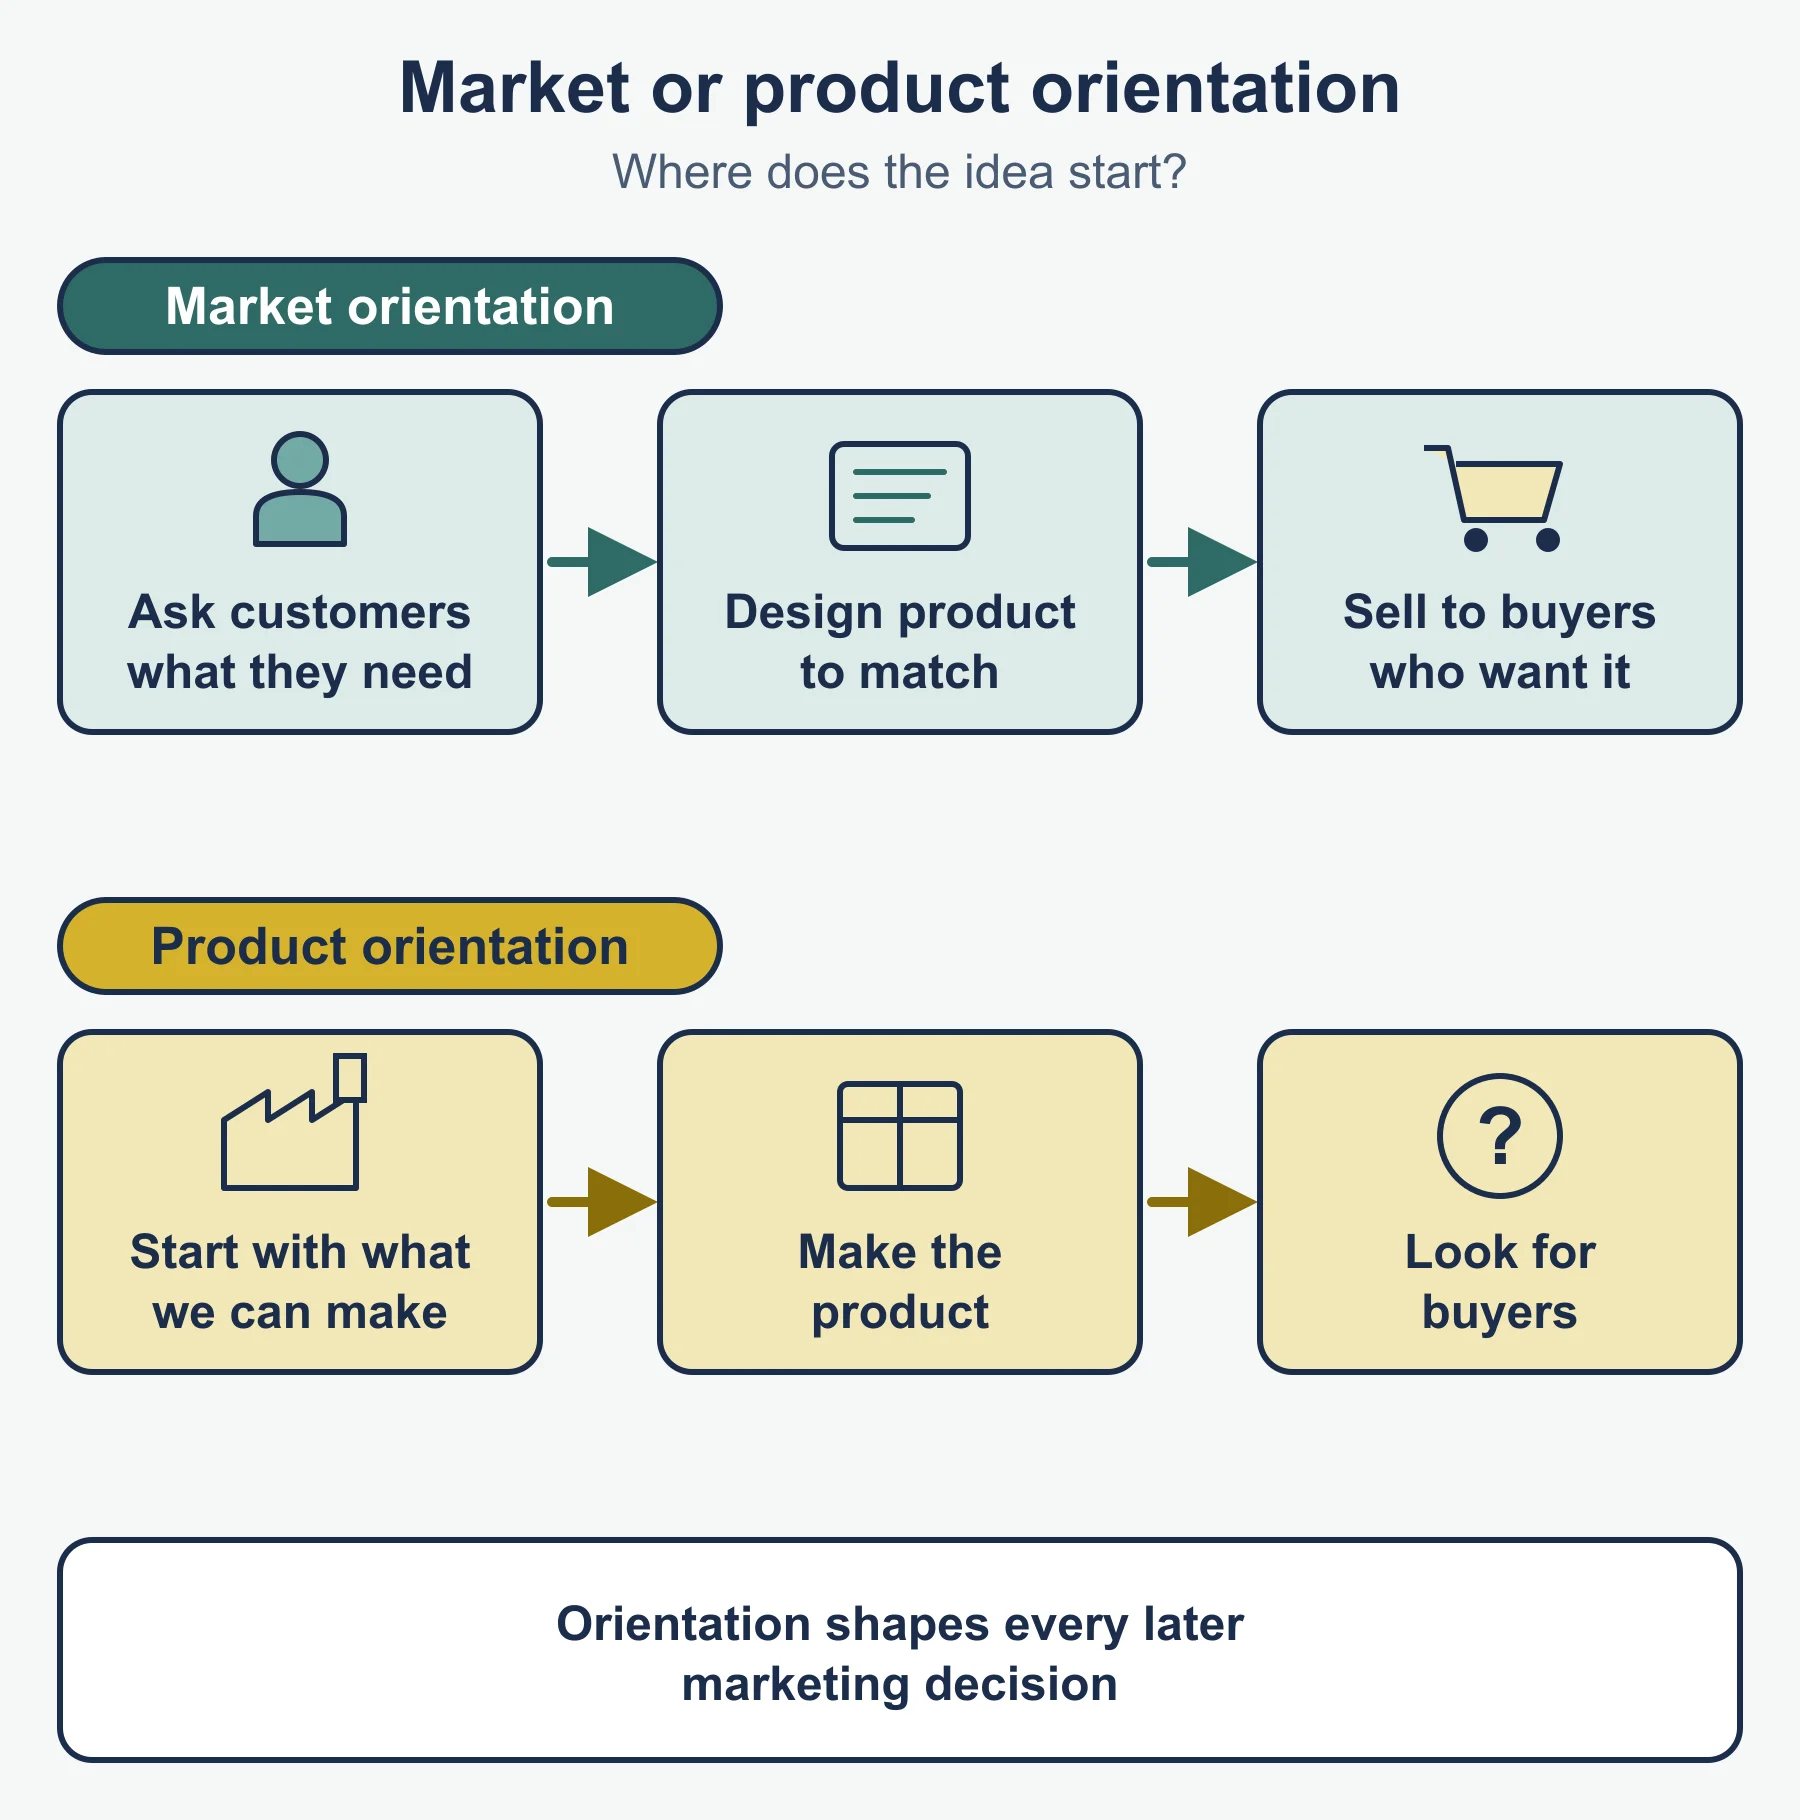
| Product orientation | Make what the firm can make, then find buyers |
| Market orientation | Find out what customers want, then make it |
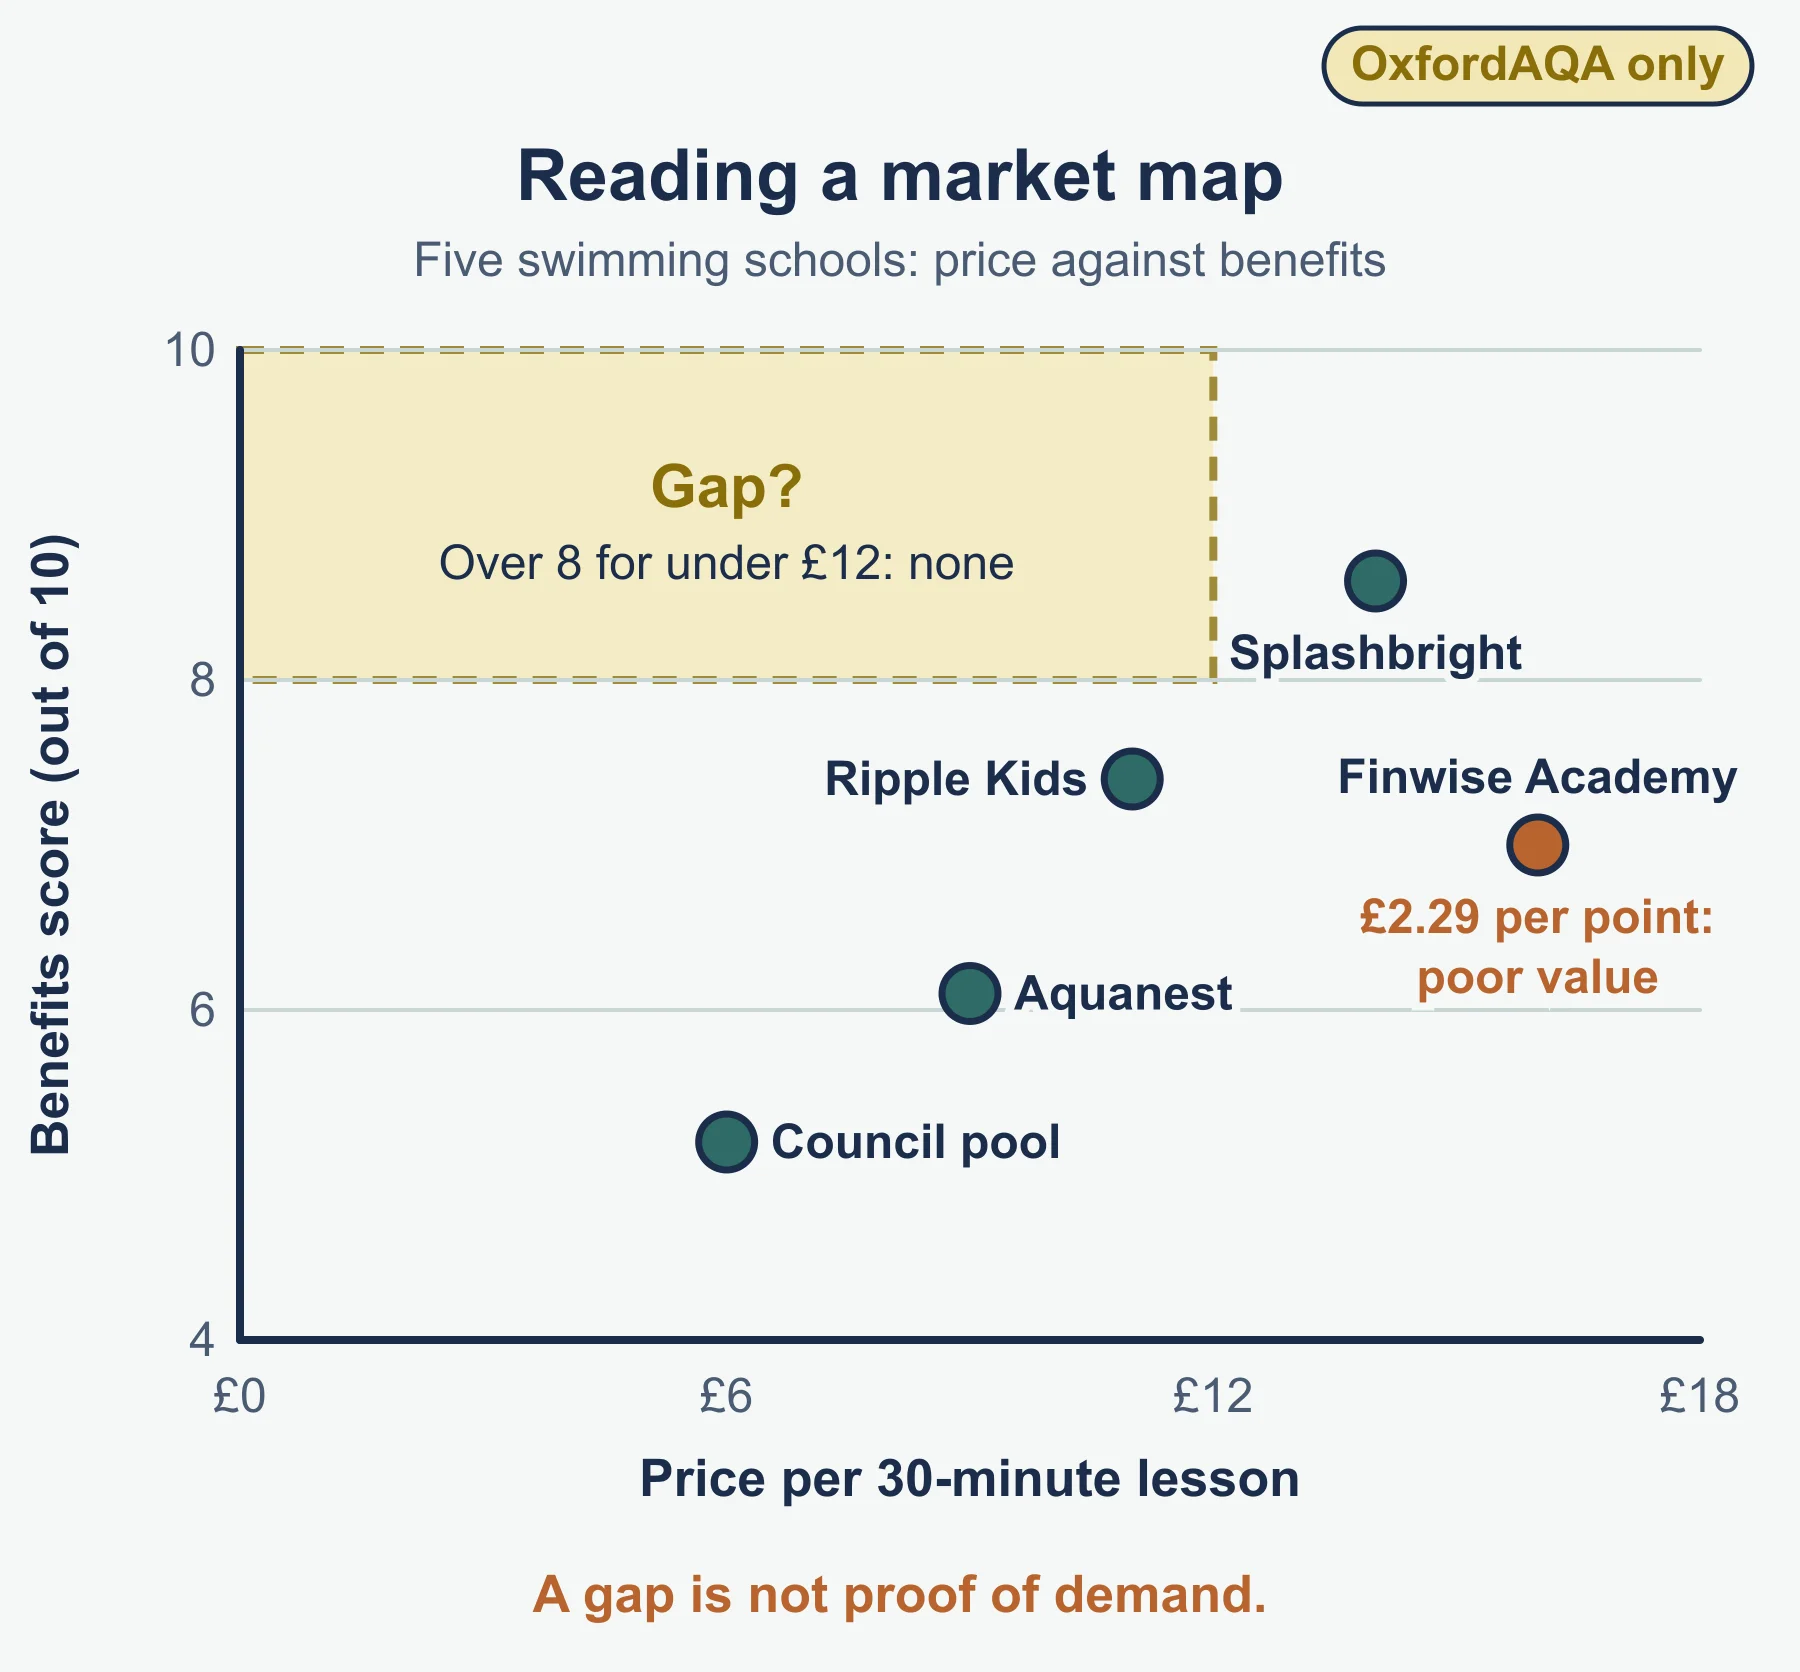
| Market map | Chart of competitors on two attributes, showing crowded areas and gaps |
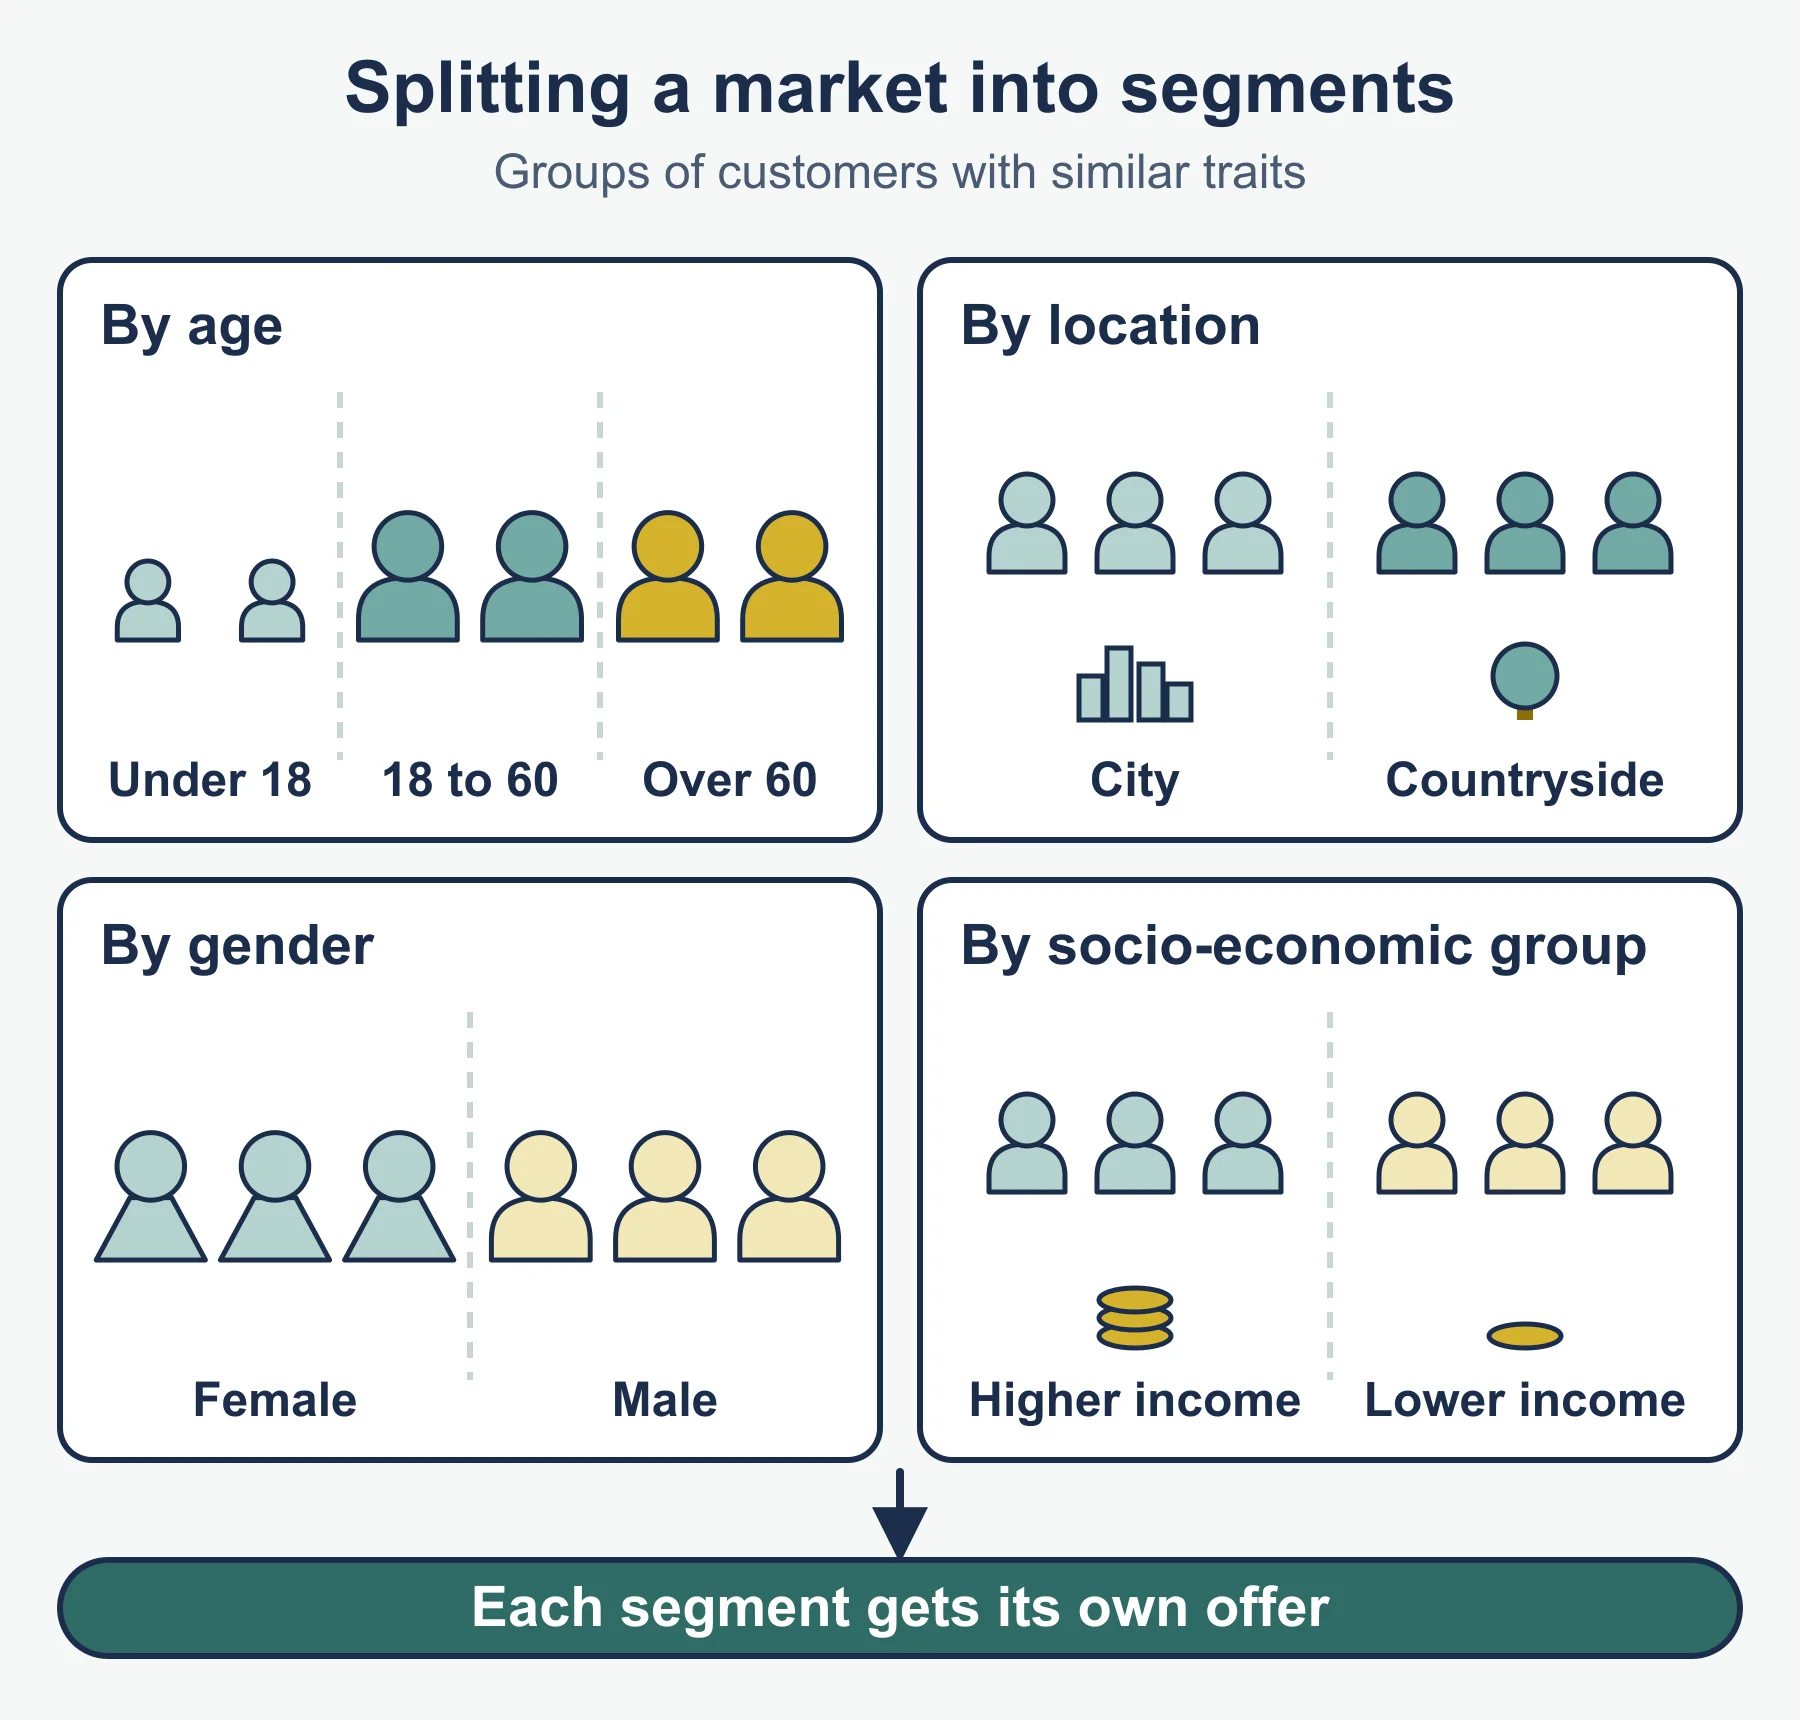
| Segmentation | Dividing a market into groups with similar characteristics or needs |
| Competitive advantage | Something that lets a firm outperform rivals persistently |
| Differentiation | Making a product distinct so it is not a pure price comparison |
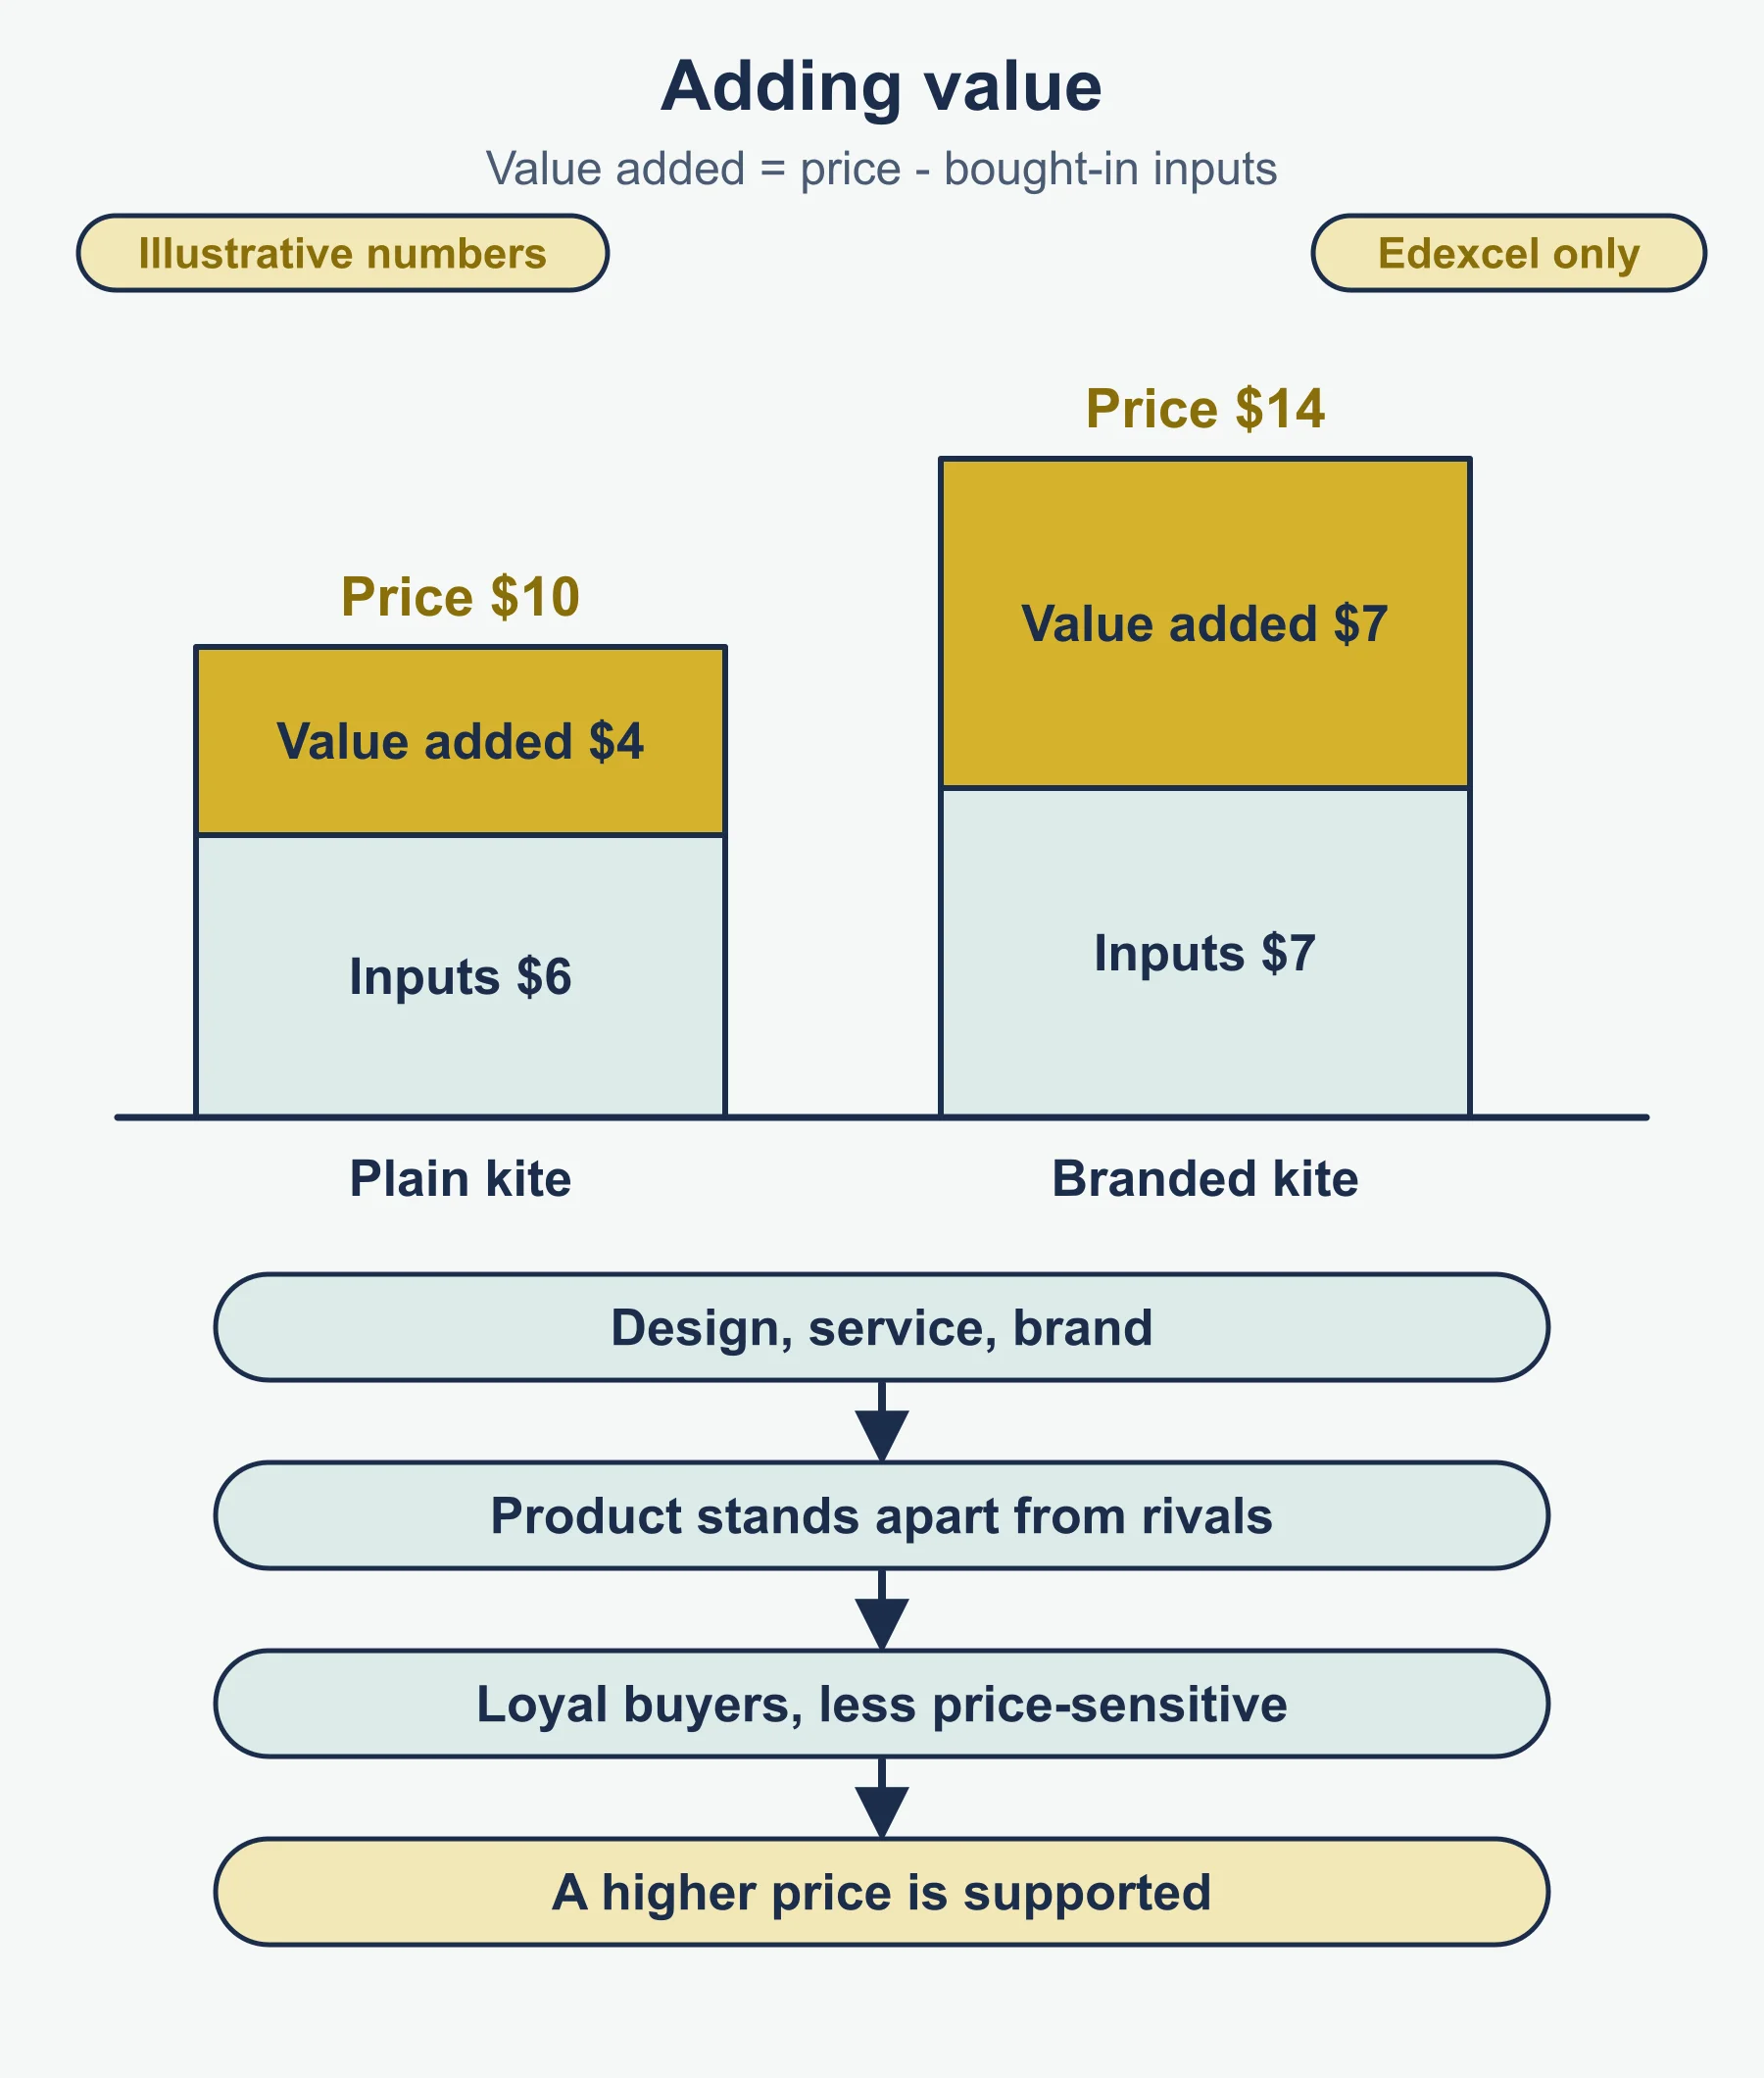
| Adding value | Raising the gap between input cost and selling price |
Formulas (standard forms)
| Measure | Formula |
|---|---|
| Market share | firm’s sales / total market sales x 100 |
| Market growth | change in market / original market x 100 |
| PED | % change in quantity demanded / % change in price |
| YED | % change in quantity demanded / % change in income |
| Percentage change | (new - old) / old x 100 |
| Total revenue | price x quantity |
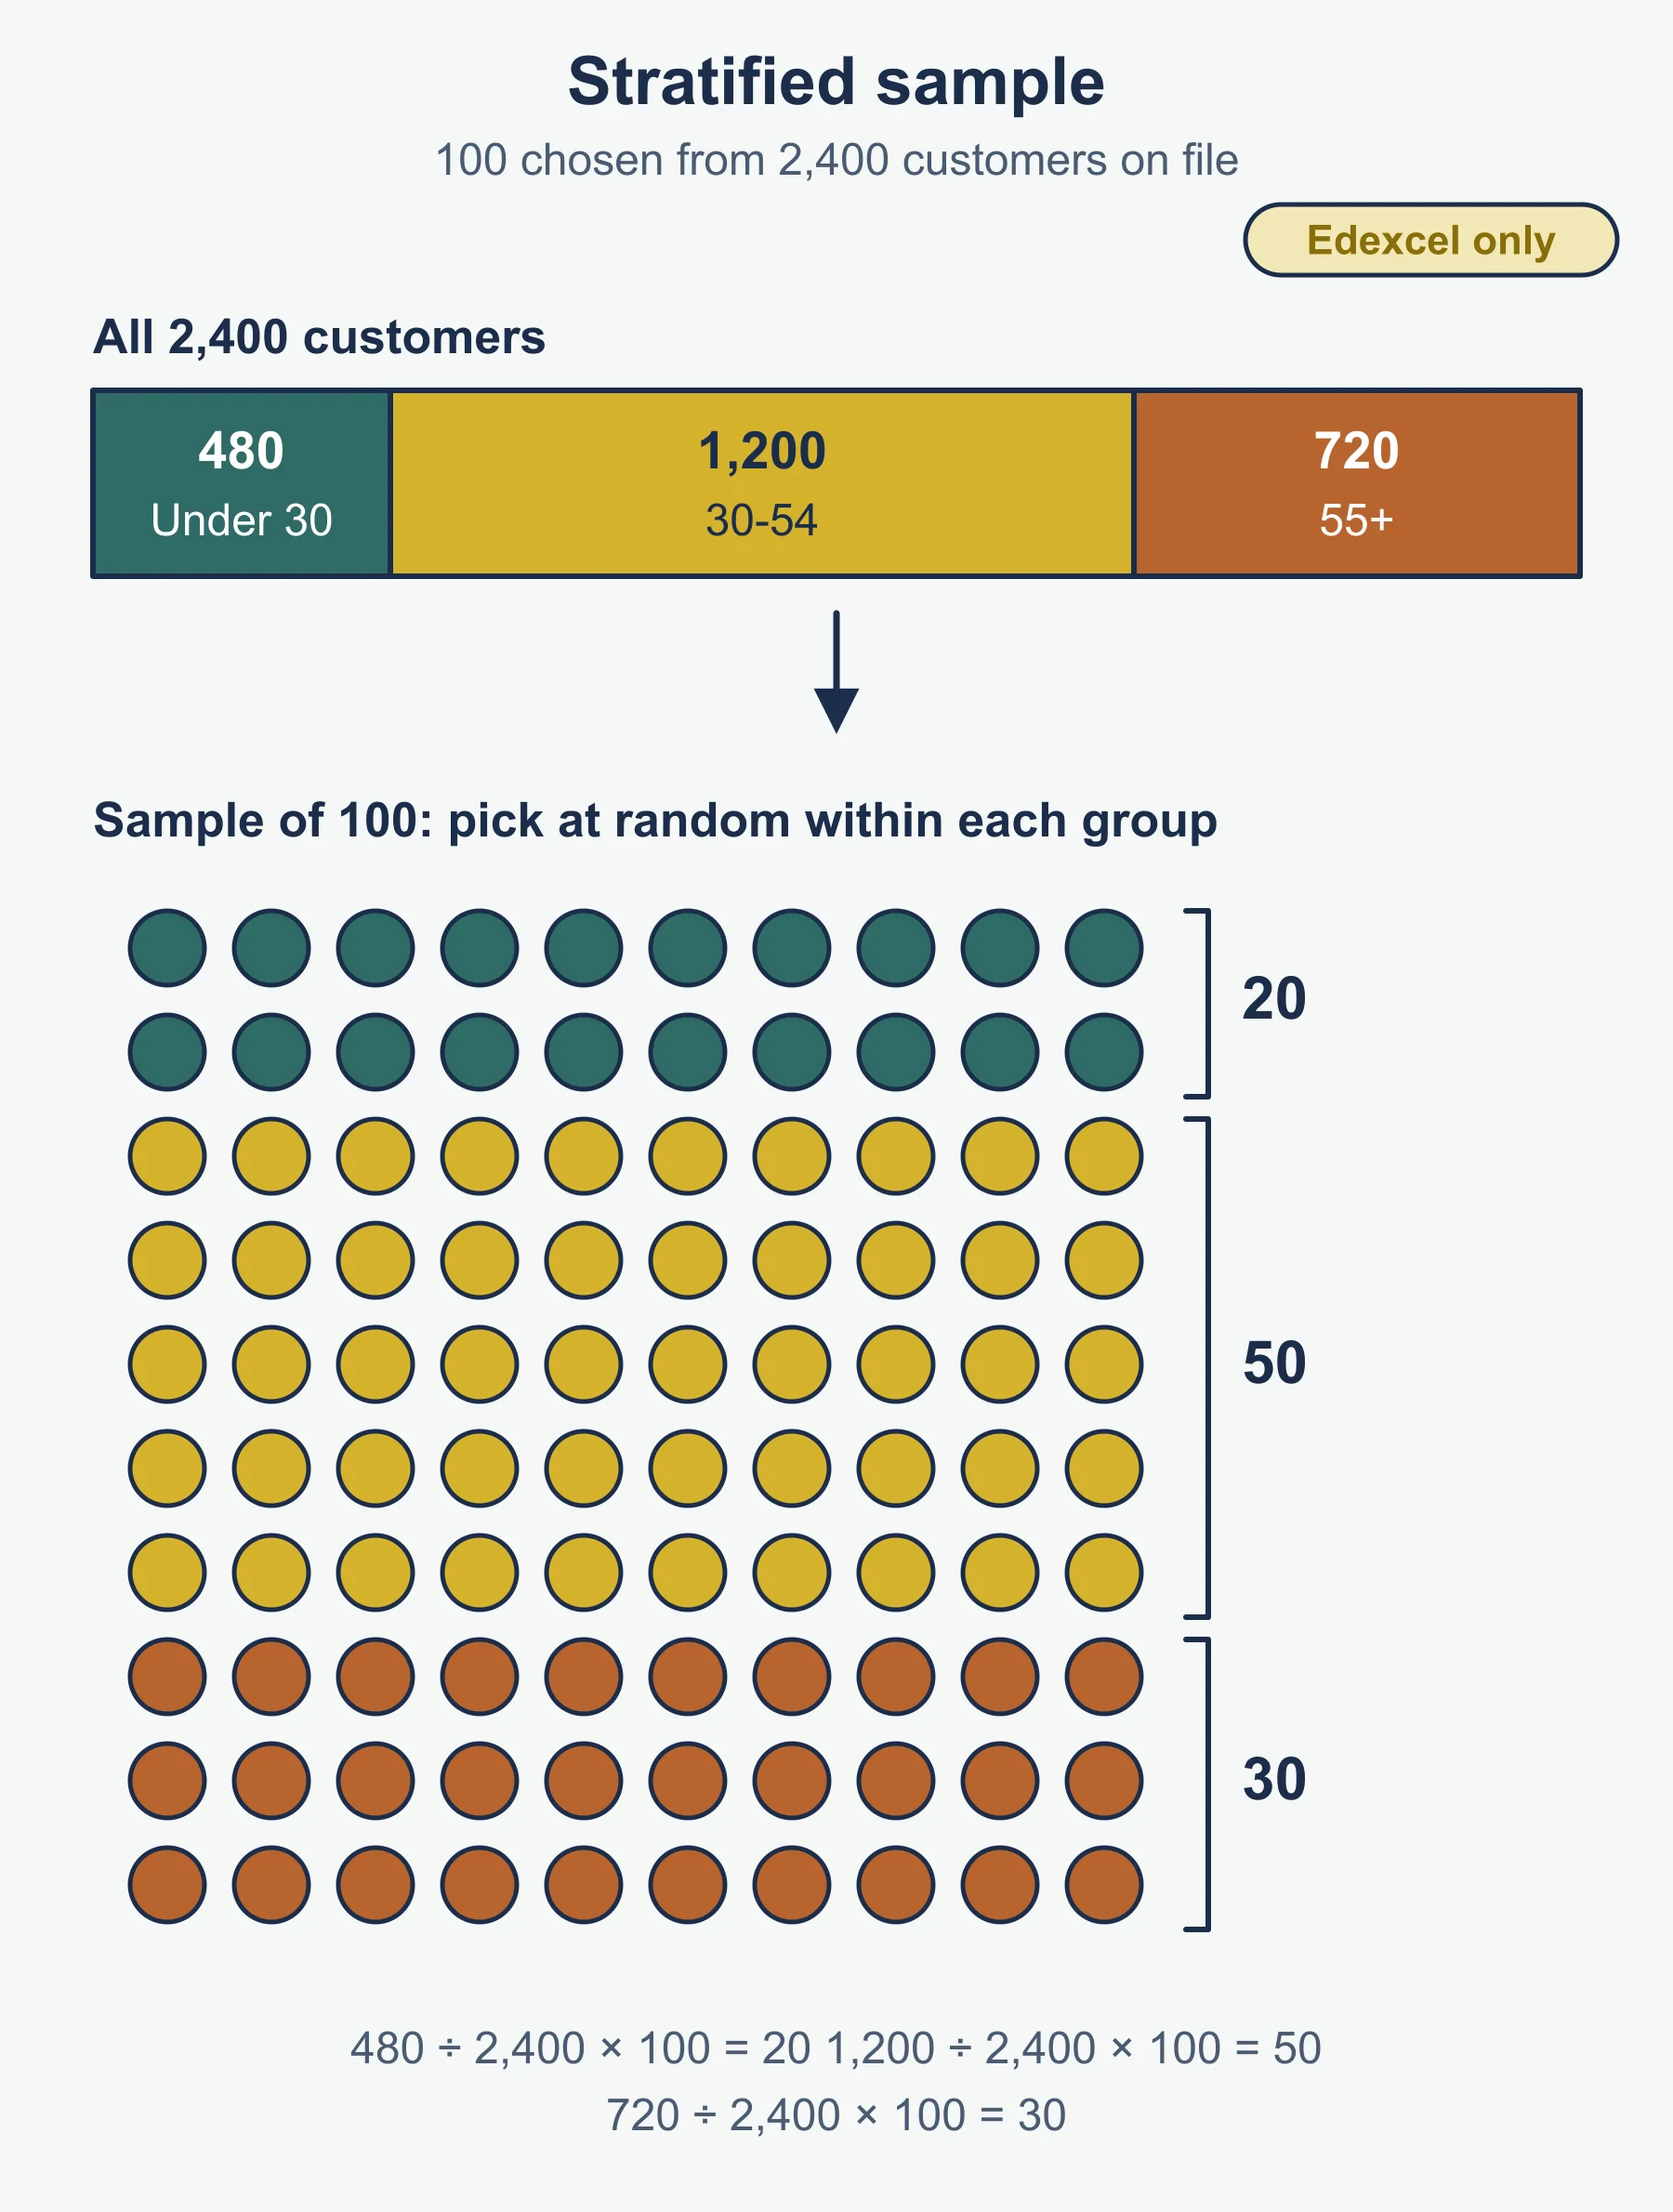
| Stratified sample for a group | group size / population x sample size |
Market research in brief
- Purposes: identify and anticipate needs and wants; quantify likely demand; gain insight into consumer behaviour.
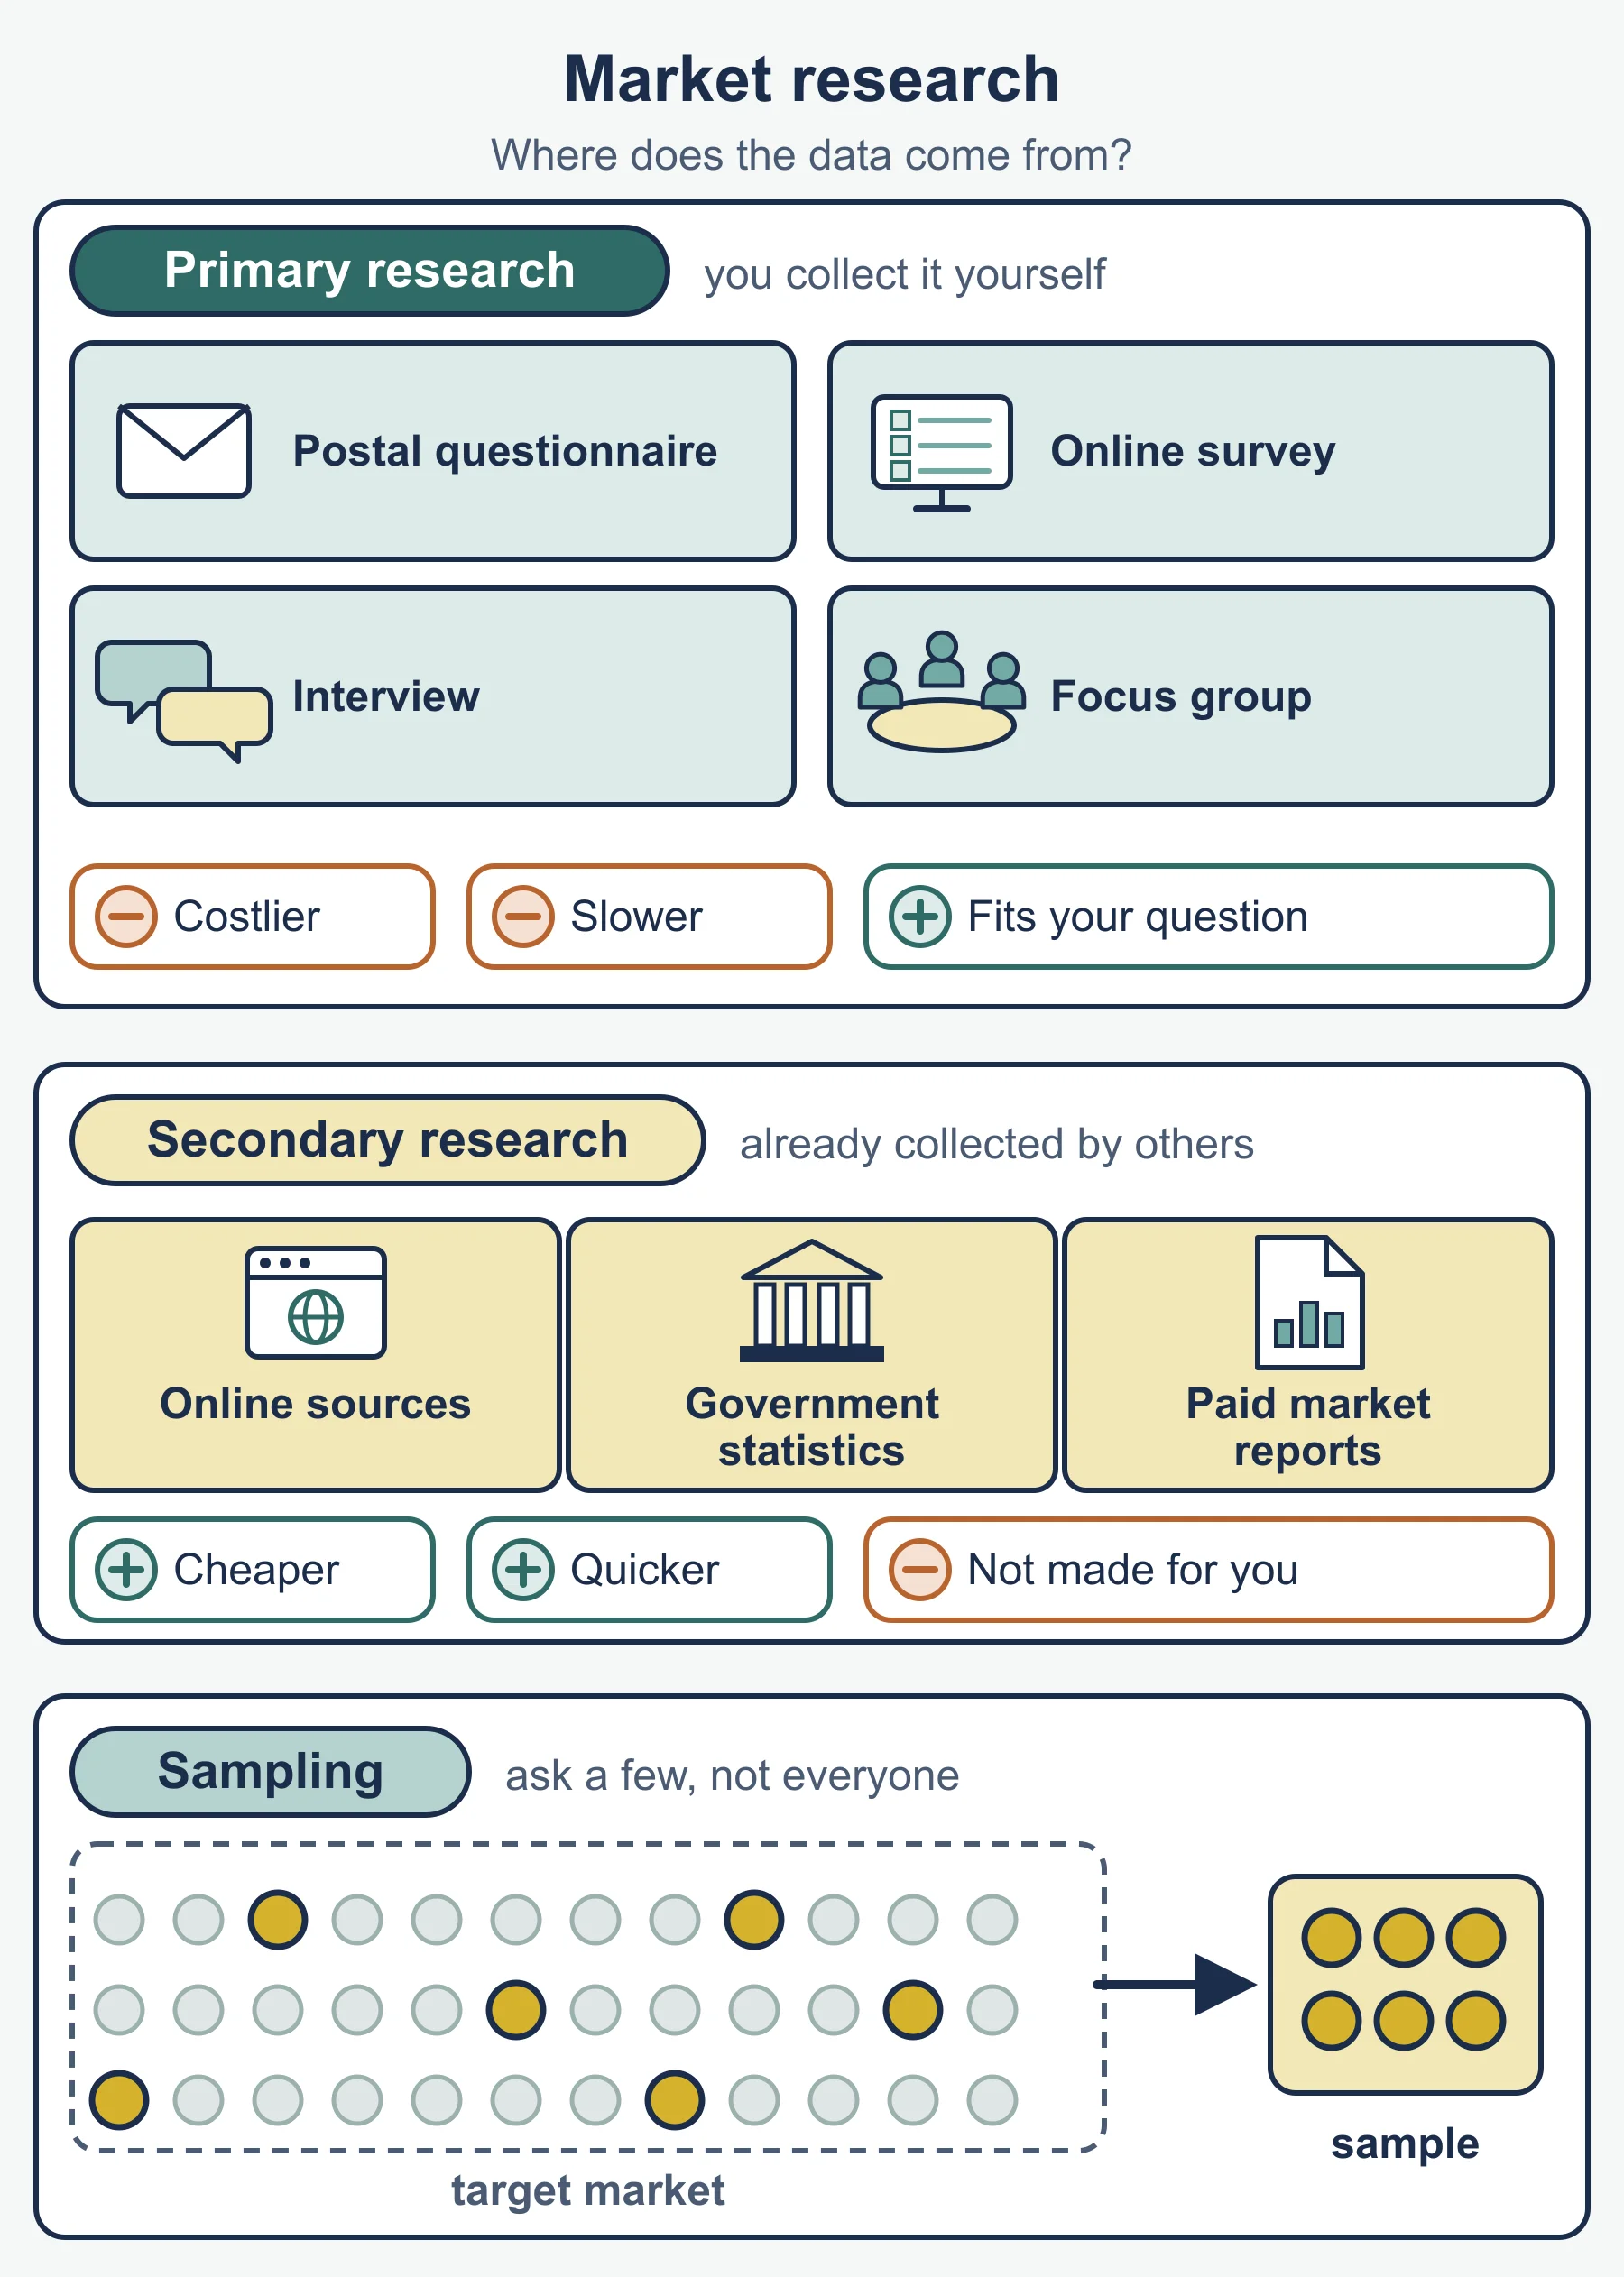
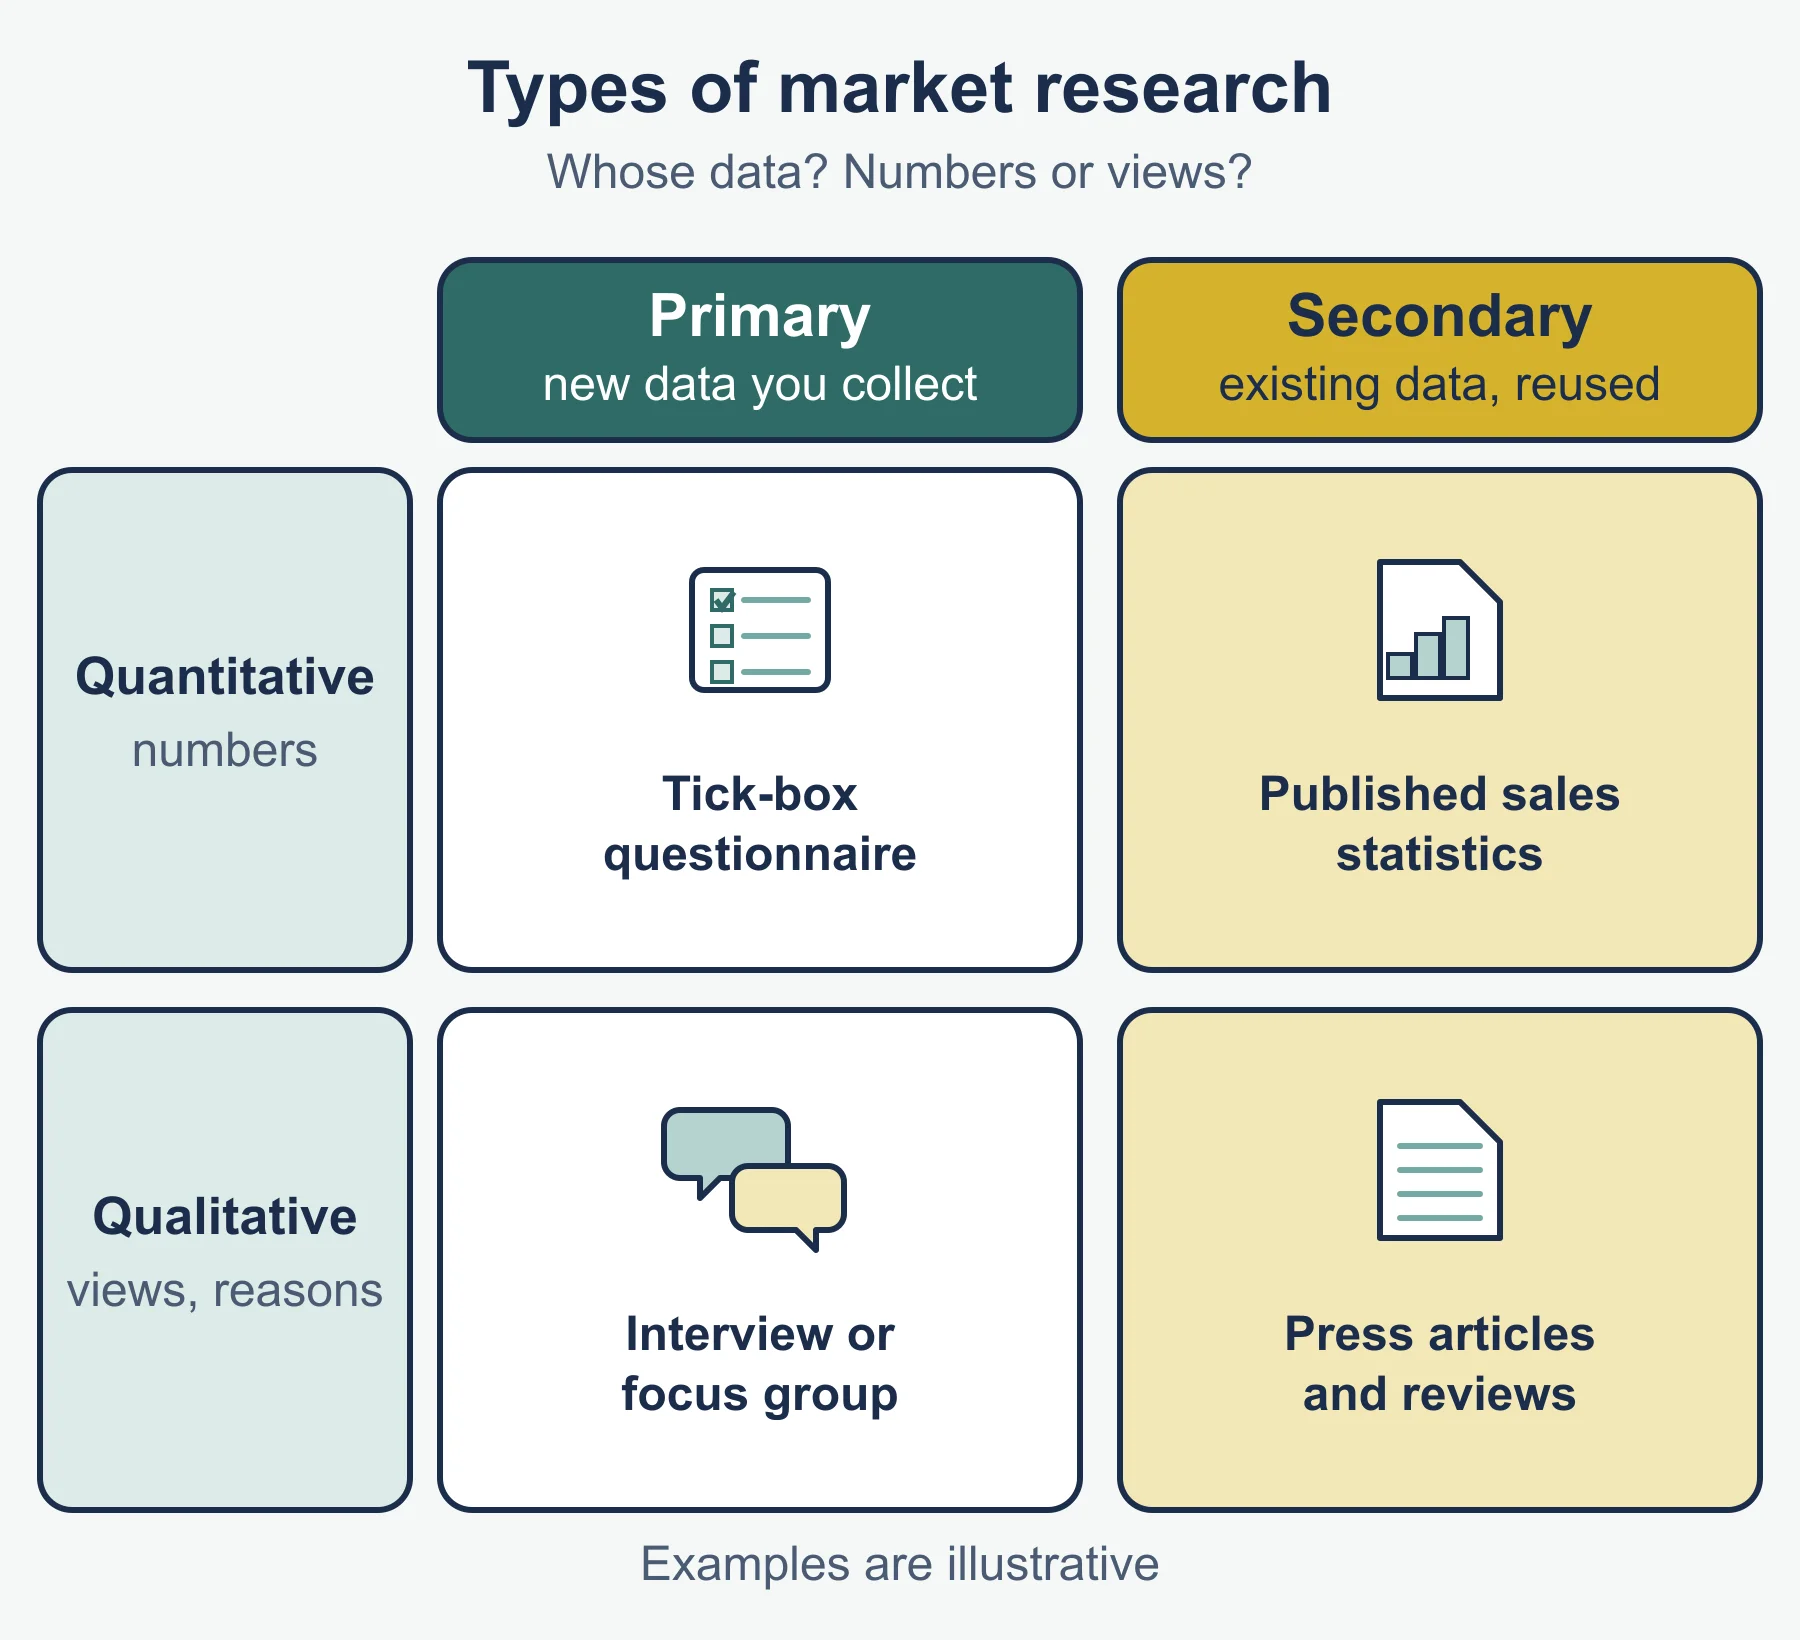
- Primary: surveys/questionnaires; focus groups/consumer panels; face-to-face/telephone interviews; product trials/test marketing.
- Secondary: websites/social media; newspapers, magazines, TV, radio; reports; databases.
- Quantitative = numbers (how many). Qualitative = opinions and reasons (why).
- Primary: specific, current, costly, slow. Secondary: cheap, fast, possibly dated or off-target.
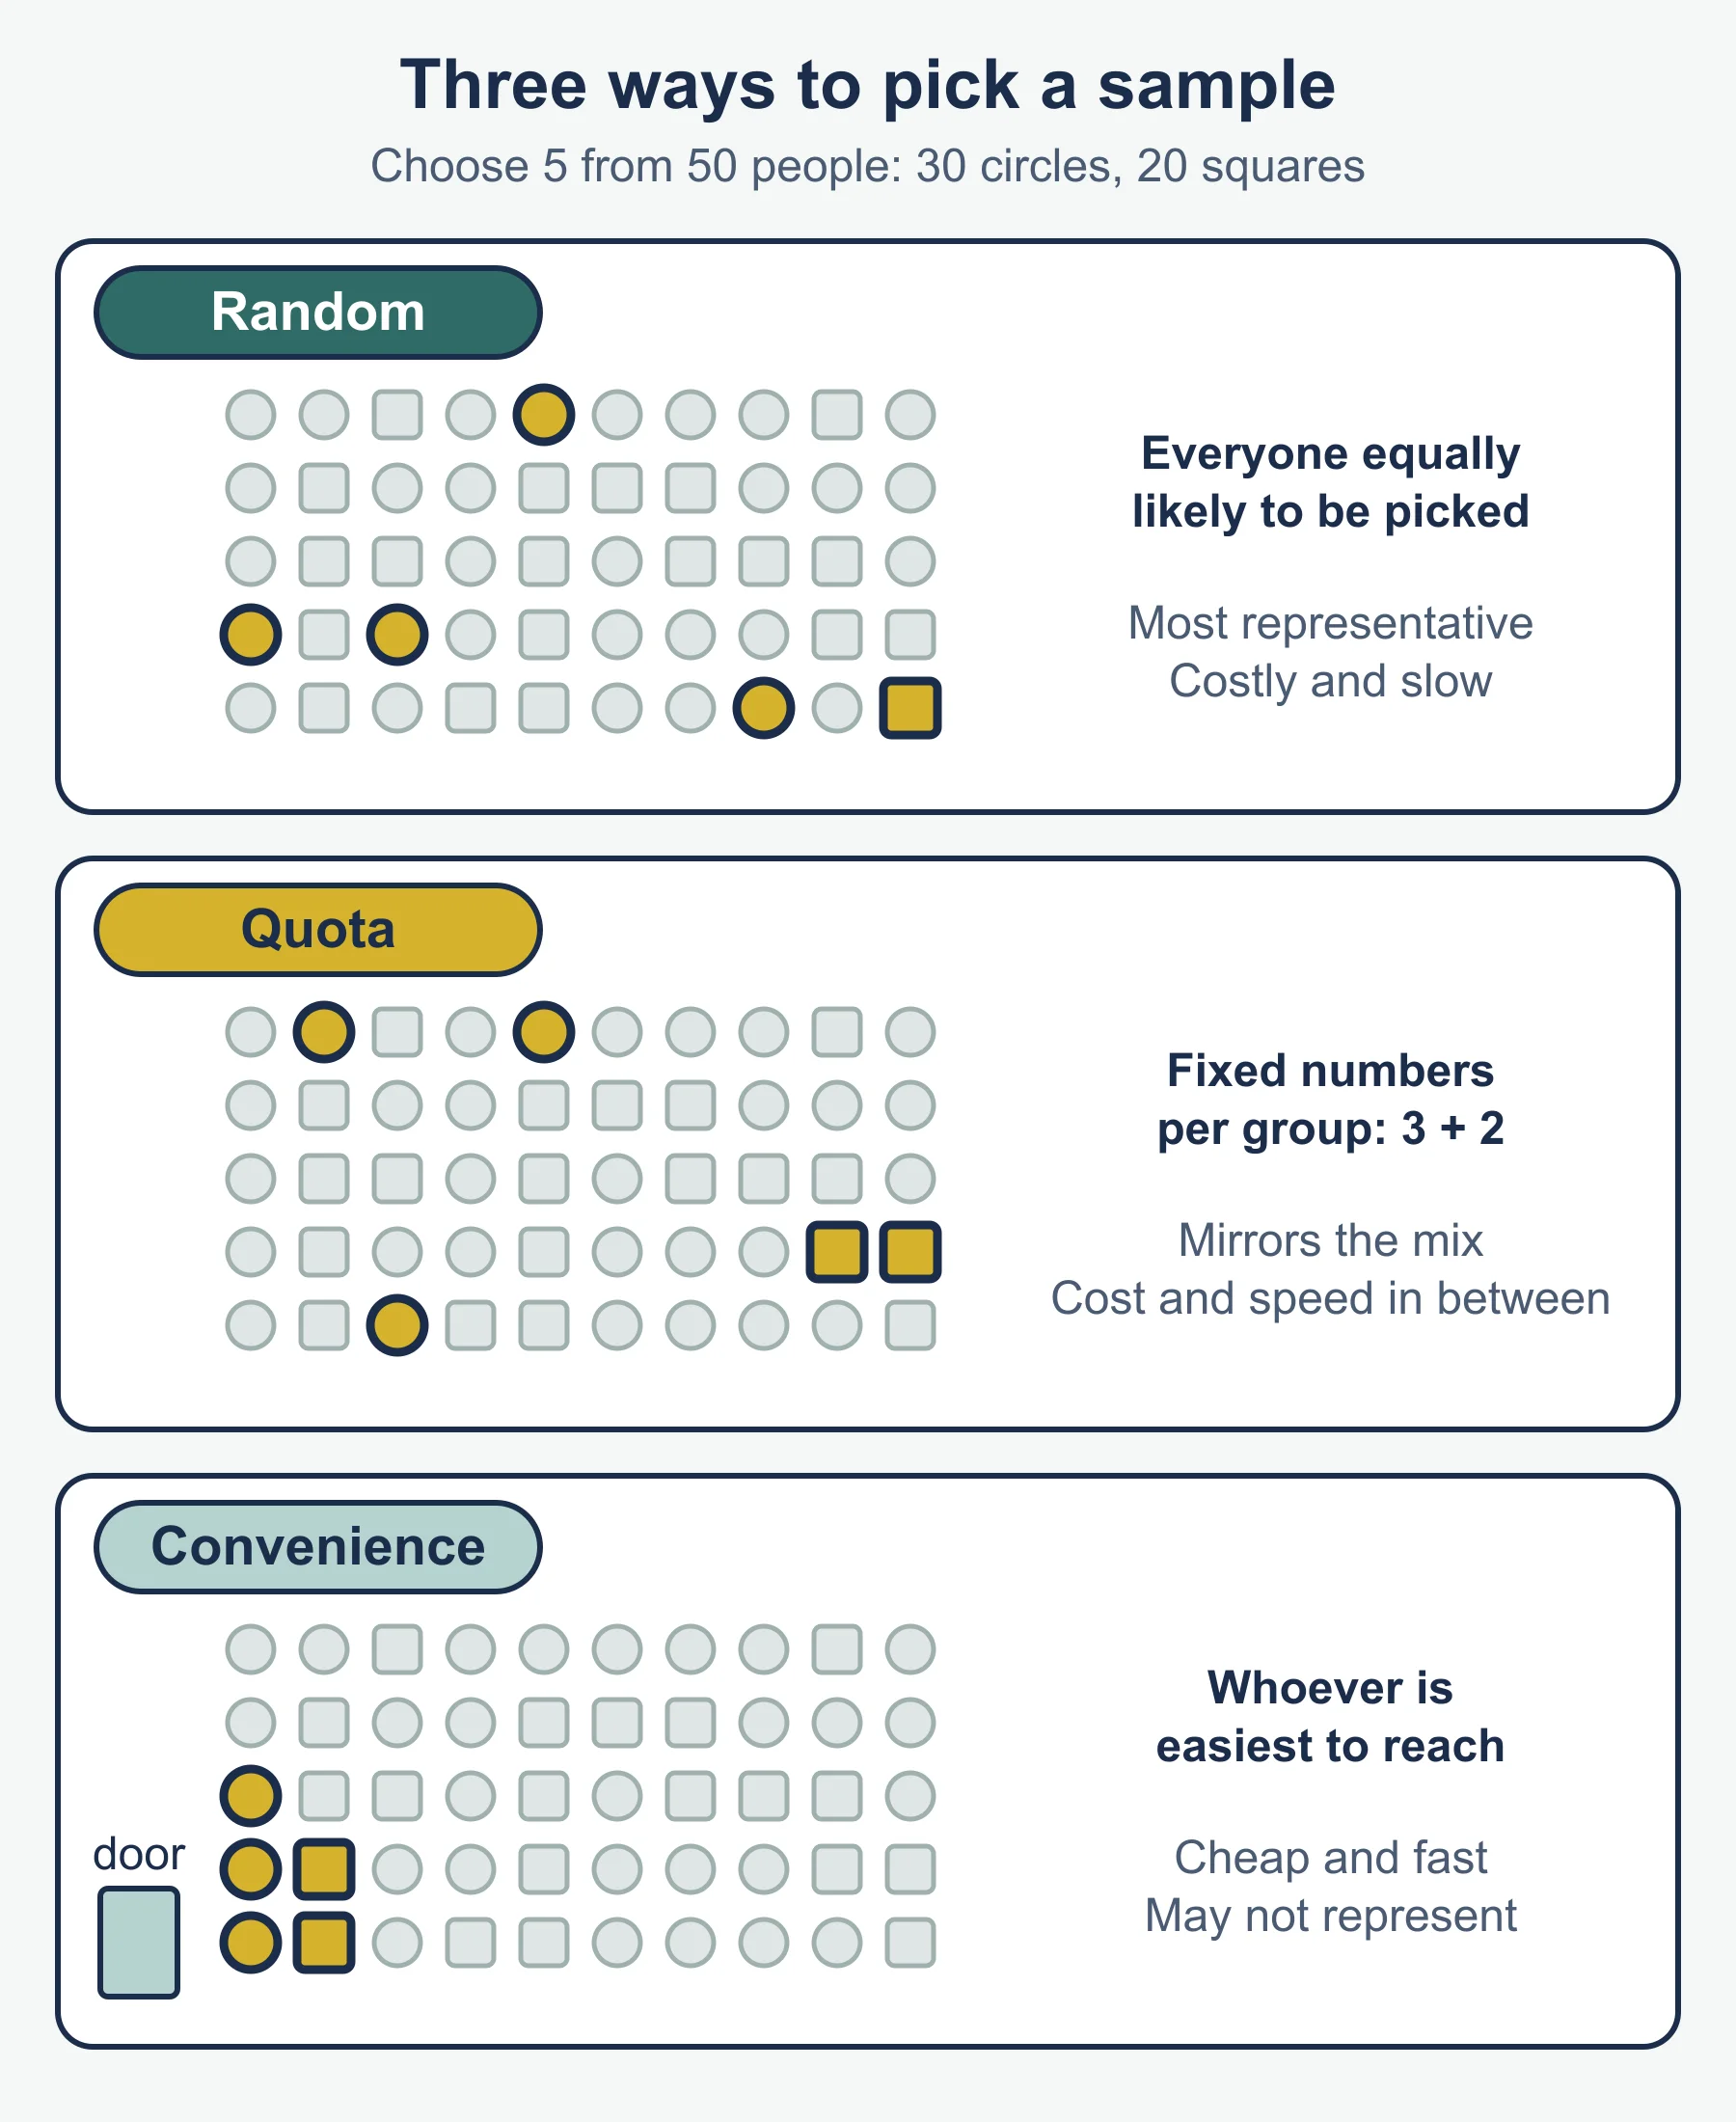
| Sampling | How it works | Main weakness |
|---|---|---|
| Random | Equal chance of selection | May miss small groups |
| Quota | Fill set numbers from chosen groups | Choice within the quota is not random |
| Stratified | Groups in proportion, random within each | Needs a list and group information |
Method boxes
Market share and growth in steps
- Share = firm’s sales / market sales x 100.
- Growth = (new market - old market) / old market x 100.
- Compare the firm’s growth with the market’s: if the firm grows more slowly, its share falls.
Reminder. Pallister Coffee has a £4.0m market that grows to £4.4m: growth = 0.4 / 4.0 x 100 = 10%.
PED in steps
- Work out % change in price and in quantity (use the original figure as the base).
- Divide quantity change by price change.
- Ignore the sign for size: above 1 elastic, below 1 inelastic, equal to 1 unitary.
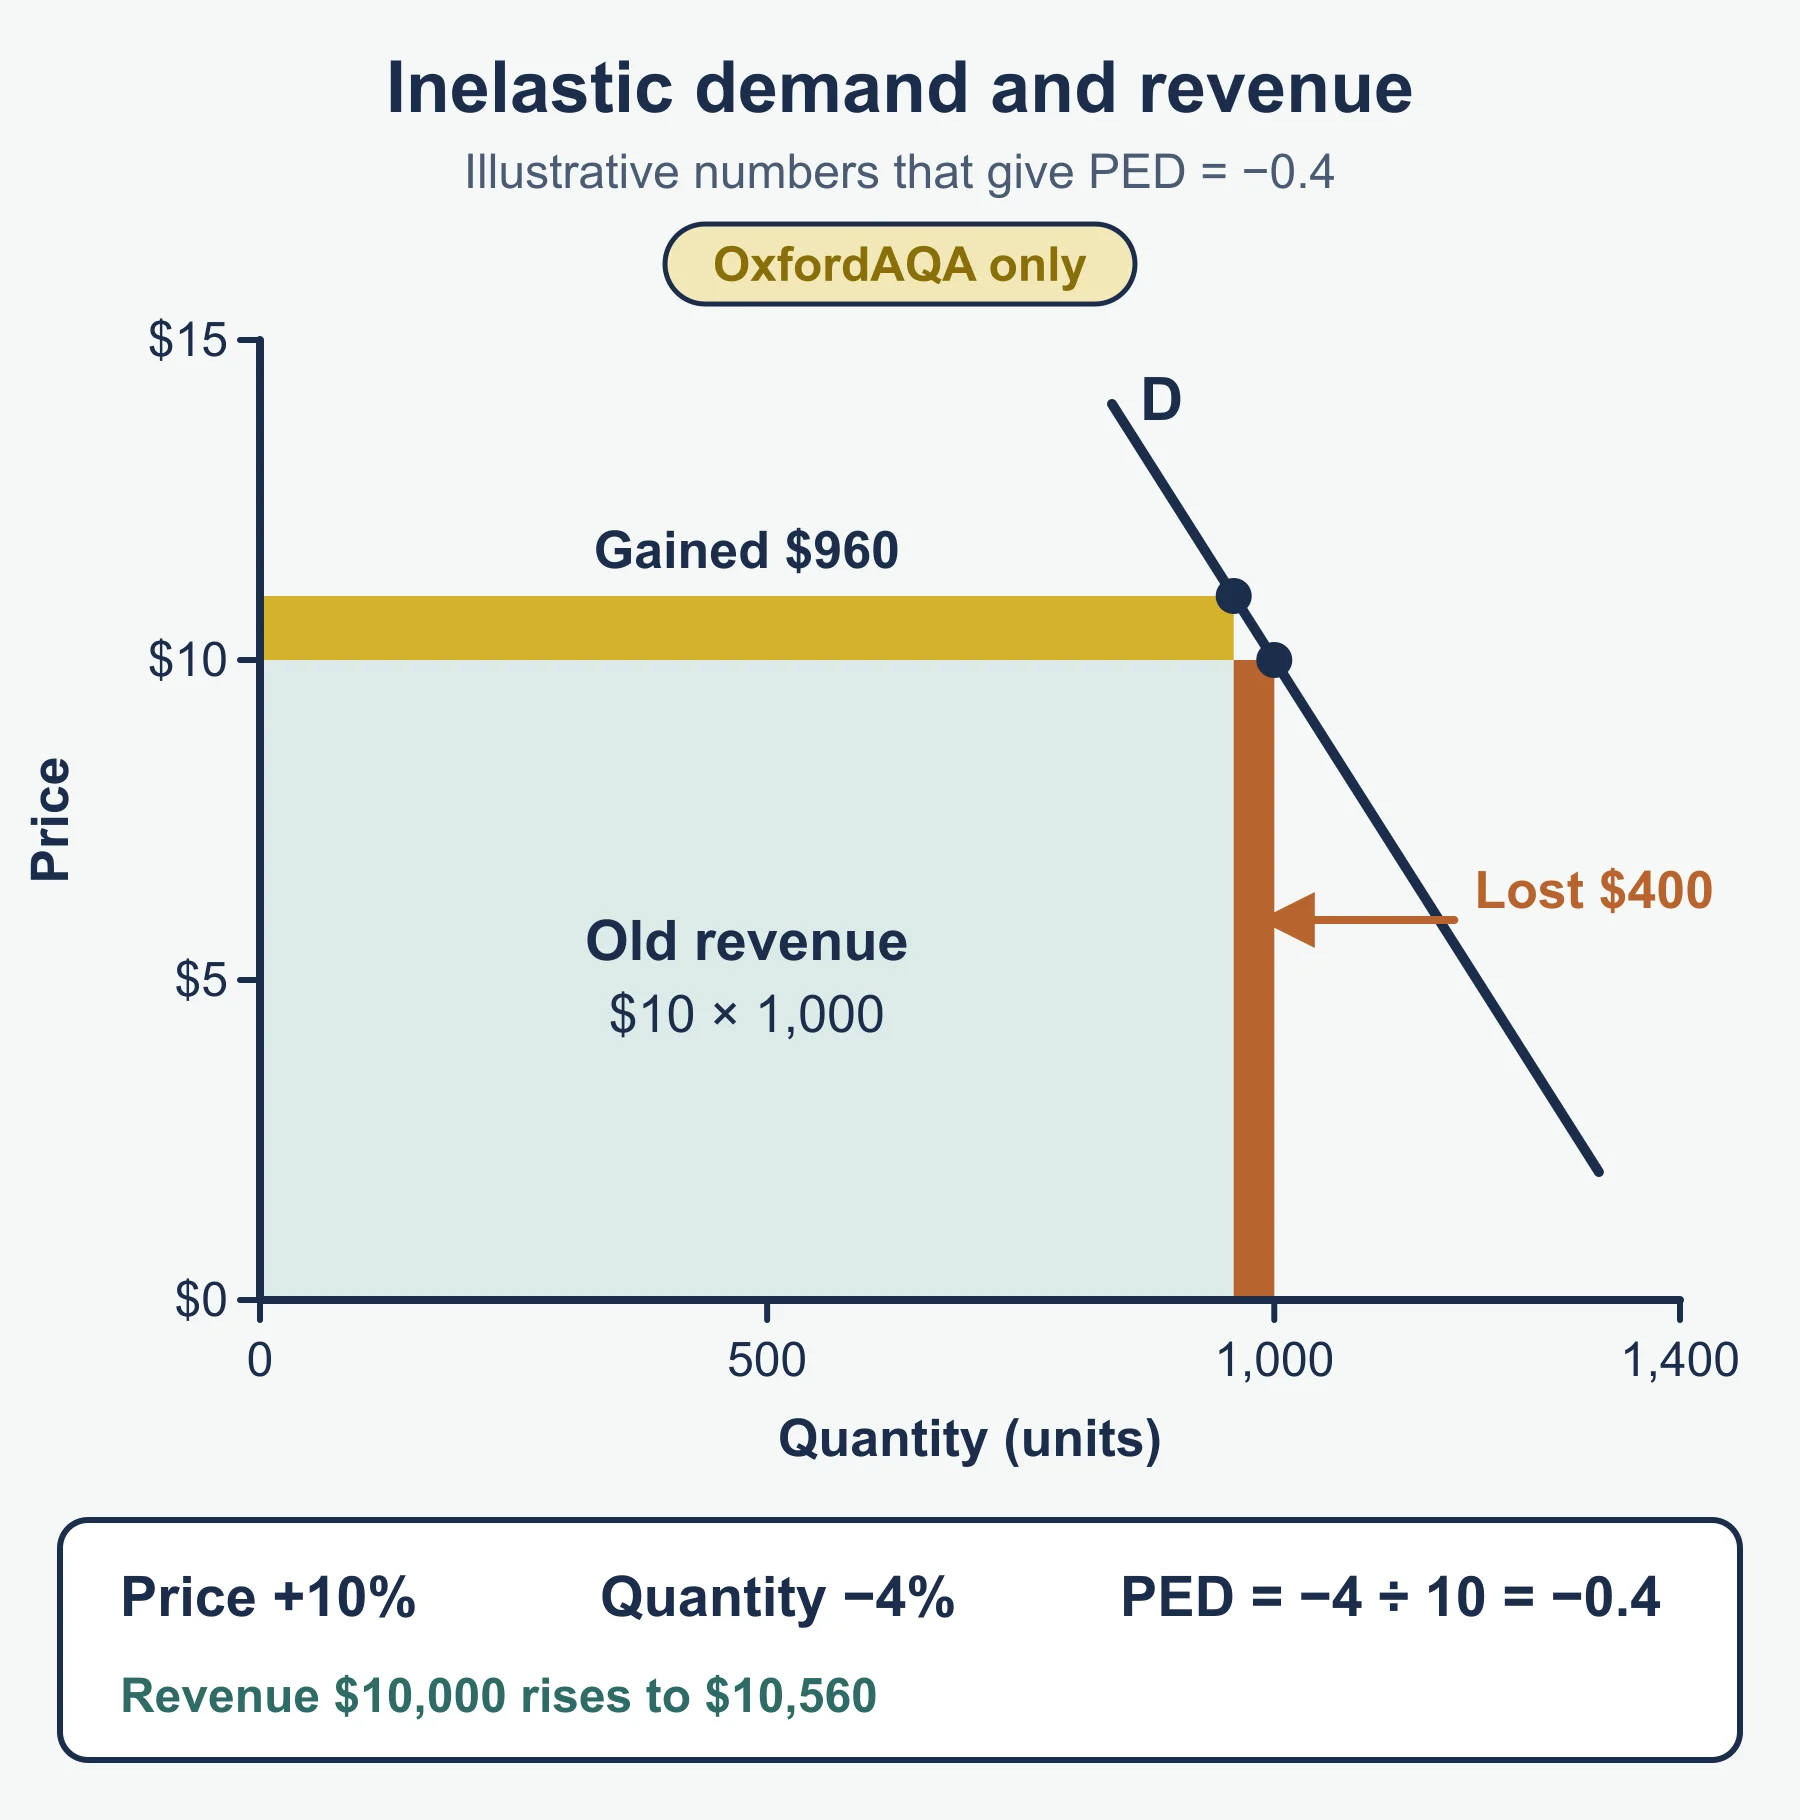
- Link to revenue: price x quantity before and after.
Reminder. Pallister cuts a pack from £2.50 to £2.00 (-20%) and sales rise from 8,000 to 9,200 (+15%). PED = 15 / -20 = -0.75, inelastic. Revenue falls from £20,000 to £18,400. Cutting price on inelastic demand lowers revenue.
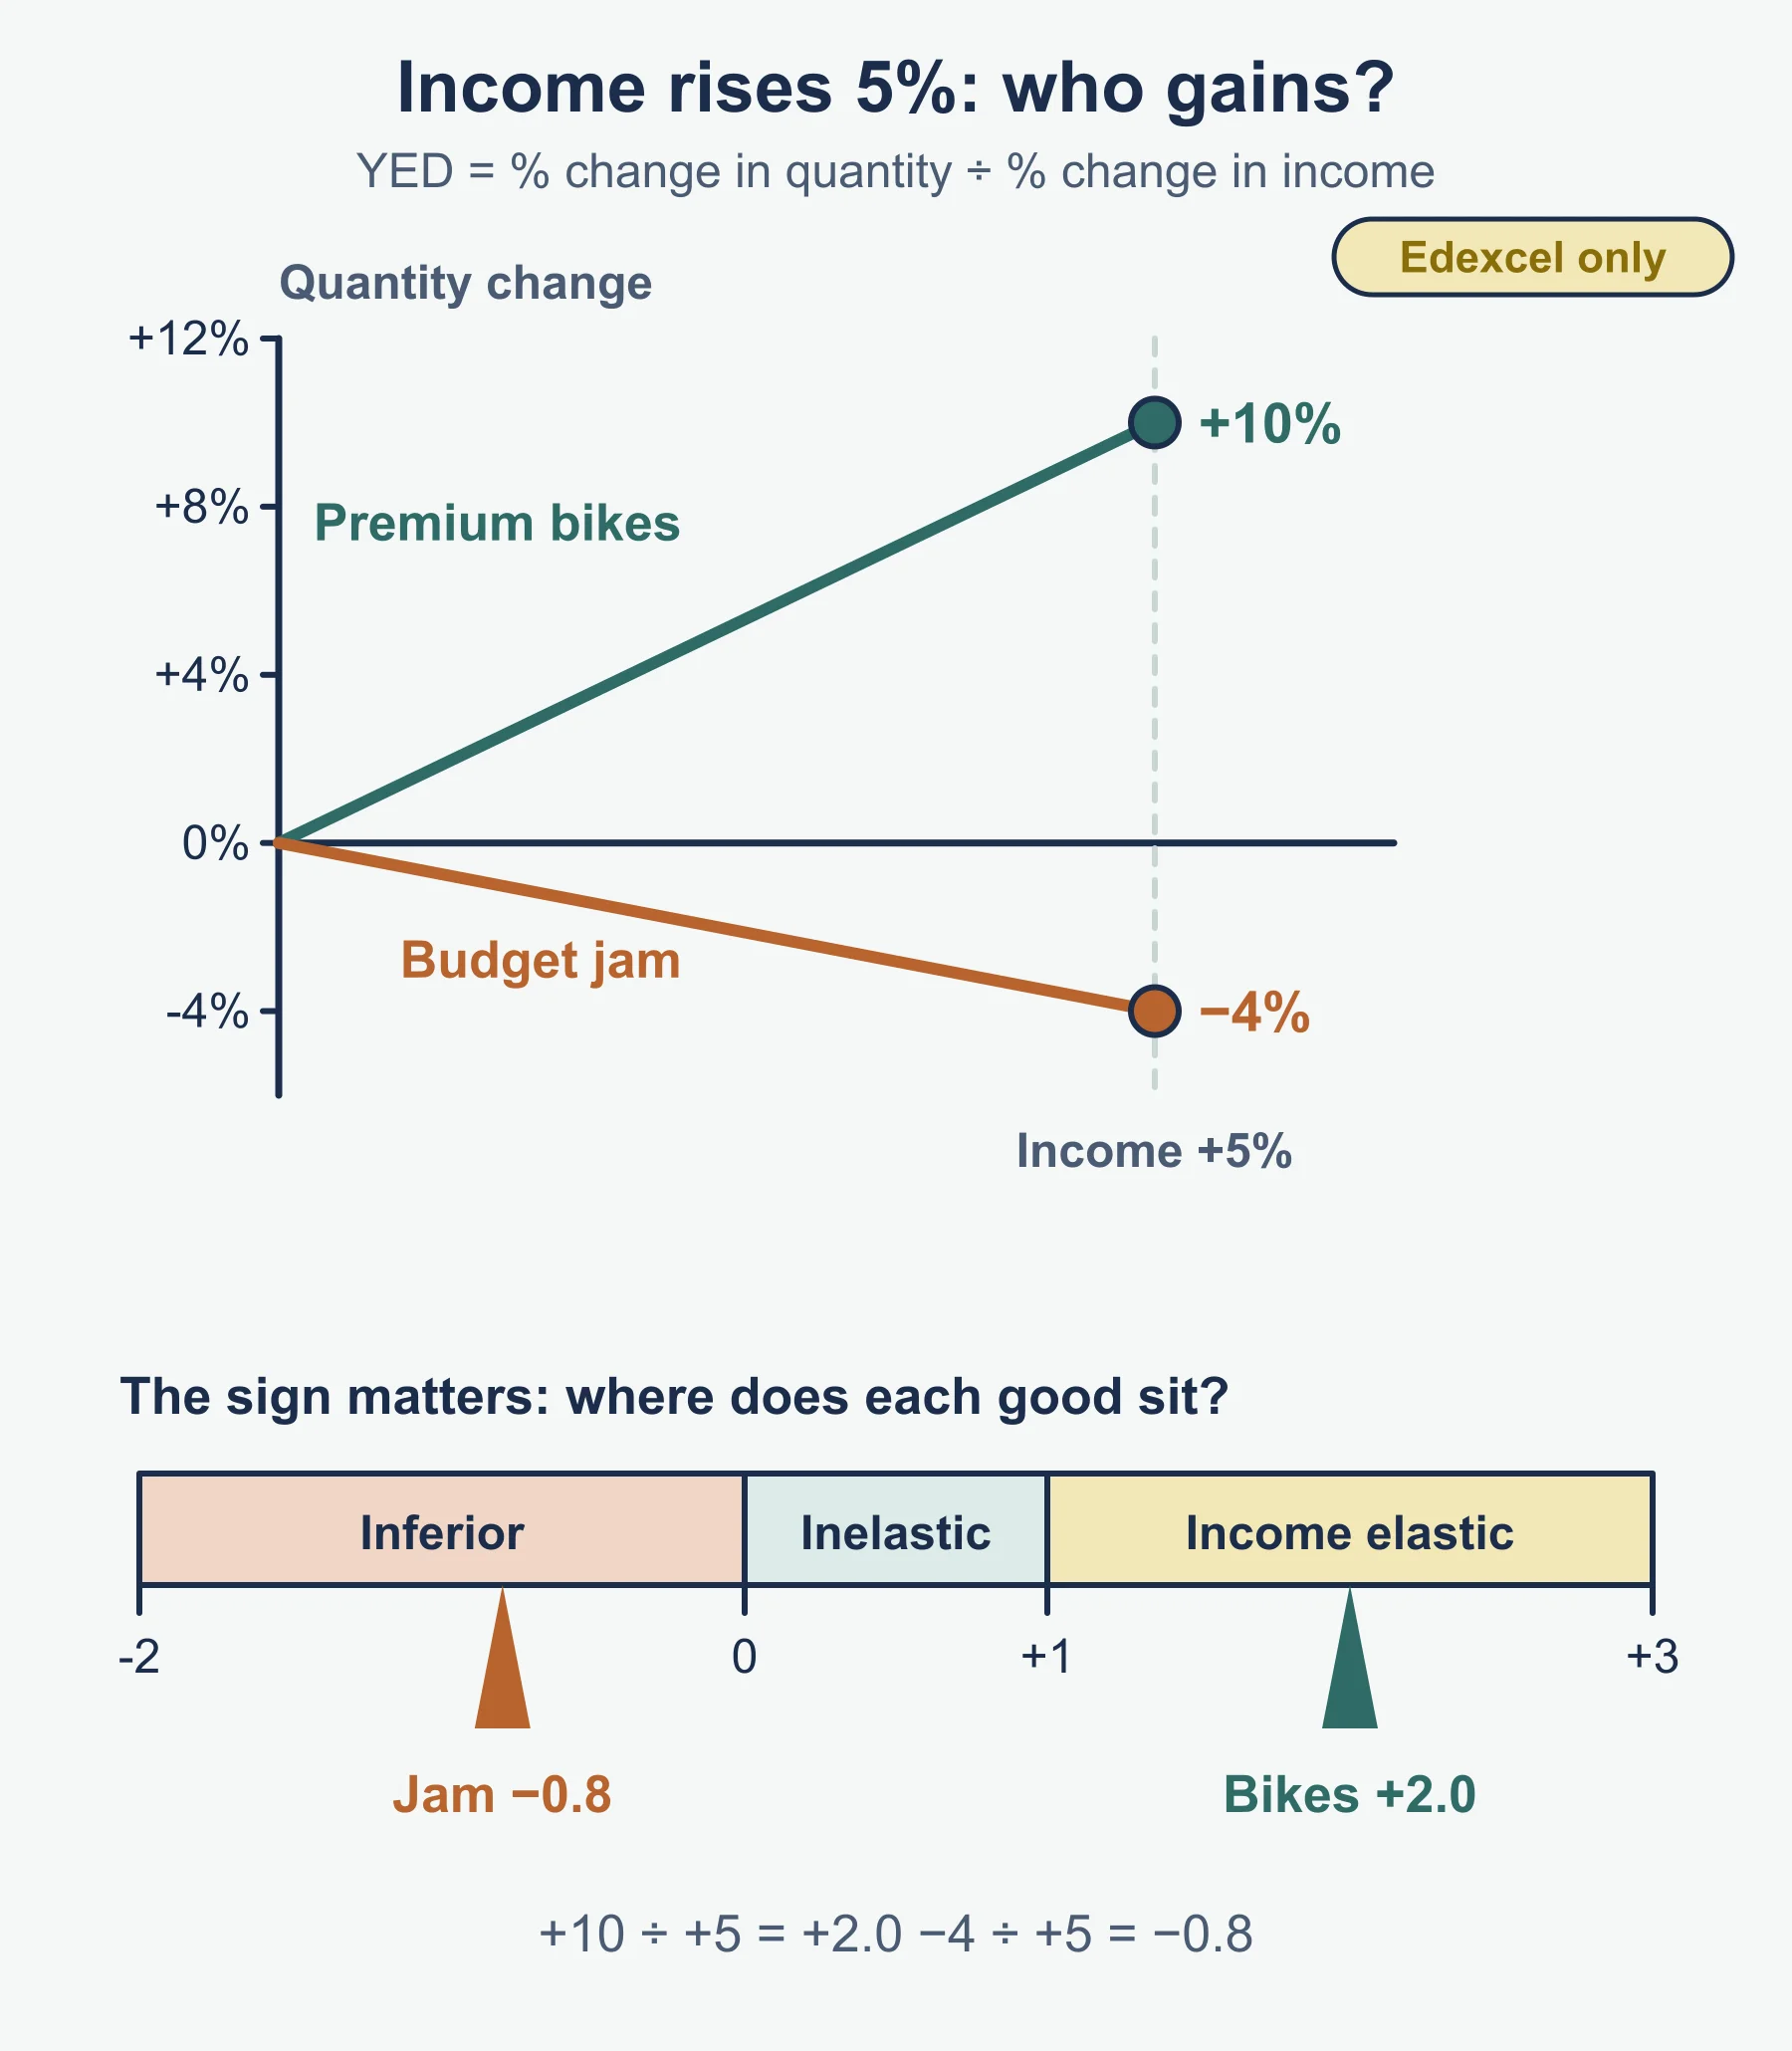
YED in steps
- % change in quantity / % change in income.
- Positive = normal good (above 1 income elastic, between 0 and 1 income inelastic). Negative = inferior good.
Demand and supply at a glance
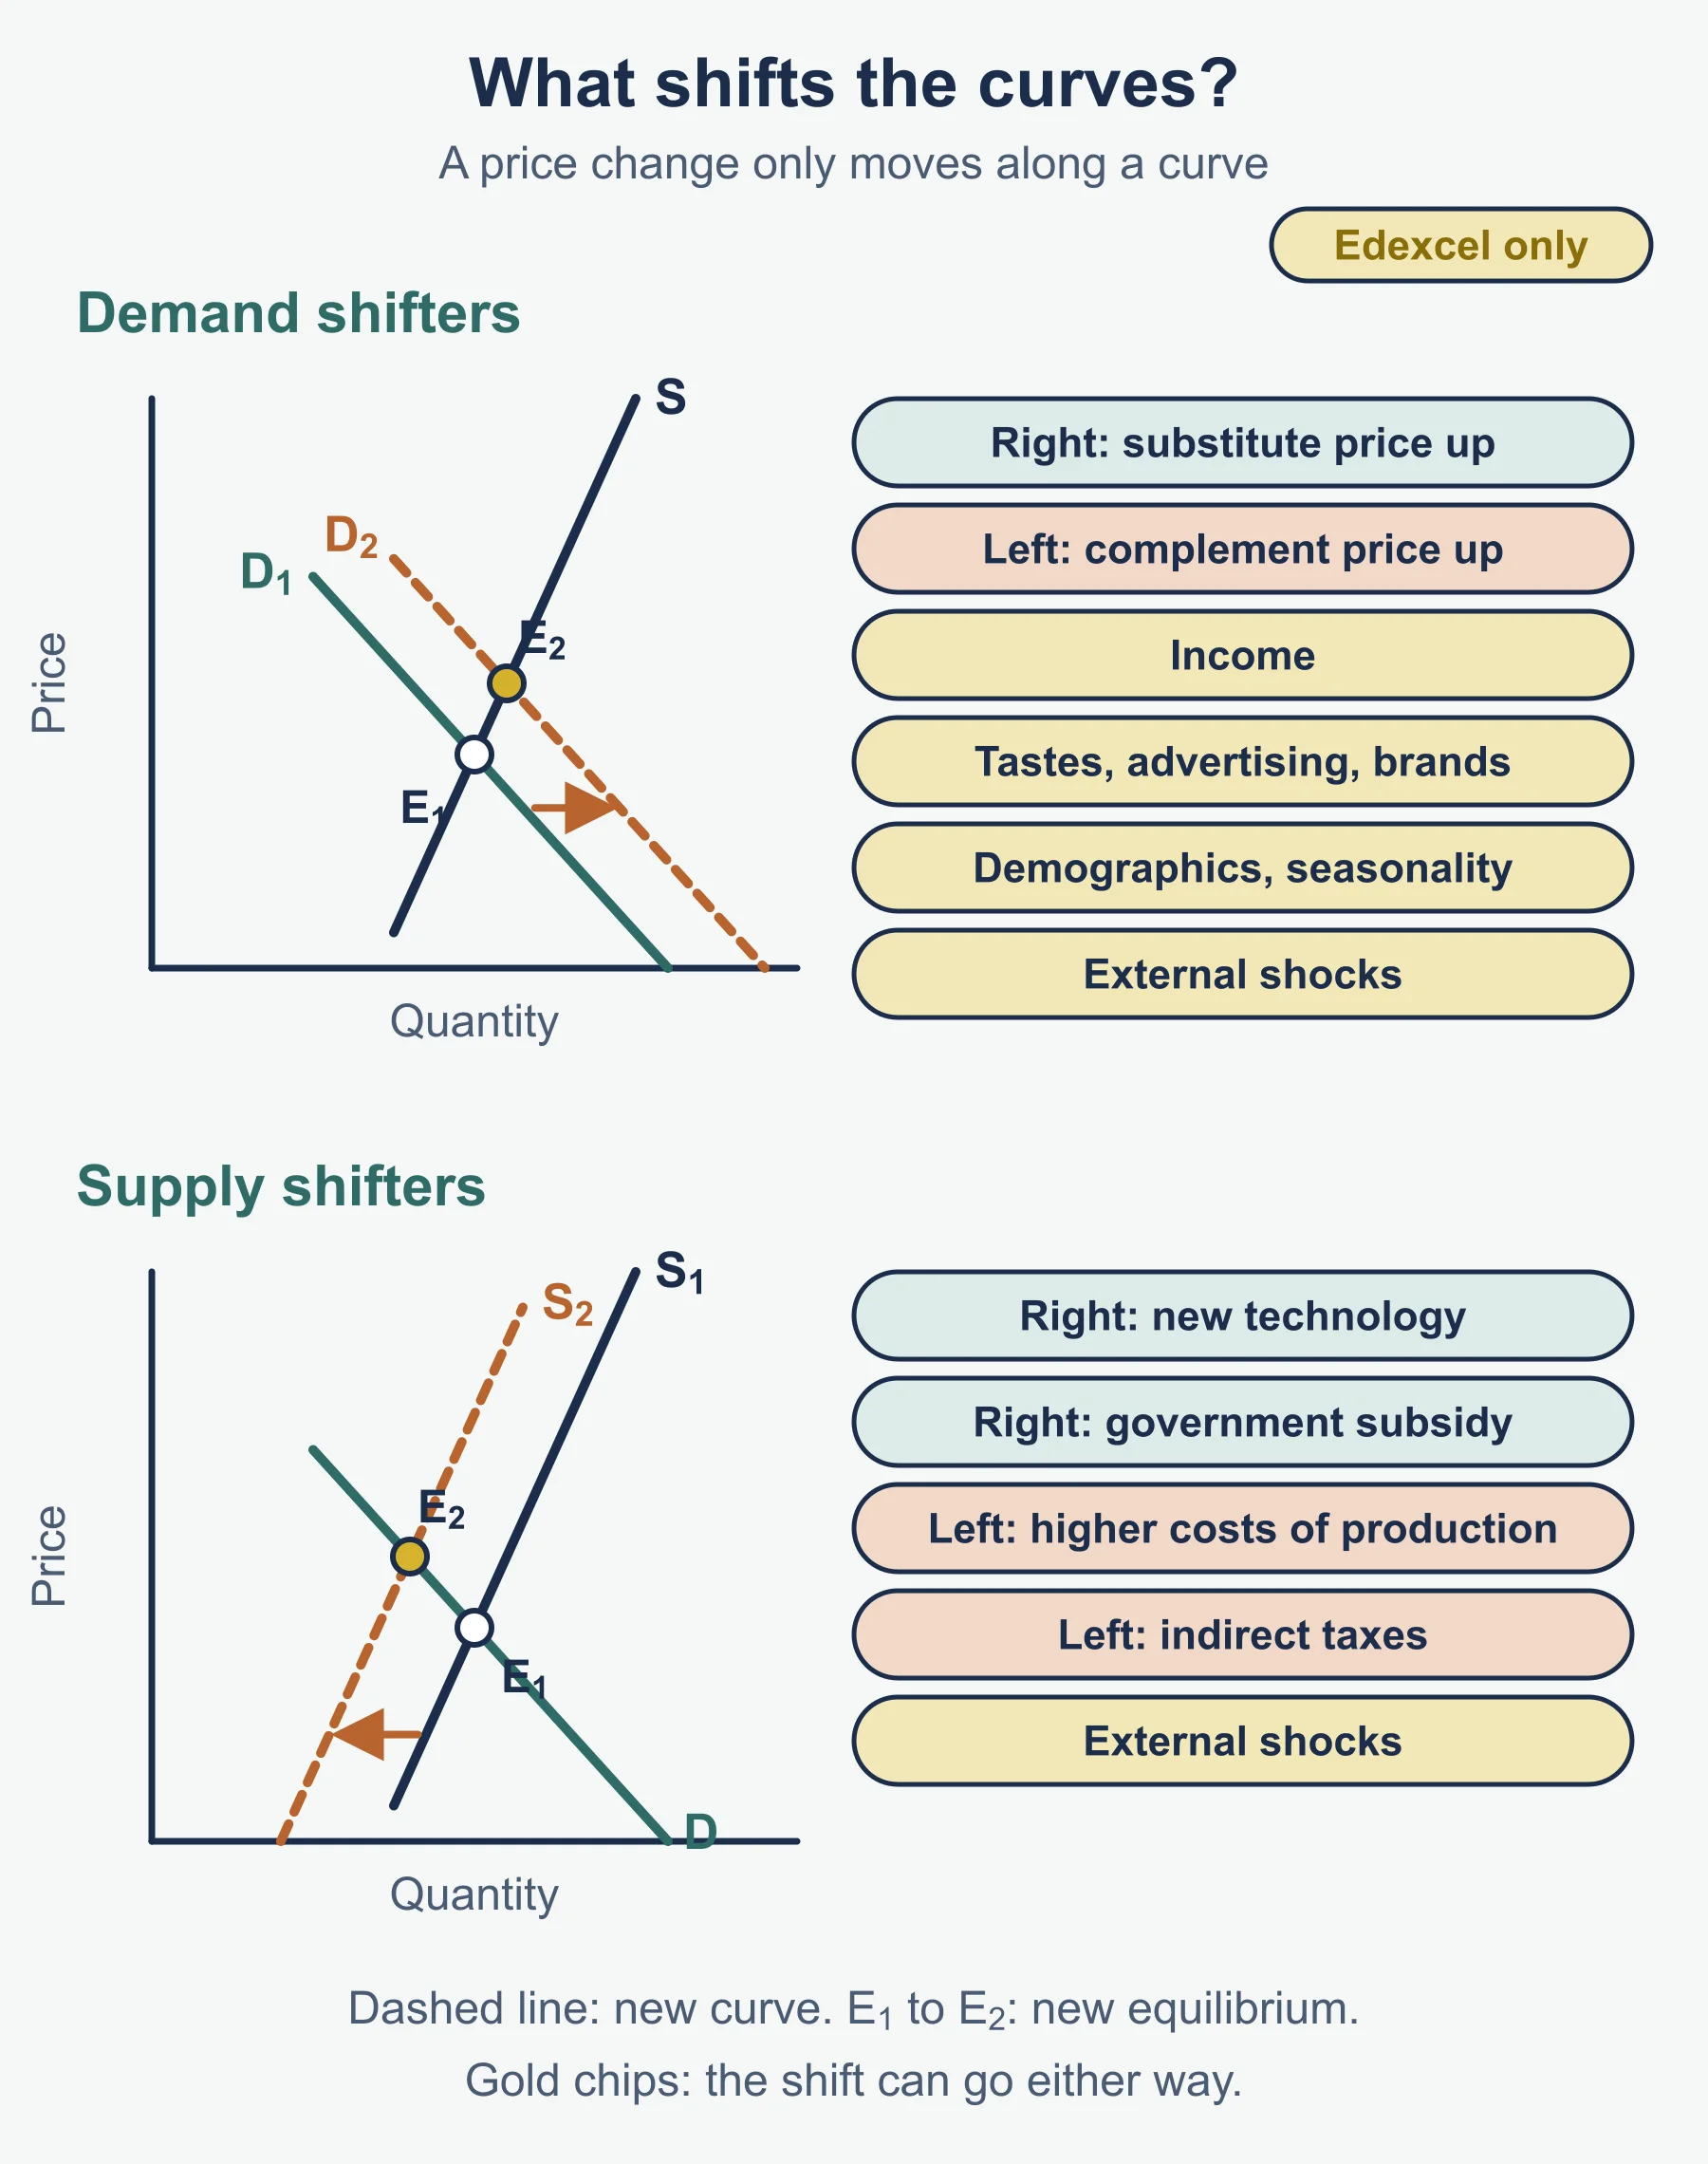
| Shifts demand | Direction |
|---|---|
| Substitute’s price rises | Demand rises |
| Complement’s price rises | Demand falls |
| Incomes rise (normal good) | Demand rises |
| Fashion, taste, advertising, branding move in favour | Demand rises |
| Demographic change (for example more elderly people) | Depends on product |
| External shock, seasonality | Depends on event/season |
| Shifts supply | Direction |
|---|---|
| Lower production costs | Supply rises |
| New technology | Supply rises (usually lower costs) |
| Indirect tax introduced or raised | Supply falls |
| Government subsidy | Supply rises |
| External shock (for example a crop failure) | Supply falls |
- Equilibrium: quantity demanded = quantity supplied.
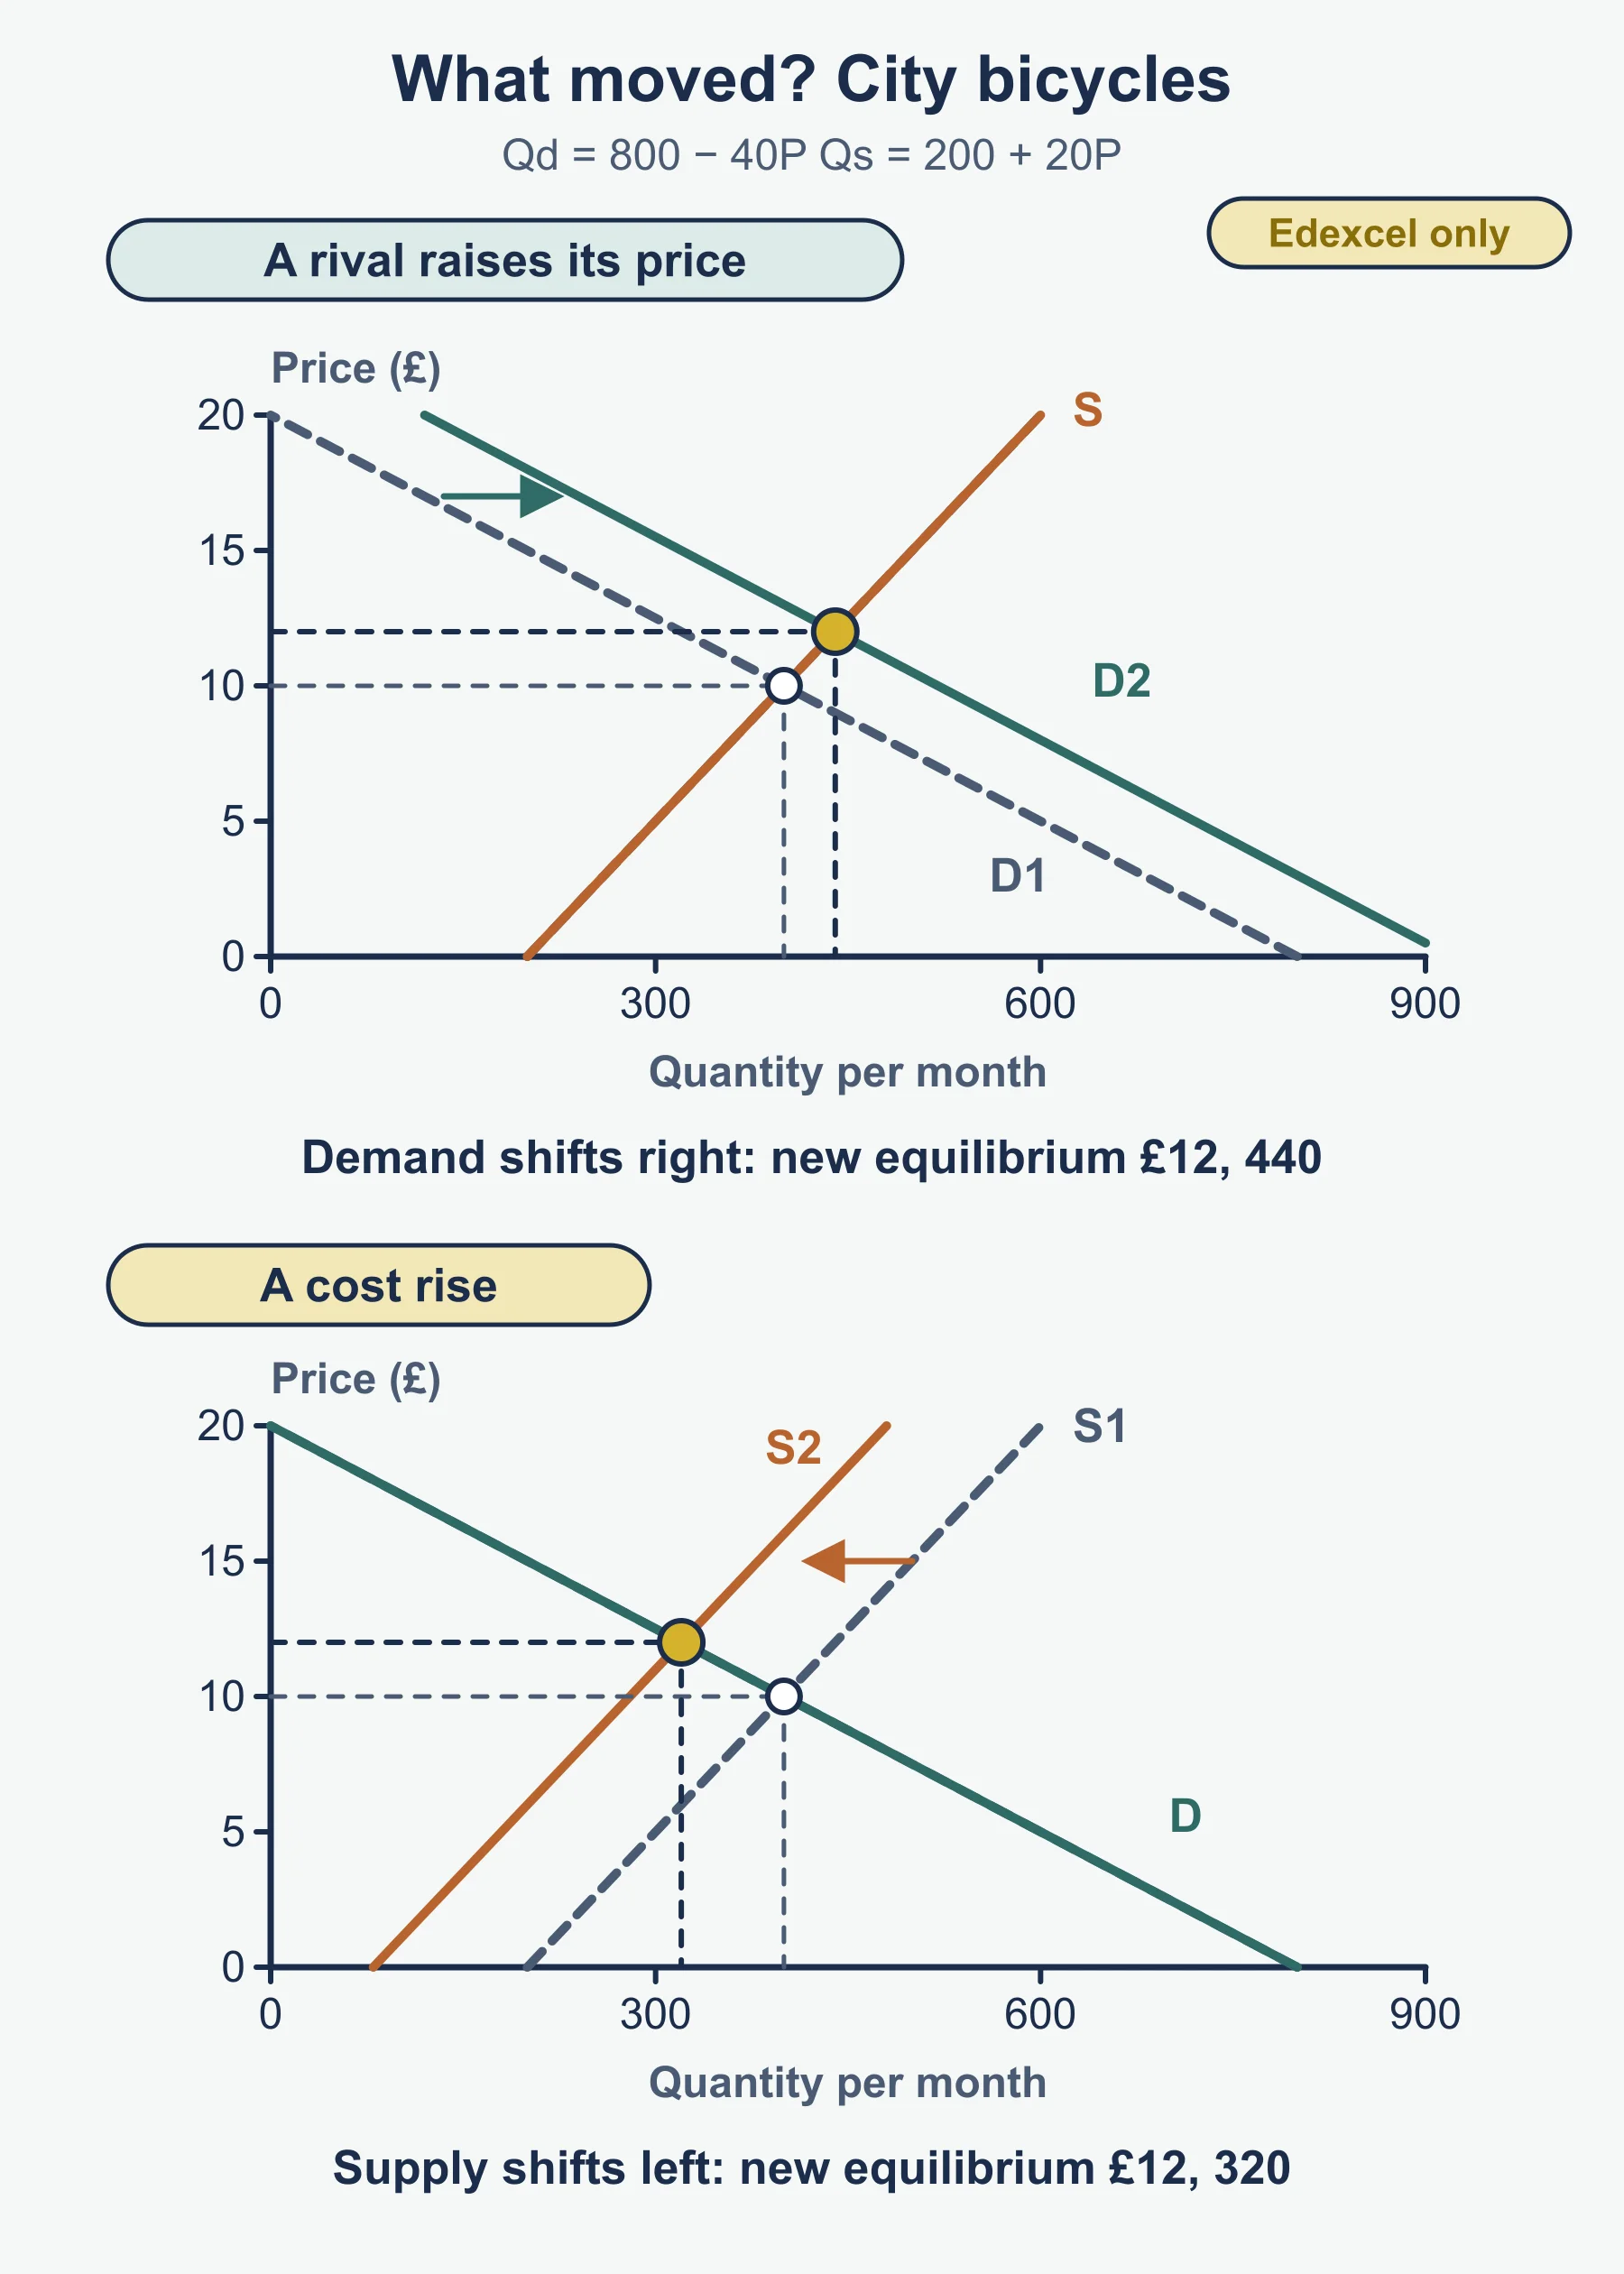
- Demand shifts right: price and quantity both rise. Supply shifts right: price falls, quantity rises. Supply shifts left: price rises, quantity falls.
- A change in the product’s own price is a movement along the curve, not a shift.
- When asked to interpret a diagram: name the curve that shifted, state the direction, give the new equilibrium, and apply it to the business.
Influences on elasticity
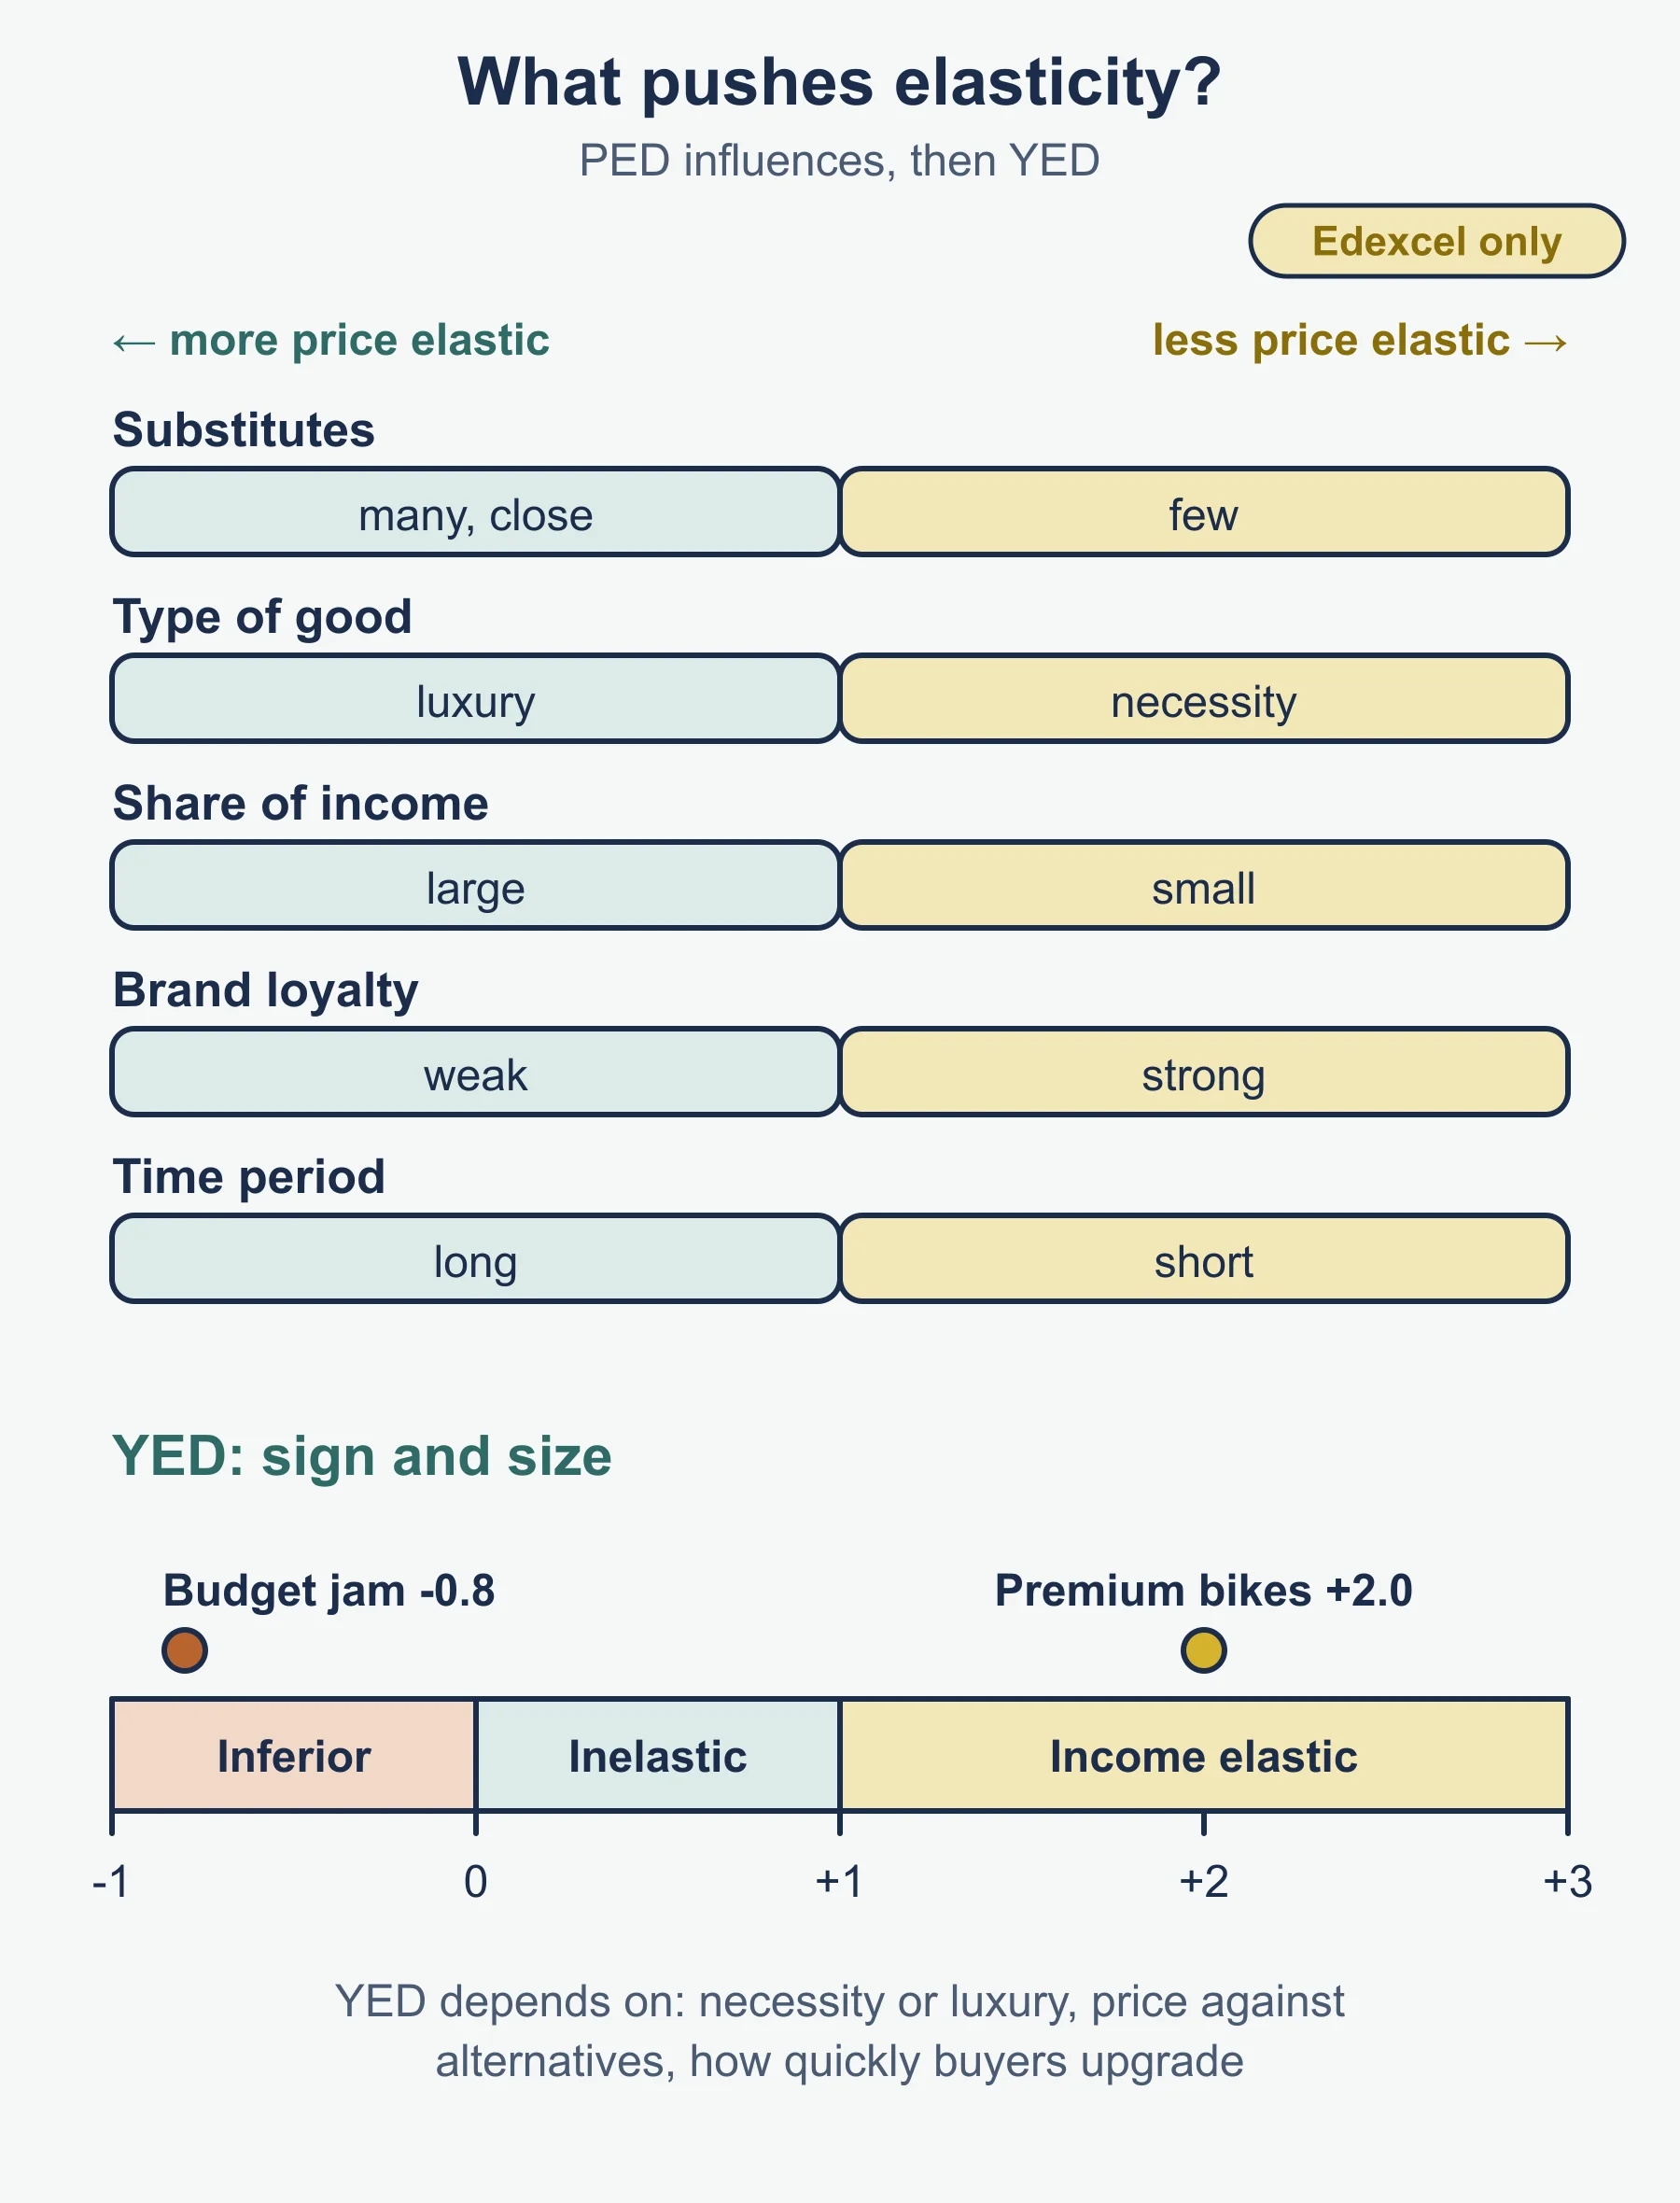
| PED is lower (less elastic) when… | PED is higher (more elastic) when… |
|---|---|
| Few close substitutes | Many close substitutes |
| Necessity | Luxury |
| Small share of income | Large share of income |
| Strong brand loyalty | Weak brand loyalty |
| Short time period | Long time period |
For YED, the main influence is how far the good is a necessity or a luxury, and whether cheaper alternatives are available as incomes change.
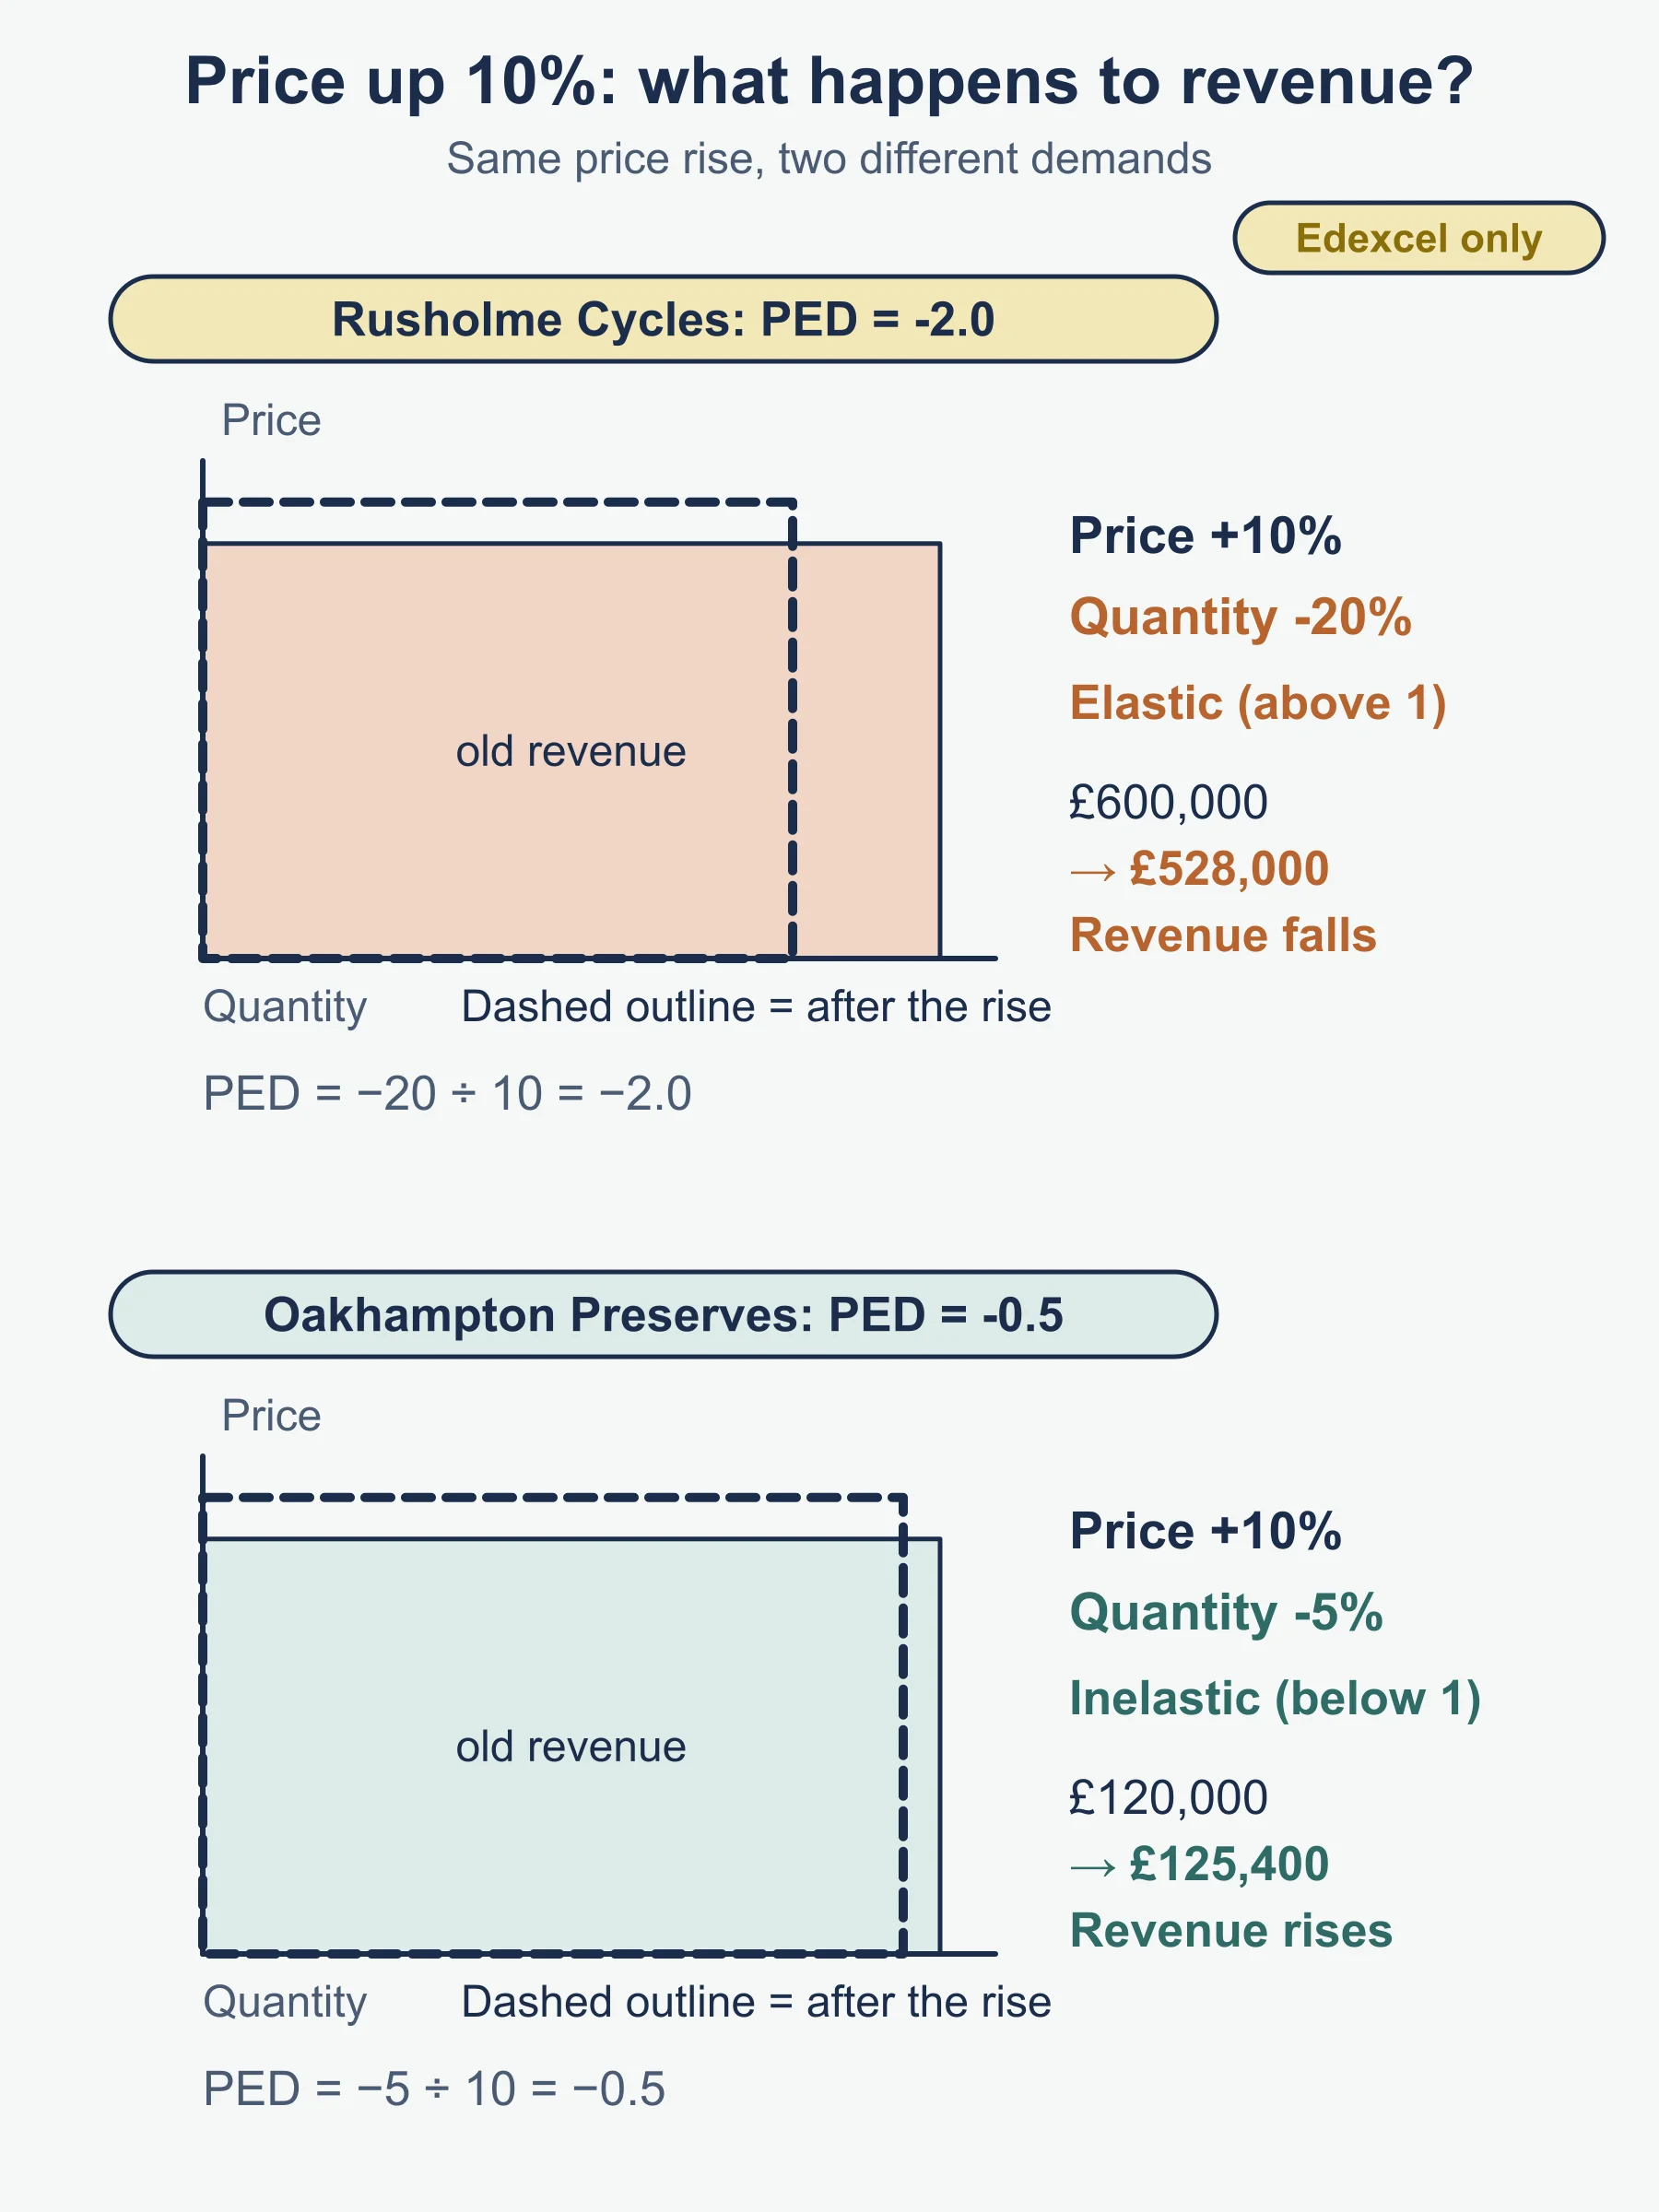
Business significance. With inelastic demand, price rises lift revenue, so firms differentiate and build brands. With elastic demand, price cuts can lift revenue, but profit depends on costs. High-YED products are hit hardest in a downturn, and inferior goods may gain when incomes fall.
Markets, positioning and competition
- Mass vs niche: compare customer numbers, price levels, competition and how easily a firm can be replaced. Niche firms often earn higher margins on lower volume but depend on a narrow customer base.
- Brands: support higher prices and loyalty, and make demand less price elastic.
- Dynamic markets: online retailing, how markets change, innovation and market growth, and adapting to change. Innovation can open new demand; adapting means watching the market and updating products, channels and costs.
- Competition affects price, quality, service and margins. More close rivals limit pricing power.
- Positioning: choose product or market orientation; plot rivals on a market map; segment the market; build a competitive advantage (cost, brand, service or uniqueness); use differentiation to avoid pure price comparison; add value through design, service and convenience.
- Evaluation prompts: how reliable is the data, how long will the advantage last, what will rivals do, and how large is the segment?
Worked reminders
A firm raises price 5% and quantity falls 10%. PED = -10 / 5 = -2, elastic, so total revenue falls.
A firm’s sales grow 6% while its market grows 10%. Its share is falling, even though sales are rising.
A quota sample of 100 asks 50 men and 50 women. It matches the target mix but the interviewer chooses who answers, so bias is still possible.
Must-know distinctions
- Market size vs market share.
- Risk (estimable) vs uncertainty (not estimable).
- Primary vs secondary; quantitative vs qualitative.
- Product vs market orientation.
- Movement along vs shift of a curve.
- PED (price) vs YED (income). Only YED’s sign is used to classify goods.
- Revenue vs profit.
Quick self-test
- Sales of £0.45m in a £5.0m market: what is the market share?
- A market grows from £4.0m to £4.4m. State the growth rate.
- Give one difference between random and quota sampling.
- Define market orientation.
- A price rise of 8% cuts quantity by 4%. Calculate PED and state whether it is elastic.
- Income rises 8% and demand rises 4%. Calculate YED and classify.
- State two factors that shift the supply curve to the left.
- Why can a gap on a market map be a poor opportunity?
- A stratified sample of 60 is drawn from 1,500 customers, 300 of whom are over 60. How many over-60s are in the sample?
- Explain why a strong brand may make demand less price elastic.
Answers
- 0.45 / 5.0 x 100 = 9%.
- 0.4 / 4.0 x 100 = 10%.
- In random sampling every member has an equal chance; in quota sampling the interviewer fills set numbers from chosen groups, so selection within each group is not random.
- Starting with what customers want, found through research, then designing the product to meet it.
- -4 / 8 = -0.5; inelastic (size below 1).
- 4 / 8 = +0.5; normal good, income inelastic.
- For example a rise in production costs, an indirect tax, removal of a subsidy, or a negative external shock.
- There may be no demand at that combination of attributes, or serving it may be unprofitable.
- 300 / 1,500 x 60 = 12.
- Loyal customers see the branded product as different, so they are less willing to switch to substitutes when its price rises, so quantity falls proportionally less than price.
Where marks are usually lost
- Writing “turnover” or “profit” for sales revenue, or confusing revenue with profit.
- Using the new figure instead of the original as the base for percentage changes.
- Forgetting that PED is normally negative, or reporting the sign when asked for size.
- Dropping the sign on YED and so missing an inferior good.
- Treating a change in the product’s own price as a shift of its demand curve.
- Listing research methods without saying why one suits the case.
- Treating risk and uncertainty as the same.
- Giving generic answers that do not use the figures or context in the source.
- Stopping at a calculation without saying what it means for the business.
Frequently asked questions
How do you calculate price elasticity of demand? PED is the percentage change in quantity demanded divided by the percentage change in price. It is normally negative; ignoring the sign, a value above 1 is elastic and below 1 is inelastic.
What is the difference between random, quota and stratified sampling? Random sampling gives every member an equal chance of selection. Quota sampling fills set numbers from chosen groups, which is quick but open to bias. Stratified sampling splits the population into groups and draws randomly from each in proportion to its size.
How does PED affect total revenue? If demand is elastic, a price rise lowers total revenue and a price cut raises it. If demand is inelastic, a price rise raises total revenue and a price cut lowers it.
What is the difference between market size and market share? Market size is the total sales of all firms in the market, by value or volume. Market share is one firm’s sales as a percentage of total market sales.
Official syllabus
Pearson Edexcel International Advanced Subsidiary/Advanced Level in Business, specification Issue 1, September 2017 (Pearson Education Limited), Unit 1, sections 1.3.1 and 1.3.2.
Get free revision emails (optional)
Occasional emails with practice questions, worked explanations and links to free resources for the qualification and subjects you choose. No spam, and you can unsubscribe from any email. The free tools on this site never need an email.
Related resources
-
Study guides
Edexcel International A Level Business: Managing people and Entrepreneurs and leaders (YBS11)
Teaching guide to staffing, structure, motivation, leadership, entrepreneurs and objectives for Edexcel International A Level Business Unit 1.
Business · Pearson Edexcel · AS Level
Read guide -
Practice questions
Edexcel International A Level Business: Managing people and Entrepreneurs and leaders (YBS11) – Practice Questions
Ten original questions with worked answers on staffing, structure, motivation, leadership, entrepreneurs and objectives for Edexcel A Level Business.
Business · Pearson Edexcel · AS Level
Try questions -
Revision notes
Edexcel International A Level Business: Managing people and Entrepreneurs and leaders (YBS11) – Revision Notes
Condensed recall tables, quick calculations and a self-test for Edexcel International A Level Business Unit 1 people, leadership and entrepreneurs.
Business · Pearson Edexcel · AS Level
Revise topic
Related articles
-
teaching
A Level tuition in Dubai: Cambridge or Pearson Edexcel International A Level?
Schools in Dubai and Abu Dhabi teach either Cambridge International AS & A Level or Pearson Edexcel International A Level. How the two are structured, why it matters for tuition, and how online classes from Lahore work.
9 October 2026
-
curriculum guides
Choosing subjects at IGCSE and A Level
How subject choices at 14 and 16 affect university options later, and how to keep pathways open without overloading a timetable.
28 July 2026
Studying this with a teacher
Working through Business AS LEVEL?
This page is free and stays free. If you would rather be taught it, Marlbridge runs Business classes one-to-one and in small groups of up to 15, online in your own time zone. The first trial class is free. WhatsApp replies within an hour (8am–11pm Pakistan time, every day); email the same day.
Pearson Edexcel Business teachers at Marlbridge

