
Study Guides
Edexcel International A Level Business: Meeting customer needs and The market (YBS11)
Study guide to Edexcel International A Level Business Unit 1 sections 1.3.1 and 1.3.2: markets, research, positioning, demand, supply, PED and YED.
- Subject
- Business
- Level
- AS LEVEL
- Topic
- Marketing and people
- Author
- Marlbridge Academic Team
- Updated
- Reviewed by
- Salman Ahmad (what this means)
Aligned to Pearson Edexcel A Level Business (YBS11), Issue 1, September 2017. Official specification .
Syllabus page (what it covers and how it is assessed): Pearson Edexcel A Level Business.
Syllabus points this page covers
YBS11 (AS Level)
- 1.3.1 Meeting customer needs
- 1.3.2 The market
Found an error? Report a correction.
Need help with this topic? Request a free trial class for A Level Business (YBS11).
This guide covers sections 1.3.1 (Meeting customer needs) and 1.3.2 (The market) of Unit 1, Marketing and people, in the Pearson Edexcel International Advanced Subsidiary/Advanced Level in Business specification, Issue 1, September 2017. Unit 1 is a 2-hour written examination marked out of 80 marks. Questions are based on sources, and some need quantitative skills.
Use it with the Unit 1 overview guide, the revision notes and the practice set. Related pages: Unit 1 revision notes and Unit 1 practice questions. Course hub: Edexcel A Level Business. Checklist: printable checklist. To find weak spots first, take a free diagnostic.
The businesses below are invented. This guide gives the standard form of each formula; the specification names the calculations but does not print the formulas.
What you must be able to do
| Section | Content points |
|---|---|
| 1.3.1 (1) | Mass and niche markets; market size and share; brands; dynamic markets; competition; risk and uncertainty |
| 1.3.1 (2) | Primary and secondary, quantitative and qualitative research; the methods; random, quota and stratified sampling |
| 1.3.1 (3) | Product and market orientation; market mapping; segmentation; competitive advantage; differentiation; adding value |
| 1.3.2 (1-2) | Factors changing demand; factors changing supply |
| 1.3.2 (3) | Interaction of demand and supply; drawing and interpreting diagrams |
| 1.3.2 (4-5) | PED and YED: calculation, interpretation, influences, significance to businesses |
1.3.1 (1): The market
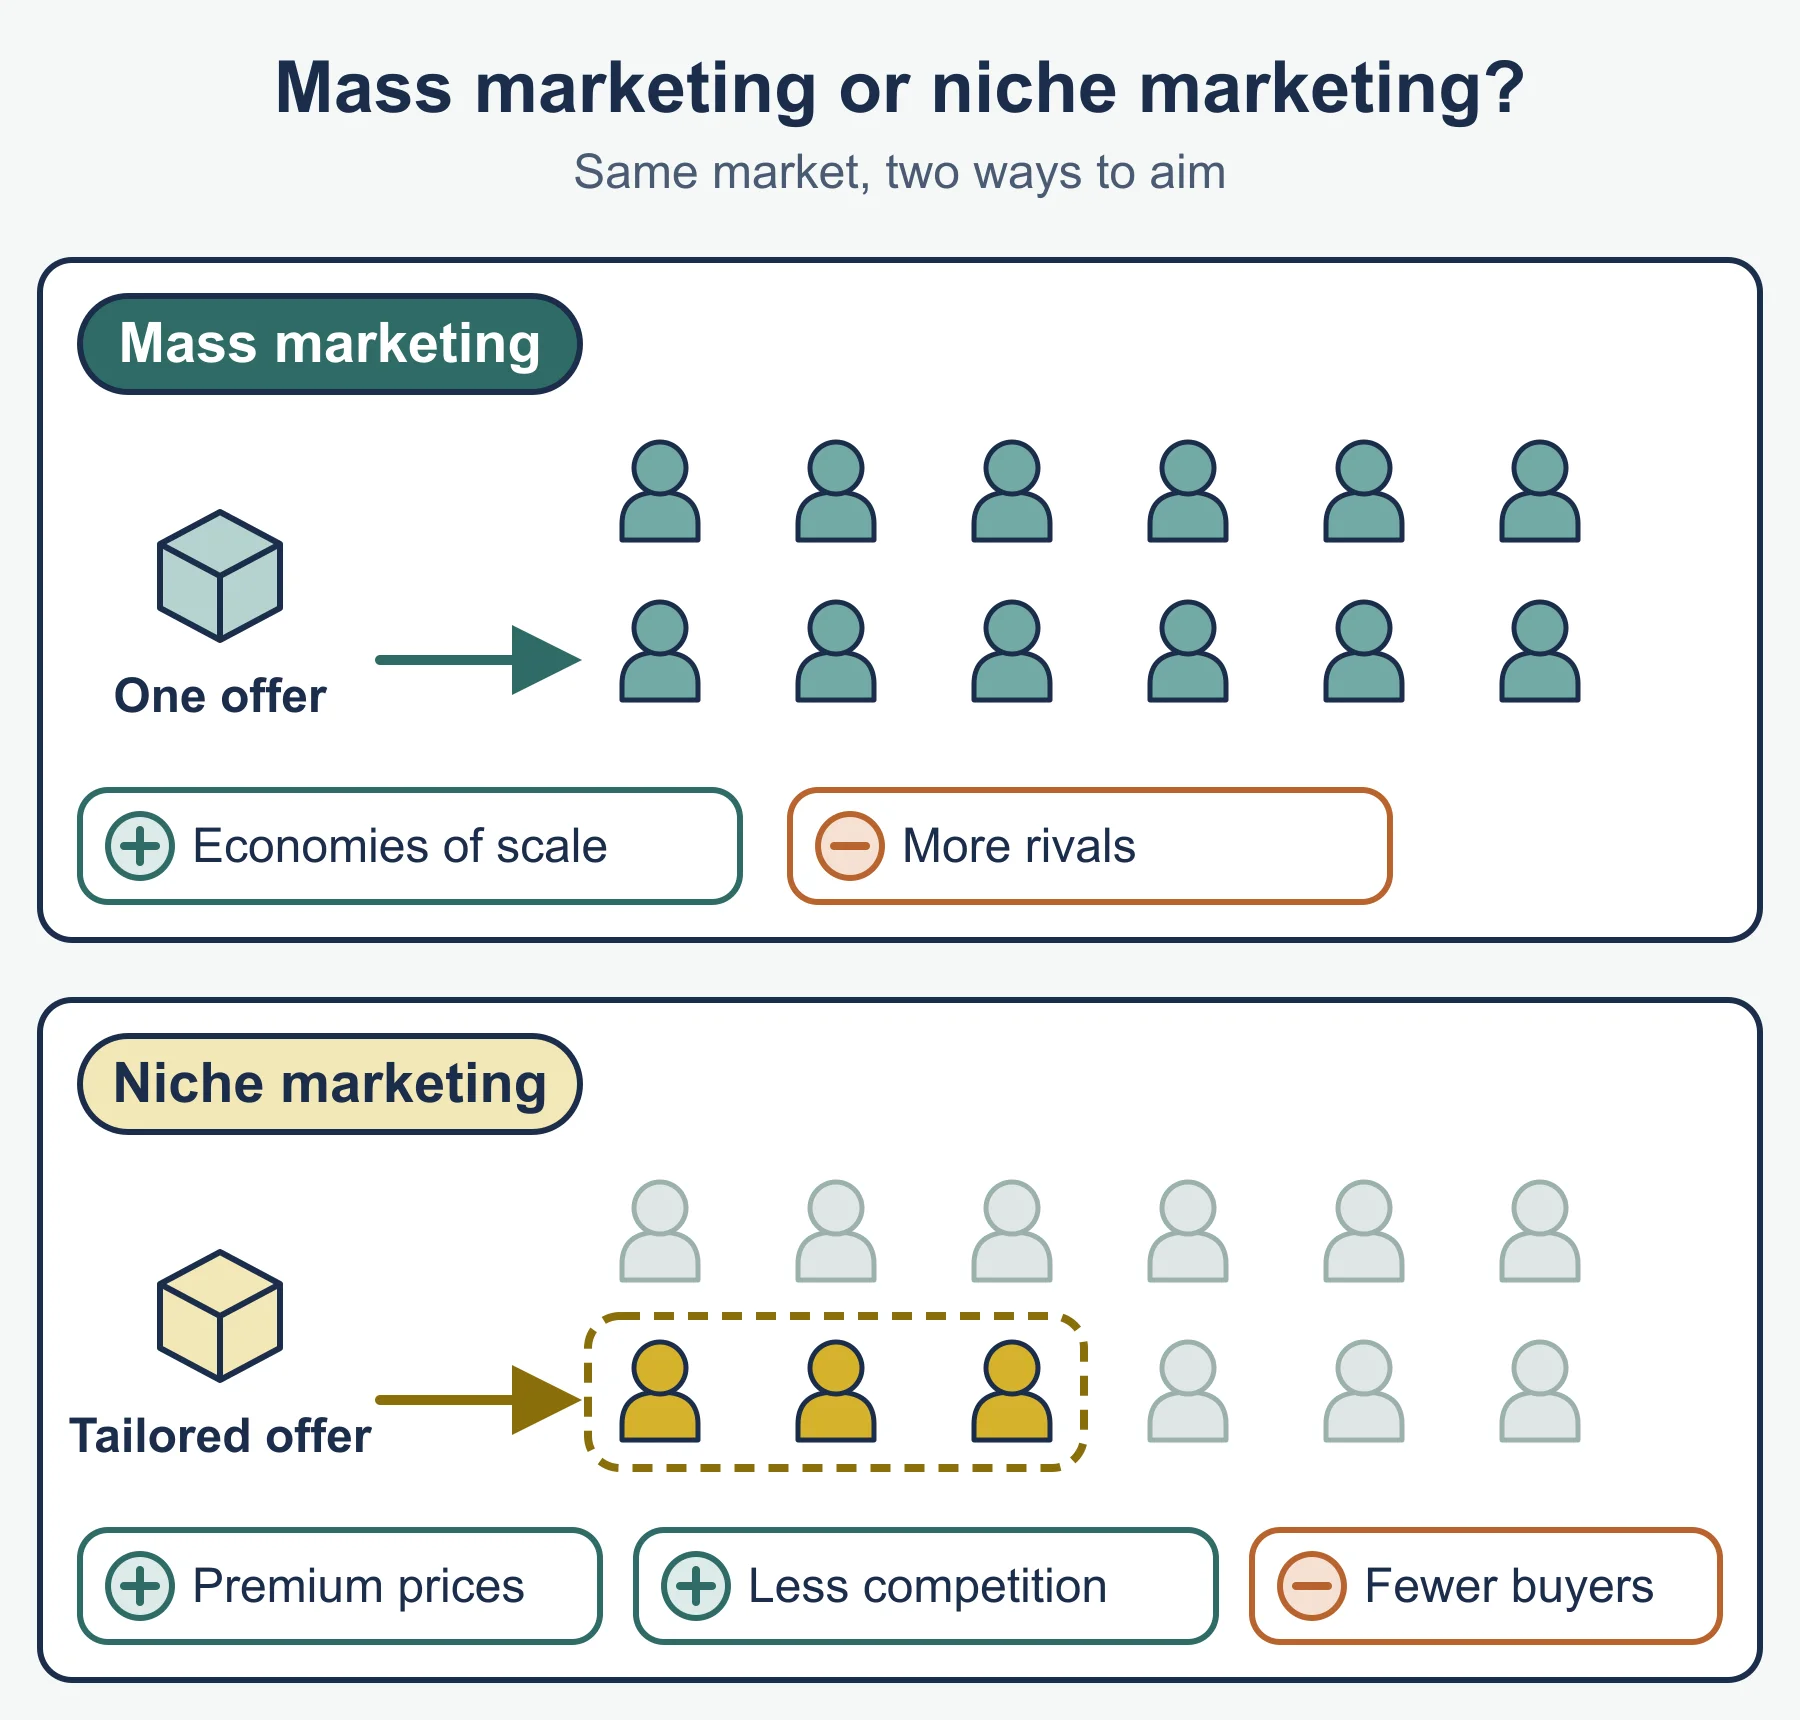
Mass markets sell a standardised product to a large number of customers, so unit costs can be low but competition is intense. Niche markets serve a small, specialised group, so volumes are lower but customers may accept higher prices and rivals are fewer. Characteristics to compare: customer numbers, price levels, competition, and how easily the firm can be replaced.
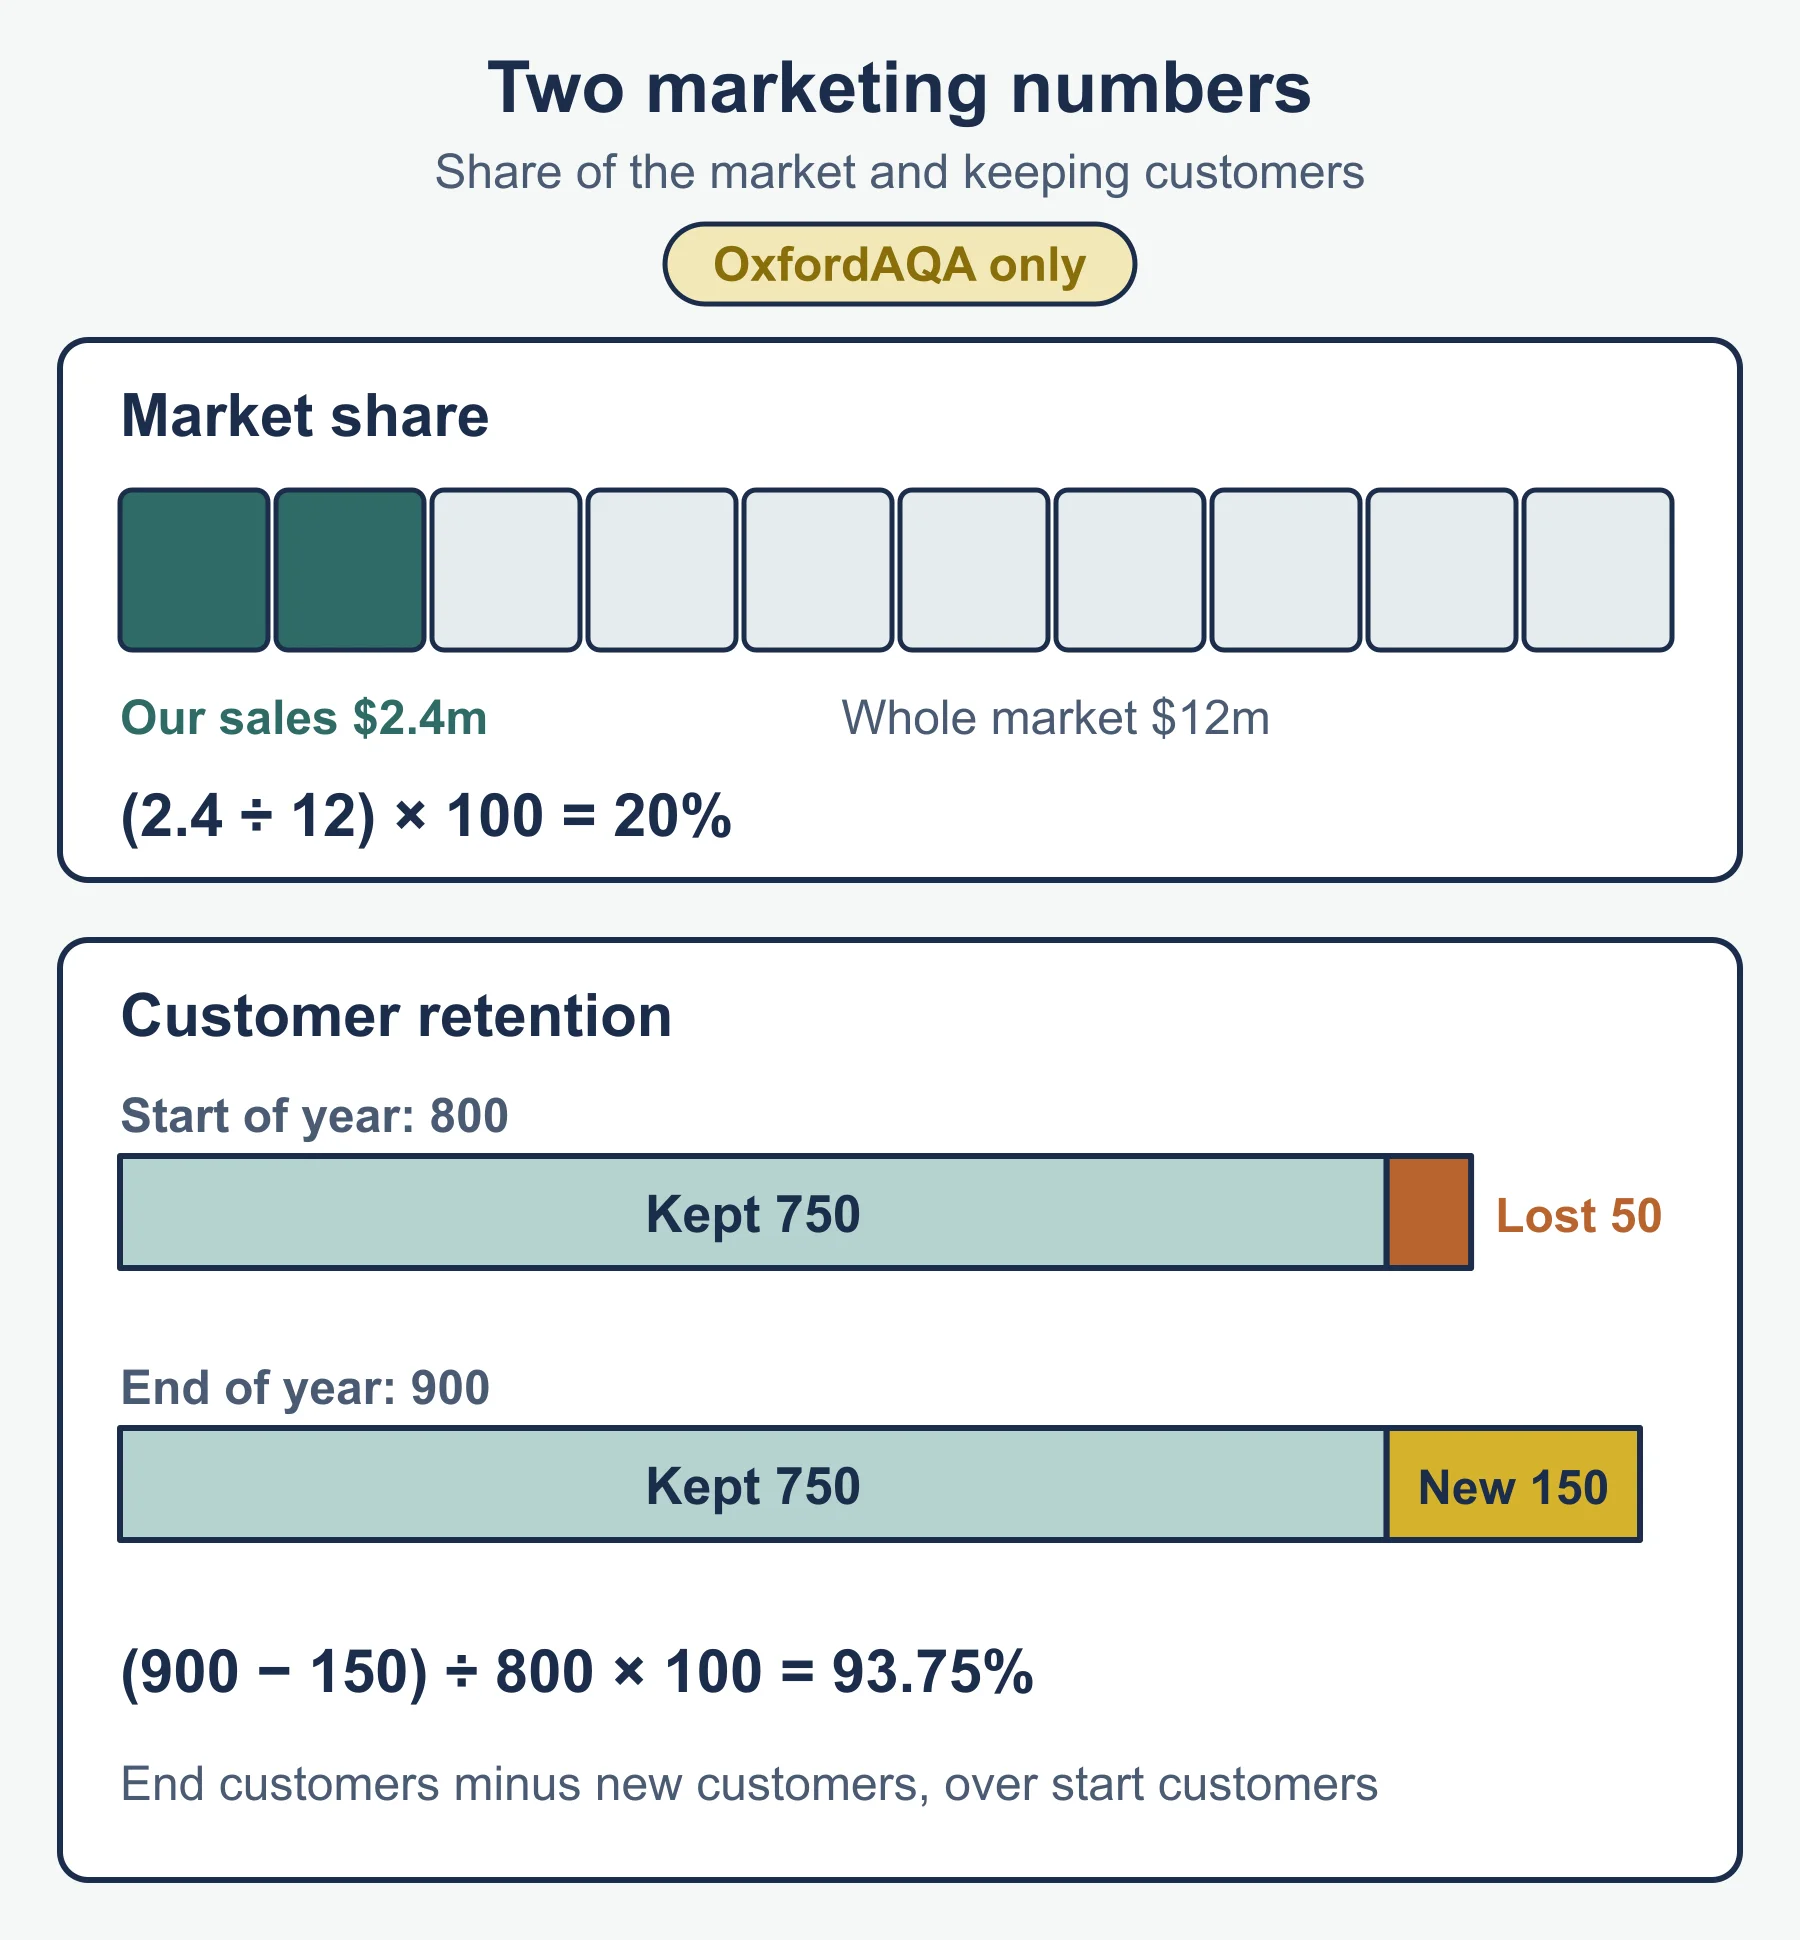
Market size is the total sales (by value or volume) of all firms. Market share is one firm’s slice of it:
market share (%) = firm's sales / total market sales x 100
market growth (%) = change in market size / original size x 100
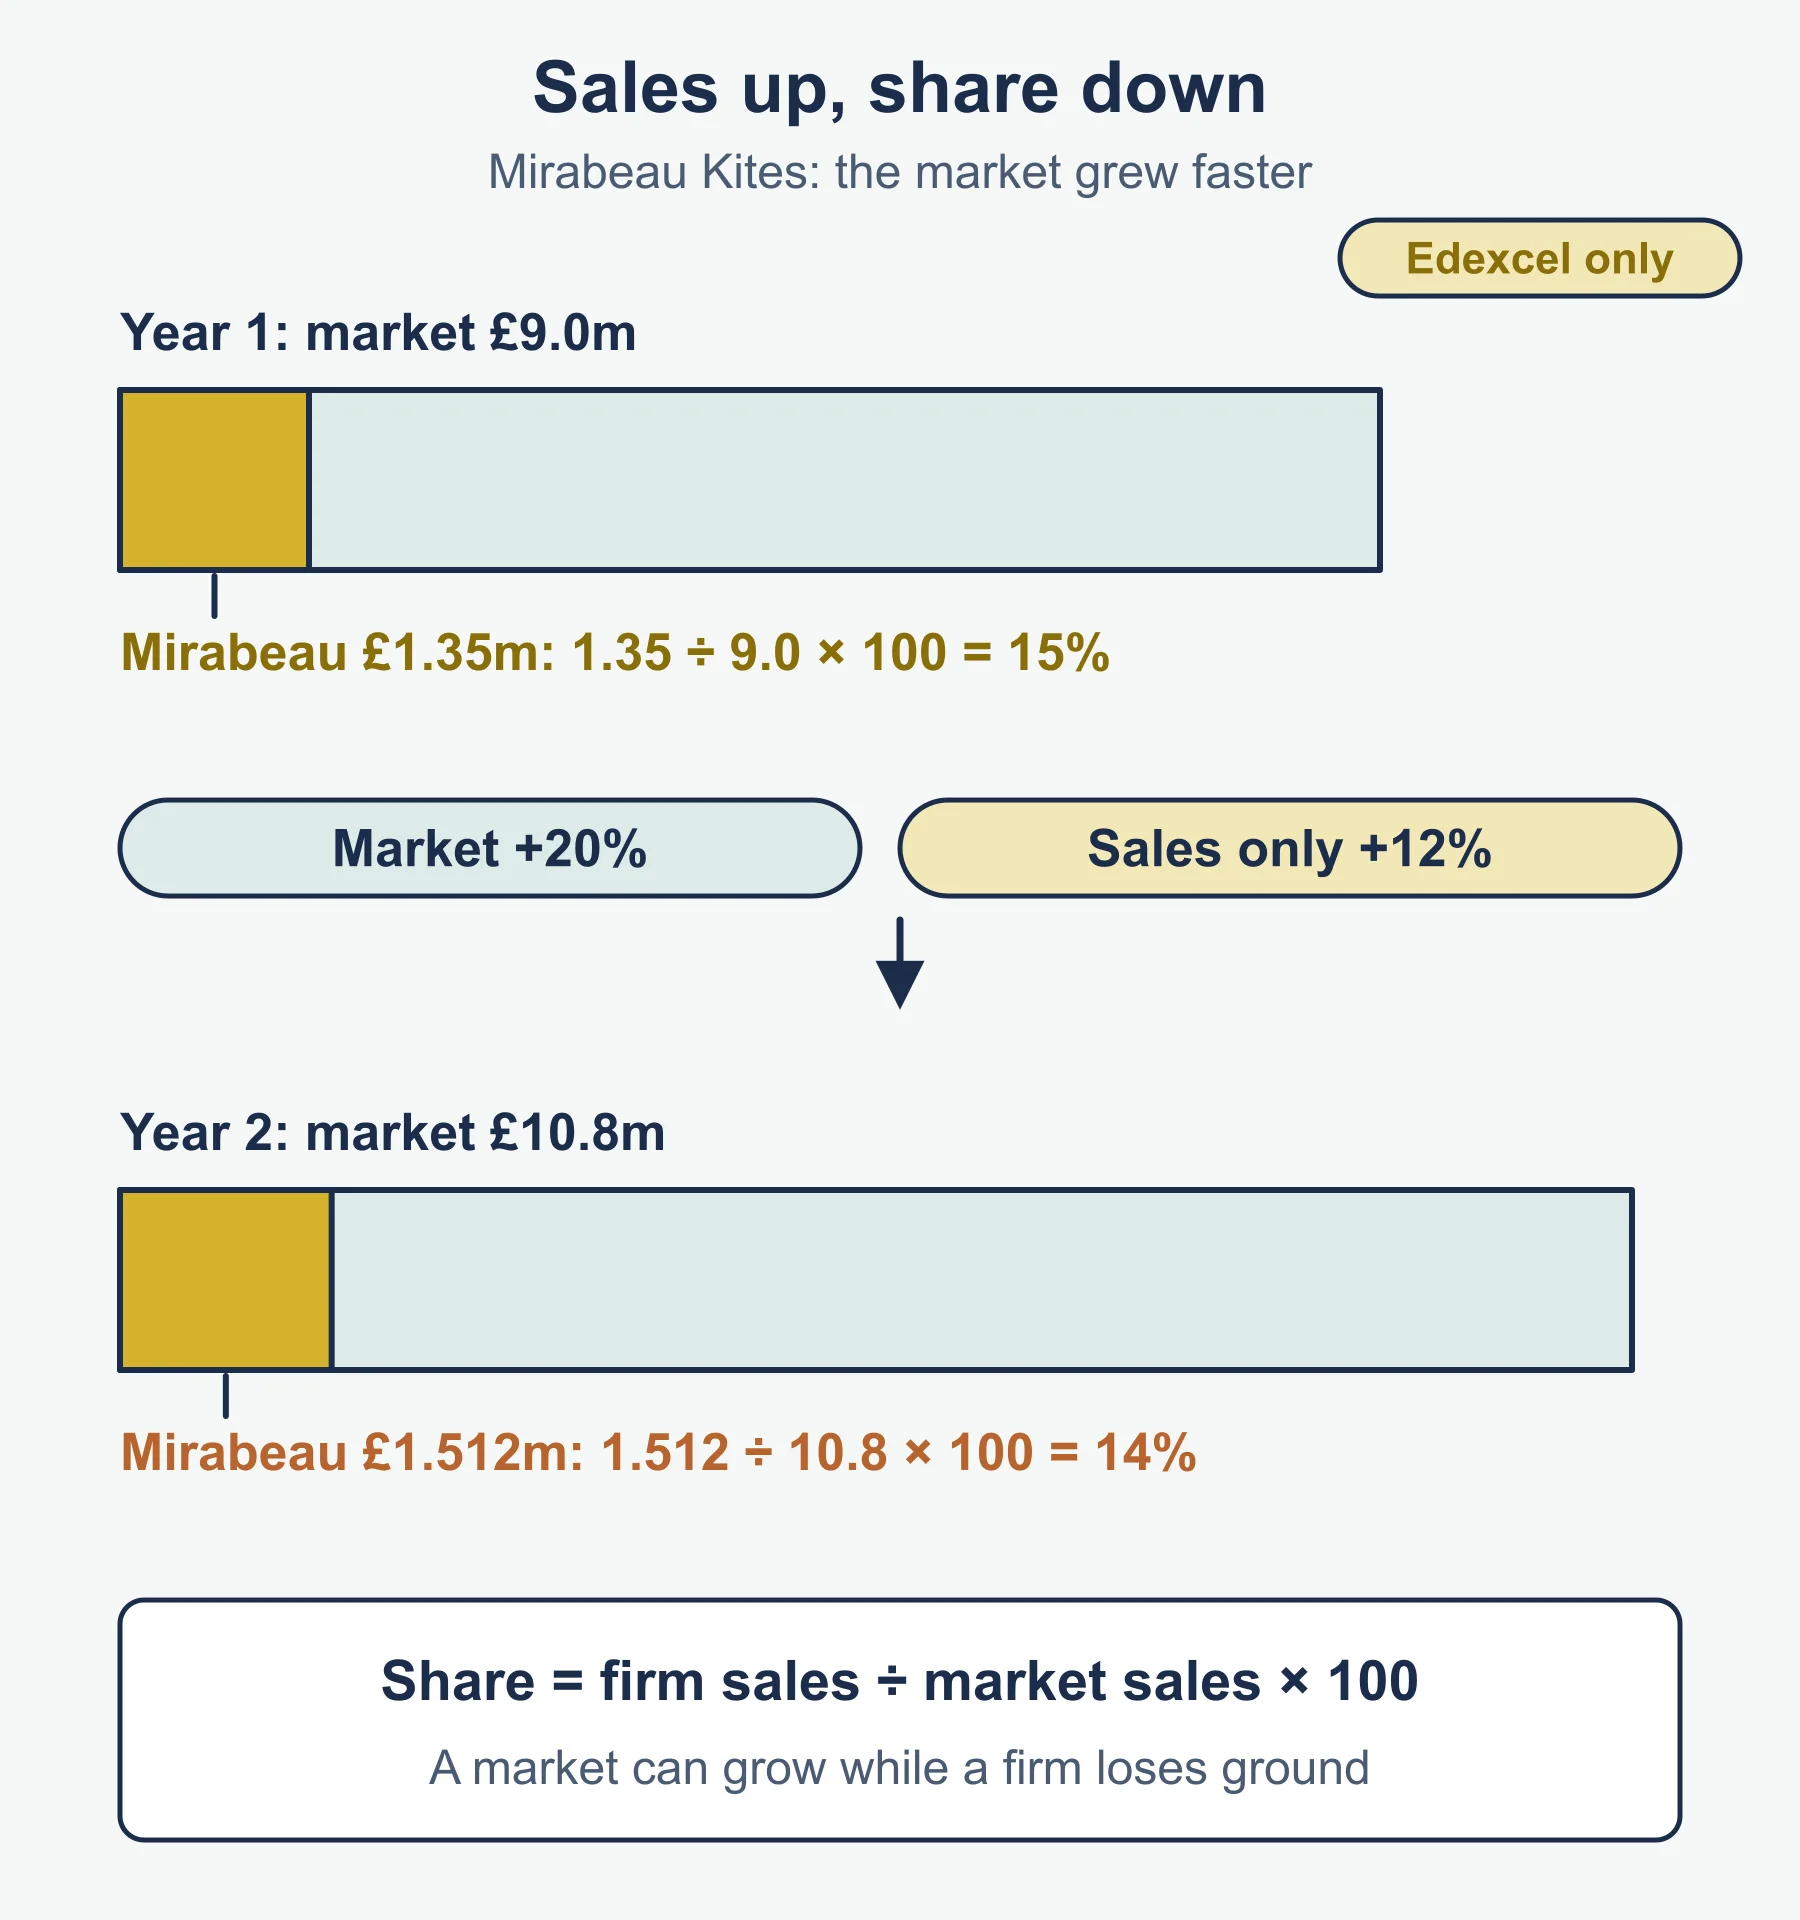
Worked example. Mirabeau Kites sells £1.35m in a £9.0m market, so its share is 1.35 / 9.0 x 100 = 15%. The market grows 20% to £10.8m. Mirabeau’s sales grow only 12% to £1.512m. New share = 1.512 / 10.8 x 100 = 14%. Sales rose, yet share fell. A market can grow while a firm loses ground.
Brands are names, symbols or images that identify a product and set it apart. A strong brand can support a higher price, build loyalty and make customers less willing to switch, which links directly to PED below.
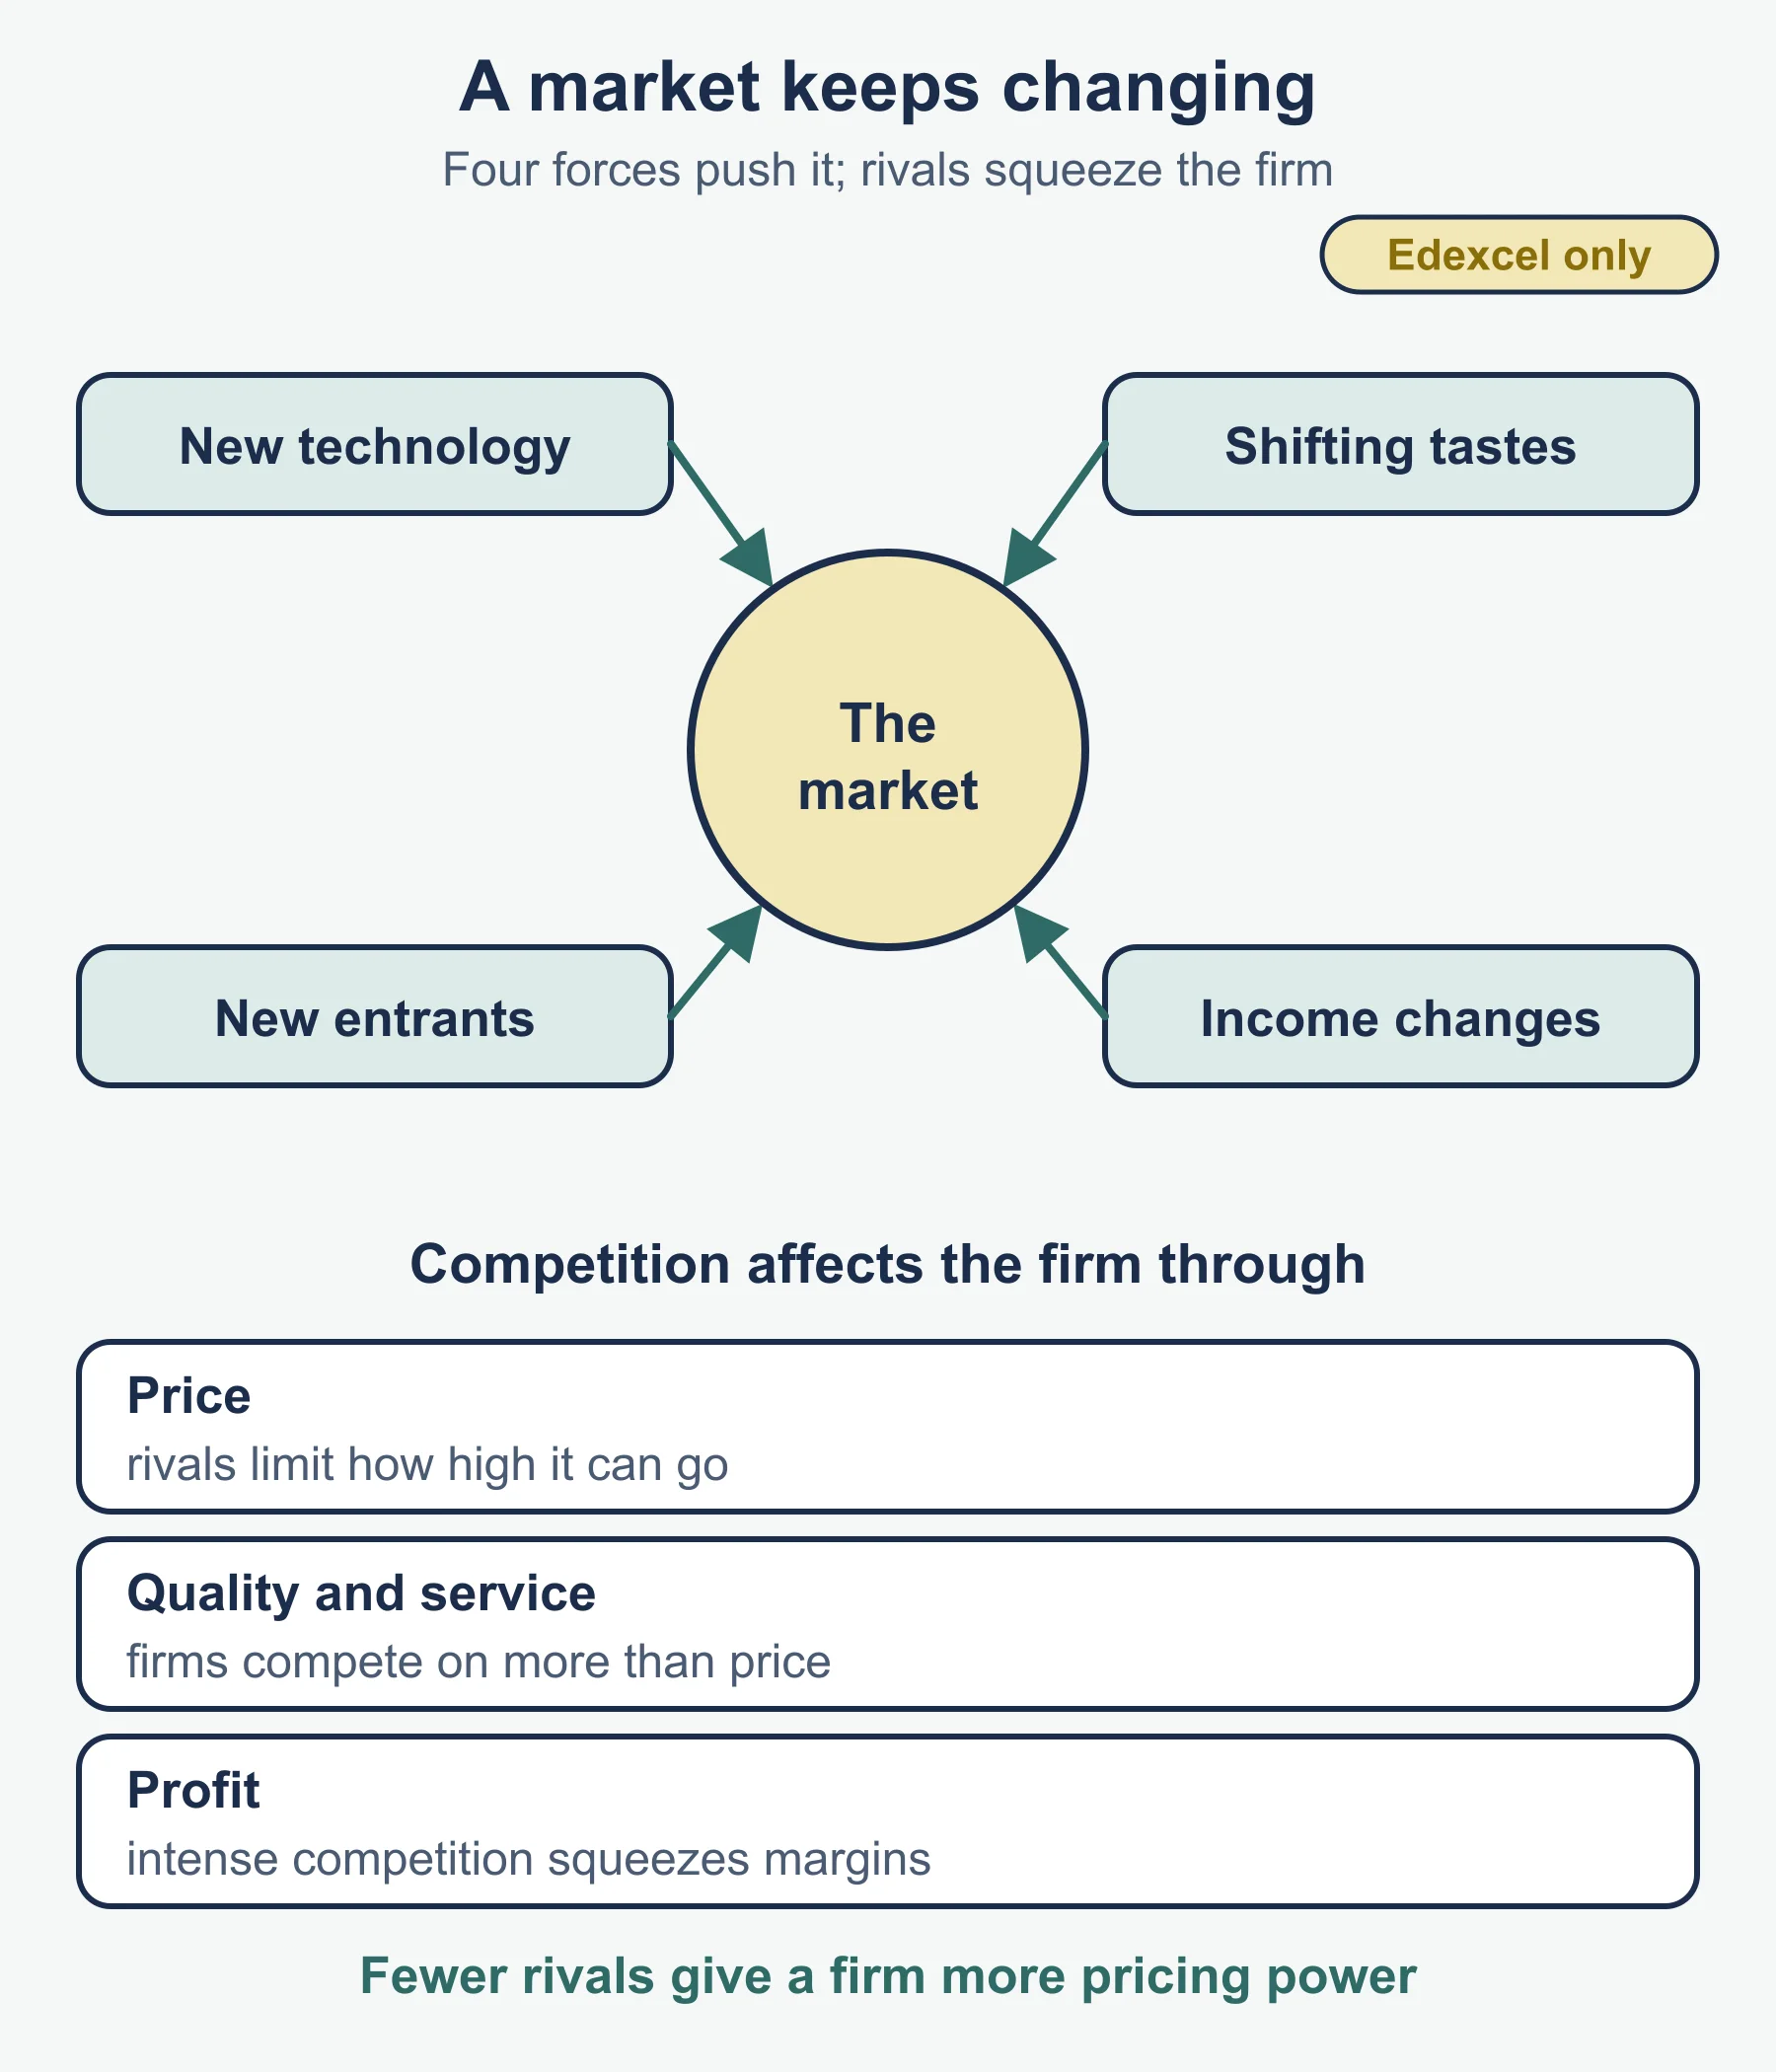
Dynamic markets keep changing. Online retailing widens customer choice and lets small firms reach buyers directly. Markets change through new technology, shifting tastes, new entrants and changes in income. Innovation can create growth by opening new uses or customers. Adapting to change means monitoring the market, updating products and channels, and being flexible about costs.
Competition affects the market through prices (rivals constrain a firm’s ability to raise price), quality and service (firms compete on more than price), and profit (intense competition squeezes margins). Fewer rivals give a firm more pricing power.
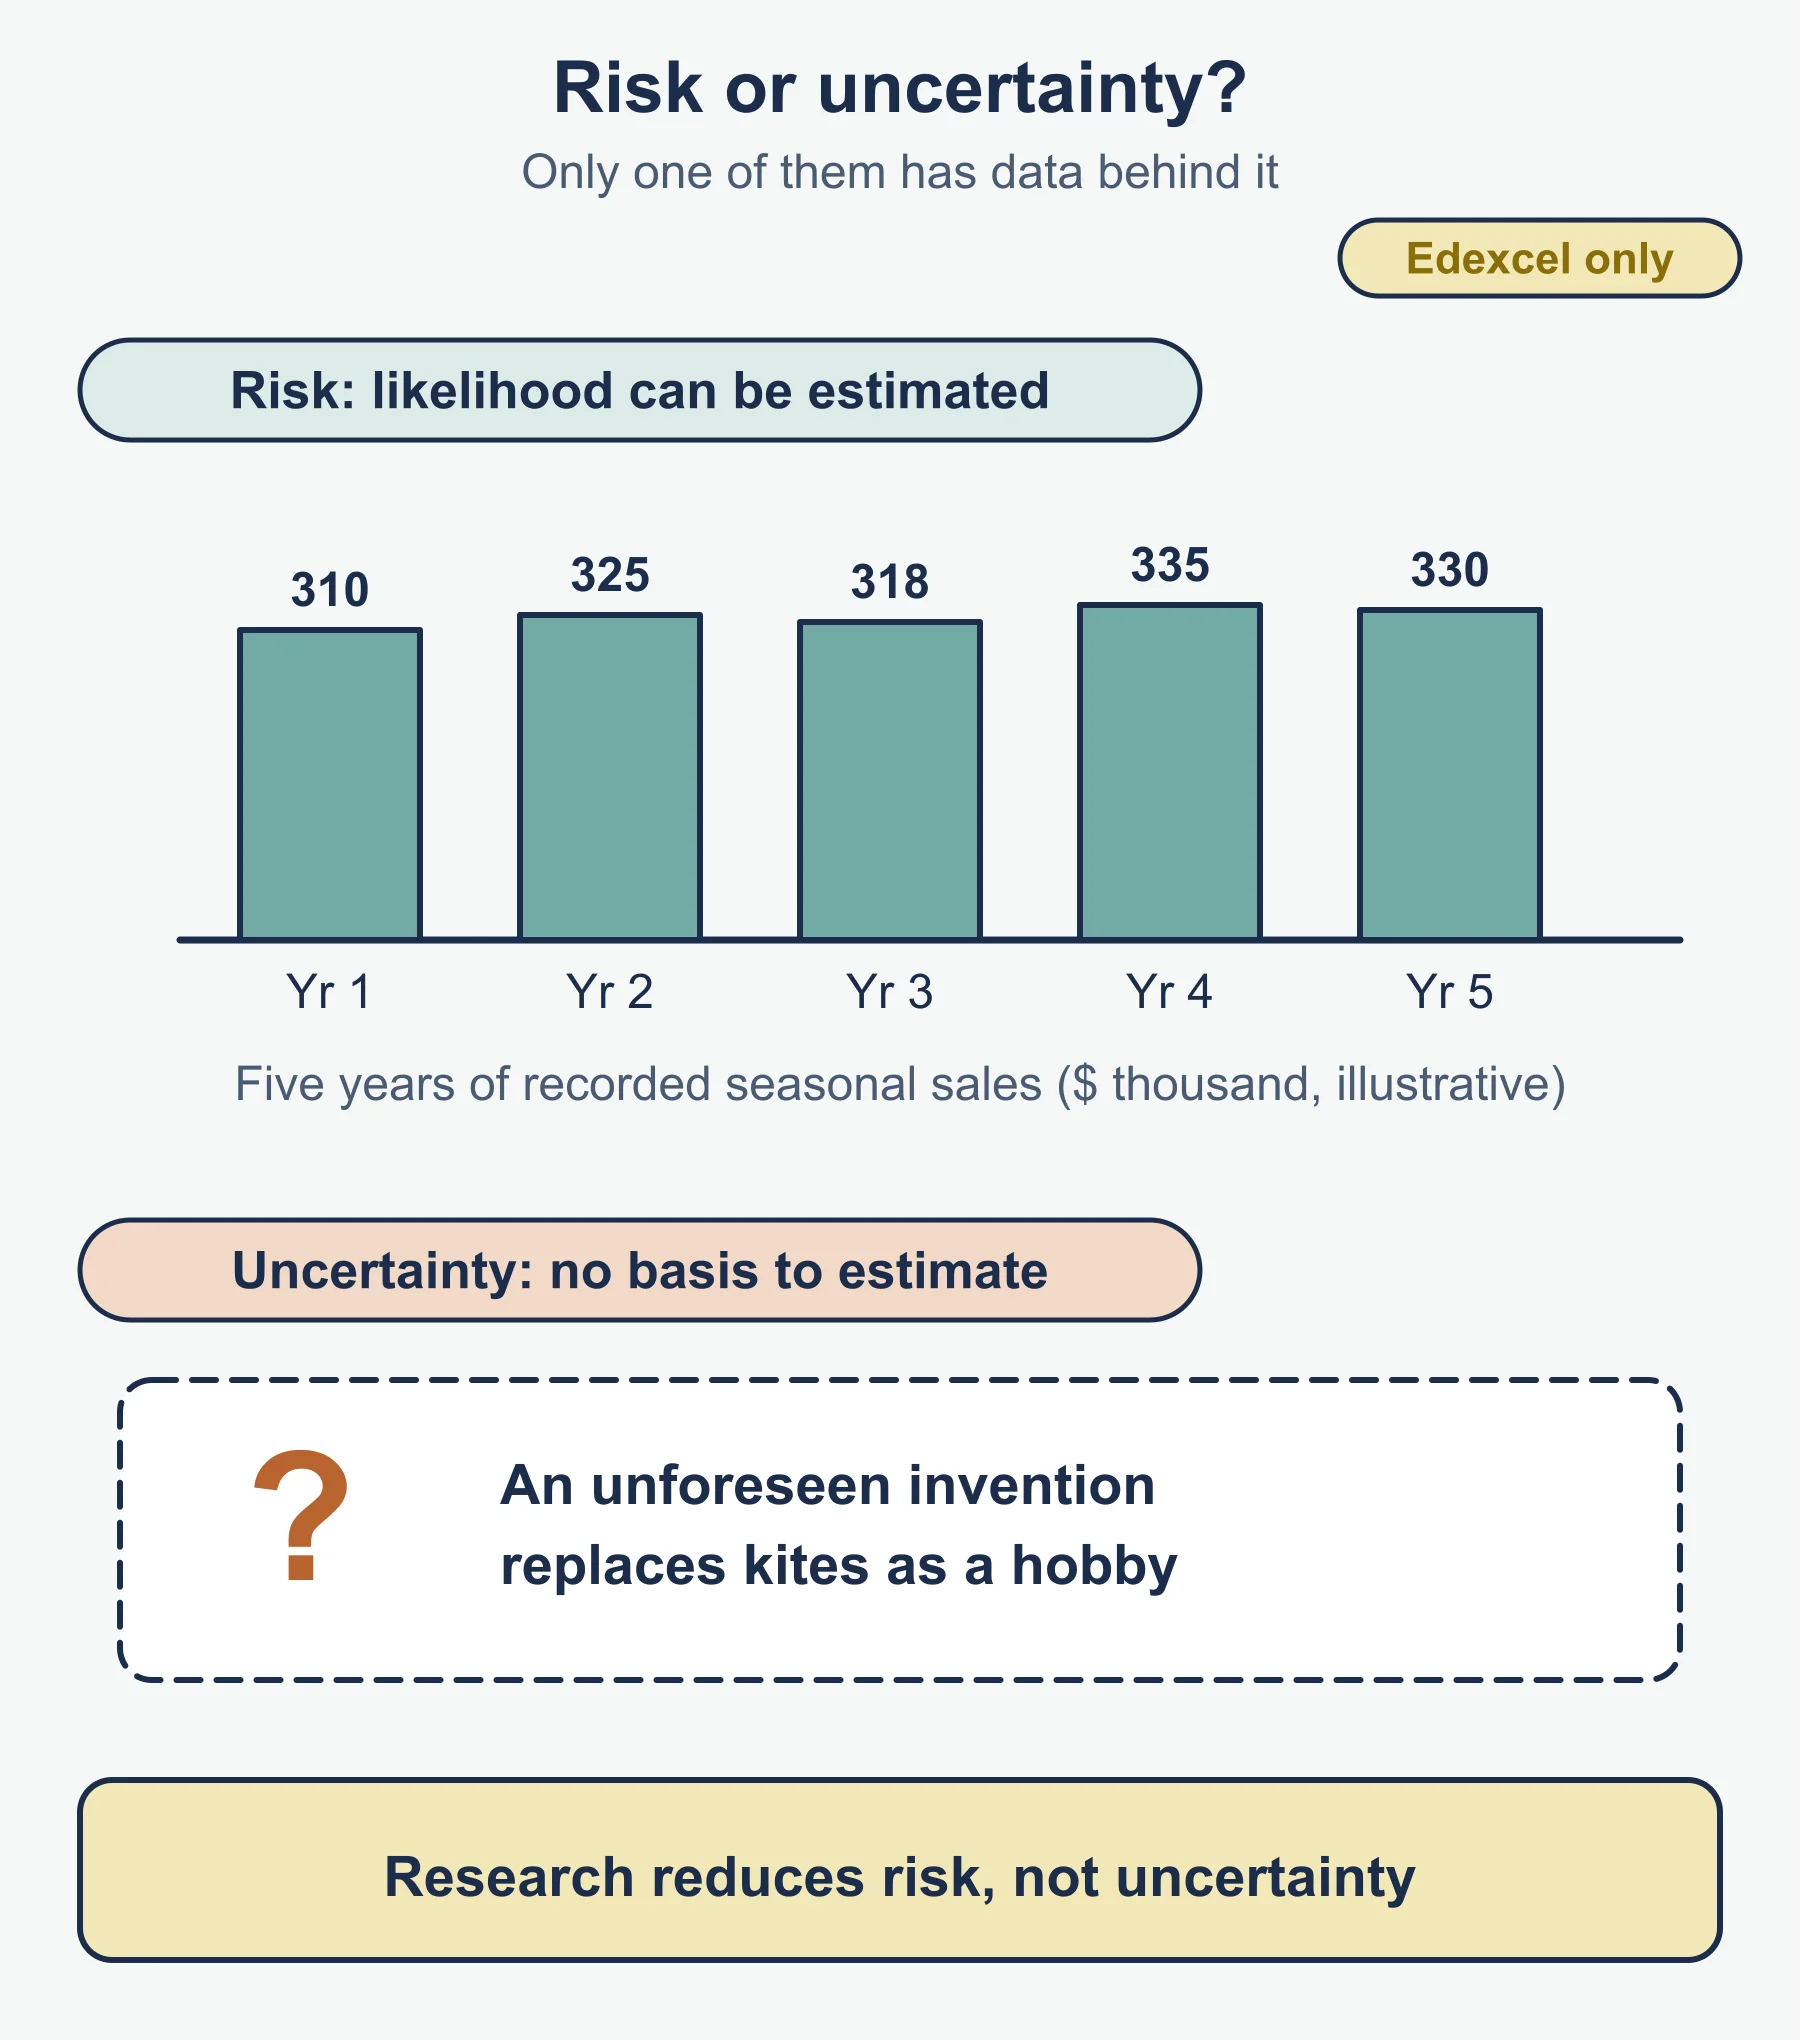
Risk and uncertainty. A risk can be measured because there is data to estimate its likelihood, such as seasonal sales that Mirabeau has recorded for five years. Uncertainty cannot be measured because there is no reliable basis for estimating the outcome, such as an unforeseen invention that replaces kites as a hobby. Research reduces risk but cannot remove uncertainty.
1.3.1 (2): Market research
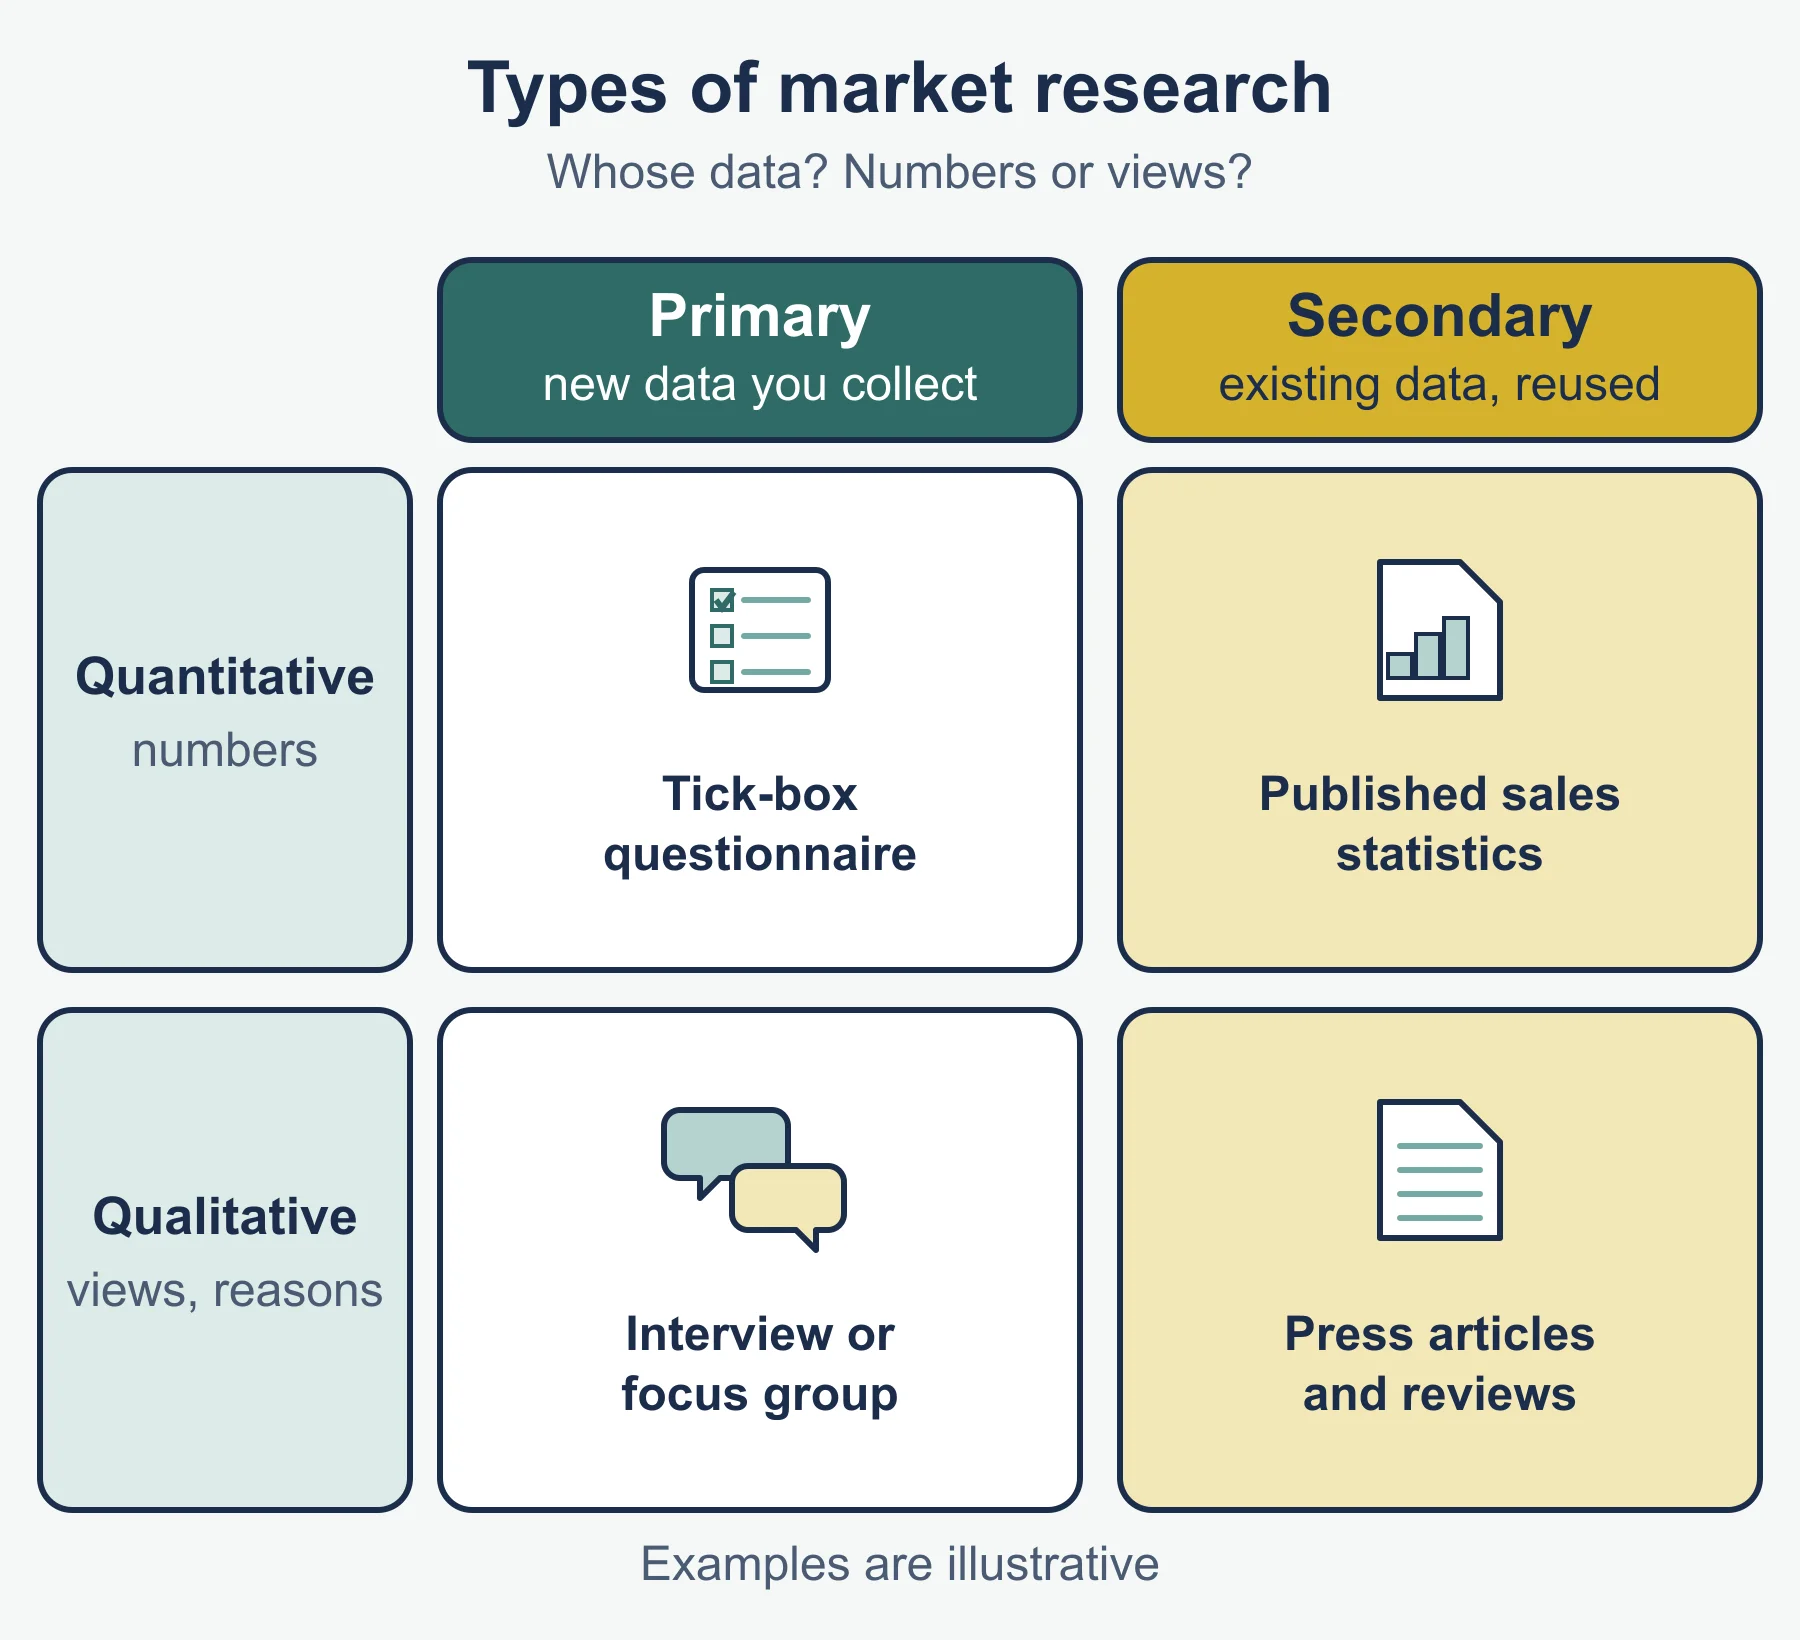
Research is used to identify and anticipate customer needs and wants, quantify likely demand and gain insight into consumer behaviour.
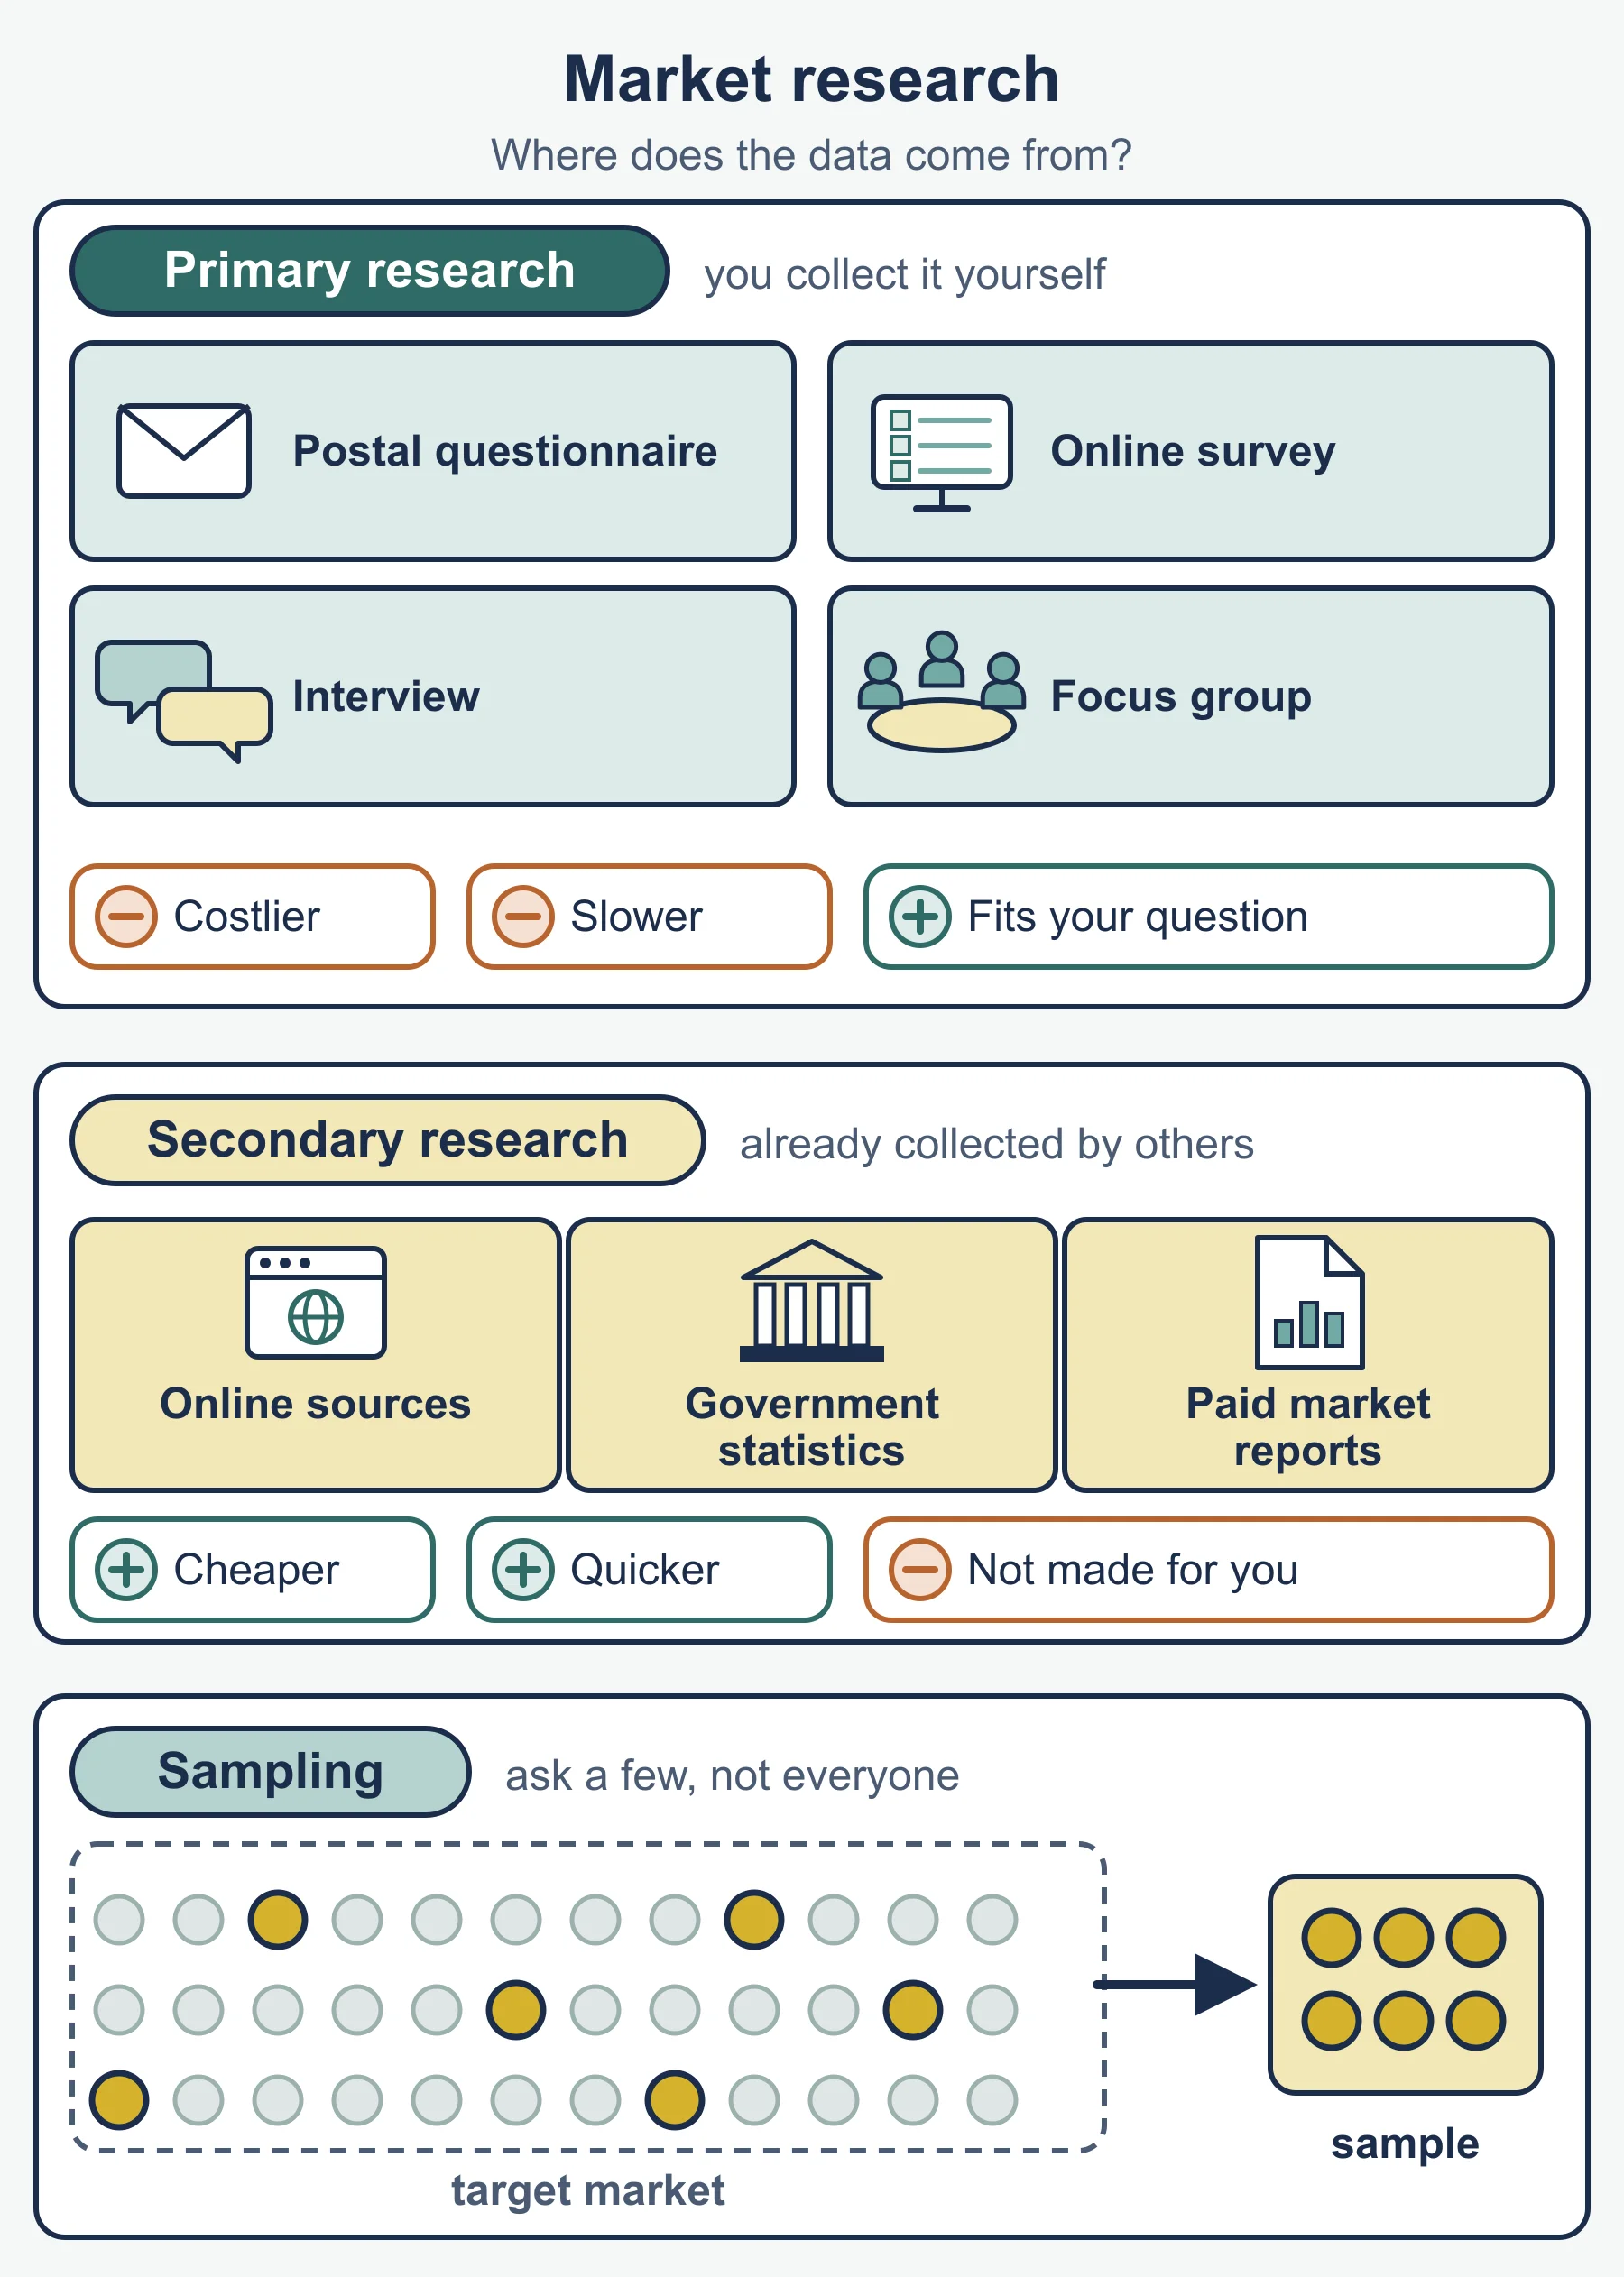
- Primary research is collected first-hand for the firm’s own purpose. It is specific and up to date but costly and slow.
- Secondary research already exists. It is cheaper and quicker but may be dated or not fit the question.
- Quantitative data is numerical (how many, how much). Qualitative data is about opinions, attitudes and reasons (why).
| Primary methods | Typical use |
|---|---|
| Surveys/questionnaires | Reach many people cheaply; results are easily quantified |
| Focus groups/consumer panels | Explore attitudes in depth; small groups may not be representative |
| Face-to-face/telephone interviews | Probe answers; interviewer time is costly |
| Product trials/test marketing | Test real purchasing behaviour before a full launch |
Secondary sources: websites and social media; newspapers, magazines, TV and radio; reports; databases.
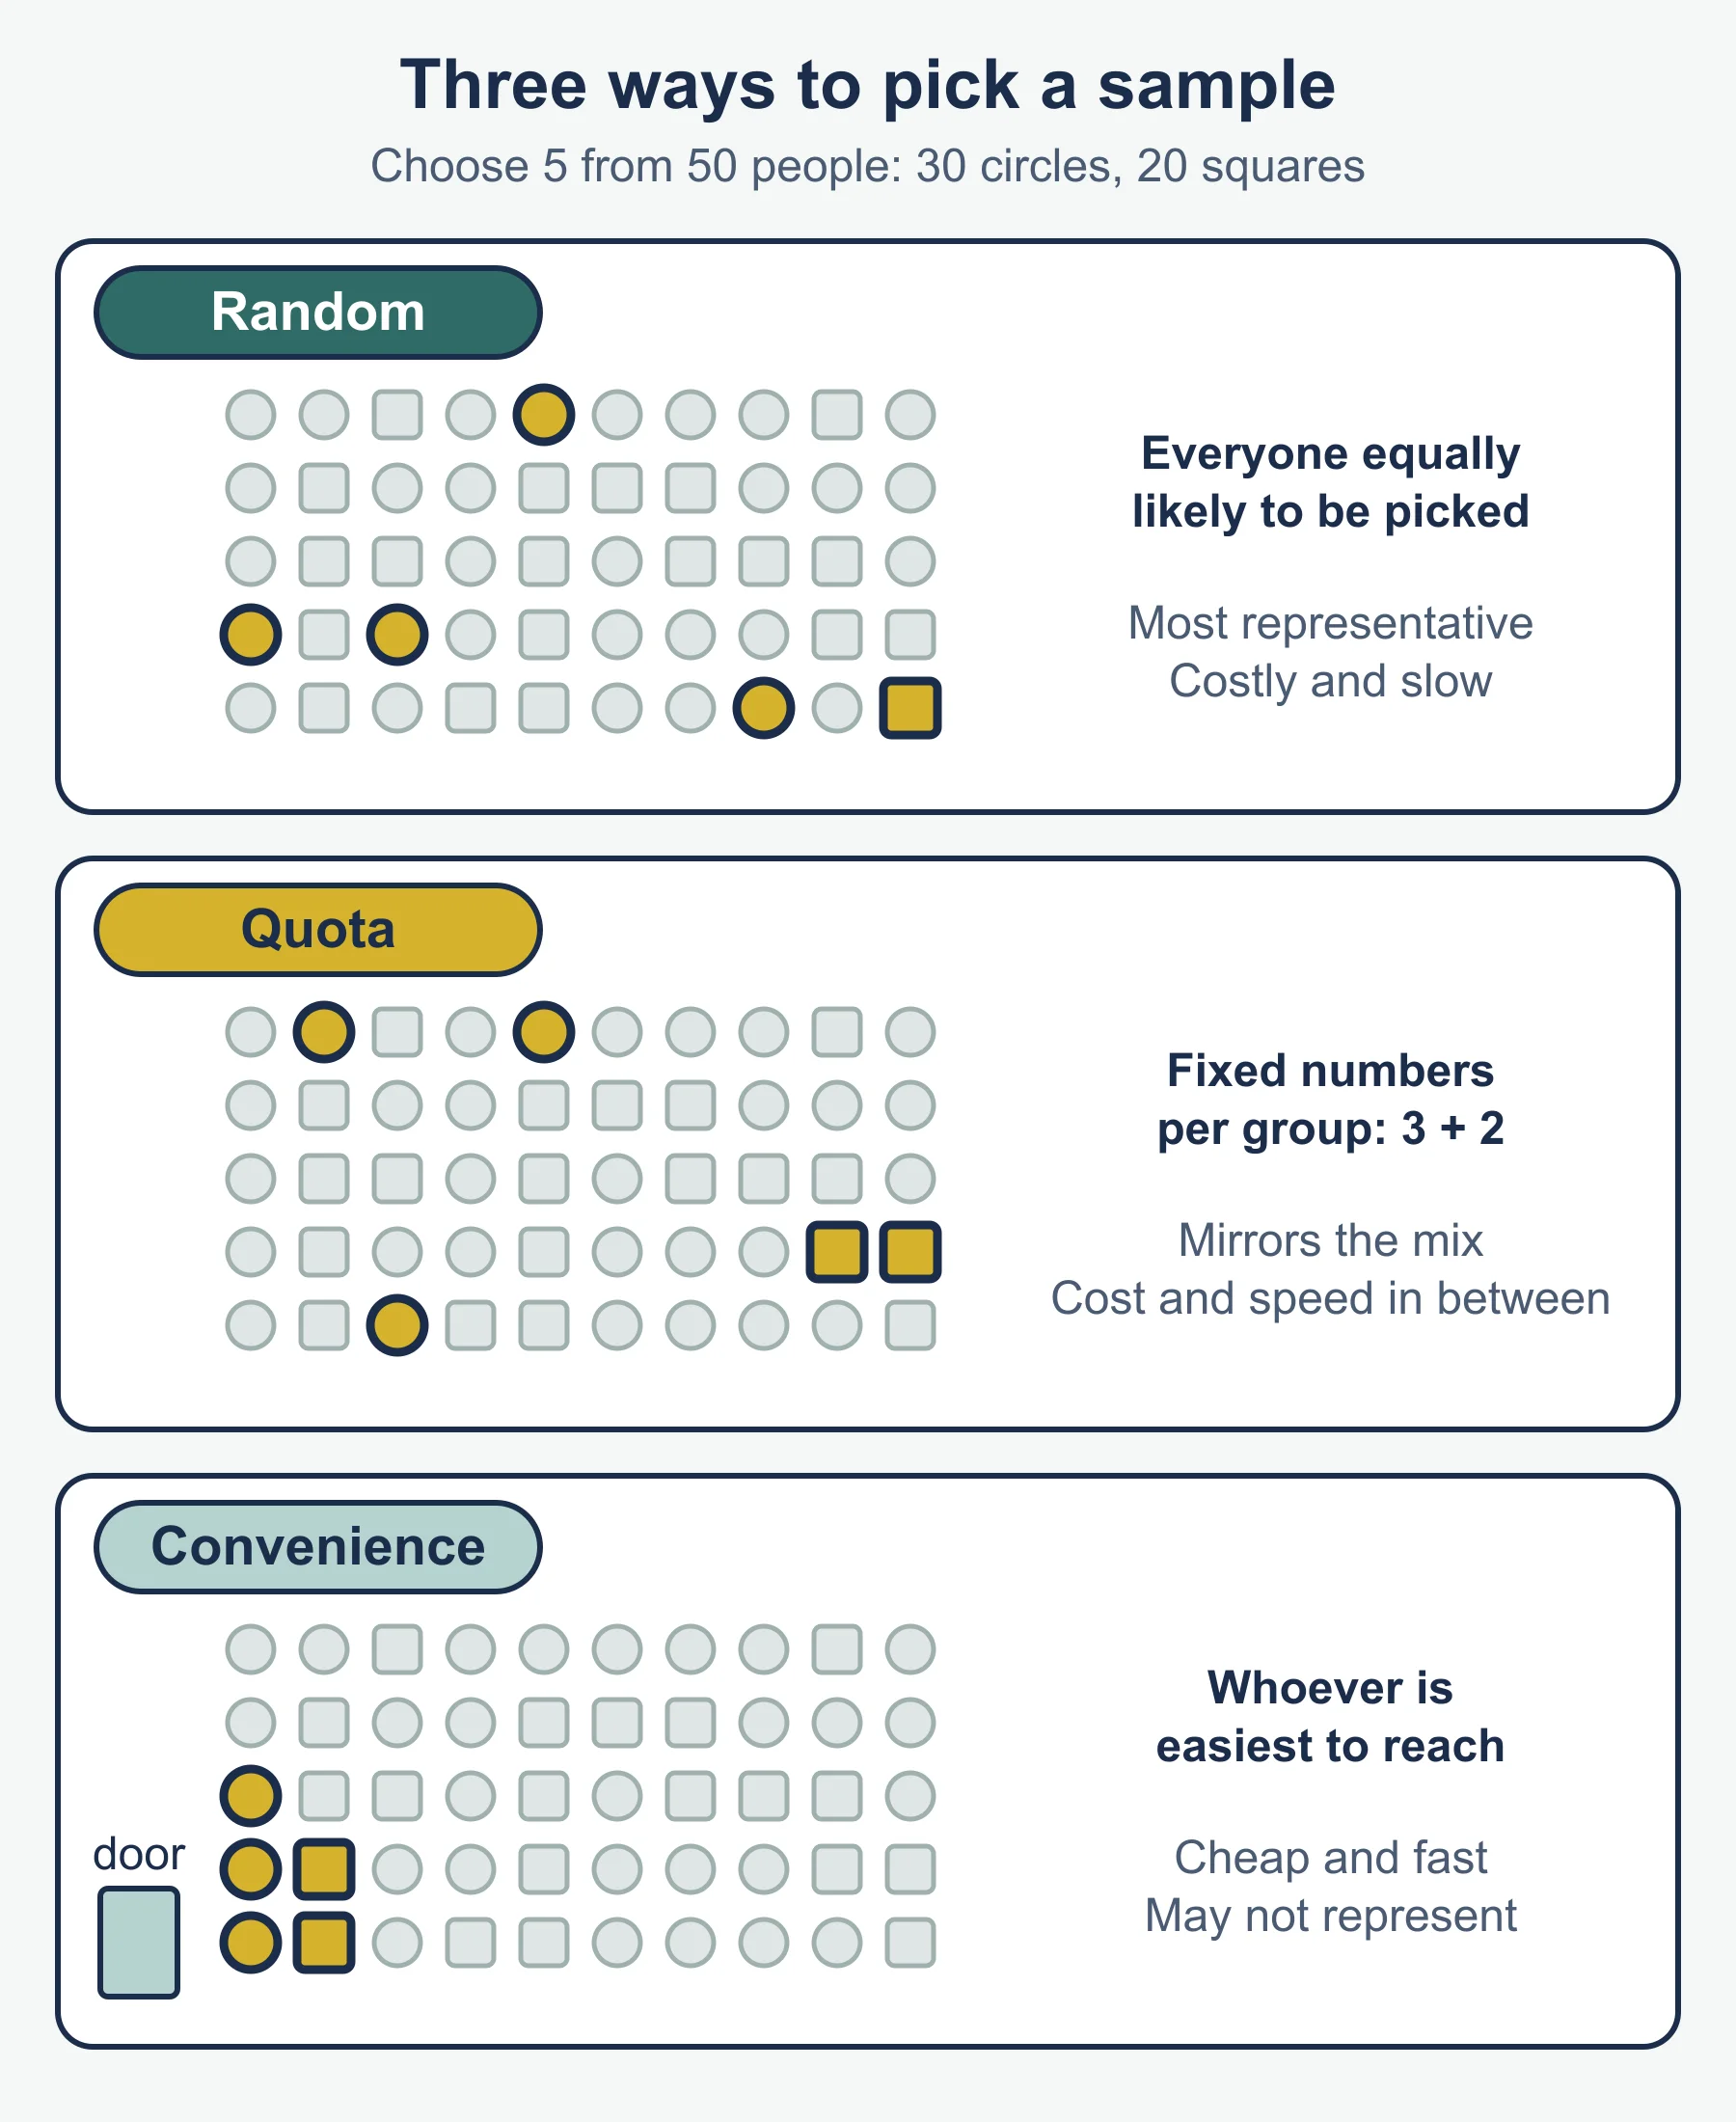
Sampling. A sample is a subset of the target population. Three methods are listed:
- Random: every member has an equal chance of selection. It limits bias but may miss small groups.
- Quota: interviewers fill set numbers from chosen groups (such as 40 under-30s). It is quick, but because choice within each quota is not random, bias is possible.
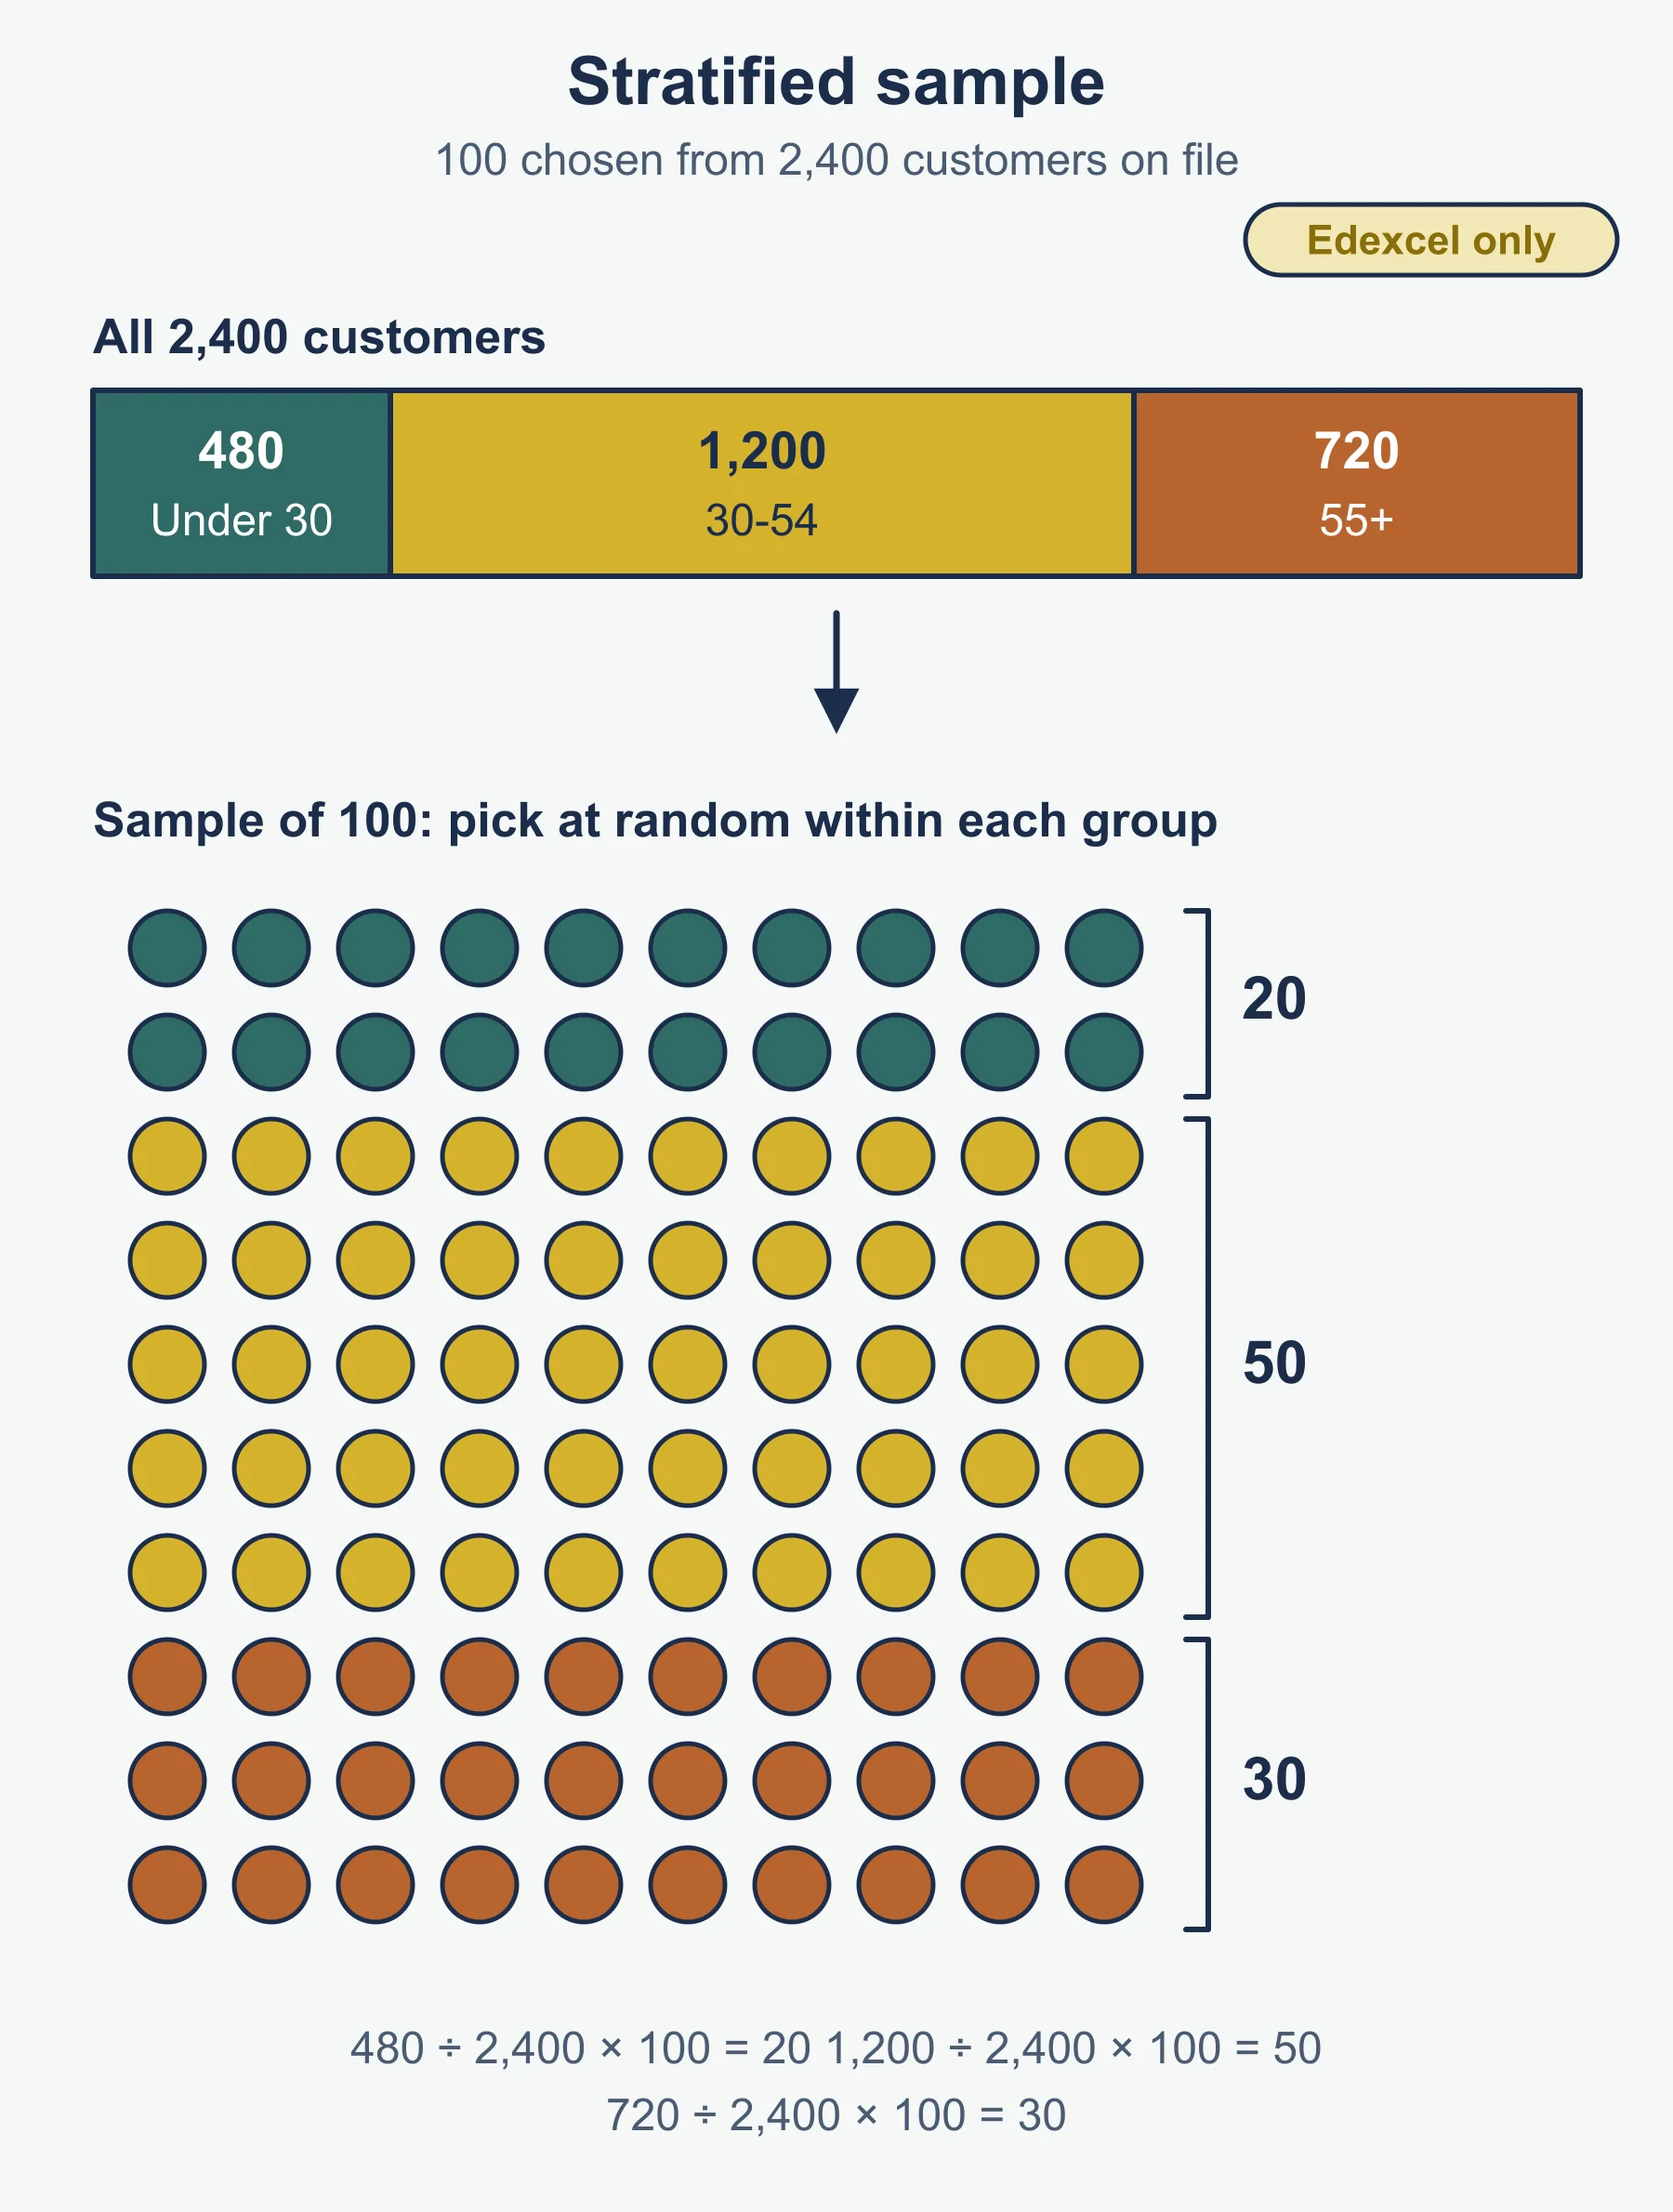
- Stratified: split the population into groups, then draw randomly from each in proportion to its size.
Worked example. Oakhampton Preserves has 2,400 customers on file: 480 under 30, 1,200 aged 30-54, 720 aged 55 or over. For a stratified sample of 100: under 30 = 480 / 2,400 x 100 = 20; 30-54 = 1,200 / 2,400 x 100 = 50; 55+ = 720 / 2,400 x 100 = 30. These total 100, and each group is then picked at random.
1.3.1 (3): Market positioning
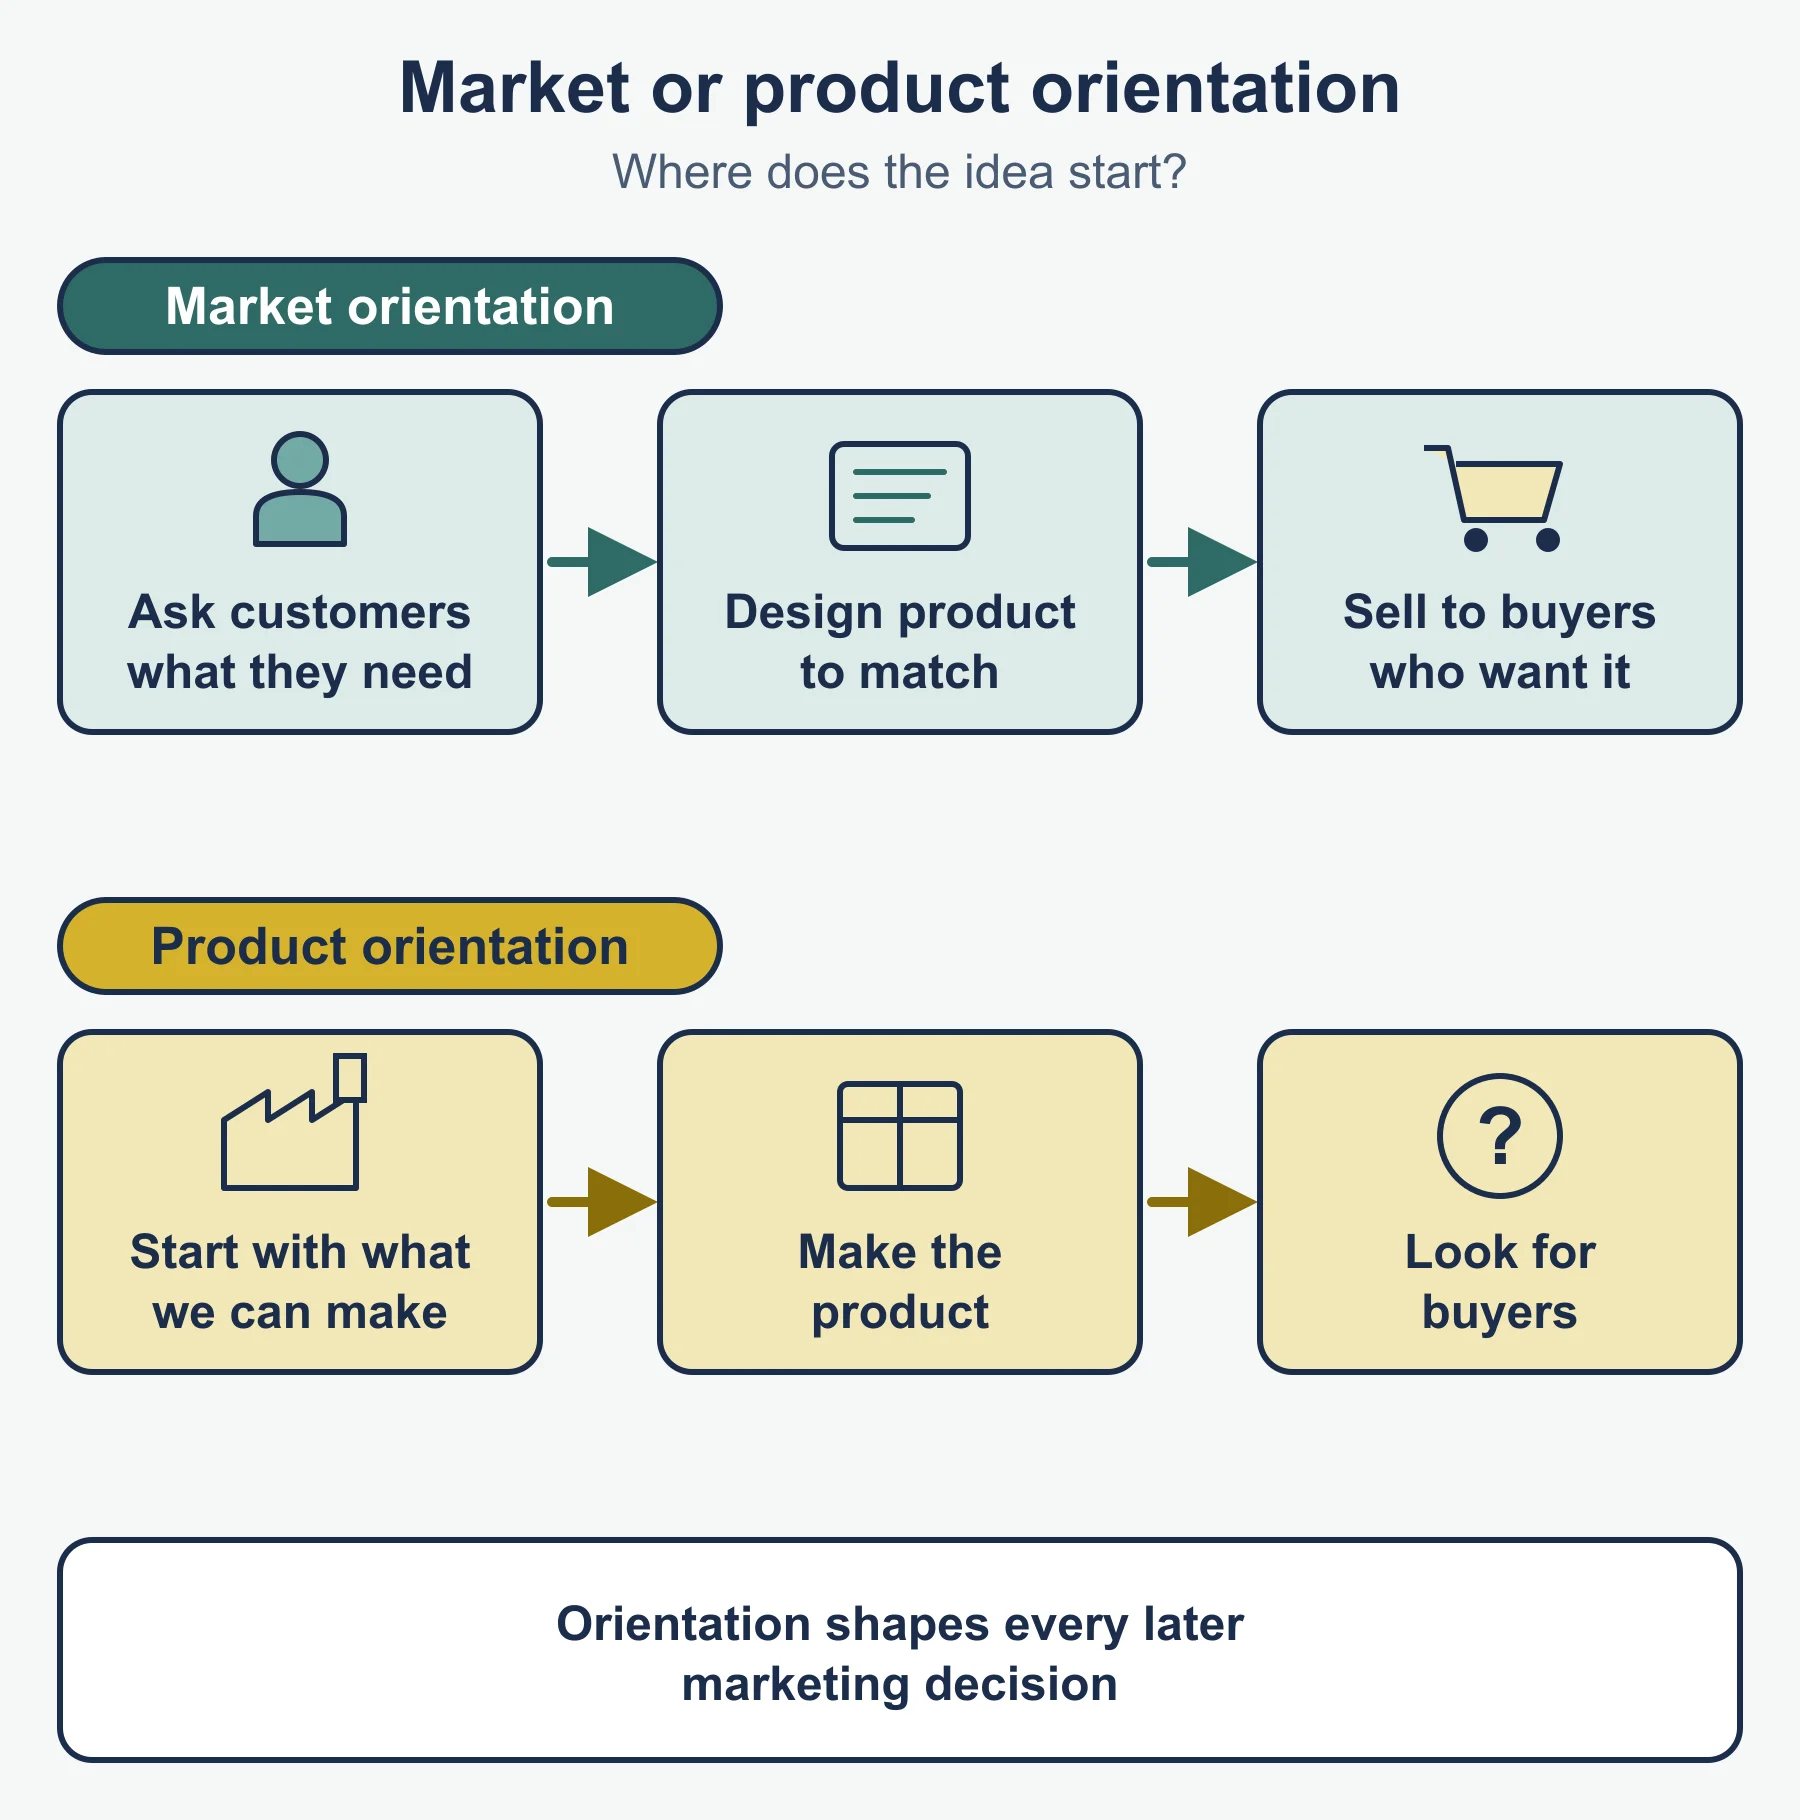
Product orientation starts from what the firm can make, then looks for buyers. Market orientation starts from what customers want, using research, then designs the product. Product orientation can work for genuinely new inventions; market orientation reduces the risk of making something nobody wants.
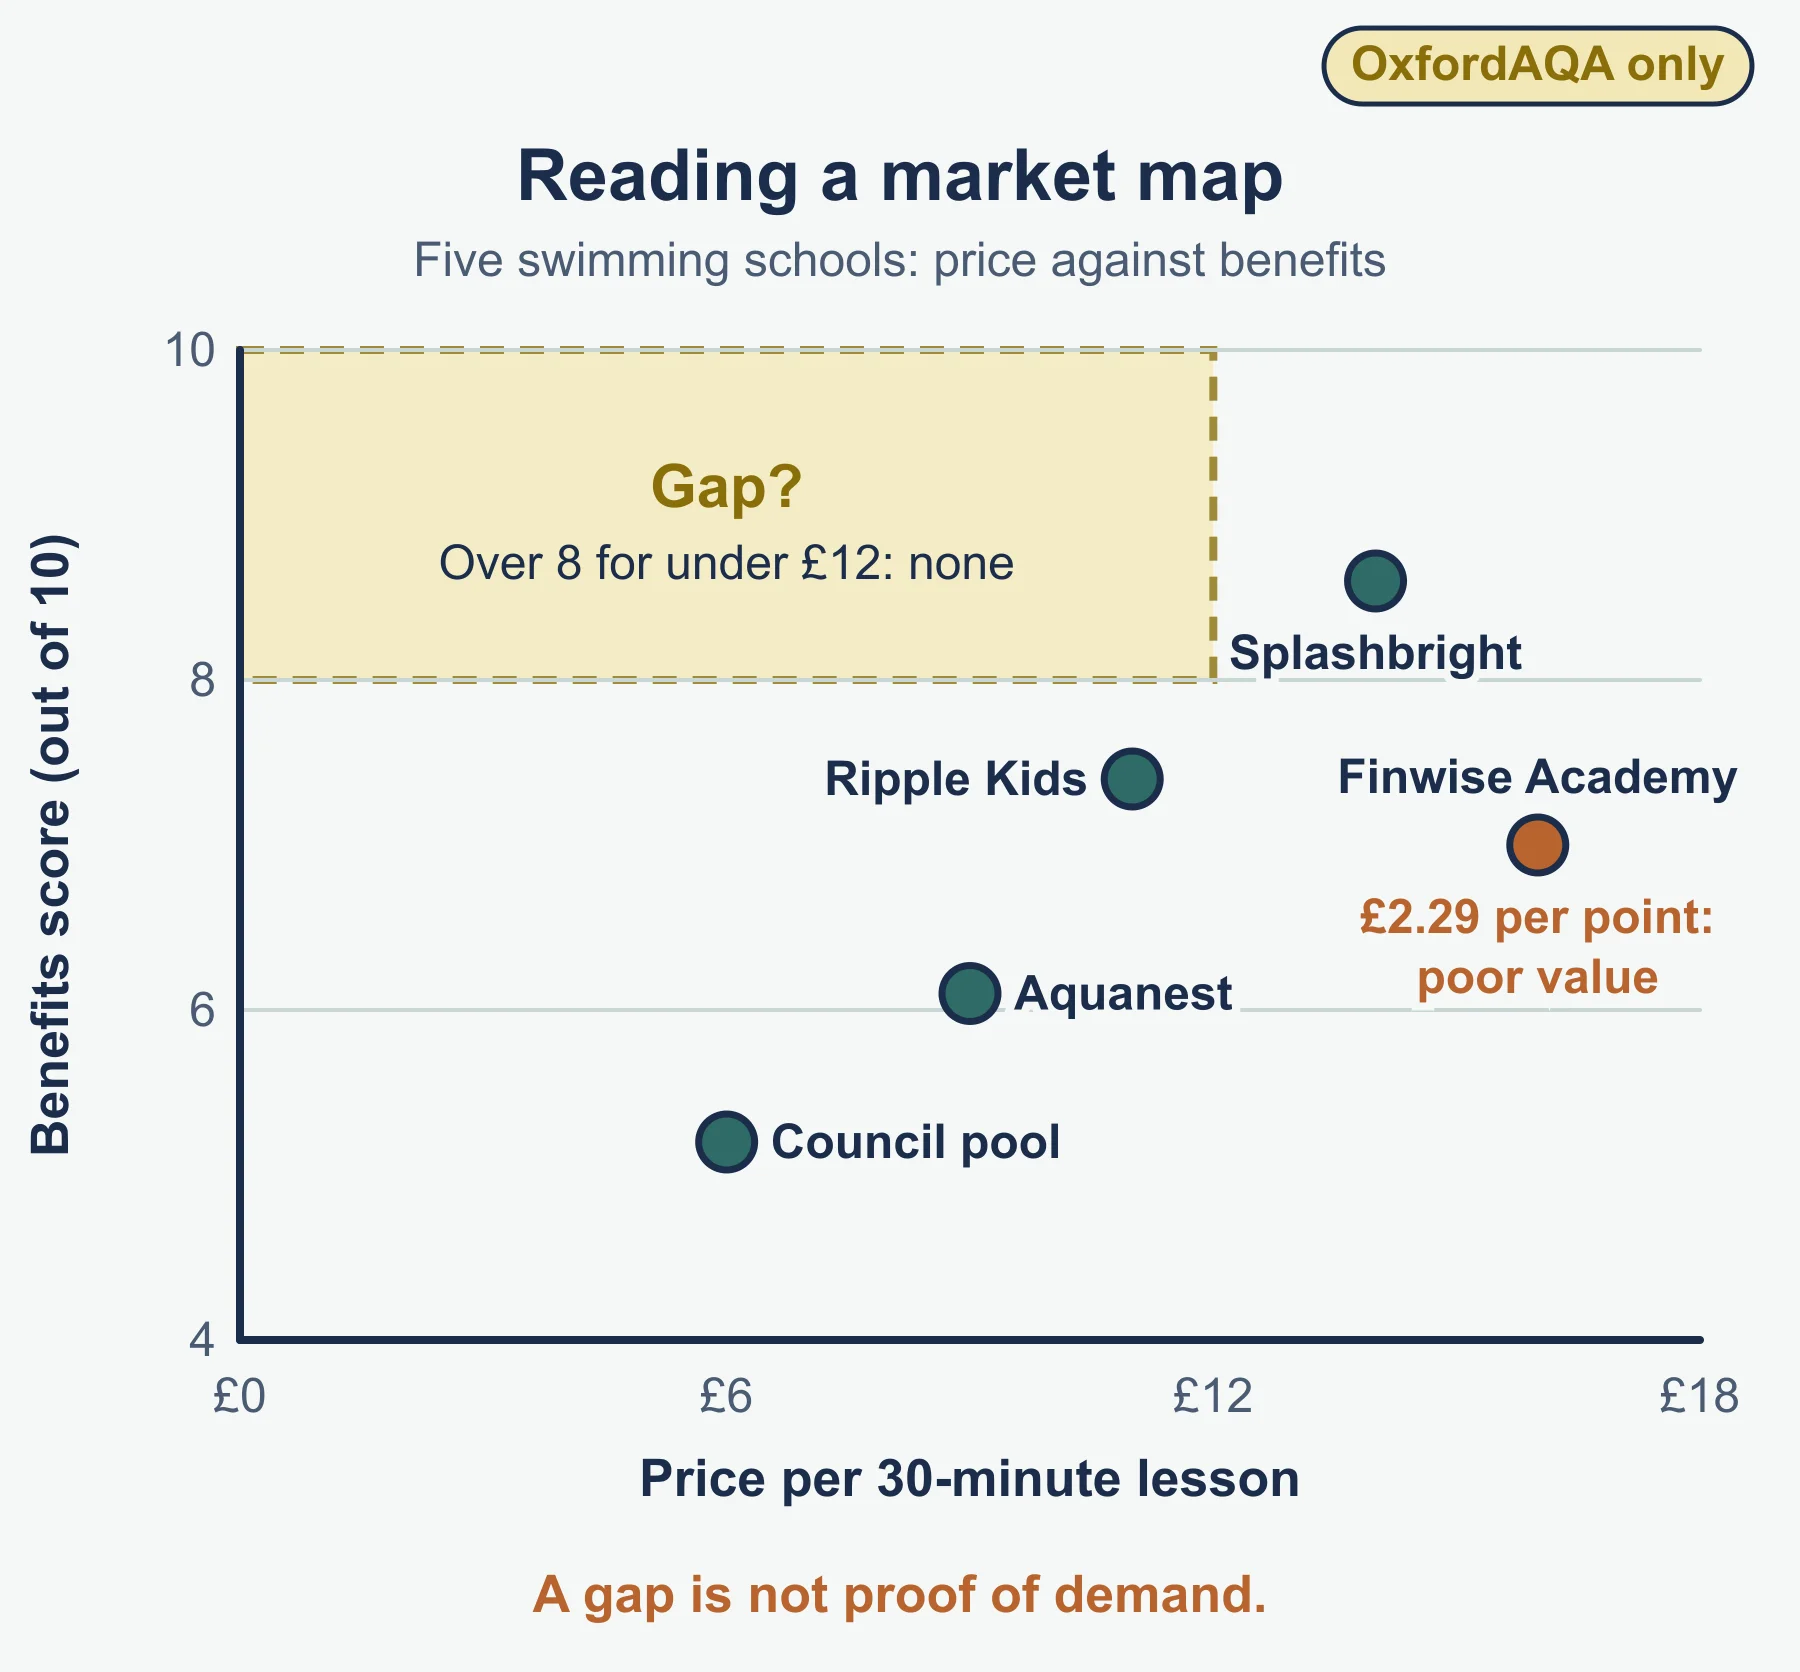
Market mapping plots competitors on two axes (for example price and quality). It shows where rivals cluster and where gaps appear. A gap is not automatically an opportunity, because there may be no demand there.
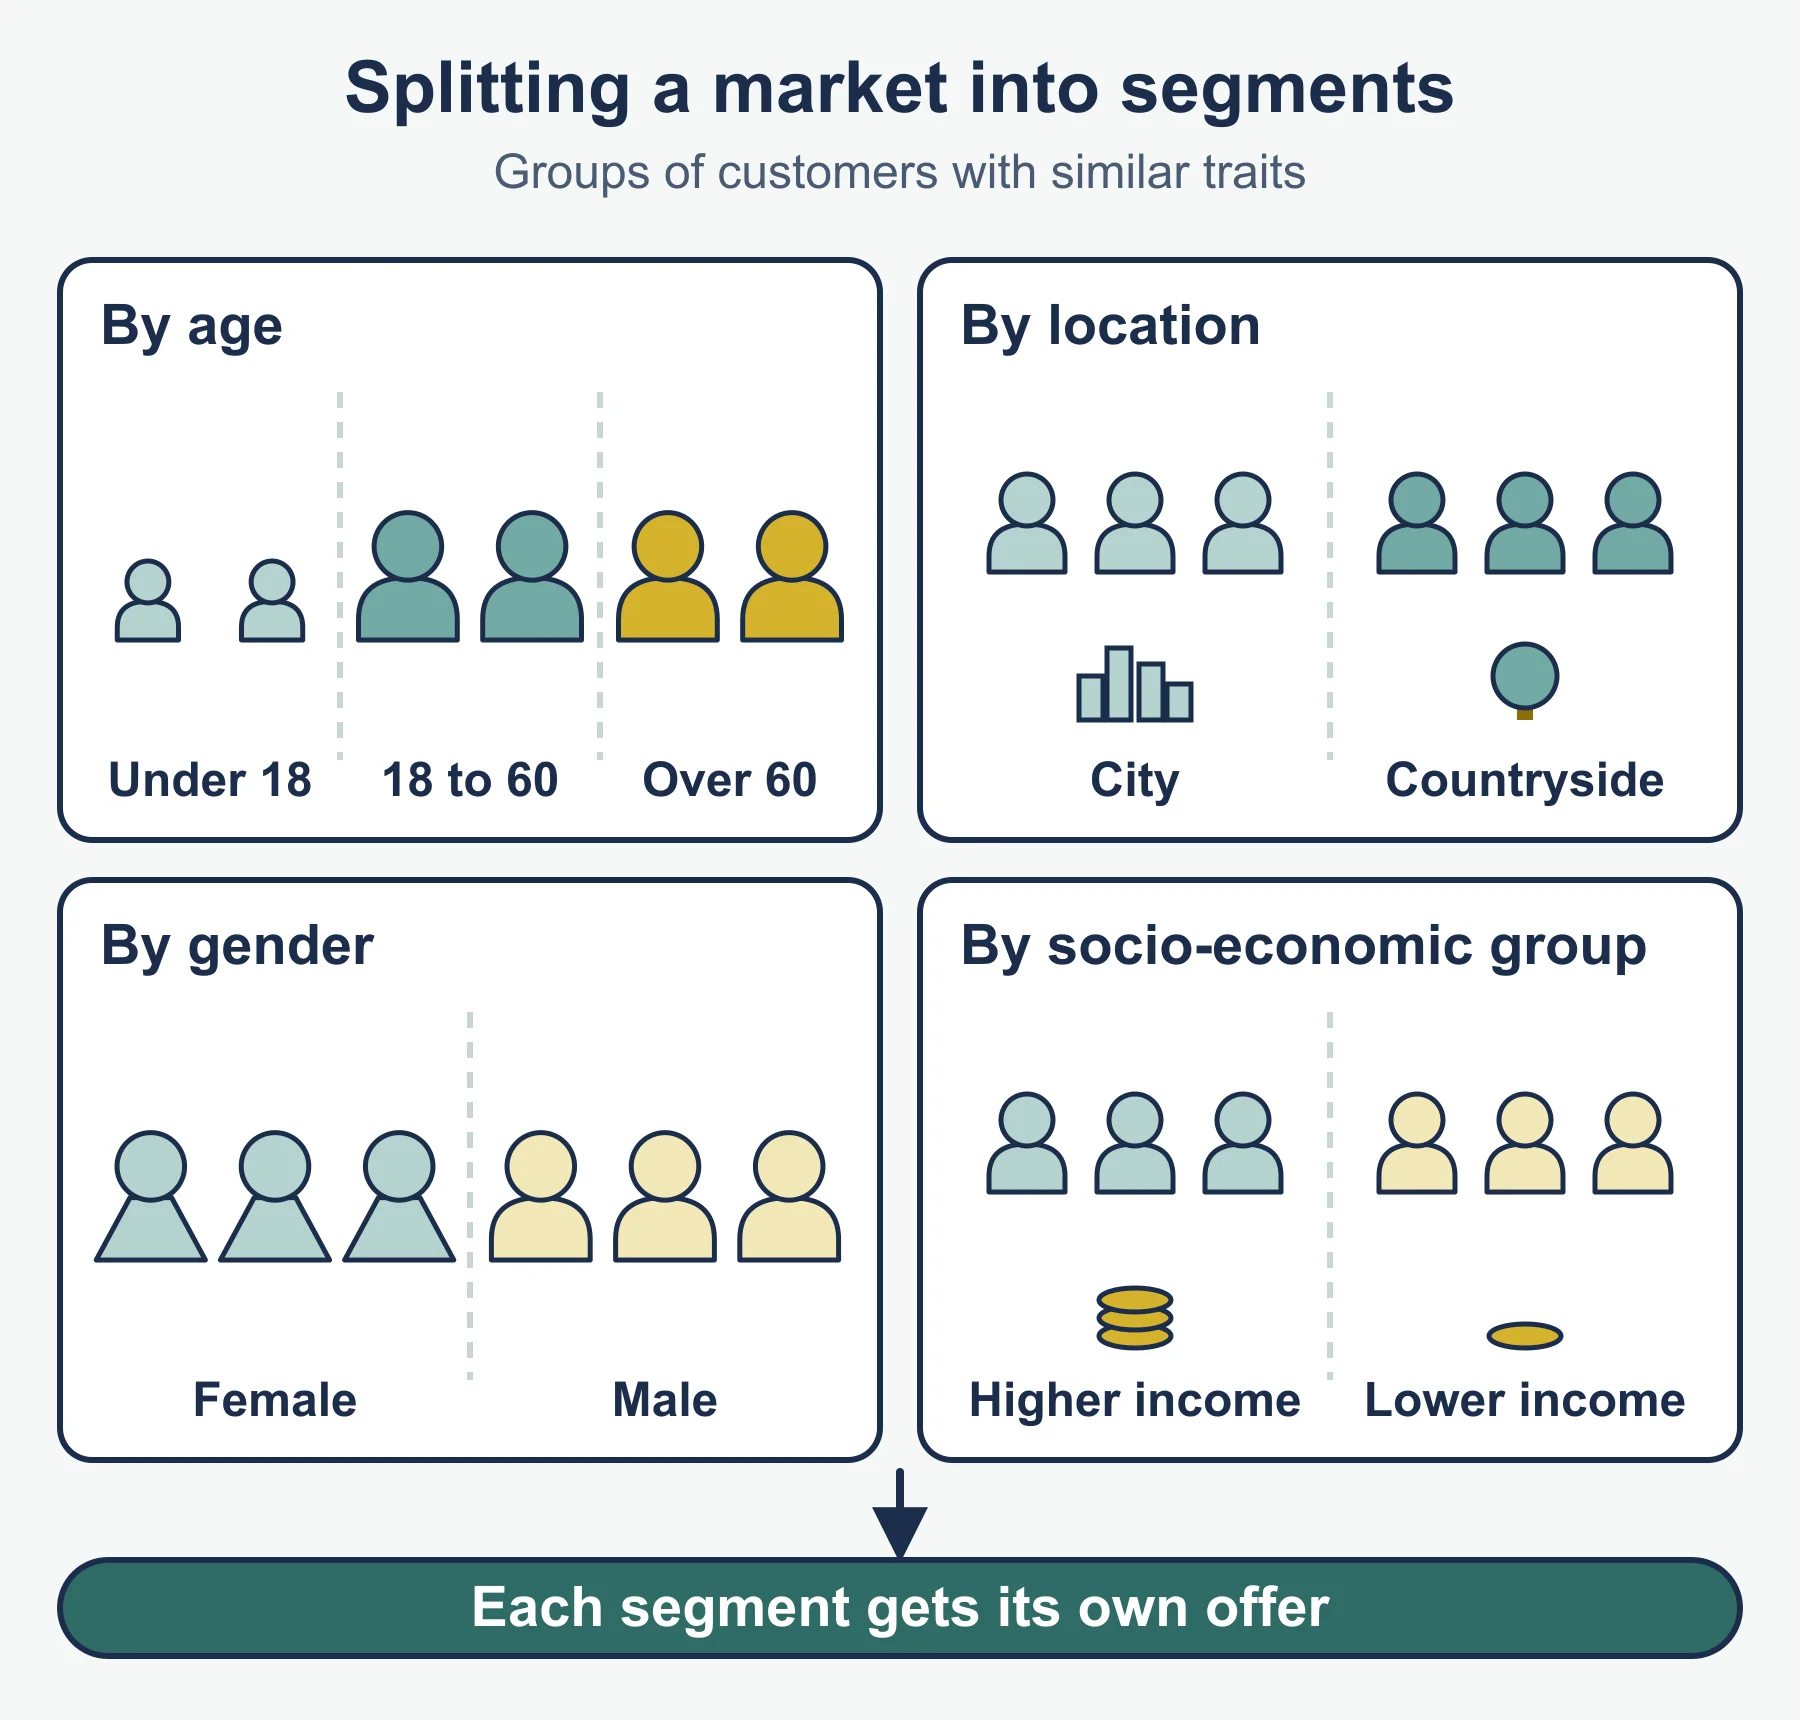
Market segmentation divides a market into groups with similar characteristics or needs, such as age, income, location, lifestyle or behaviour. Segmentation lets the firm target a group precisely, at the cost of extra research and product variants.
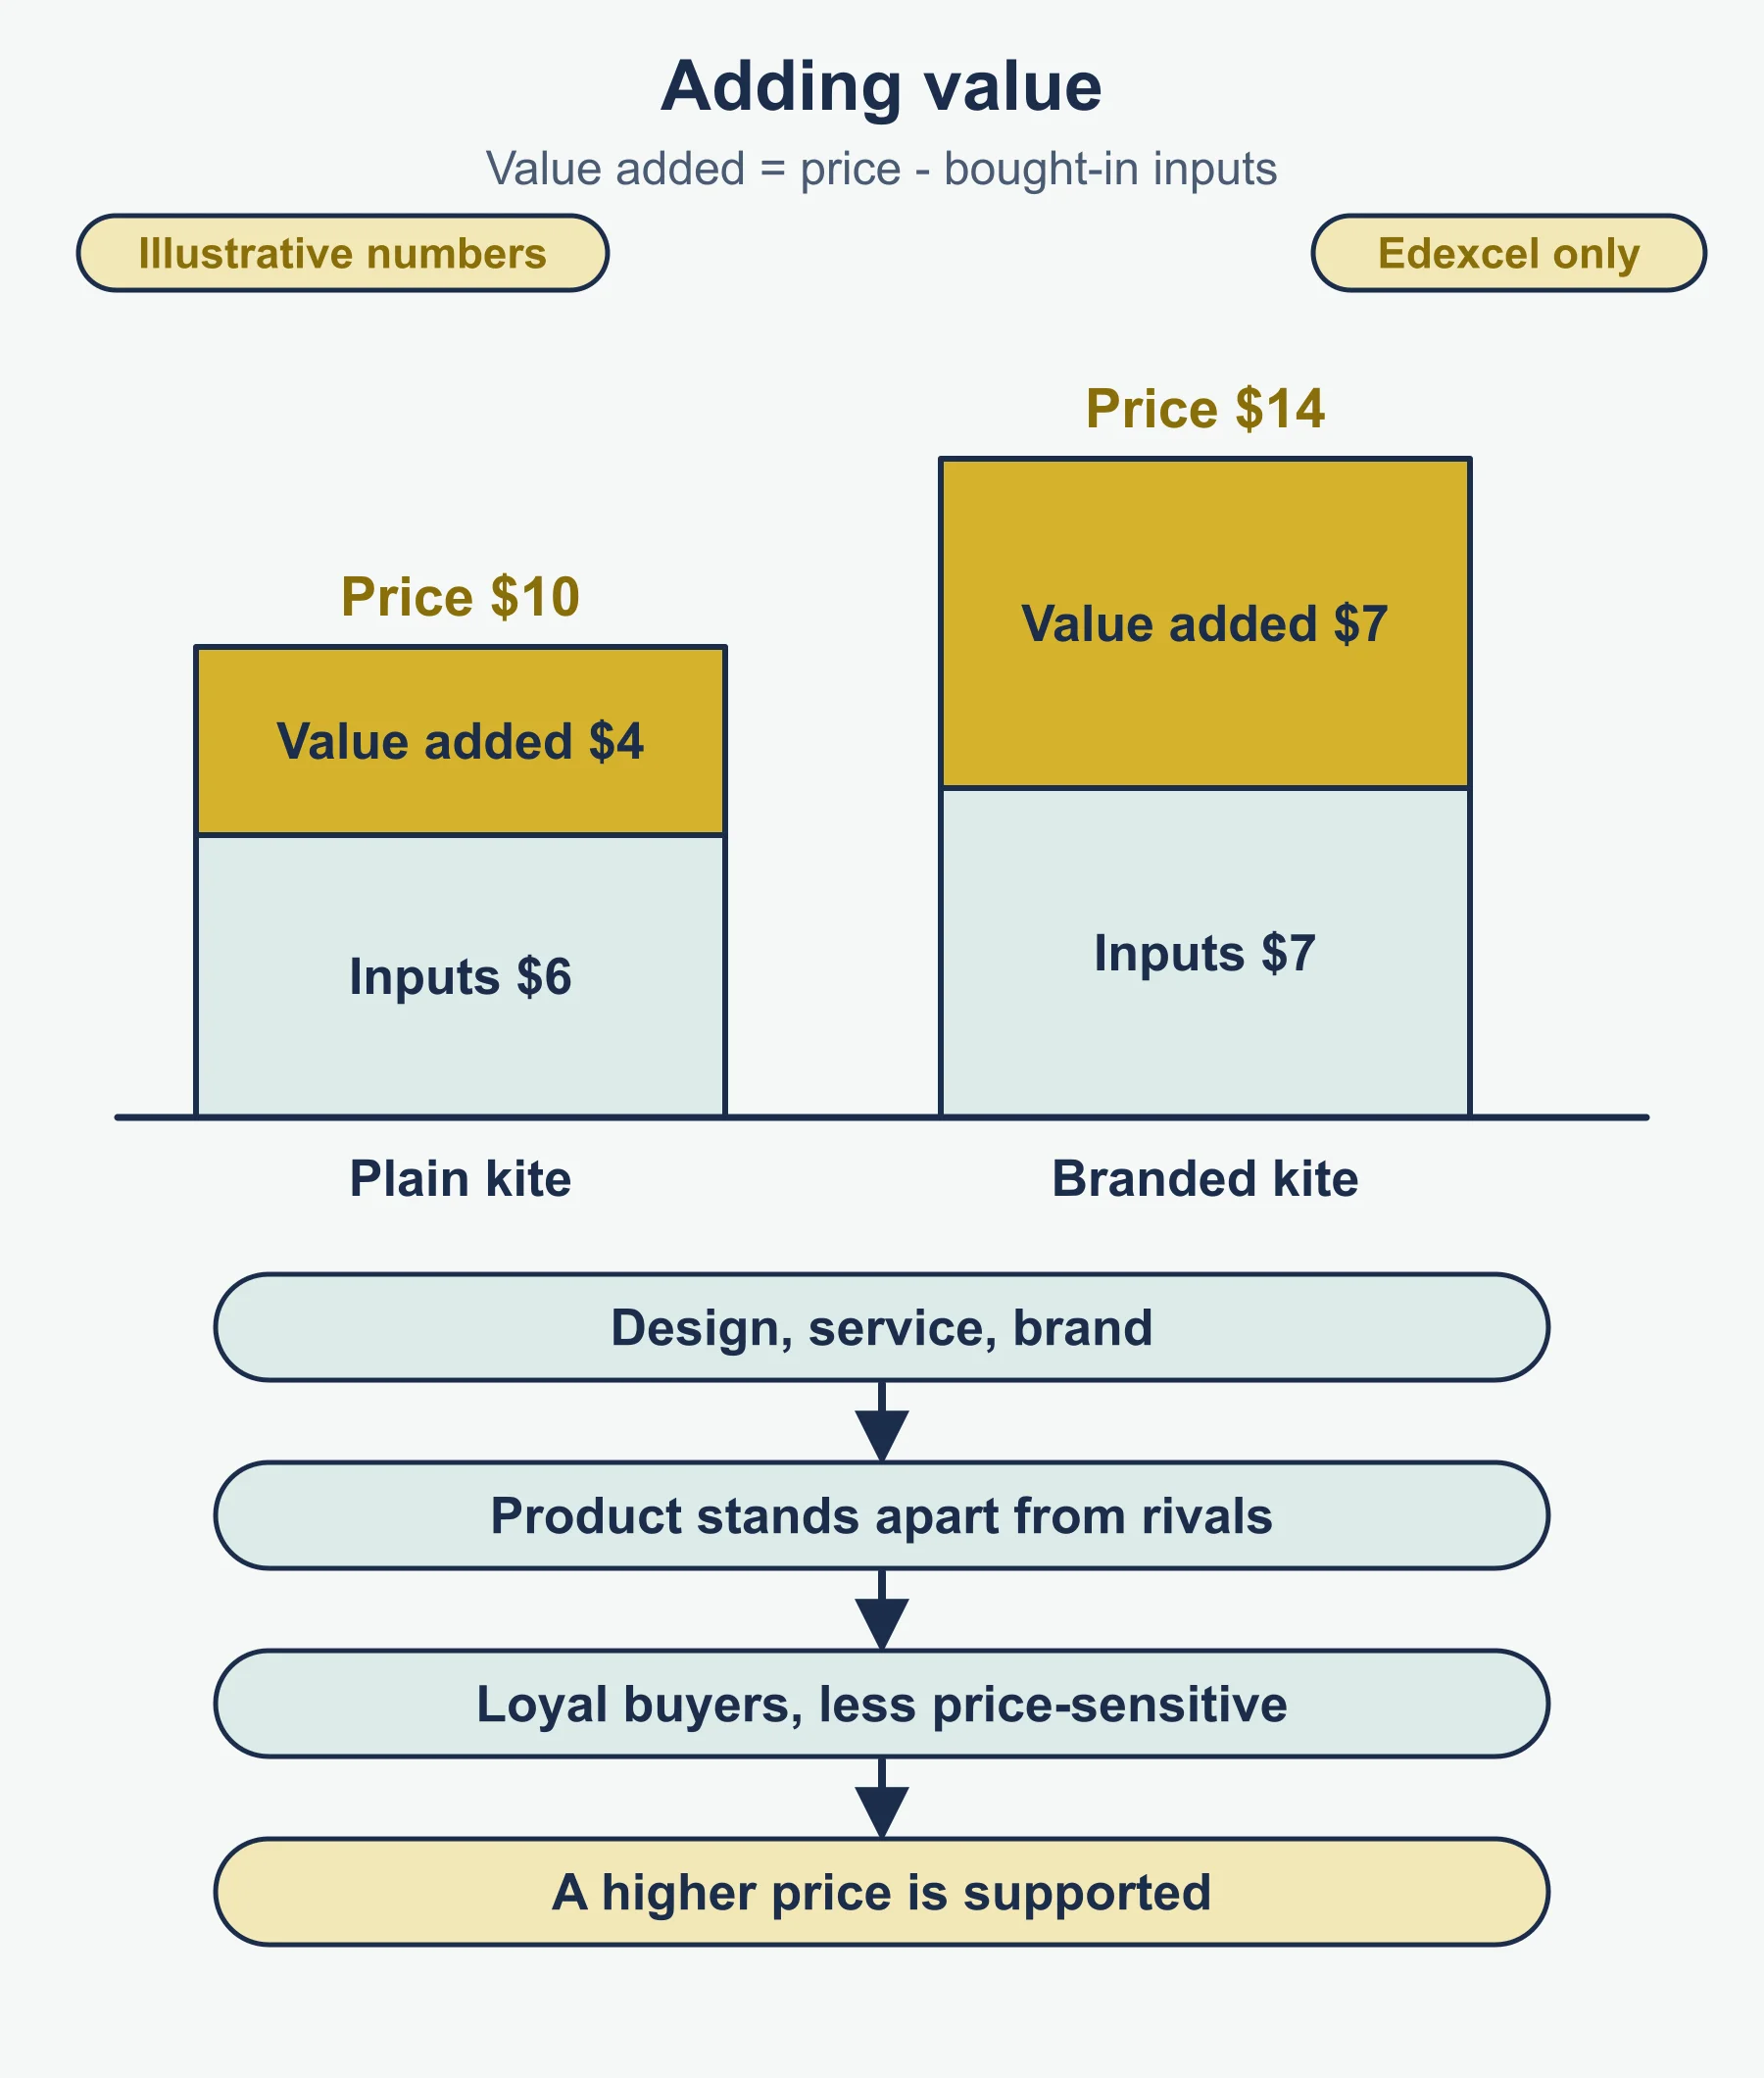
Competitive advantage is something that lets a firm outperform rivals persistently, such as lower costs, a stronger brand, better service or a unique product. Product differentiation makes a product distinct from similar ones. Its purpose is to reduce the pull of rivals’ prices, build loyalty, and support a higher price (a less price-elastic demand). Adding value means increasing the gap between the cost of bought-in inputs and the selling price, through design, service, convenience, branding or finishing.
1.3.2: Demand and supply
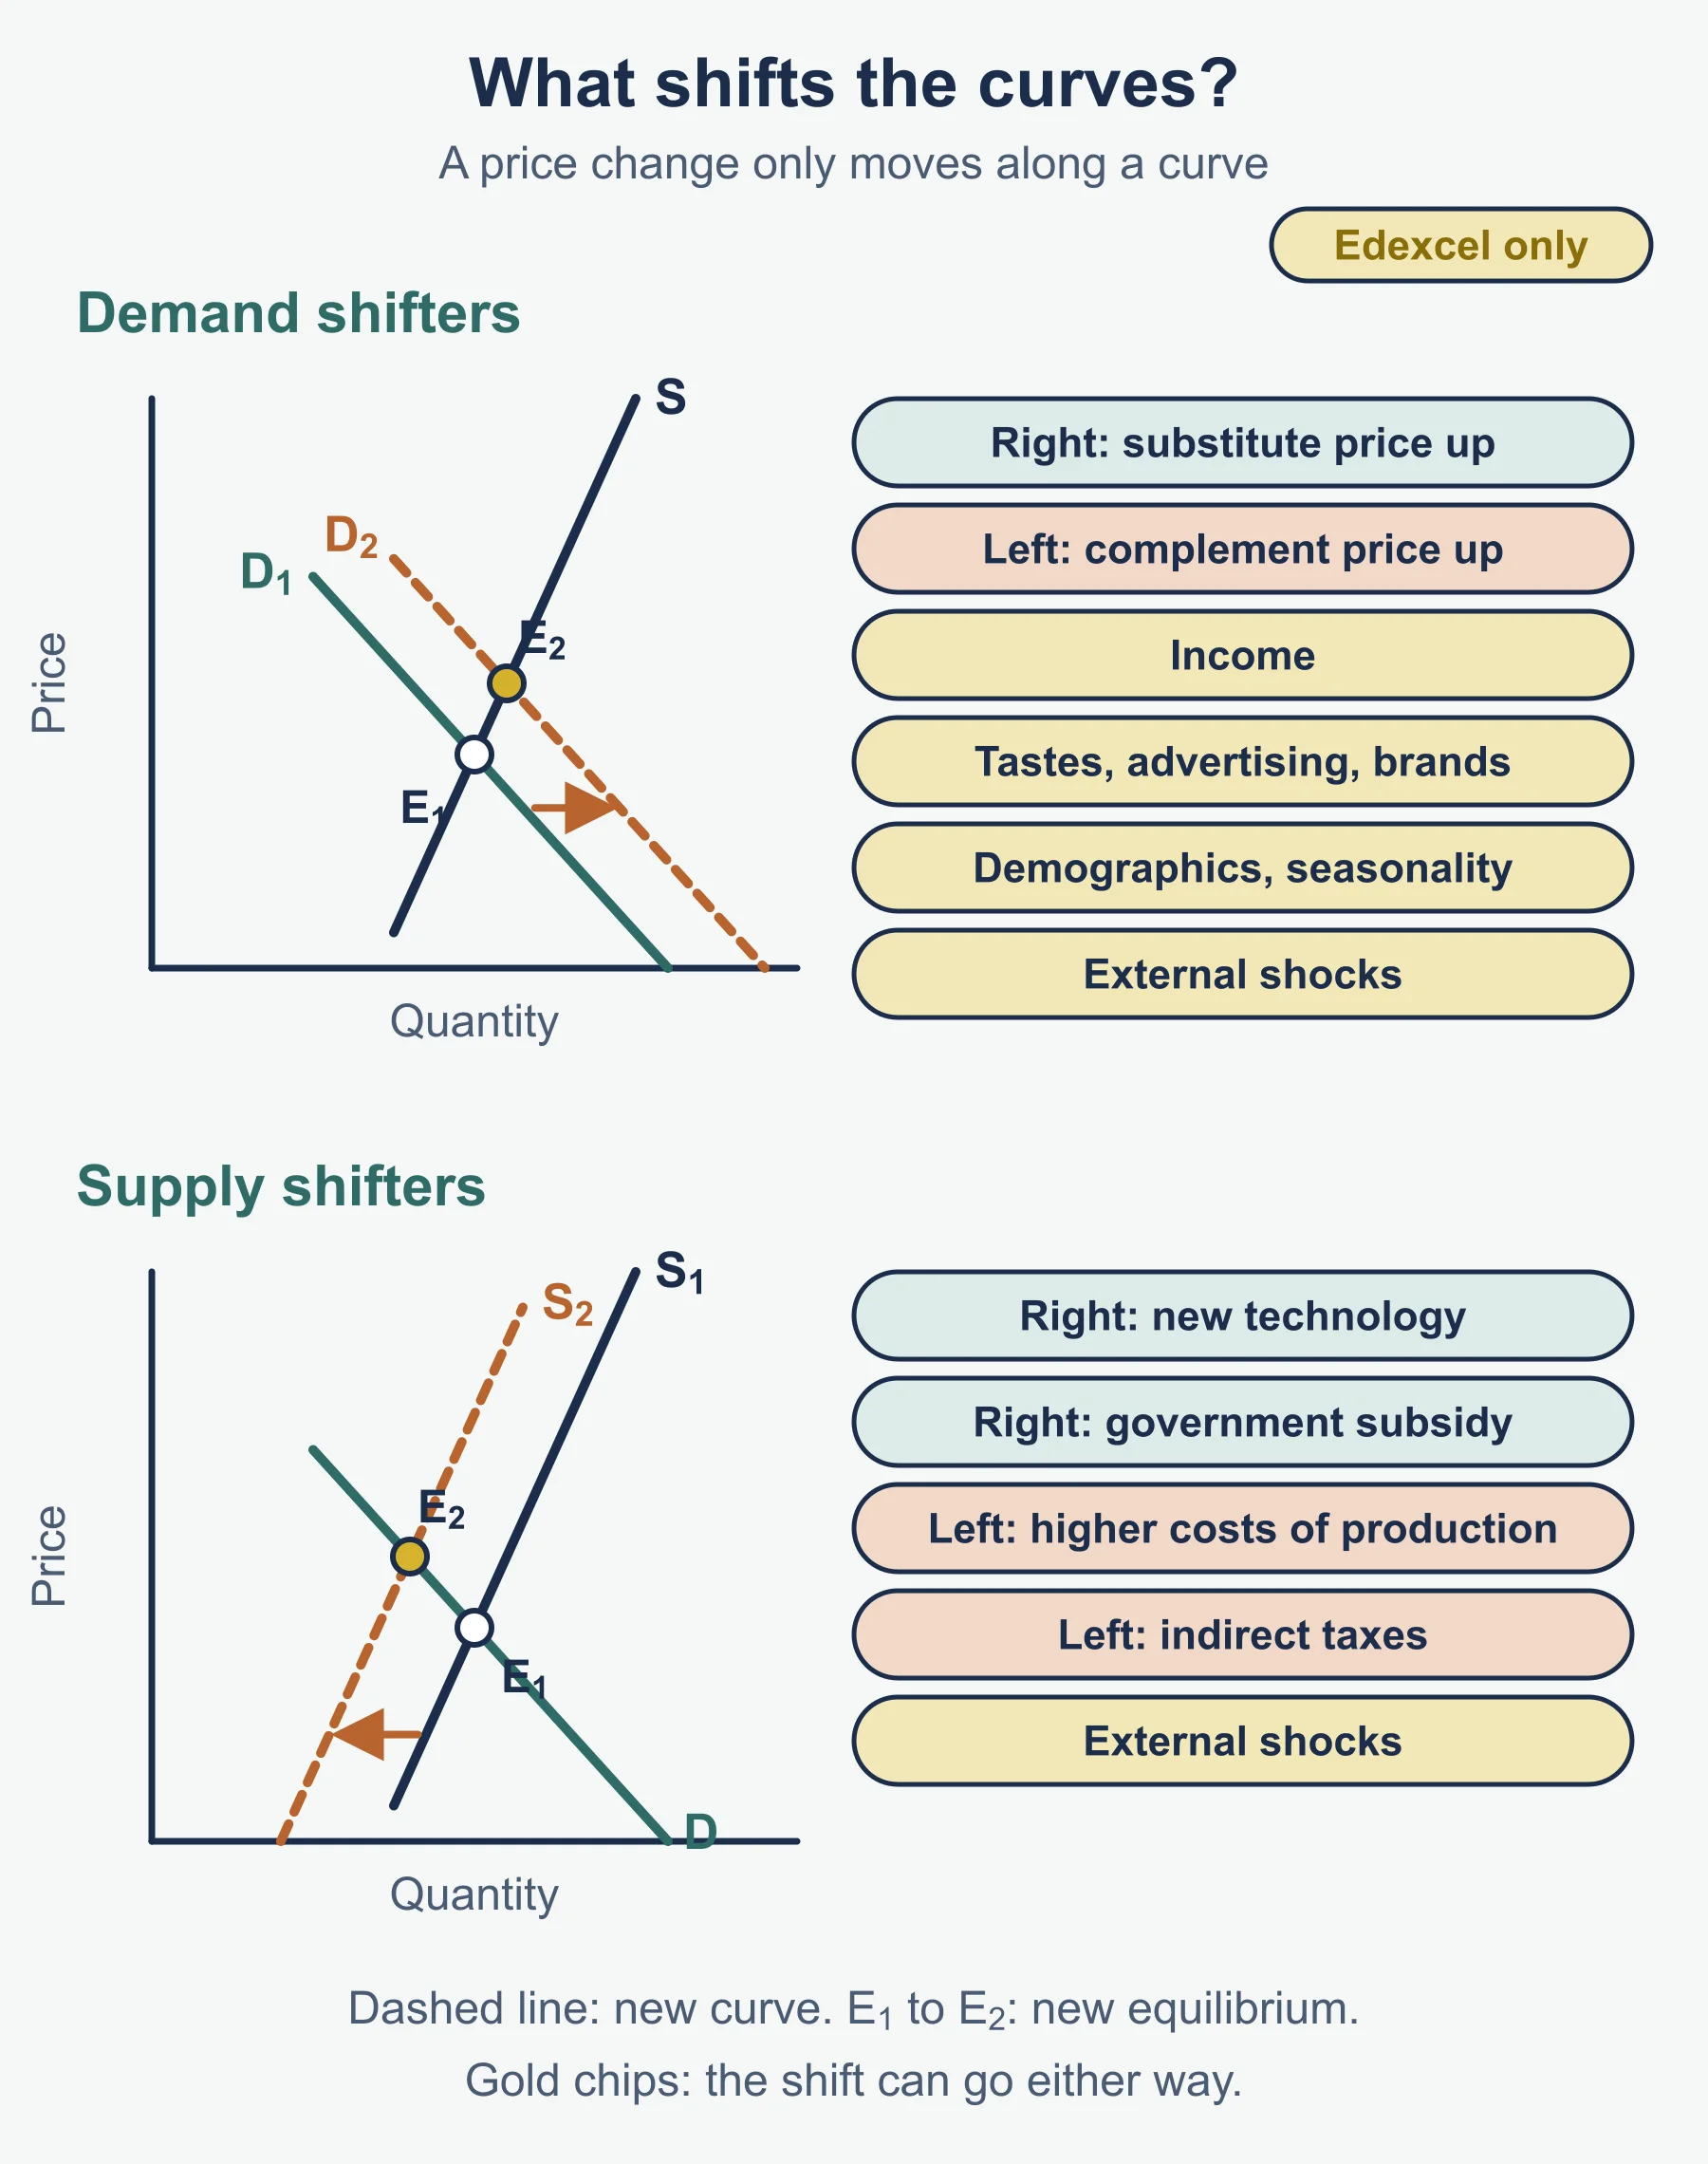
Demand is the quantity customers are willing and able to buy at each price. Price changes cause movement along the curve. The listed factors shift the whole curve:
- prices of substitutes (a rise makes the firm’s product relatively cheaper, so demand rises) and complements (a rise in the price of one lowers demand for the other)
- consumer incomes
- fashions, tastes and preferences
- marketing, advertising and branding
- demographics (such as an ageing population)
- external shocks (such as a health scare or a sudden shortage)
- seasonality
Supply is the quantity firms will offer at each price. The listed shifters are changes in costs of production, new technology, indirect taxes (which raise costs and reduce supply), government subsidies (which lower costs and increase supply) and external shocks.
Interaction. The equilibrium price is where quantity demanded equals quantity supplied. Above it there is a surplus, which pushes price down. Below it there is a shortage, which pushes price up.
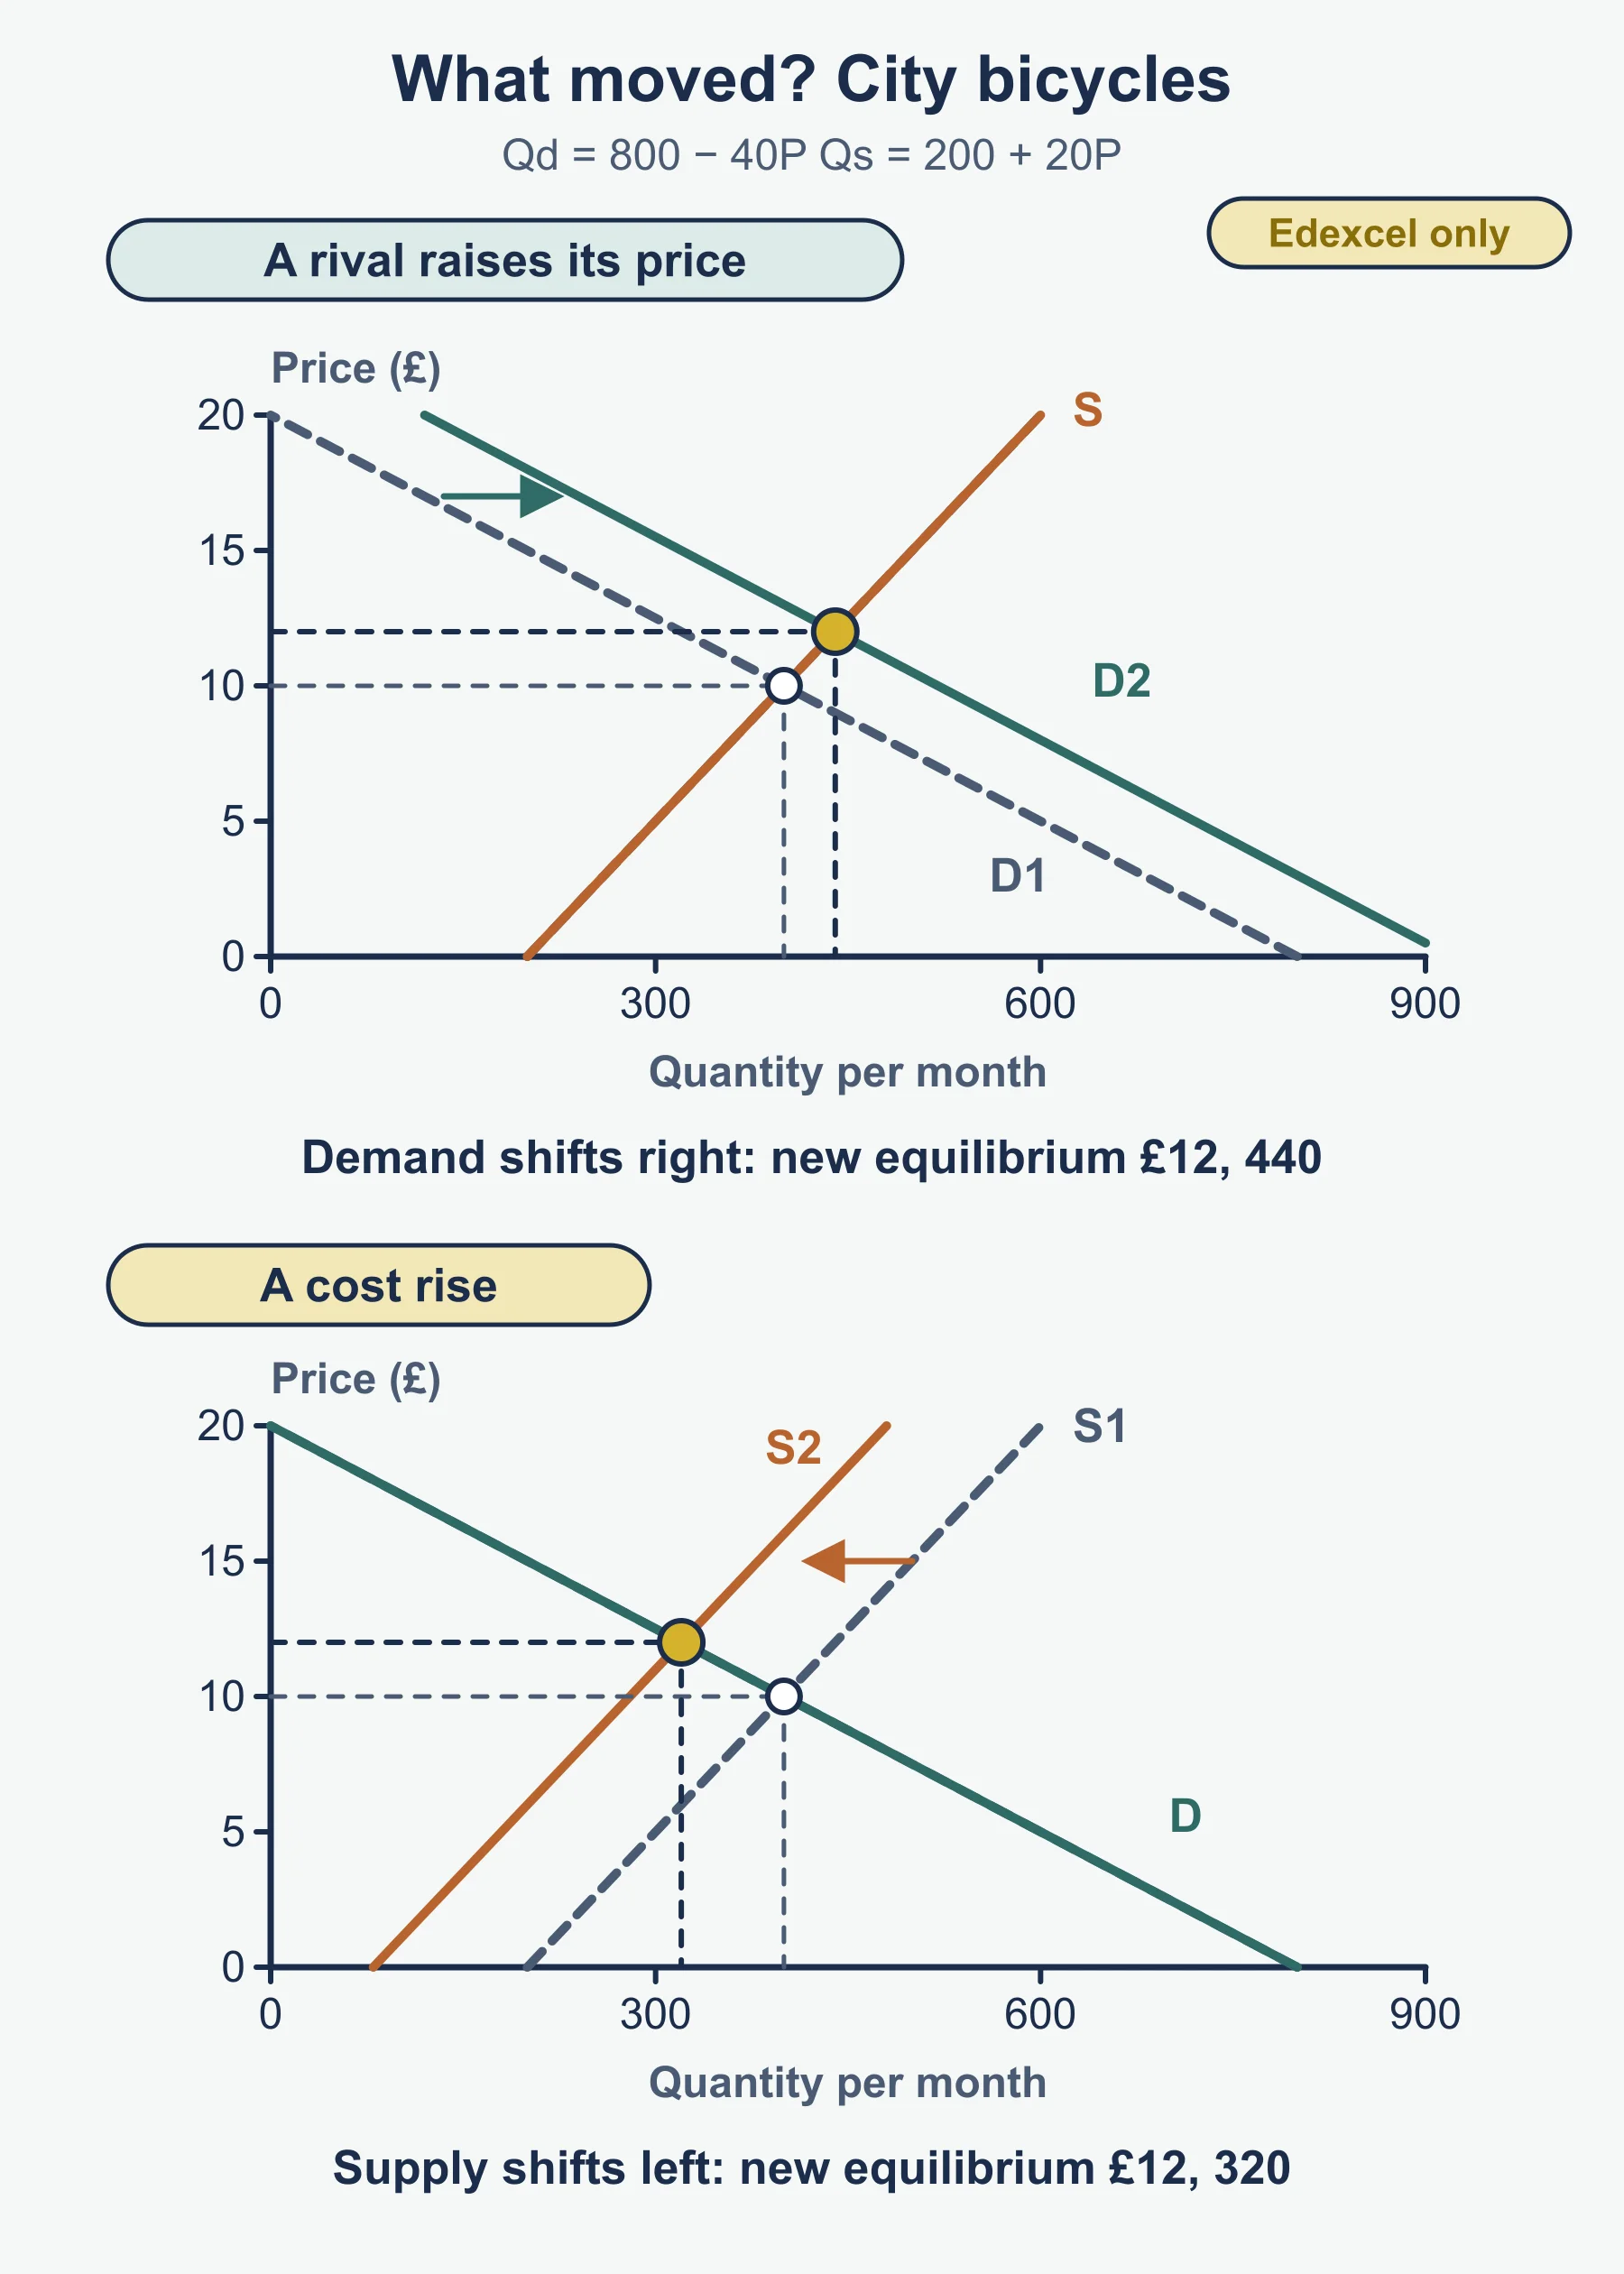
Worked example (invented linear figures). In the market for city bicycles, Qd = 800 - 40P and Qs = 200 + 20P, with P in £. Setting them equal: 600 = 60P, so P = £10 and Q = 400. Draw demand sloping down and supply sloping up, crossing at (400, £10).
- A rival’s price rises, so demand becomes Qd = 920 - 40P. Then 720 = 60P, so P = £12, Q = 440. The demand curve shifts right; price and quantity both rise.
- Instead, a cost rise shifts supply to Qs = 80 + 20P. Then 720 = 60P, so P = £12, Q = 320. The supply curve shifts left; price rises, quantity falls.
When interpreting a diagram, say what moved, which way, the new equilibrium, and what that means for the business.
1.3.2: Price elasticity of demand (PED)
PED = % change in quantity demanded / % change in pricePED is normally negative, because price and quantity move in opposite directions. Interpret the size, ignoring the sign.
| Value (ignoring sign) | Meaning |
|---|---|
| Greater than 1 | Elastic: quantity changes proportionally more than price |
| Less than 1 | Inelastic: quantity changes proportionally less than price |
| Equal to 1 | Unitary |
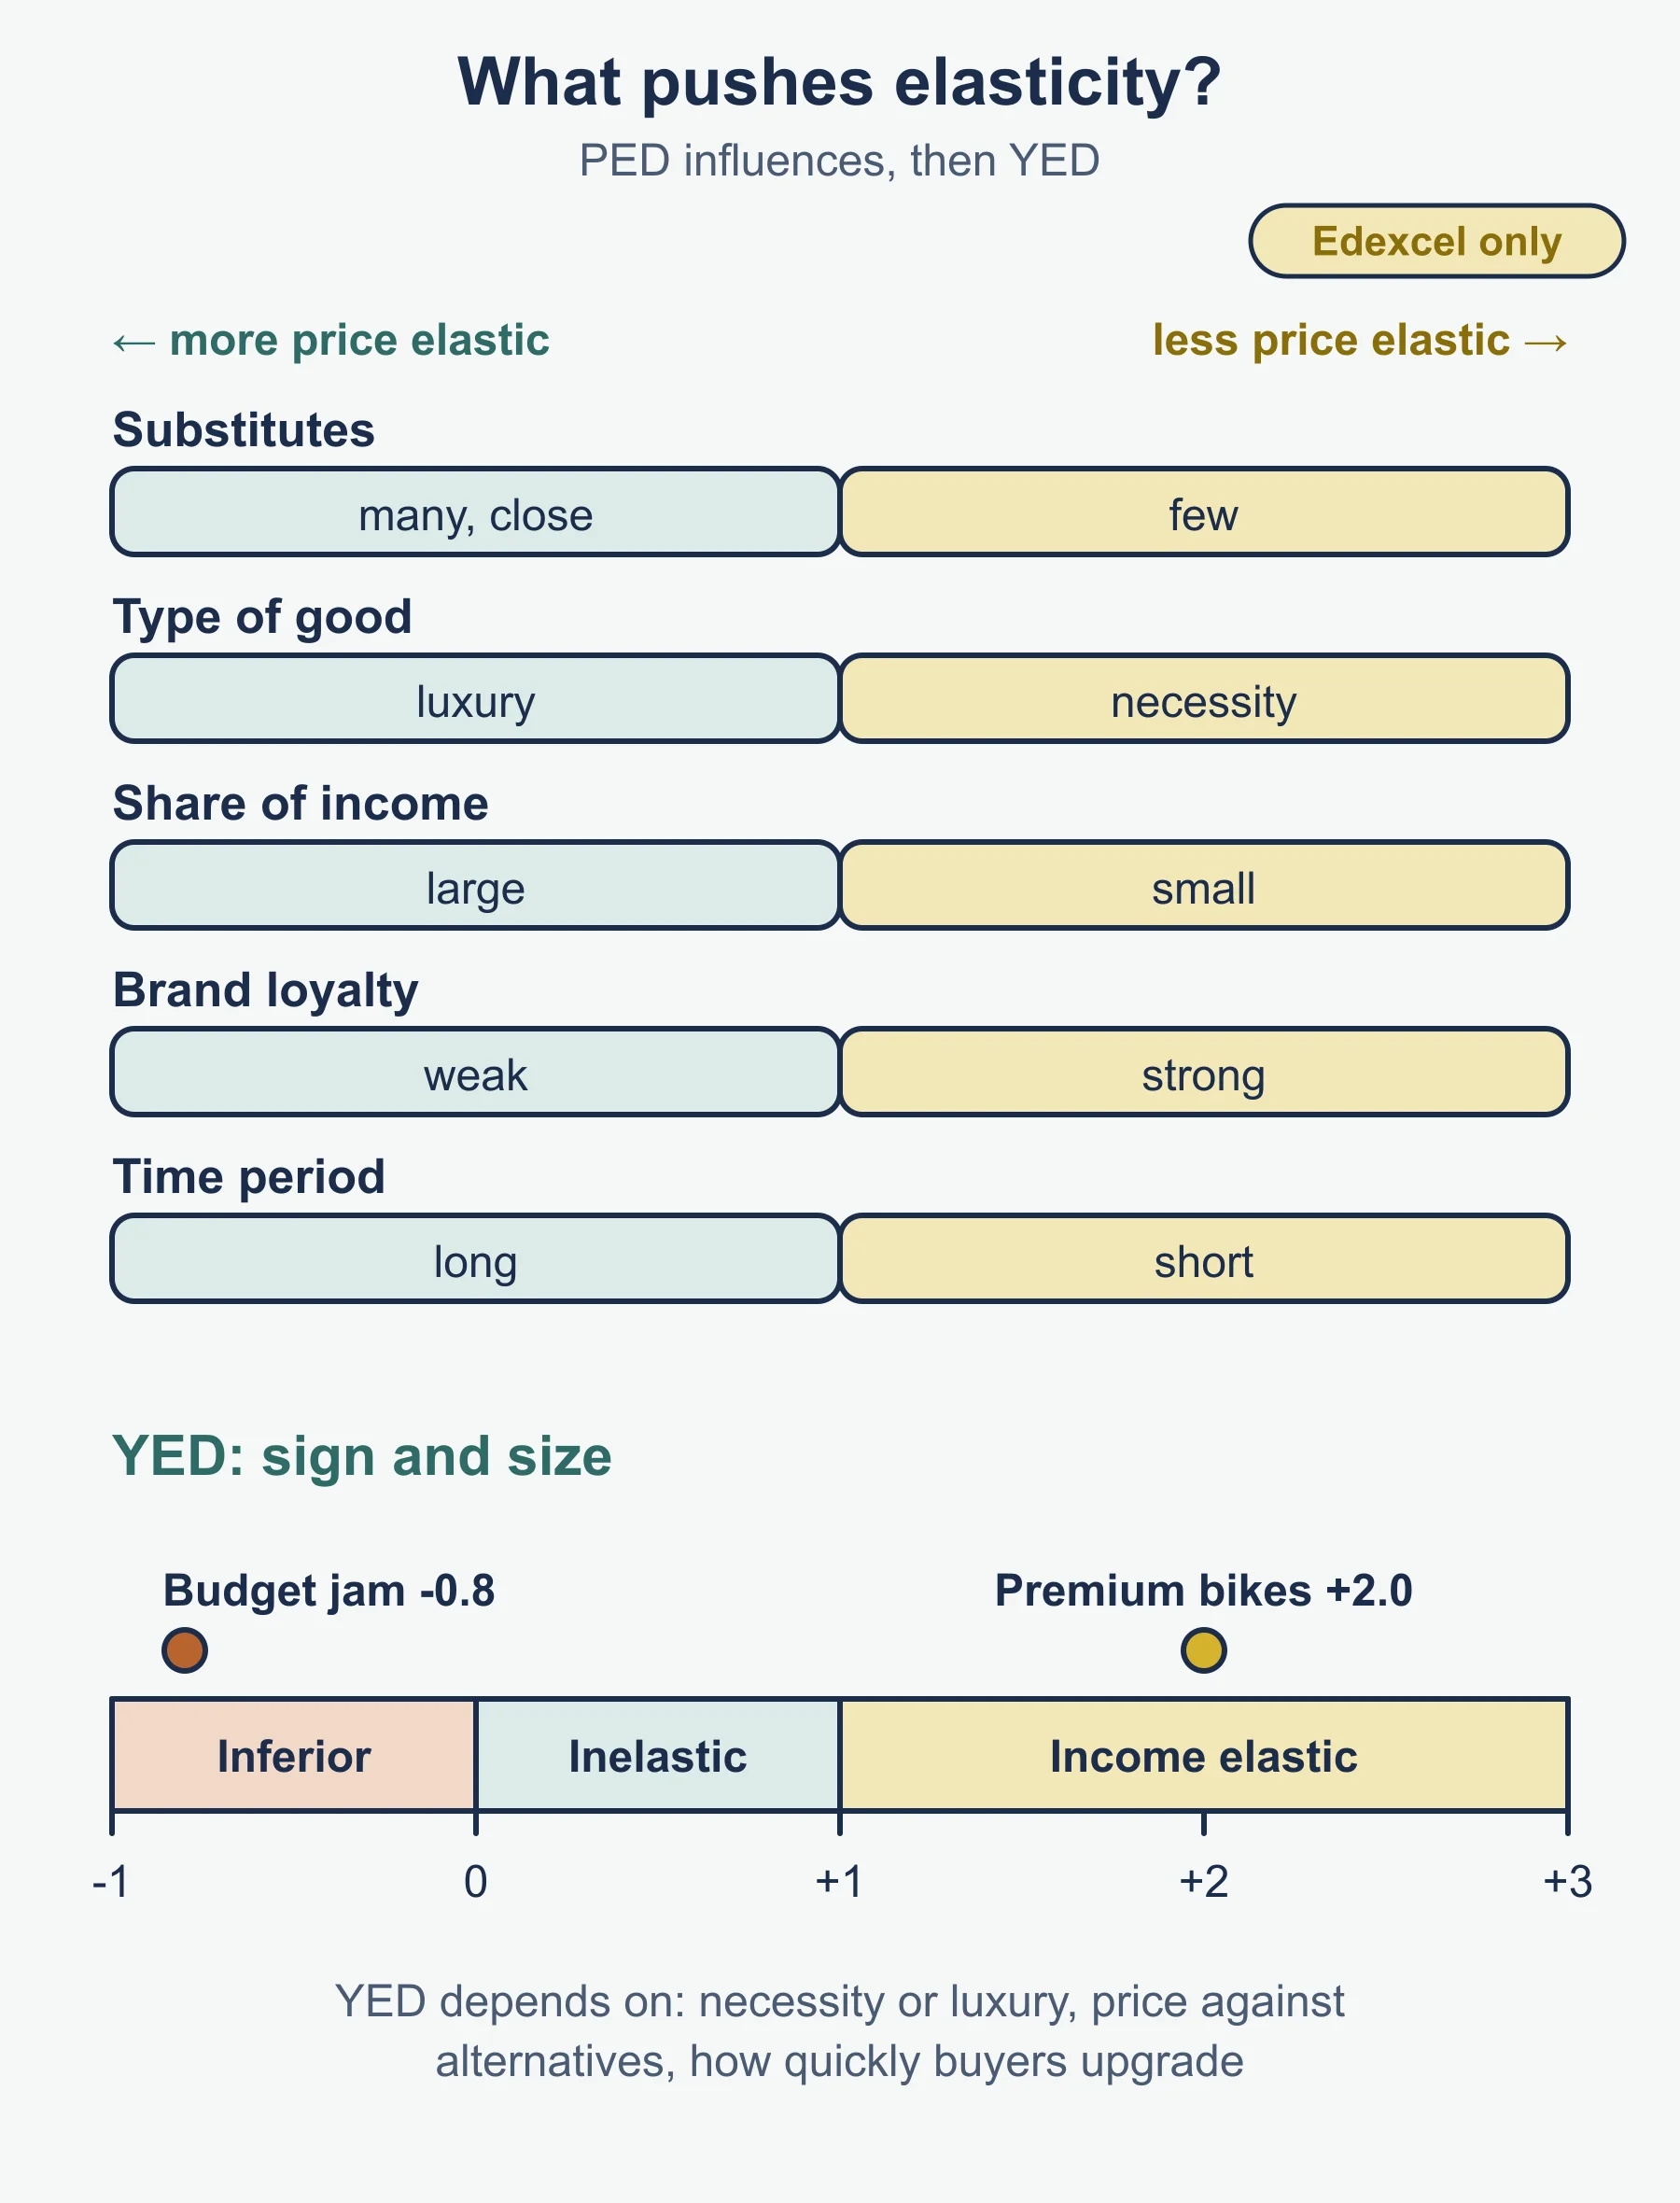
Influences on PED: availability and closeness of substitutes; whether the good is a necessity or a luxury; the share of income spent on it; brand loyalty and differentiation; the time period (demand usually becomes more elastic over time).
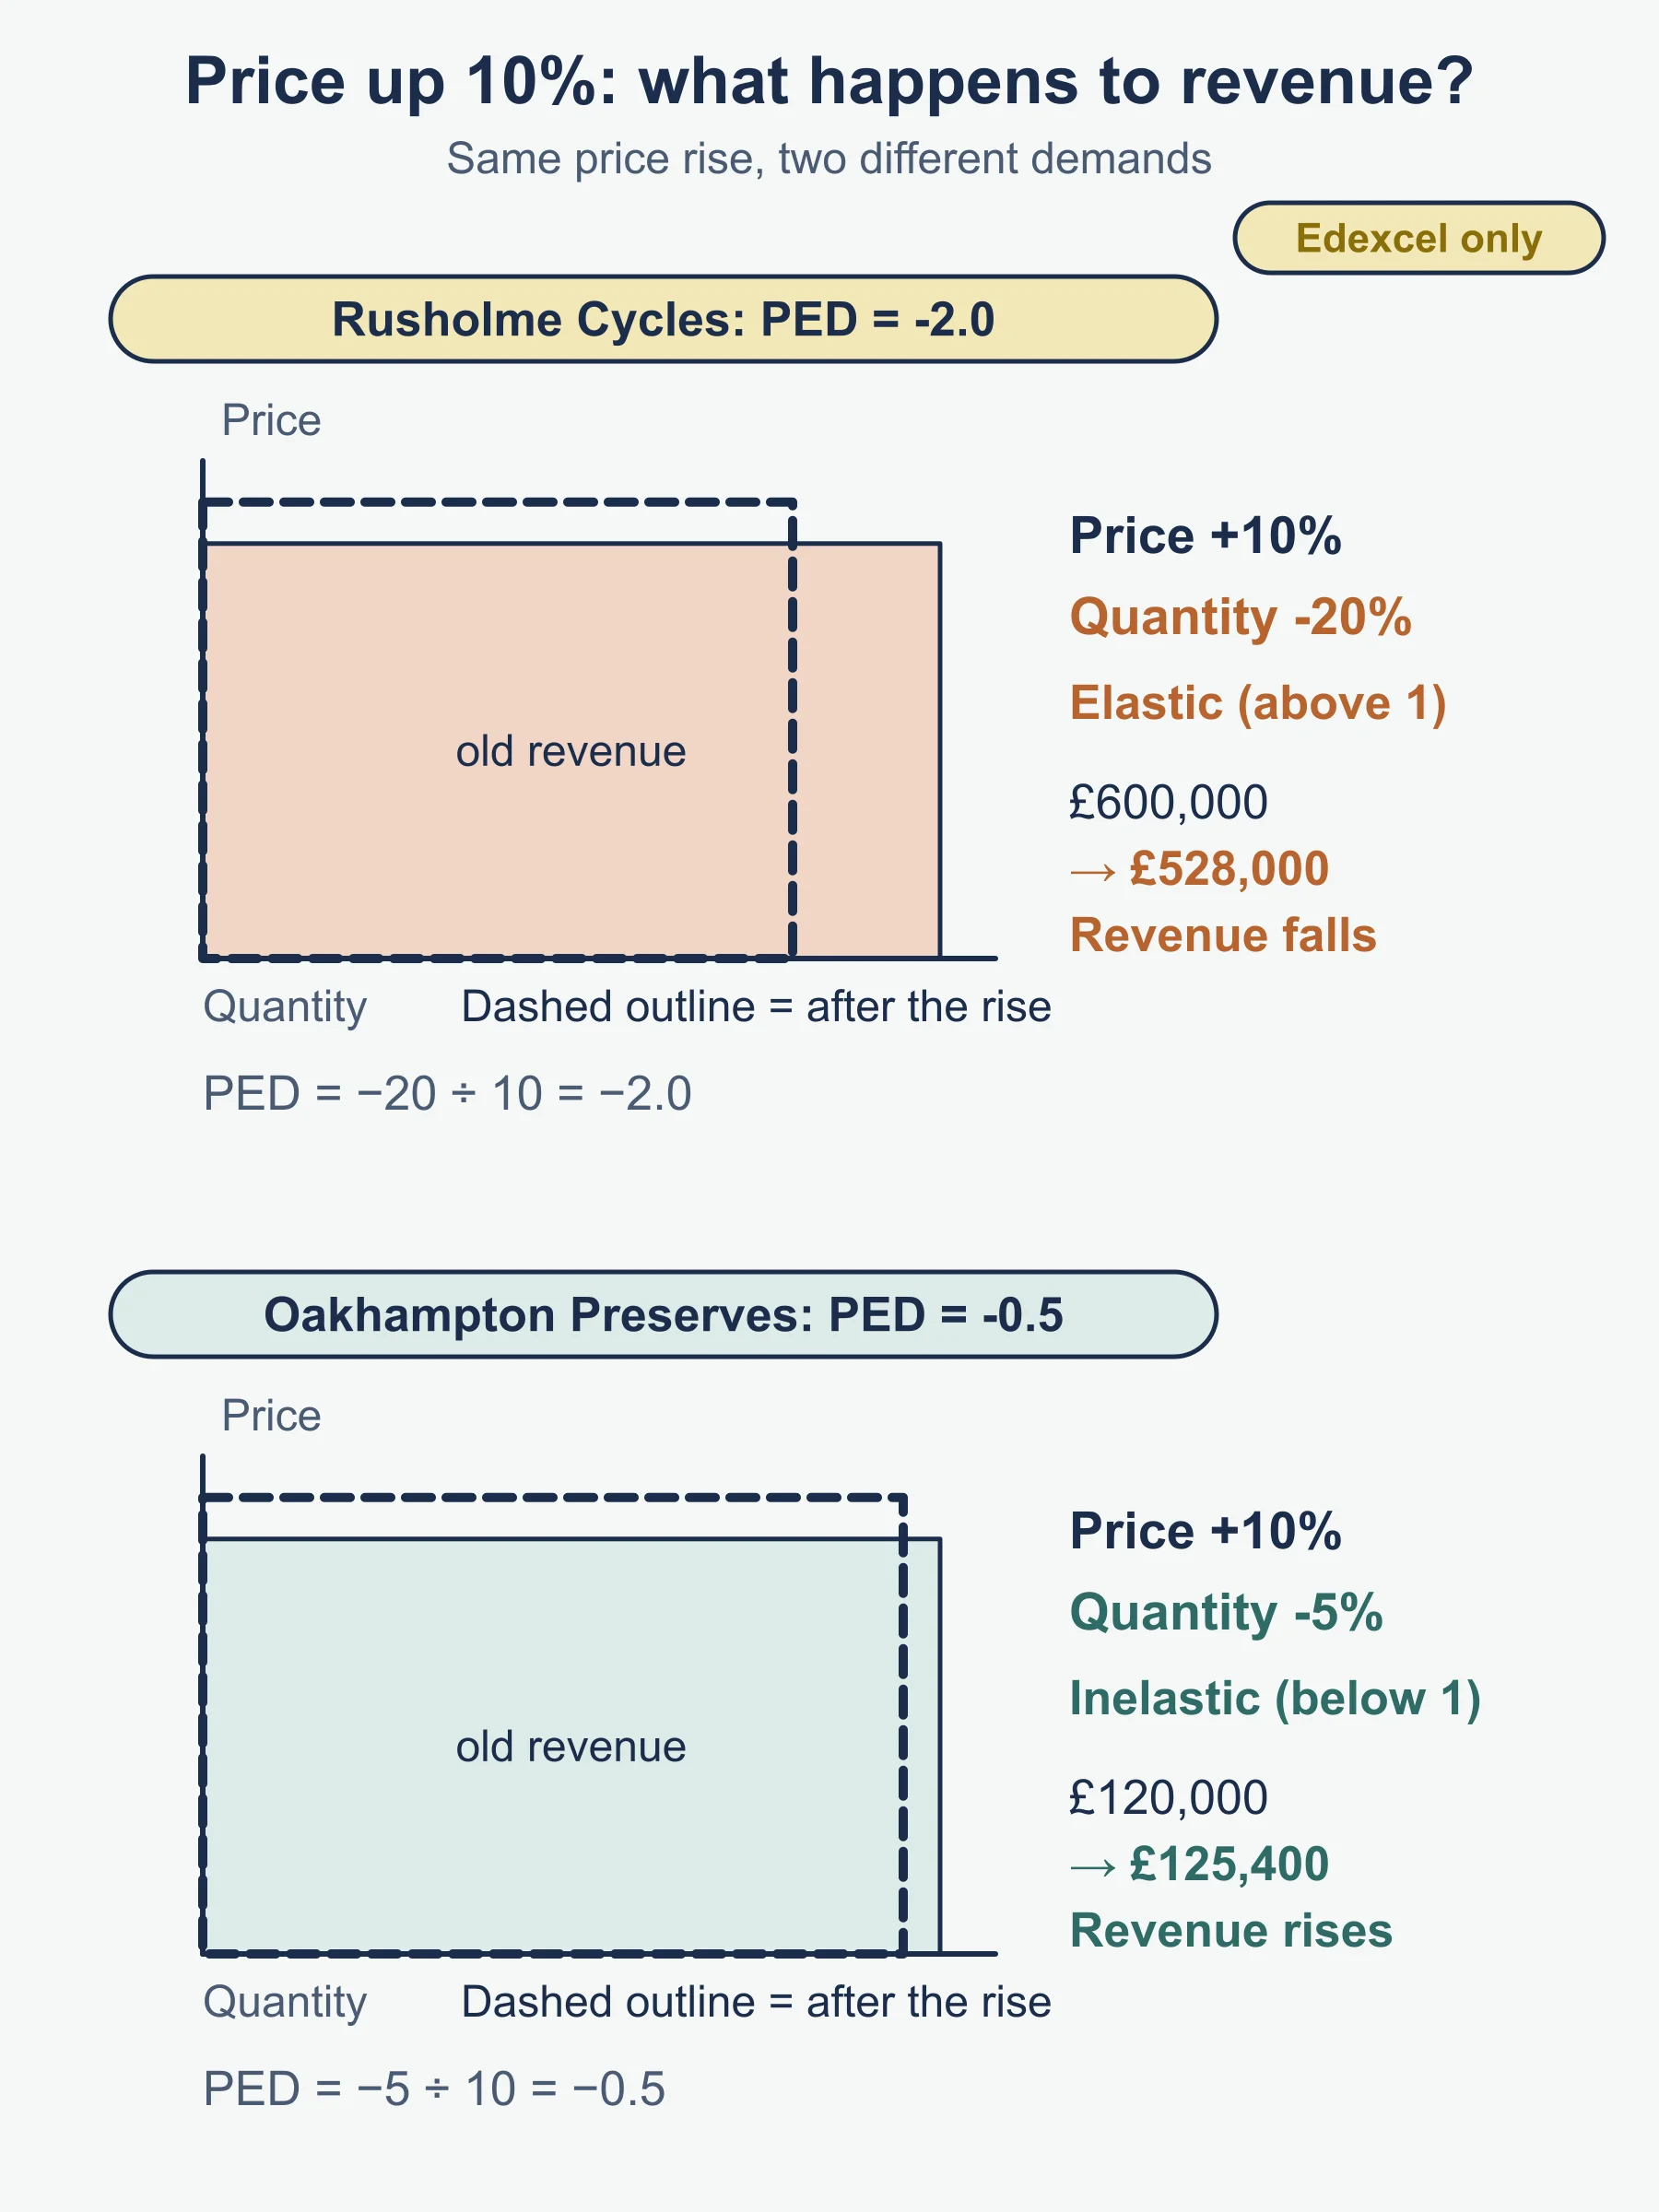
Worked example (elastic). Rusholme Cycles raises a model from £400 to £440 (+10%) and sales fall from 1,500 to 1,200 (-20%). PED = -20 / 10 = -2.0, elastic. Revenue falls from 400 x 1,500 = £600,000 to 440 x 1,200 = £528,000.
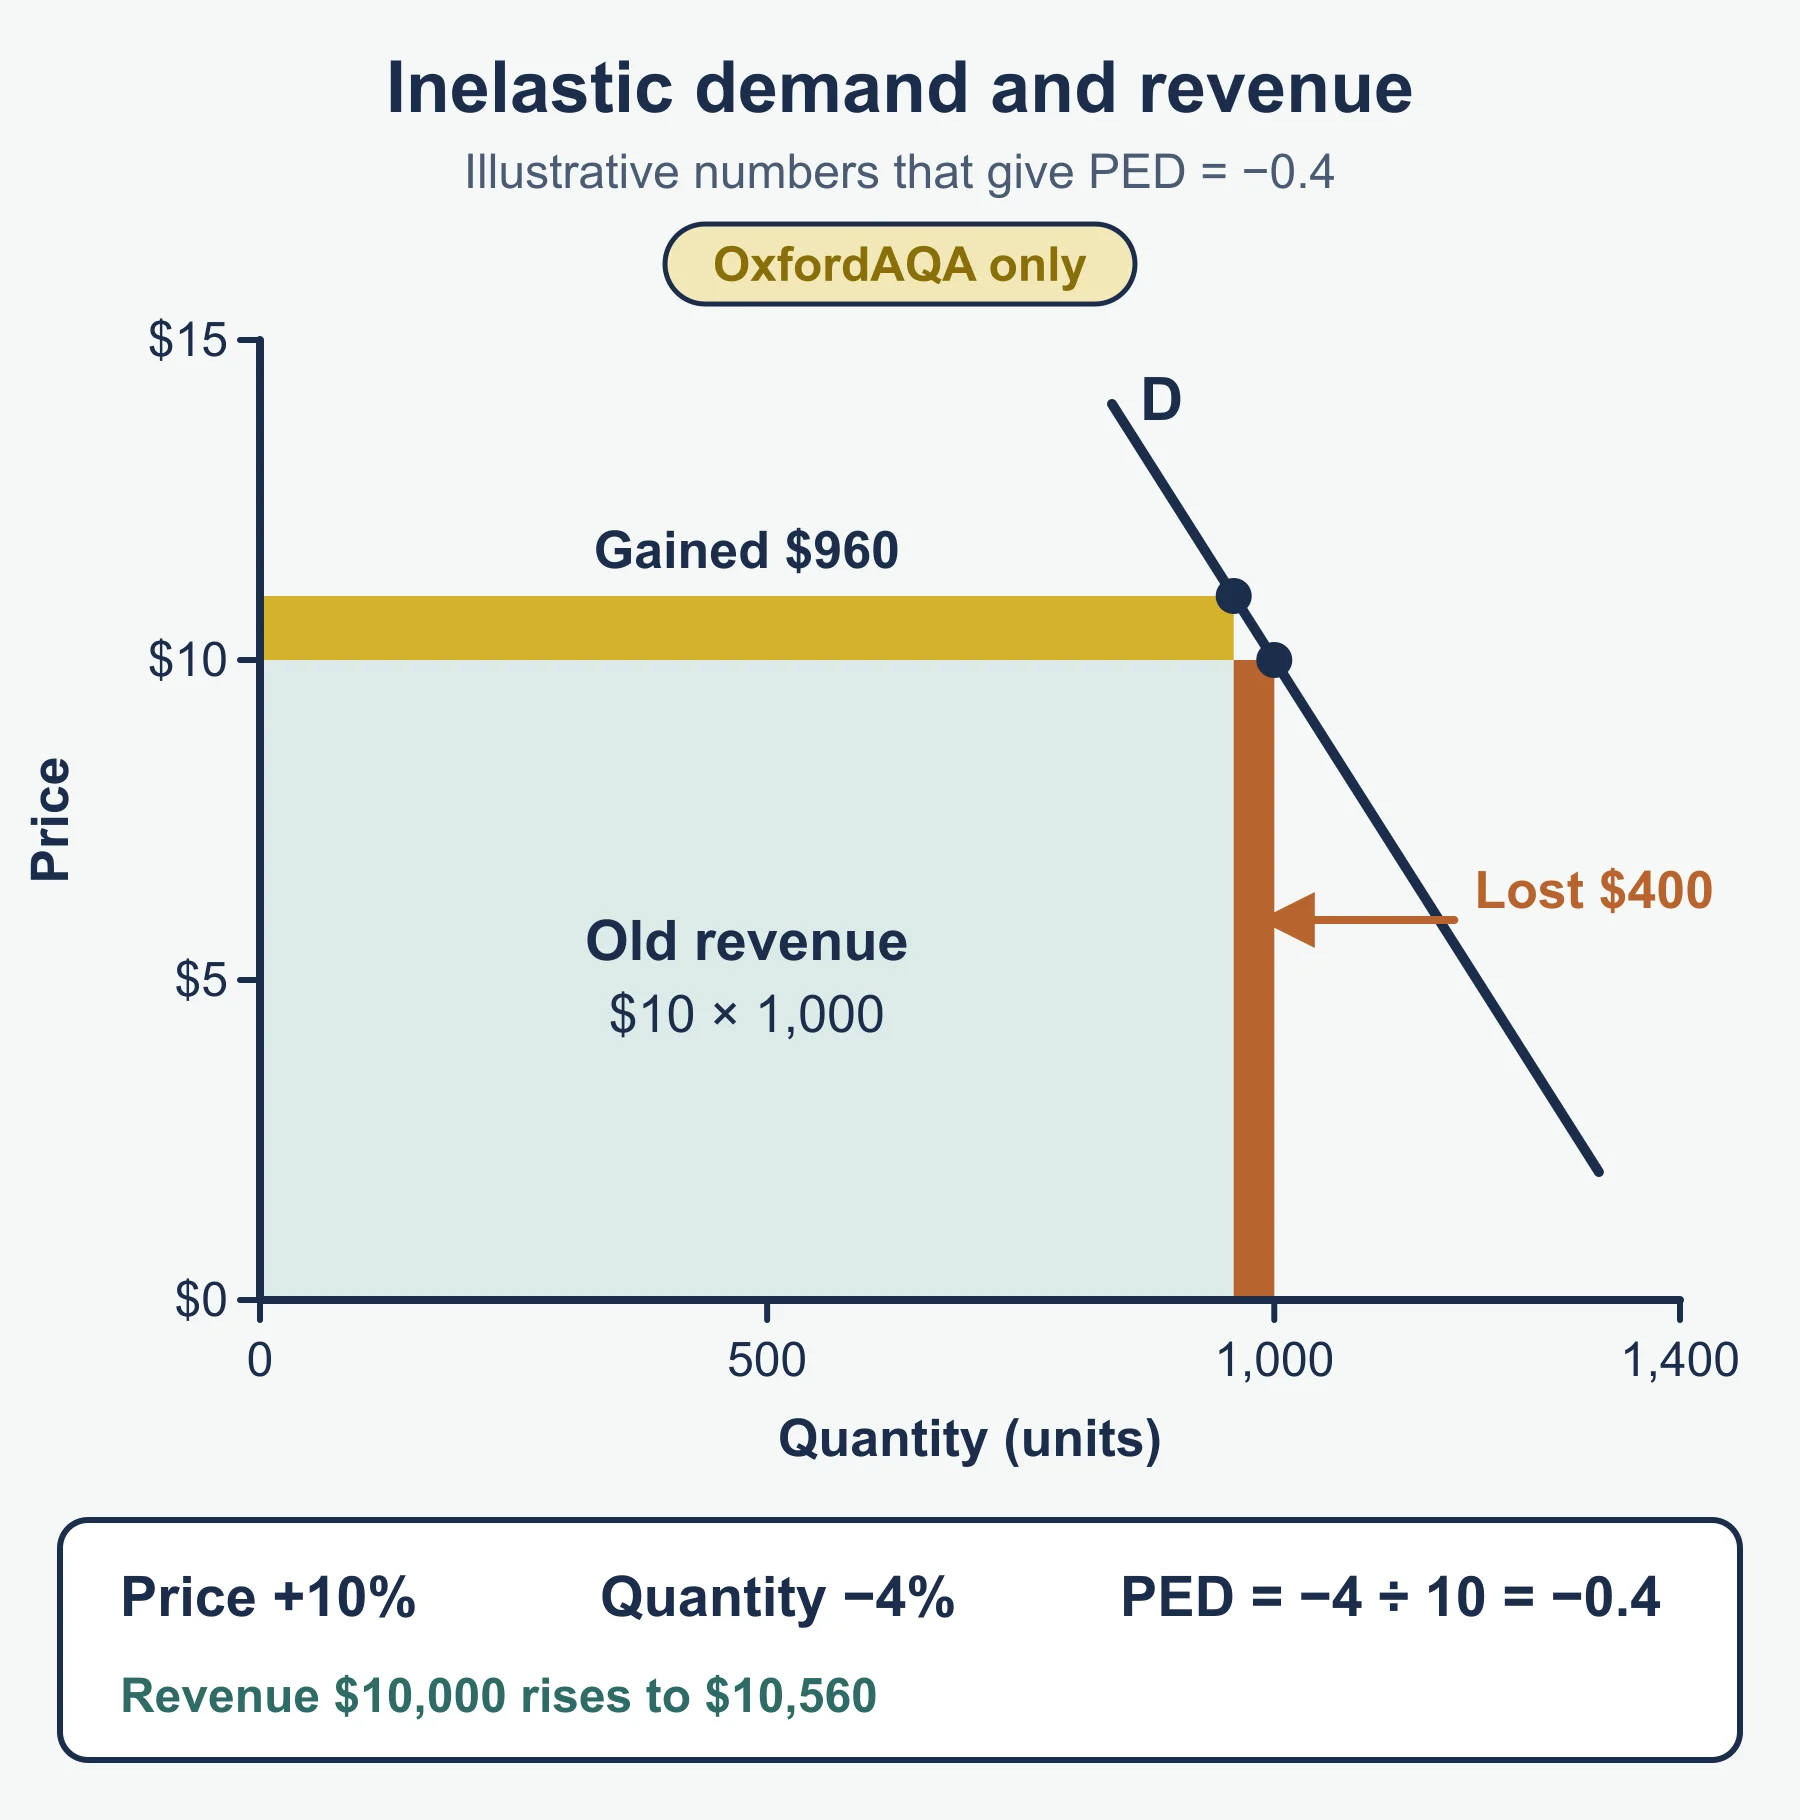
Worked example (inelastic). Oakhampton raises a jar from £4.00 to £4.40 (+10%) and sales fall from 30,000 to 28,500 (-5%). PED = -5 / 10 = -0.5. Revenue rises from £120,000 to £125,400.
| Demand is | Price rise | Price fall |
|---|---|---|
| Elastic | Total revenue falls | Total revenue rises |
| Inelastic | Total revenue rises | Total revenue falls |
Significance for pricing. A firm with inelastic demand can raise price to lift revenue, which is why it works to differentiate and build its brand. A firm facing elastic demand may gain by cutting price, but must check what happens to profit, because costs rise with volume and rivals may respond.
1.3.2: Income elasticity of demand (YED)
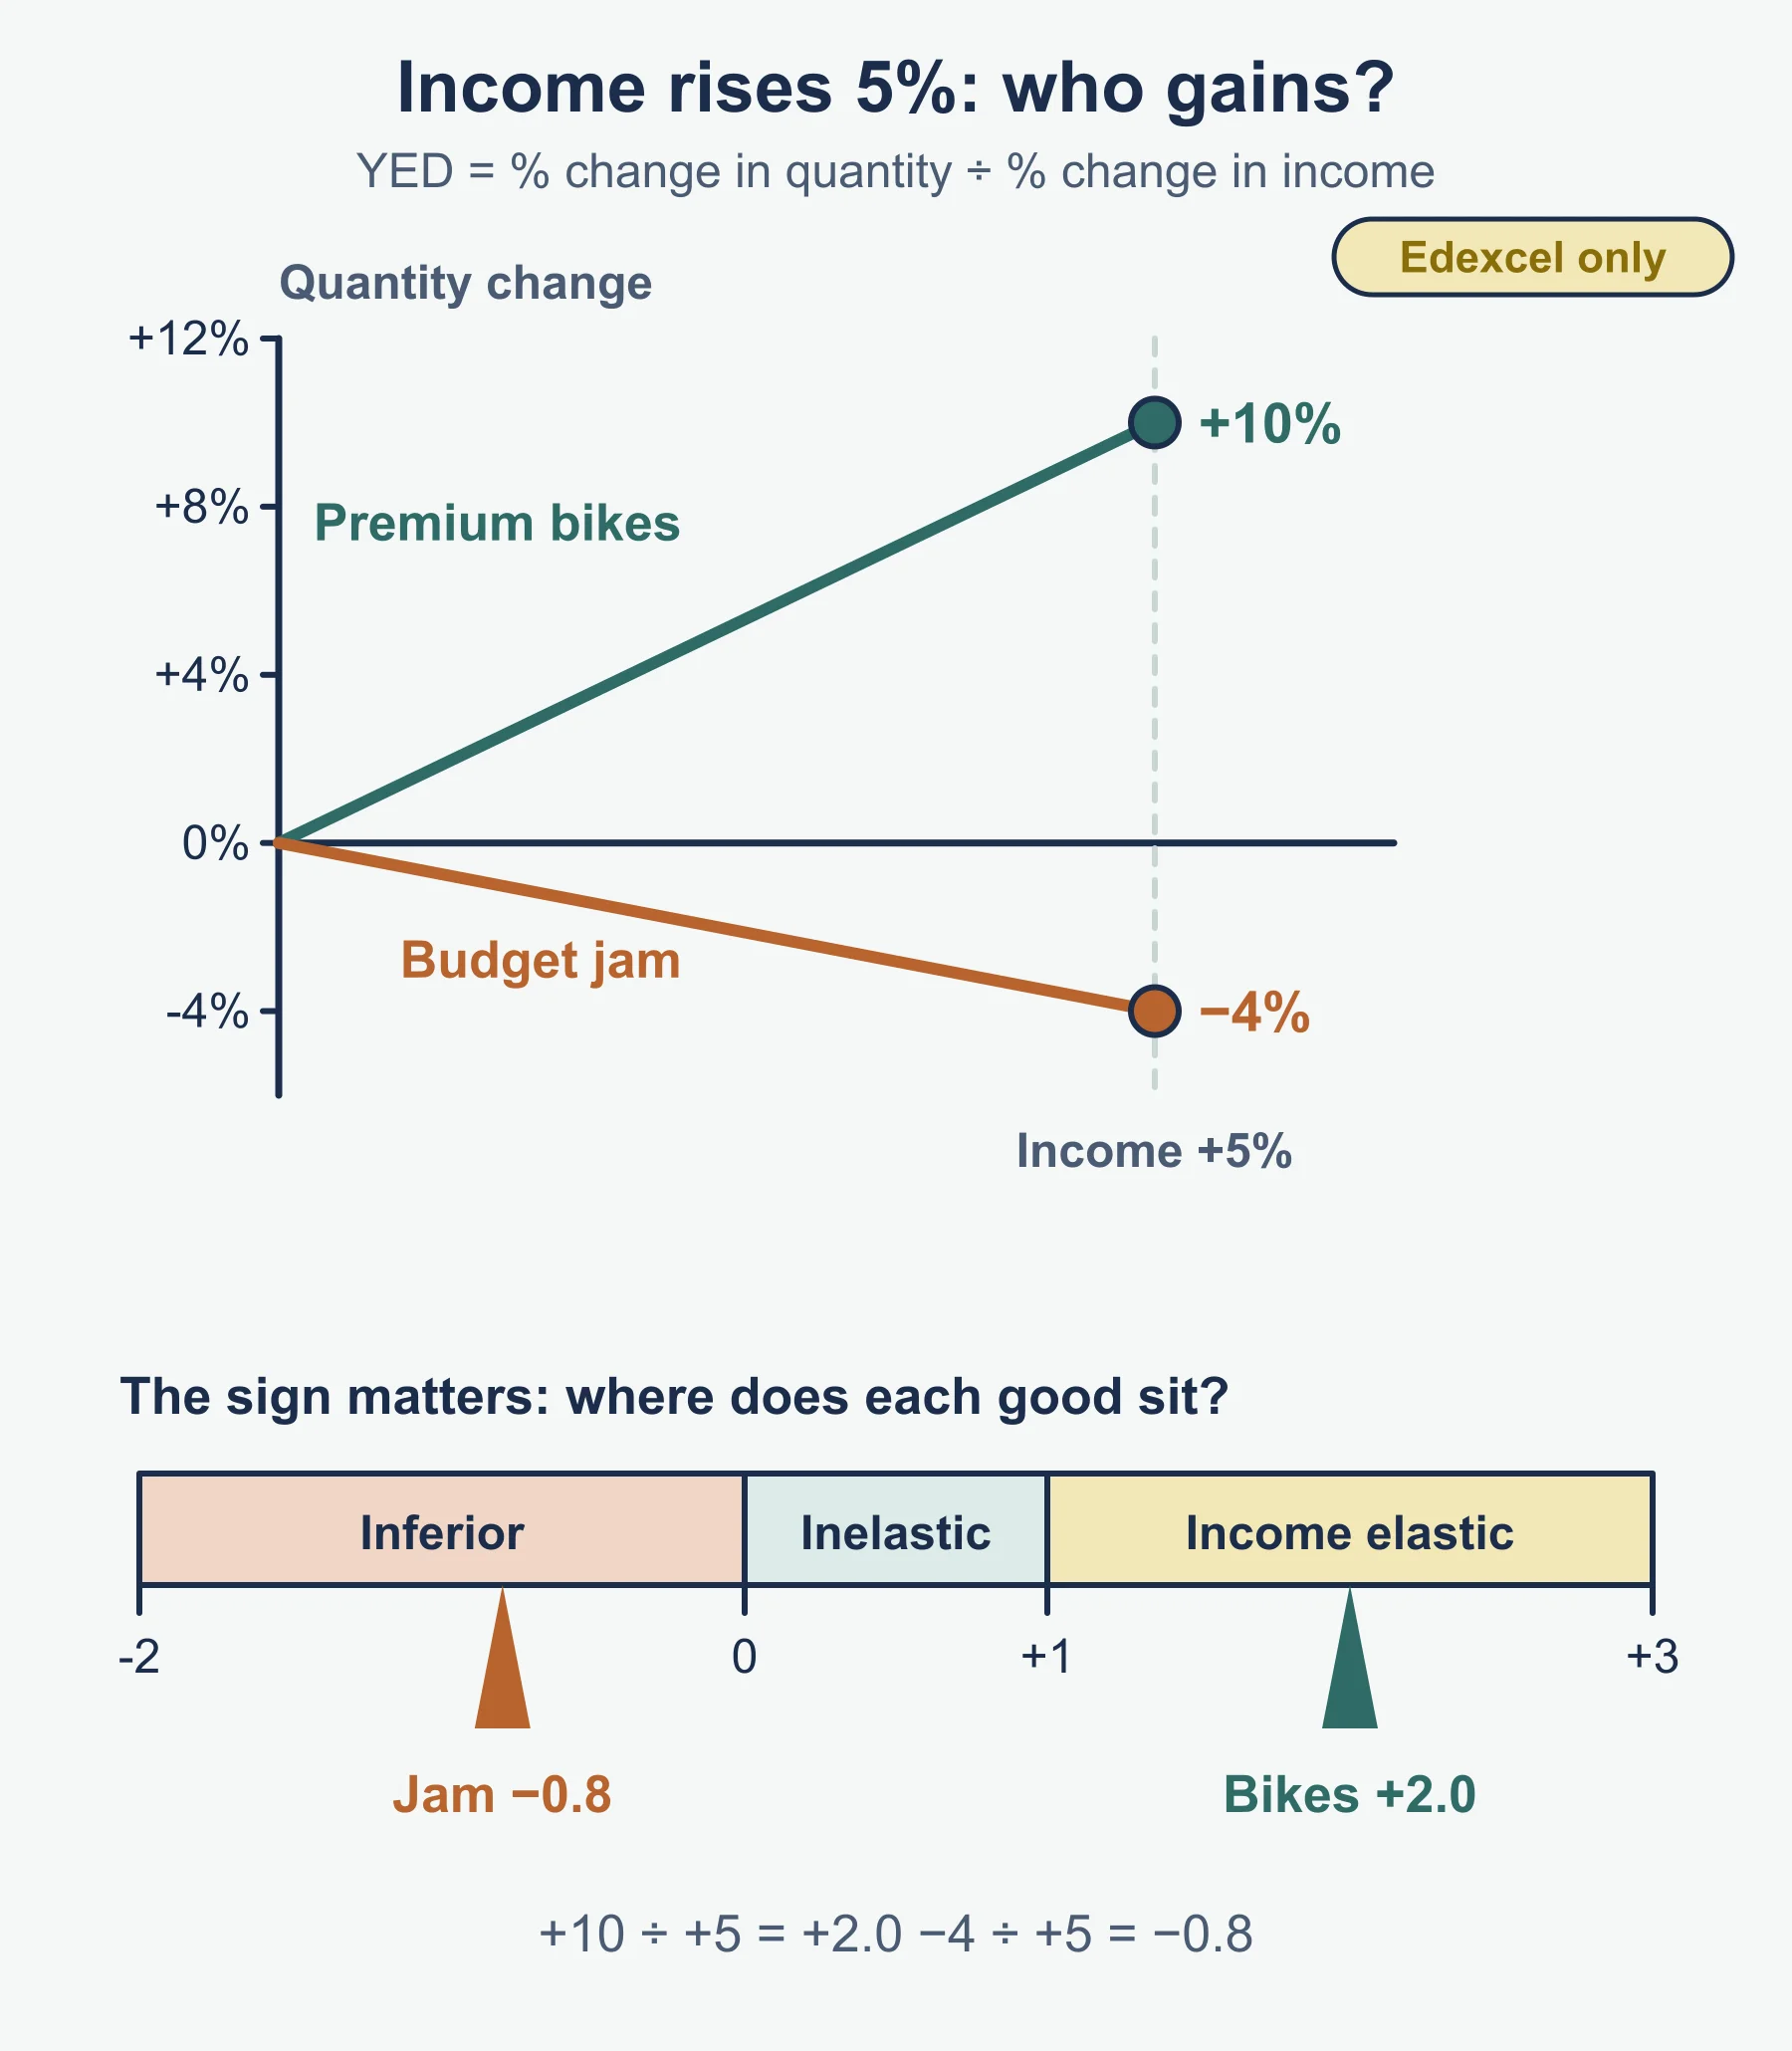
YED = % change in quantity demanded / % change in incomeHere the sign matters. A normal good has positive YED (demand rises with income); if YED is above 1, it is income elastic (often a luxury), and between 0 and 1 it is income inelastic. An inferior good has negative YED (demand falls as income rises).
Worked example. Average income rises from £30,000 to £31,500 (+5%). Rusholme’s premium bikes rise from 2,000 to 2,200 (+10%): YED = +2.0. Oakhampton’s budget jam falls from 10,000 to 9,600 (-4%): YED = -4 / 5 = -0.8, so it is inferior.
Influences: how much of a necessity or luxury the good is, its price level relative to alternatives, and how quickly consumers upgrade. Significance: firms selling high-YED goods gain most in a boom and lose most in a recession, so they may add lower-priced lines or spread risk across products. A firm selling inferior goods may benefit when incomes fall.
Common errors
- Confusing market size with market share.
- Dropping the minus sign on YED, or reading PED’s size as its sign.
- Concluding on revenue when the question asks about profit.
- Treating a gap on a market map as a guaranteed opportunity.
- Confusing a movement along a curve (price change) with a shift (other factors).
- Using “risk” and “uncertainty” as synonyms.
Frequently asked questions
What is the difference between product orientation and market orientation? Product orientation starts from what the firm can make and then looks for buyers. Market orientation starts from what customers want, using research, and then designs the product.
What is equilibrium price? The equilibrium price is where quantity demanded equals quantity supplied. Above it there is a surplus, which pushes the price down; below it there is a shortage, which pushes the price up.
What factors shift the supply curve in Edexcel IAL Business? The YBS11 specification lists changes in costs of production, new technology, indirect taxes, government subsidies and external shocks among the shifters of supply. An indirect tax raises costs and reduces supply.
Is a gap on a market map always an opportunity? No. A gap shows where no rival is positioned, but there may be no demand there, so it needs testing with research before the business acts.
Official syllabus
Pearson Edexcel International Advanced Subsidiary/Advanced Level in Business, specification Issue 1, September 2017 (Pearson Education Limited), Unit 1, sections 1.3.1 and 1.3.2.
Get free revision emails (optional)
Occasional emails with practice questions, worked explanations and links to free resources for the qualification and subjects you choose. No spam, and you can unsubscribe from any email. The free tools on this site never need an email.
Related resources
-
Practice questions
Edexcel International A Level Business: Meeting customer needs and The market (YBS11) – Practice Questions
Original practice questions with worked answers for Edexcel International A Level Business Unit 1, sections 1.3.1 and 1.3.2: PED, YED, research.
Business · Pearson Edexcel · AS Level
Try questions -
Revision notes
Edexcel International A Level Business: Meeting customer needs and The market (YBS11) – Revision Notes
Condensed recall notes for Edexcel International A Level Business Unit 1 sections 1.3.1 and 1.3.2, with formula tables and a ten-question self-test.
Business · Pearson Edexcel · AS Level
Revise topic -
Study guides
Edexcel International A Level Business: Managing people and Entrepreneurs and leaders (YBS11)
Teaching guide to staffing, structure, motivation, leadership, entrepreneurs and objectives for Edexcel International A Level Business Unit 1.
Business · Pearson Edexcel · AS Level
Read guide
Related articles
-
teaching
A Level tuition in Dubai: Cambridge or Pearson Edexcel International A Level?
Schools in Dubai and Abu Dhabi teach either Cambridge International AS & A Level or Pearson Edexcel International A Level. How the two are structured, why it matters for tuition, and how online classes from Lahore work.
9 October 2026
-
curriculum guides
Choosing subjects at IGCSE and A Level
How subject choices at 14 and 16 affect university options later, and how to keep pathways open without overloading a timetable.
28 July 2026
Studying this with a teacher
Working through Business AS LEVEL?
This page is free and stays free. If you would rather be taught it, Marlbridge runs Business classes one-to-one and in small groups of up to 15, online in your own time zone. The first trial class is free. WhatsApp replies within an hour (8am–11pm Pakistan time, every day); email the same day.
Pearson Edexcel Business teachers at Marlbridge

