Study Guides
Edexcel IGCSE Accounting: Accounting ratios (4AC1)
Study guide to profitability versus liquidity and the five Edexcel IGCSE Accounting ratios, with a two-year worked example and interpretation.
- Subject
- Accounting
- Level
- IGCSE
- Topic
- The preparation of financial statements
- Author
- Marlbridge Academic Team
- Updated
- Reviewed by
- Javaid Iqbal Sabri (what this means)
Aligned to Pearson Edexcel IGCSE Accounting (4AC1), Issue 1, October 2016. Official specification .
Syllabus page (what it covers and how it is assessed): Pearson Edexcel IGCSE Accounting.
Syllabus points this page covers
4AC1
- 4 The preparation of financial statements (whole topic)
- 4.4 The calculation and interpretation of accounting ratios
Found an error? Report a correction.
Want a teacher for this? Marlbridge teaches Accounting online. Request a free trial class.
This guide follows the Pearson Edexcel International GCSE in Accounting (4AC1) specification, Issue 1, October 2016. It covers Topic 4, section 4.4 “The calculation and interpretation of accounting ratios”, points (a) to (c). The specification places topics 4 and 5 in Paper 2, so this material belongs to the financial statements paper. You will need the income statement and the statement of financial position from earlier in the topic, because every ratio is built from figures on those two statements.
Course links: the 4AC1 Accounting hub, the printable checklist and the free diagnostics. Companion pages: the revision notes and the practice questions.
What the specification asks for
| Point | You must be able to | Where in this guide |
|---|---|---|
| 4.4 (a) | Explain the difference between profitability and liquidity | Section 1 |
| 4.4 (b) | Calculate and interpret gross profit percentage; profit for the year as a percentage of revenue; return on capital employed | Sections 2 and 3 |
| 4.4 (c) | Calculate and interpret the current (working capital) ratio and the liquid (acid test) ratio | Section 4 |
The specification names five ratios and does not set benchmark figures for any of them. Everything below is built around those five.
1. Profitability and liquidity (4.4 a)
Profitability is about whether the business earns a profit, and how big that profit is compared with something: revenue or the money invested. It is judged from the income statement, and for return on capital employed from the statement of financial position as well.
Liquidity is about whether the business can pay what it owes in the short term, using cash and assets that will soon turn into cash. It is judged from the current assets and current liabilities on the statement of financial position.
The two are separate. A profit is a difference between revenue and expenses. Cash is what is actually in the bank. A business can report a healthy profit and still be unable to pay a supplier on time, and a business making a loss can have plenty of cash for a while.
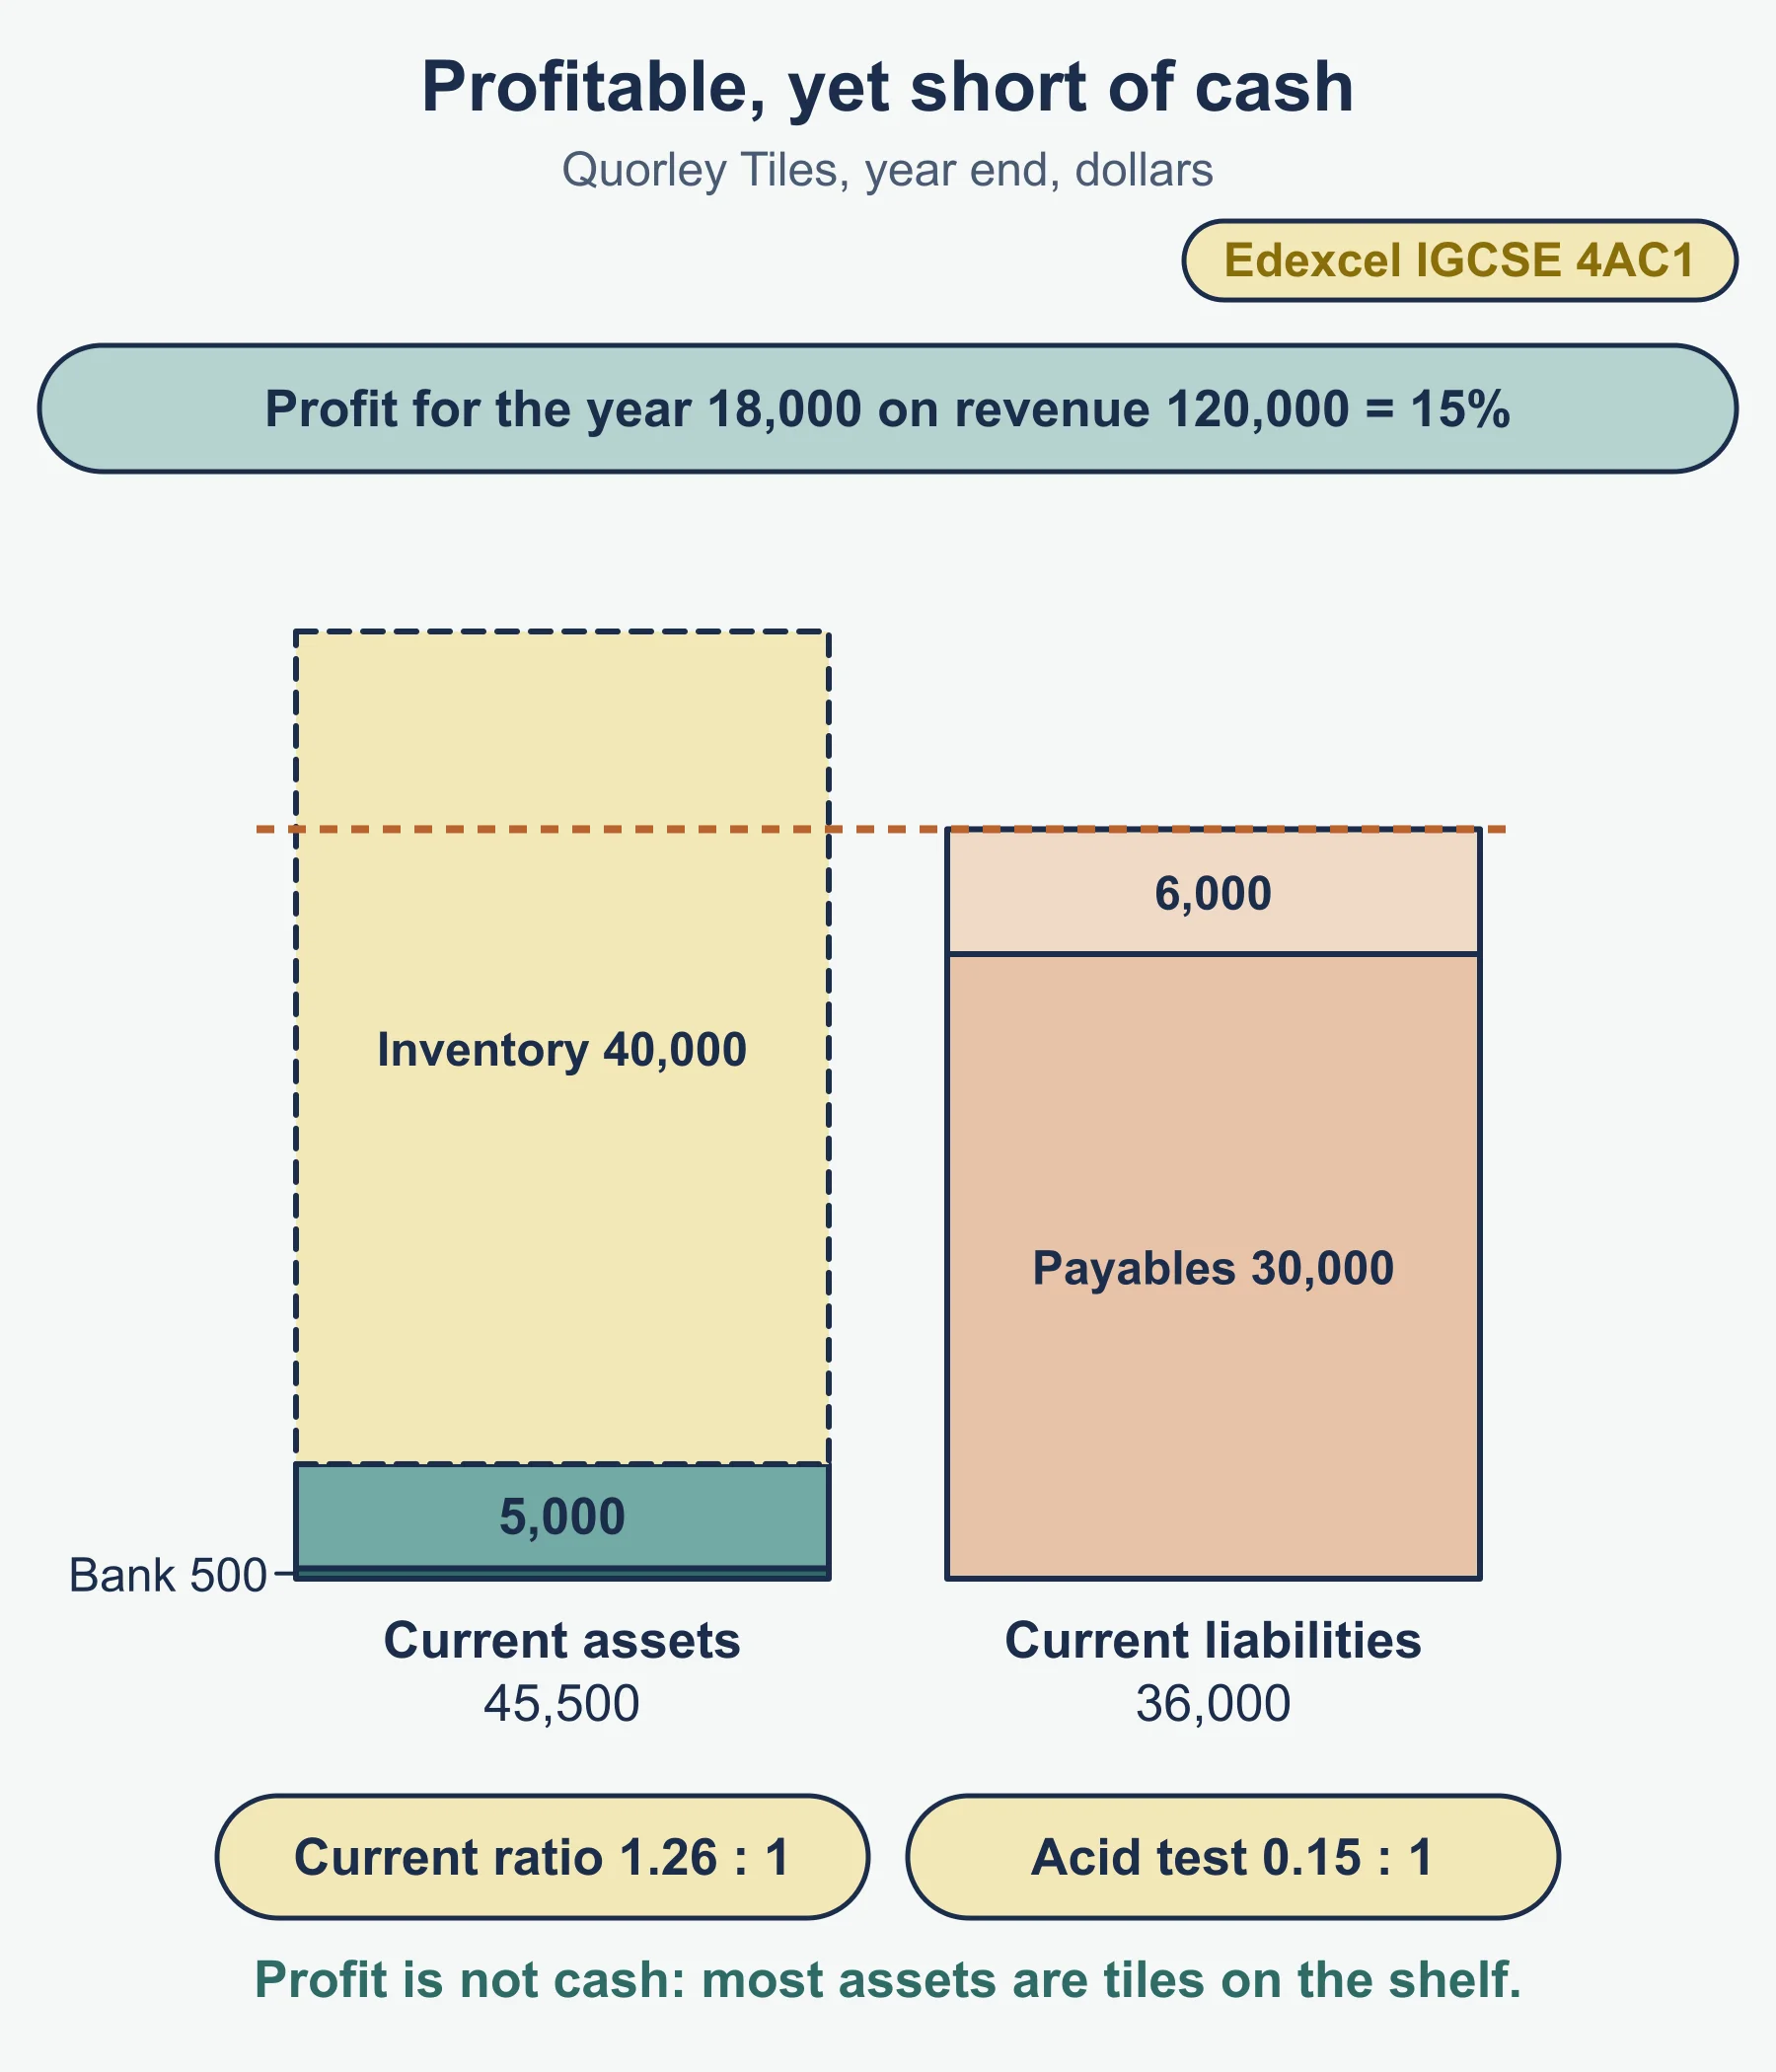
A short case shows the gap (all amounts in this guide are in dollars). Quorley Tiles earns a profit for the year of 18,000 on revenue of 120,000, which is 15%. During the year it bought a large stock of tiles. At the year end it holds:
| Current assets | Amount | Current liabilities | Amount |
|---|---|---|---|
| Inventory | 40,000 | Trade payables | 30,000 |
| Trade receivables | 5,000 | Other payables | 6,000 |
| Bank | 500 | ||
| Total | 45,500 | Total | 36,000 |
Current ratio = 45,500 ÷ 36,000 = 1.26 : 1. Without inventory the figure is 5,500 ÷ 36,000 = 0.15 : 1. Quorley Tiles is profitable but its cash position is tight: most of its current assets are tiles on the shelf, not money. That is the distinction part (a) tests.
2. Where the figures come from
Work from the two statements, using the board’s terms: revenue, cost of sales, gross profit, other operating expenses, profit for the year; and inventory, trade receivables, bank, trade payables, other payables.
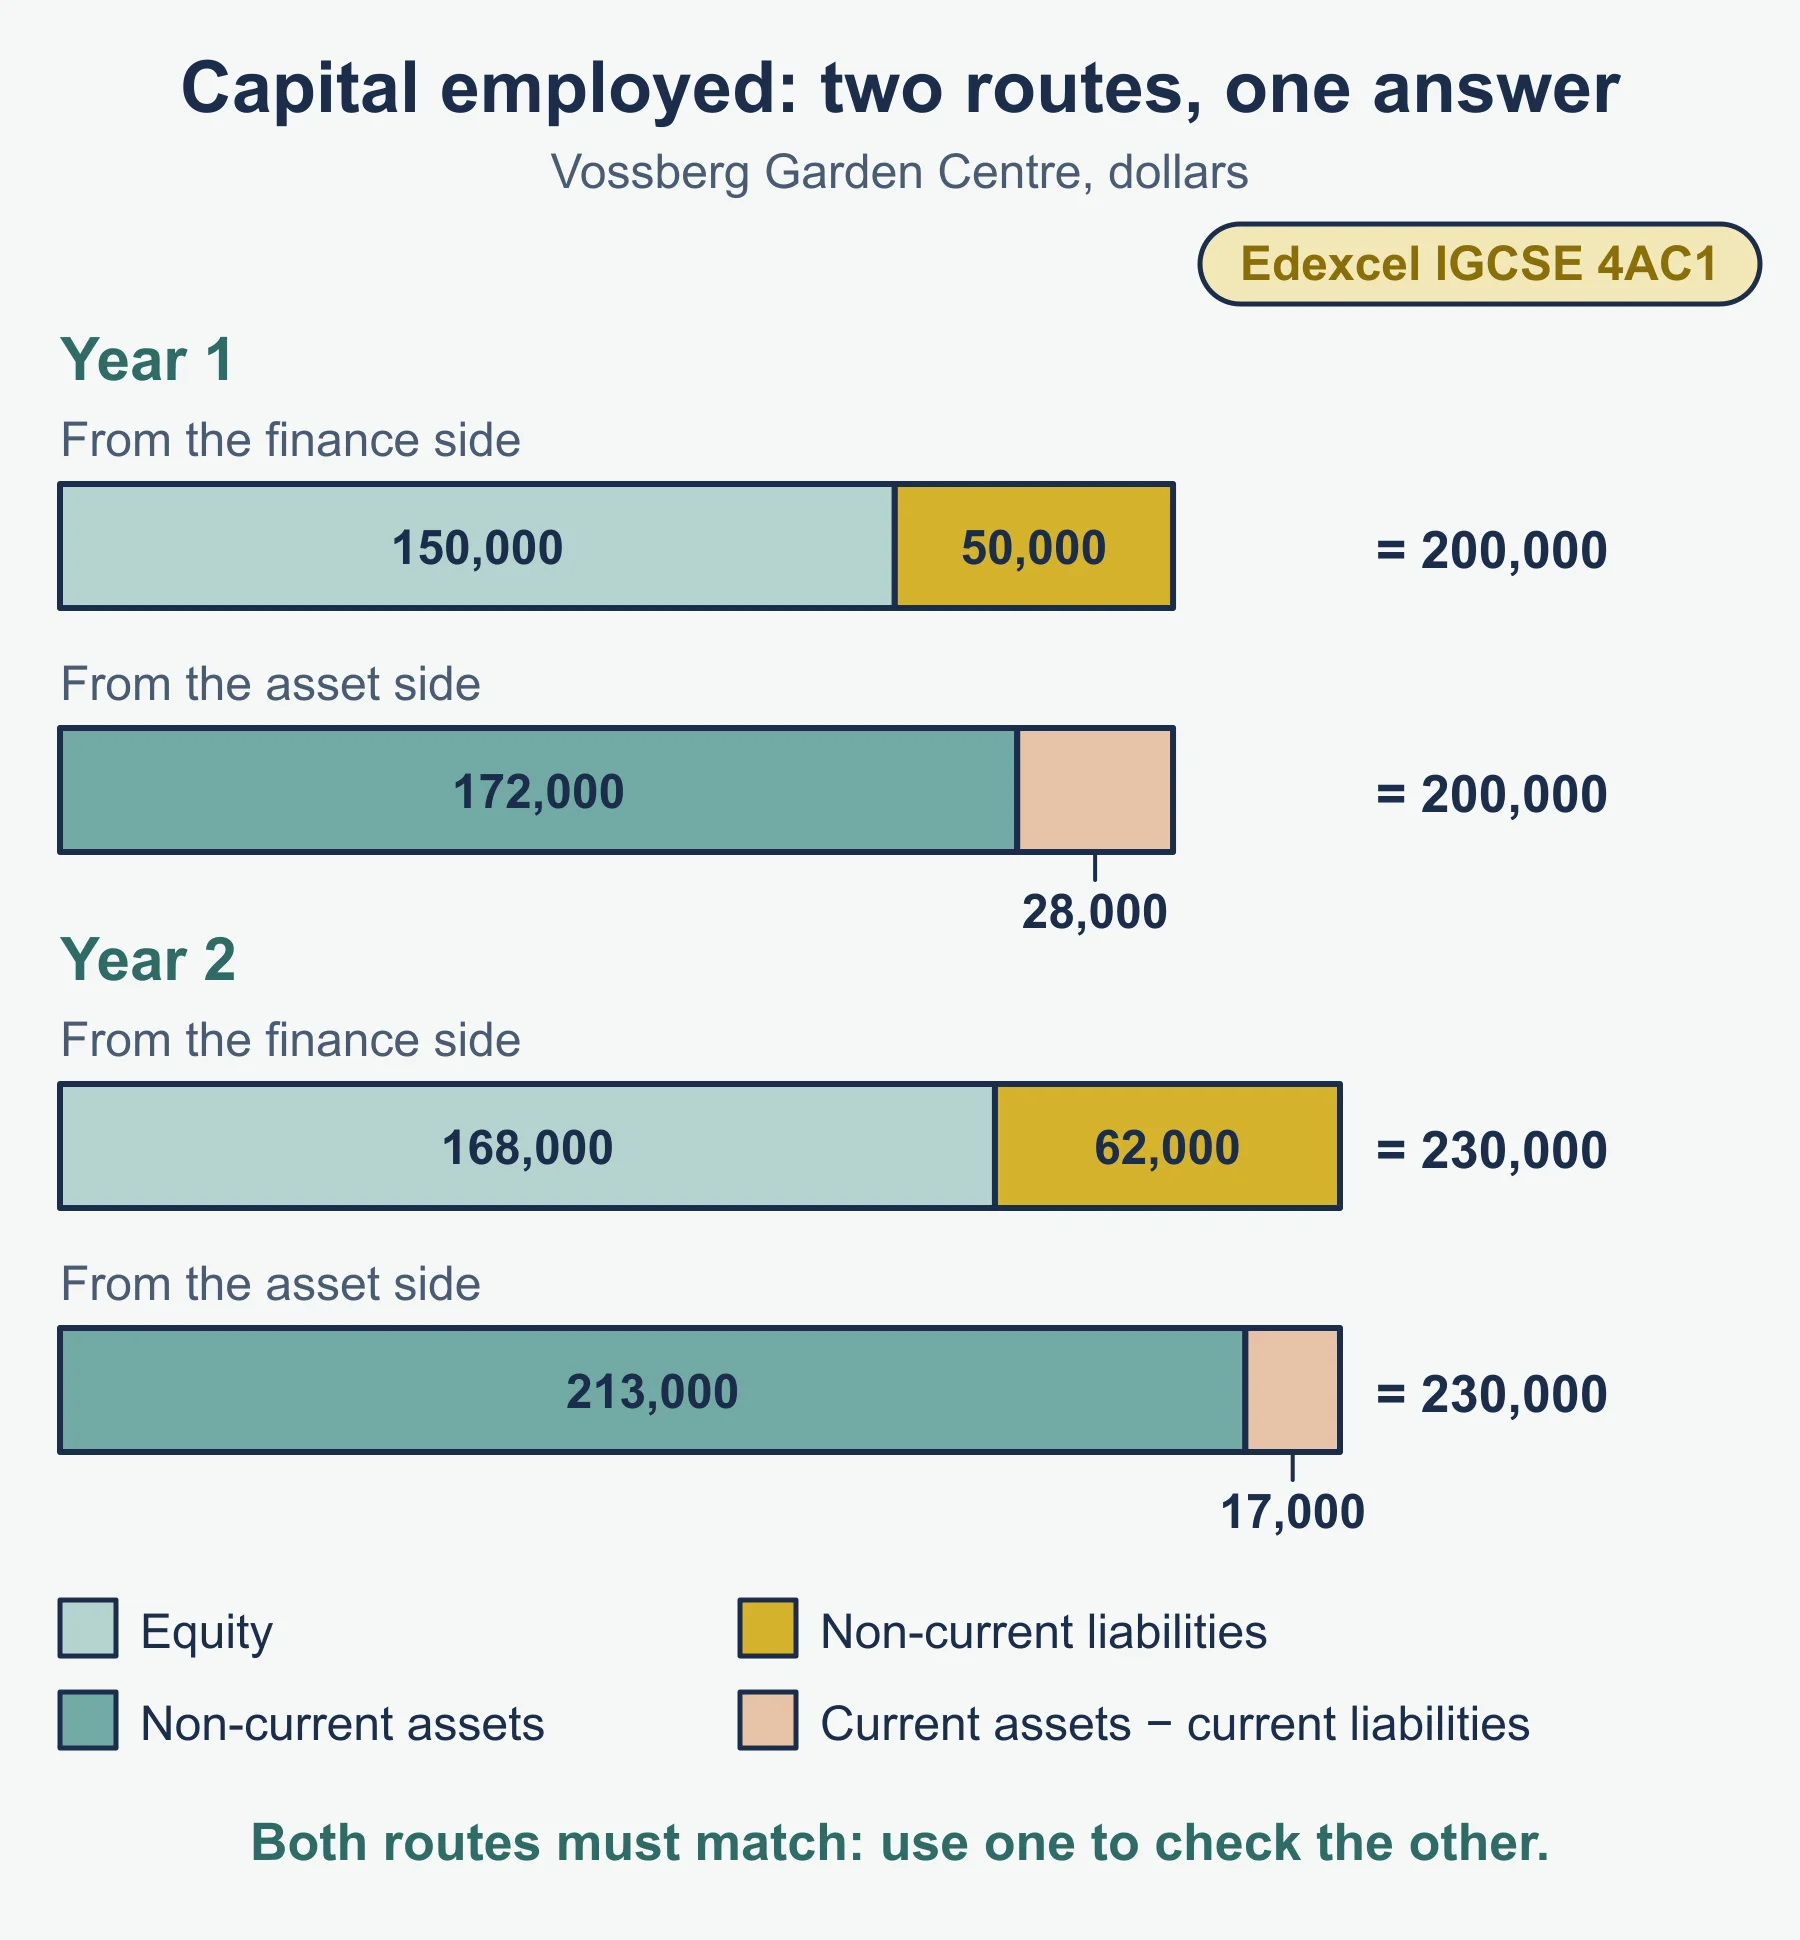
Capital employed. The specification does not give a formula, so state yours. The usual approach is the long-term finance in the business:
- Capital employed = equity + non-current liabilities.
- The same figure from the asset side: non-current assets + current assets − current liabilities. The last two together are working capital.
Both routes must give the same answer. Use one as a check on the other. If a question gives you its own definition, follow that instead.
Presenting ratios. Percentages: show the formula, the working and the answer to 1 or 2 decimal places, with the % sign. Liquidity ratios: write as x : 1, to 2 decimal places. A bare number with no unit or sign is easy to misread.
3. Profitability ratios (4.4 b)
| Ratio | Formula | What it tells you |
|---|---|---|
| Gross profit percentage | gross profit ÷ revenue × 100 | The share of every 100 of revenue kept once the cost of sales is met |
| Profit for the year as a percentage of revenue | profit for the year ÷ revenue × 100 | The share of every 100 of revenue that remains once every expense is paid |
| Return on capital employed (ROCE) | profit for the year ÷ capital employed × 100 | The return earned on the long-term money in the business |
The first two use revenue as the base. ROCE uses capital employed, so it measures efficiency in using the money invested.
Worked example: Vossberg Garden Centre
Vossberg Garden Centre is a sole trader business. Figures for two years:
| Income statement extract | Year 1 | Year 2 |
|---|---|---|
| Revenue | 240,000 | 300,000 |
| Cost of sales | 156,000 | 201,000 |
| Gross profit | 84,000 | 99,000 |
| Other operating expenses | 54,000 | 72,000 |
| Profit for the year | 30,000 | 27,000 |
| Statement of financial position extract | Year 1 | Year 2 |
|---|---|---|
| Non-current assets | 172,000 | 213,000 |
| Inventory | 30,000 | 48,000 |
| Trade receivables | 18,000 | 30,000 |
| Bank | 12,000 | 4,000 |
| Current assets | 60,000 | 82,000 |
| Trade payables | 28,000 | 58,000 |
| Other payables | 4,000 | 7,000 |
| Current liabilities | 32,000 | 65,000 |
| Non-current liabilities | 50,000 | 62,000 |
| Equity (capital) | 150,000 | 168,000 |
Capital employed. Year 1: 150,000 + 50,000 = 200,000. Check: 172,000 + 60,000 − 32,000 = 200,000. Year 2: 168,000 + 62,000 = 230,000. Check: 213,000 + 82,000 − 65,000 = 230,000.
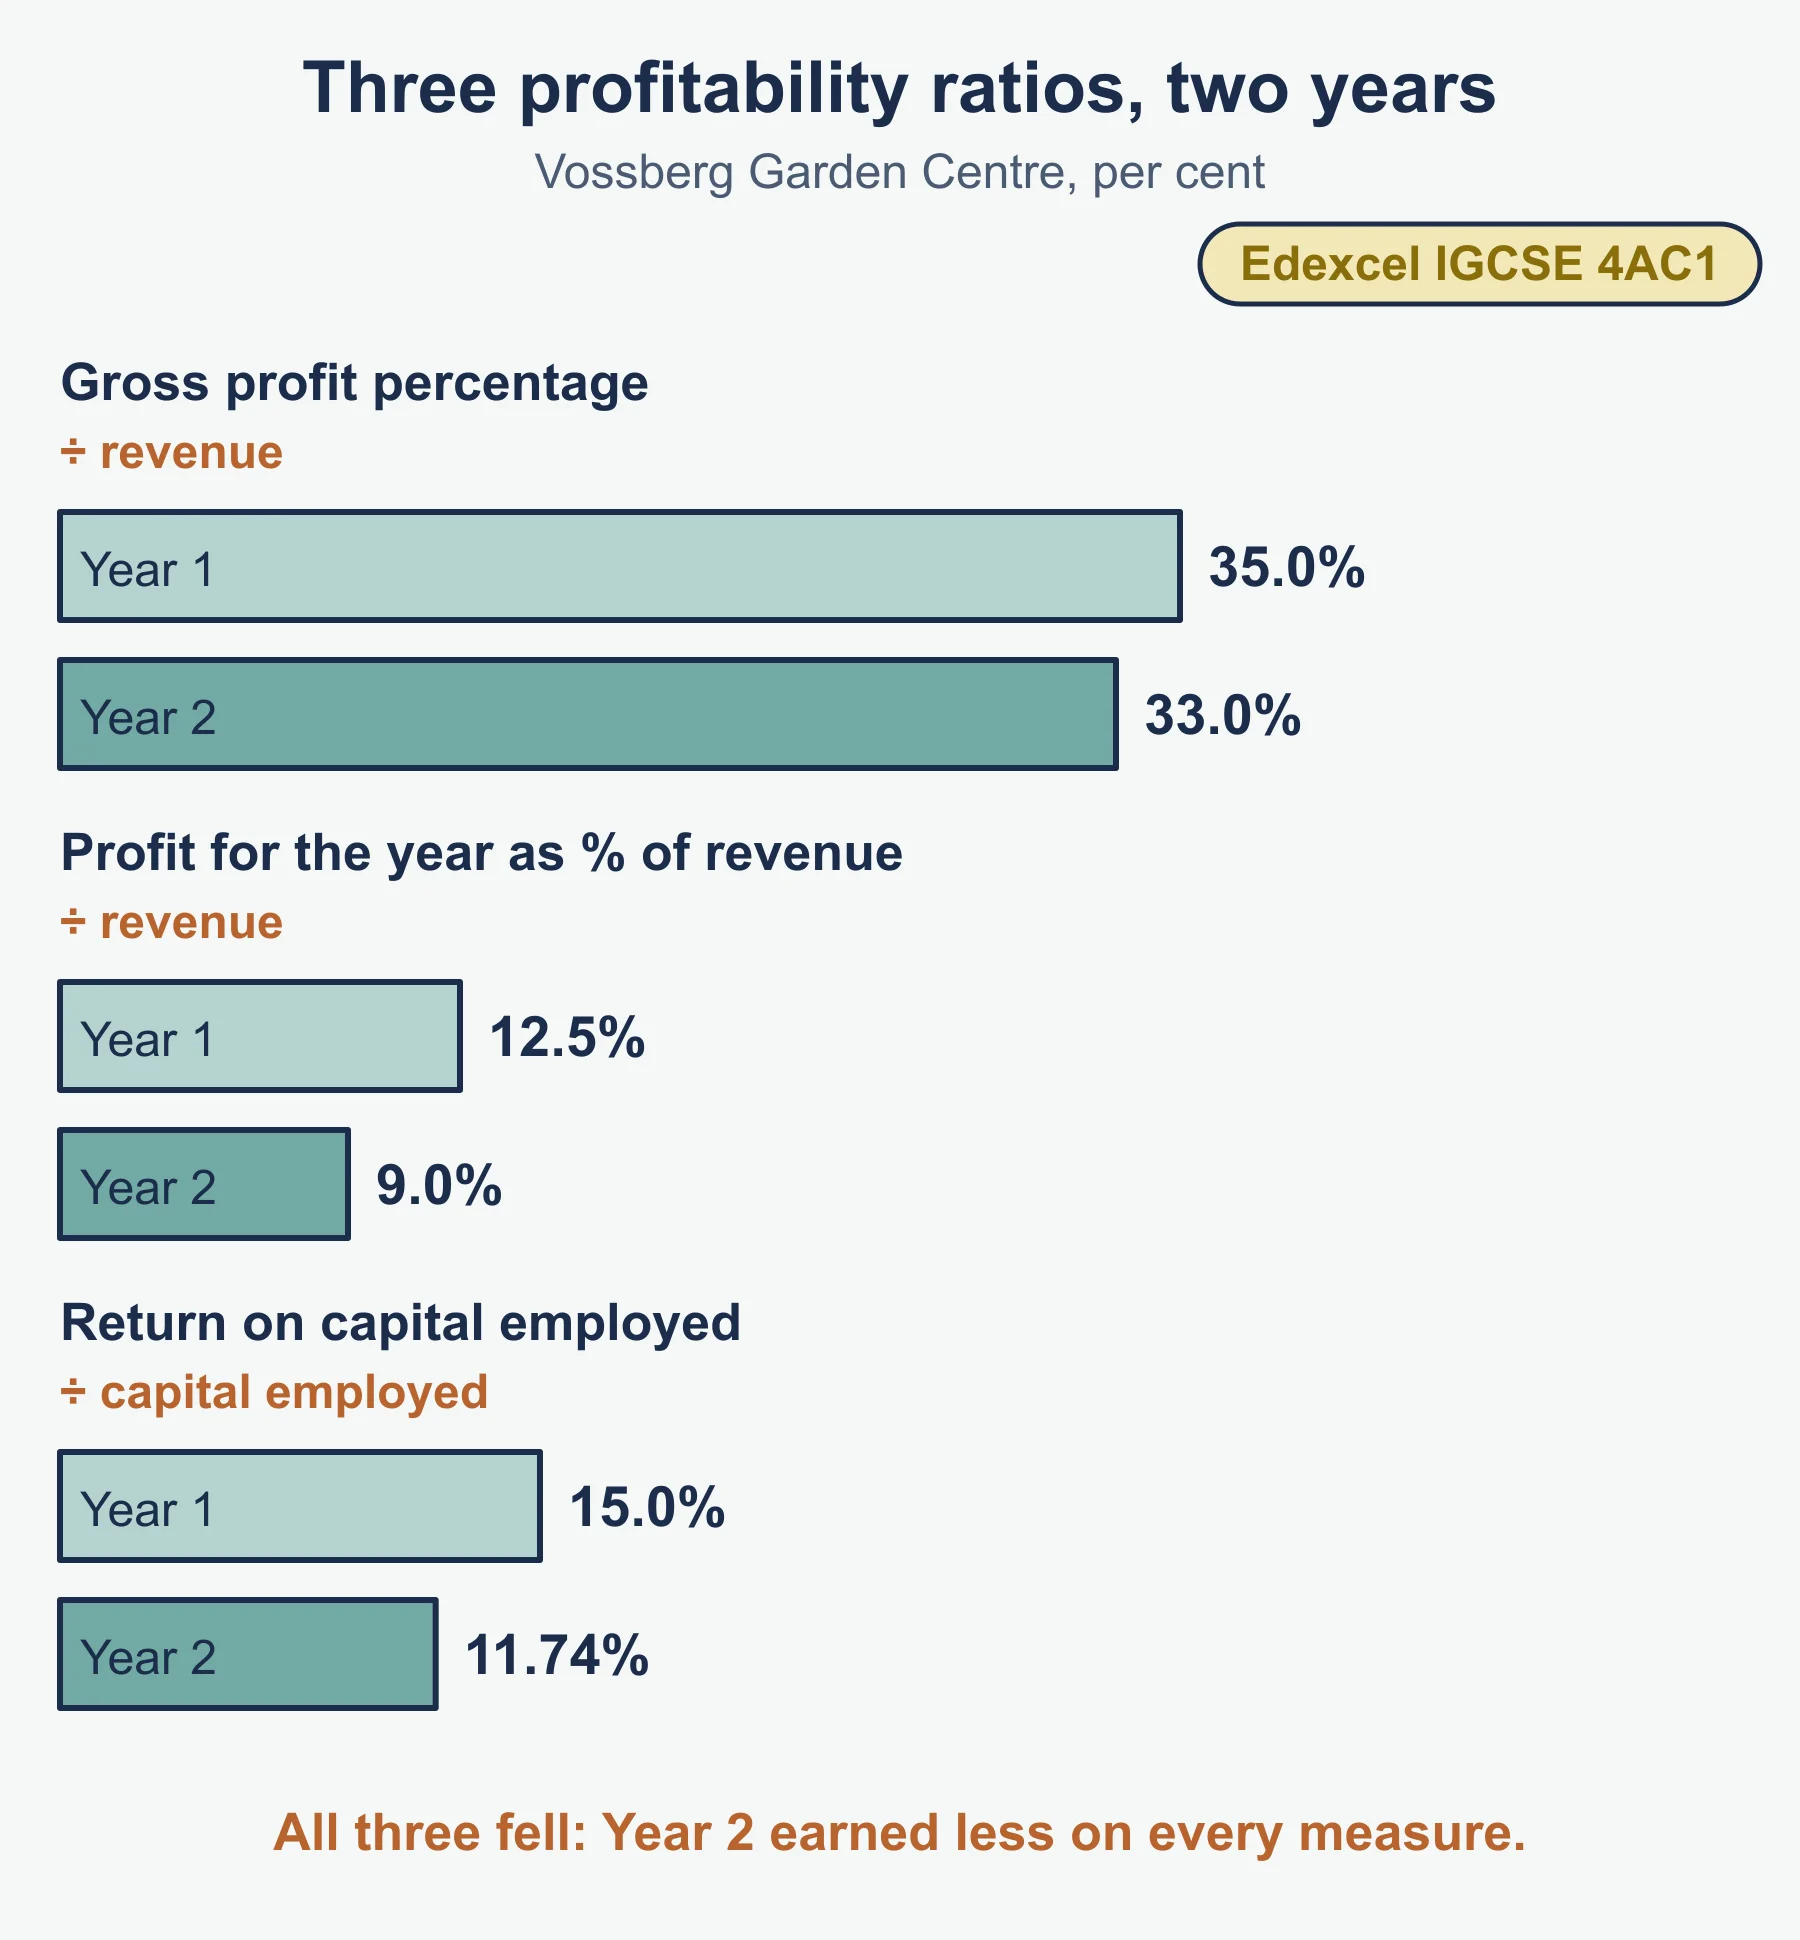
Gross profit percentage.
- Year 1: 84,000 ÷ 240,000 × 100 = 35.0%.
- Year 2: 99,000 ÷ 300,000 × 100 = 33.0%.
Profit for the year as a percentage of revenue.
- Year 1: 30,000 ÷ 240,000 × 100 = 12.5%.
- Year 2: 27,000 ÷ 300,000 × 100 = 9.0%.
Return on capital employed.
- Year 1: 30,000 ÷ 200,000 × 100 = 15.0%.
- Year 2: 27,000 ÷ 230,000 × 100 = 11.74%.
4. Liquidity ratios (4.4 c)
| Ratio | Formula | Notes |
|---|---|---|
| Current (working capital) ratio | current assets : current liabilities | Divide current assets by current liabilities and write the answer as x : 1 |
| Liquid (acid test) ratio | (current assets − inventory) : current liabilities | Inventory is removed because it must be sold, and then collected from customers, before it becomes cash |
Both compare what the business can turn into cash soon with what it must pay soon. The acid test is the stricter measure. A rule of thumb quoted in many textbooks is about 2 : 1 for the current ratio and 1 : 1 for the acid test, but the specification sets no benchmark. A supermarket sells for cash and sells inventory quickly, so it can run safely with lower ratios than a business that sells on credit.
Worked example continued: Vossberg Garden Centre
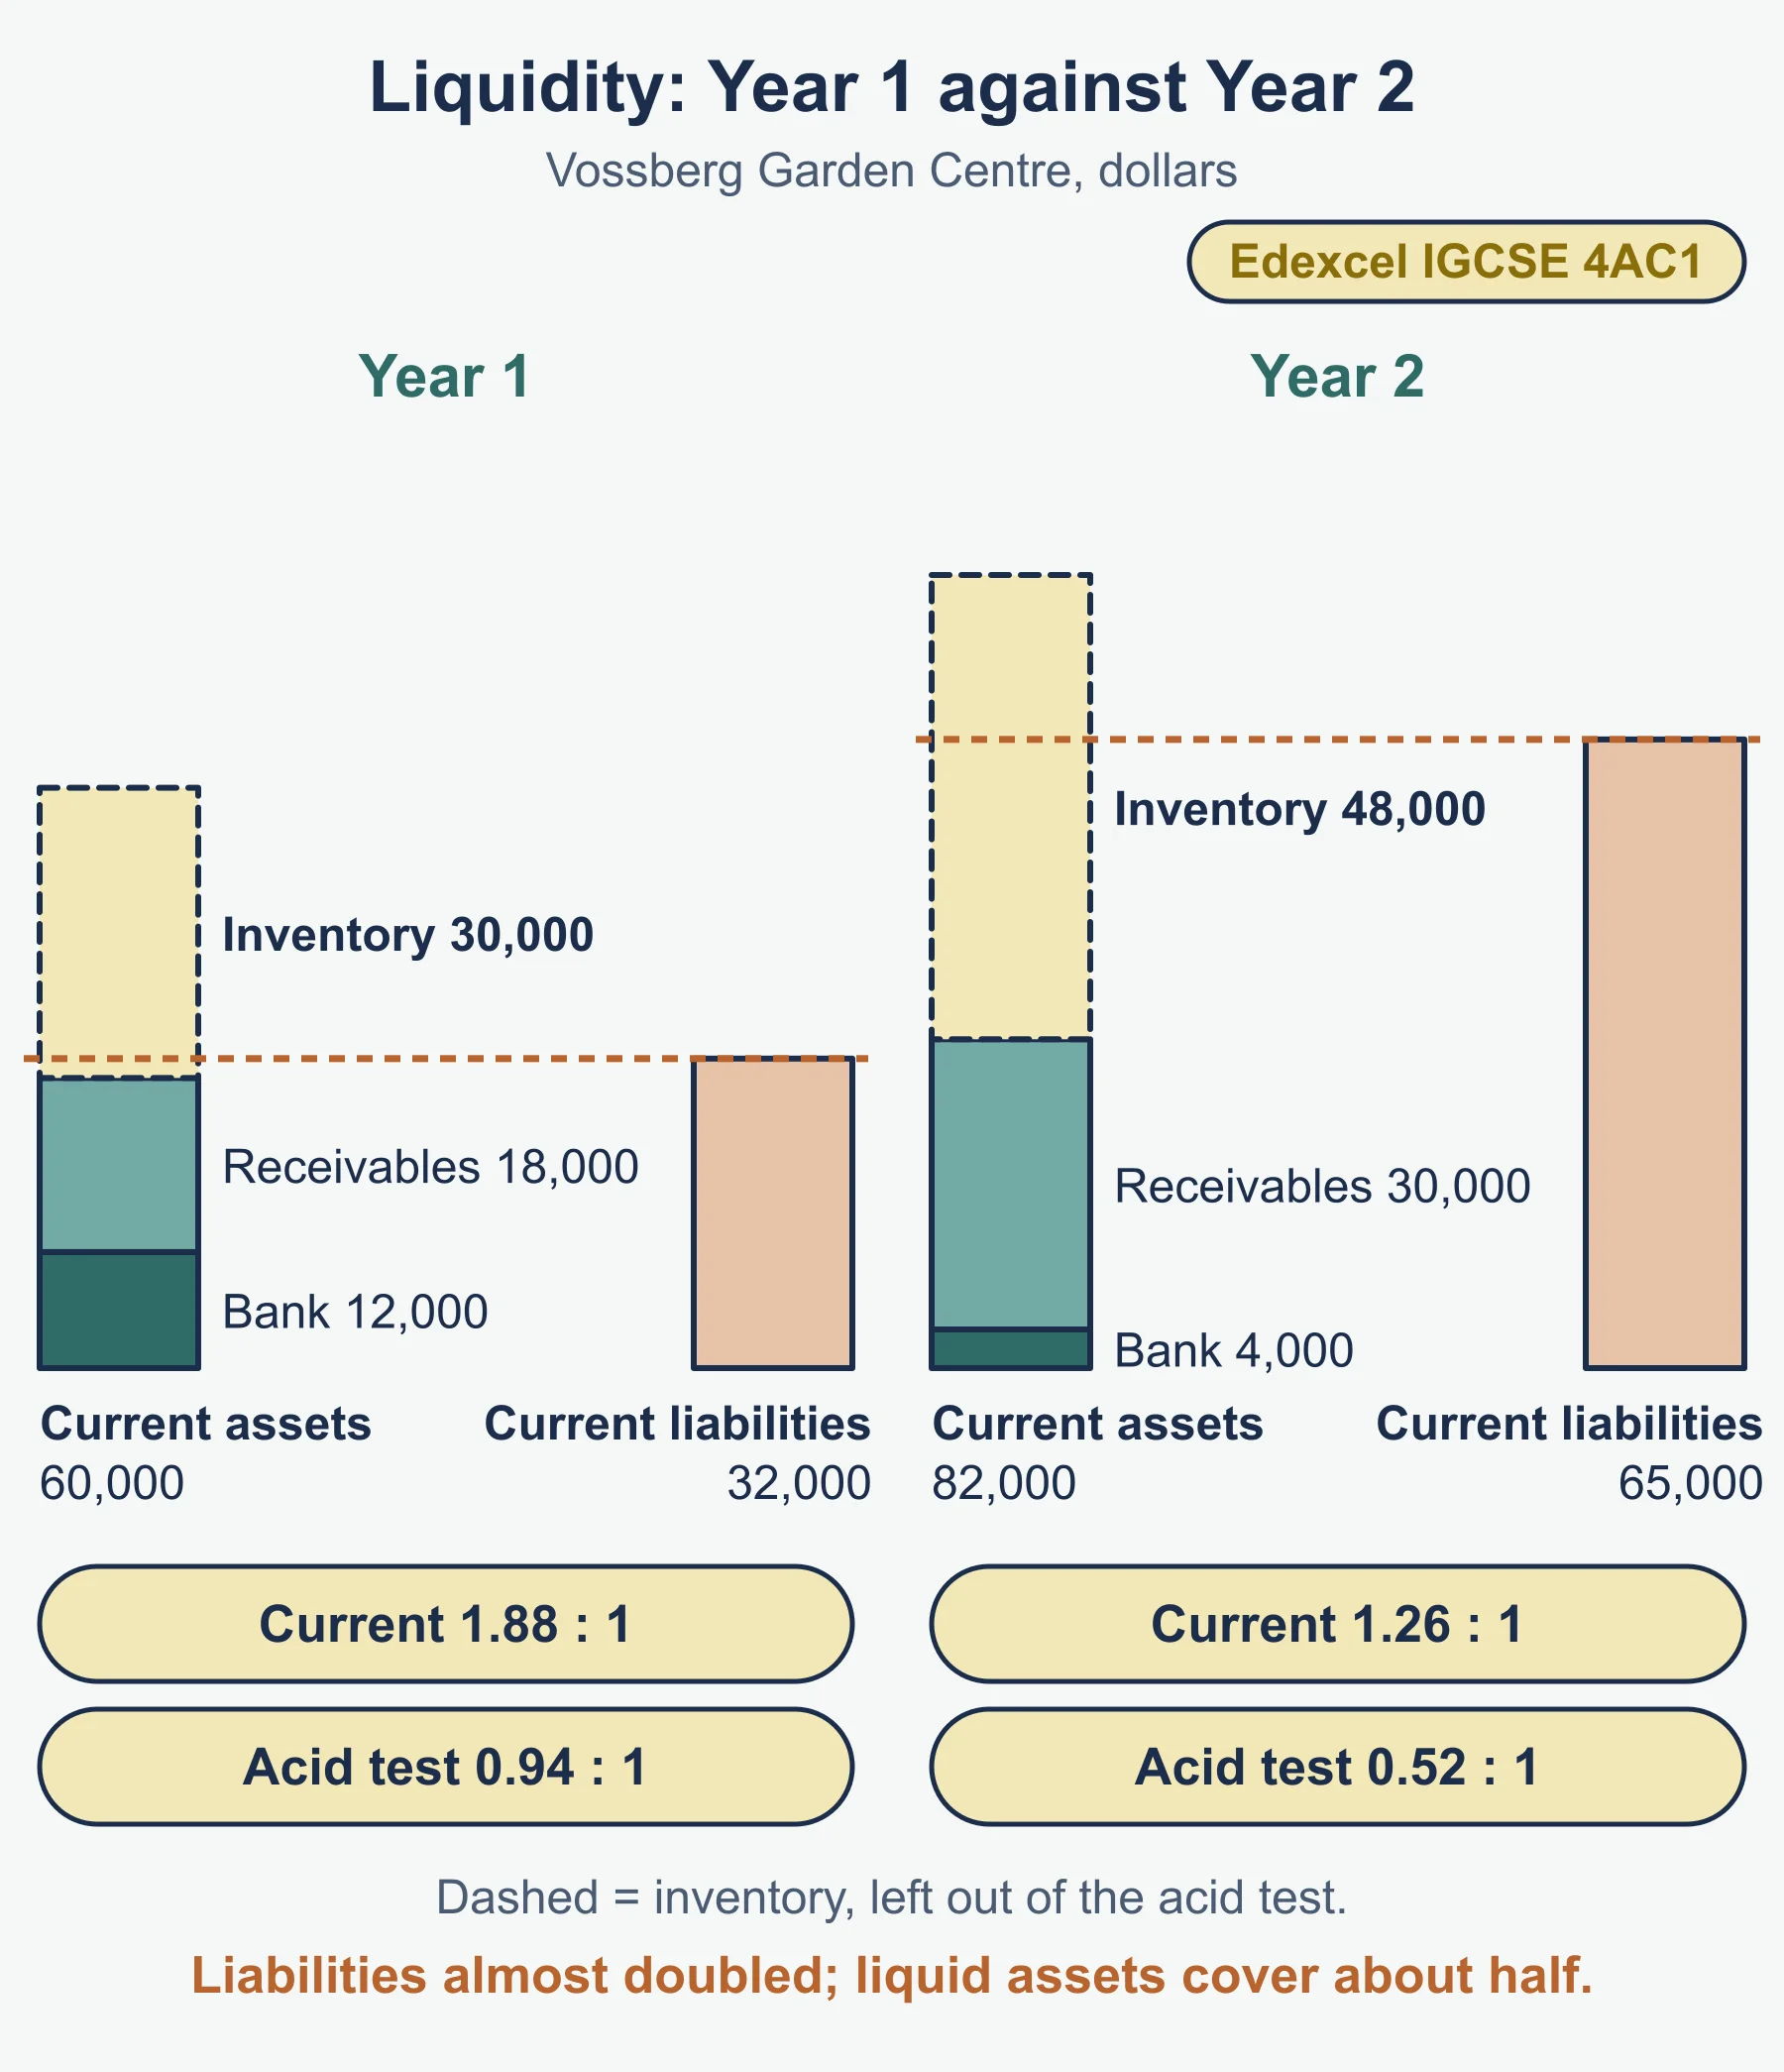
Current ratio:
- Year 1: 60,000 ÷ 32,000 = 1.88 : 1.
- Year 2: 82,000 ÷ 65,000 = 1.26 : 1.
Liquid (acid test) ratio:
- Year 1: (60,000 − 30,000) ÷ 32,000 = 30,000 ÷ 32,000 = 0.94 : 1.
- Year 2: (82,000 − 48,000) ÷ 65,000 = 34,000 ÷ 65,000 = 0.52 : 1.
5. Interpreting the results
Calculation earns part of the credit; interpretation needs a conclusion in words. Use four steps: say what the ratio did, give a possible reason, link it to the other ratios, and state the consequence.
Profitability for Vossberg Garden Centre
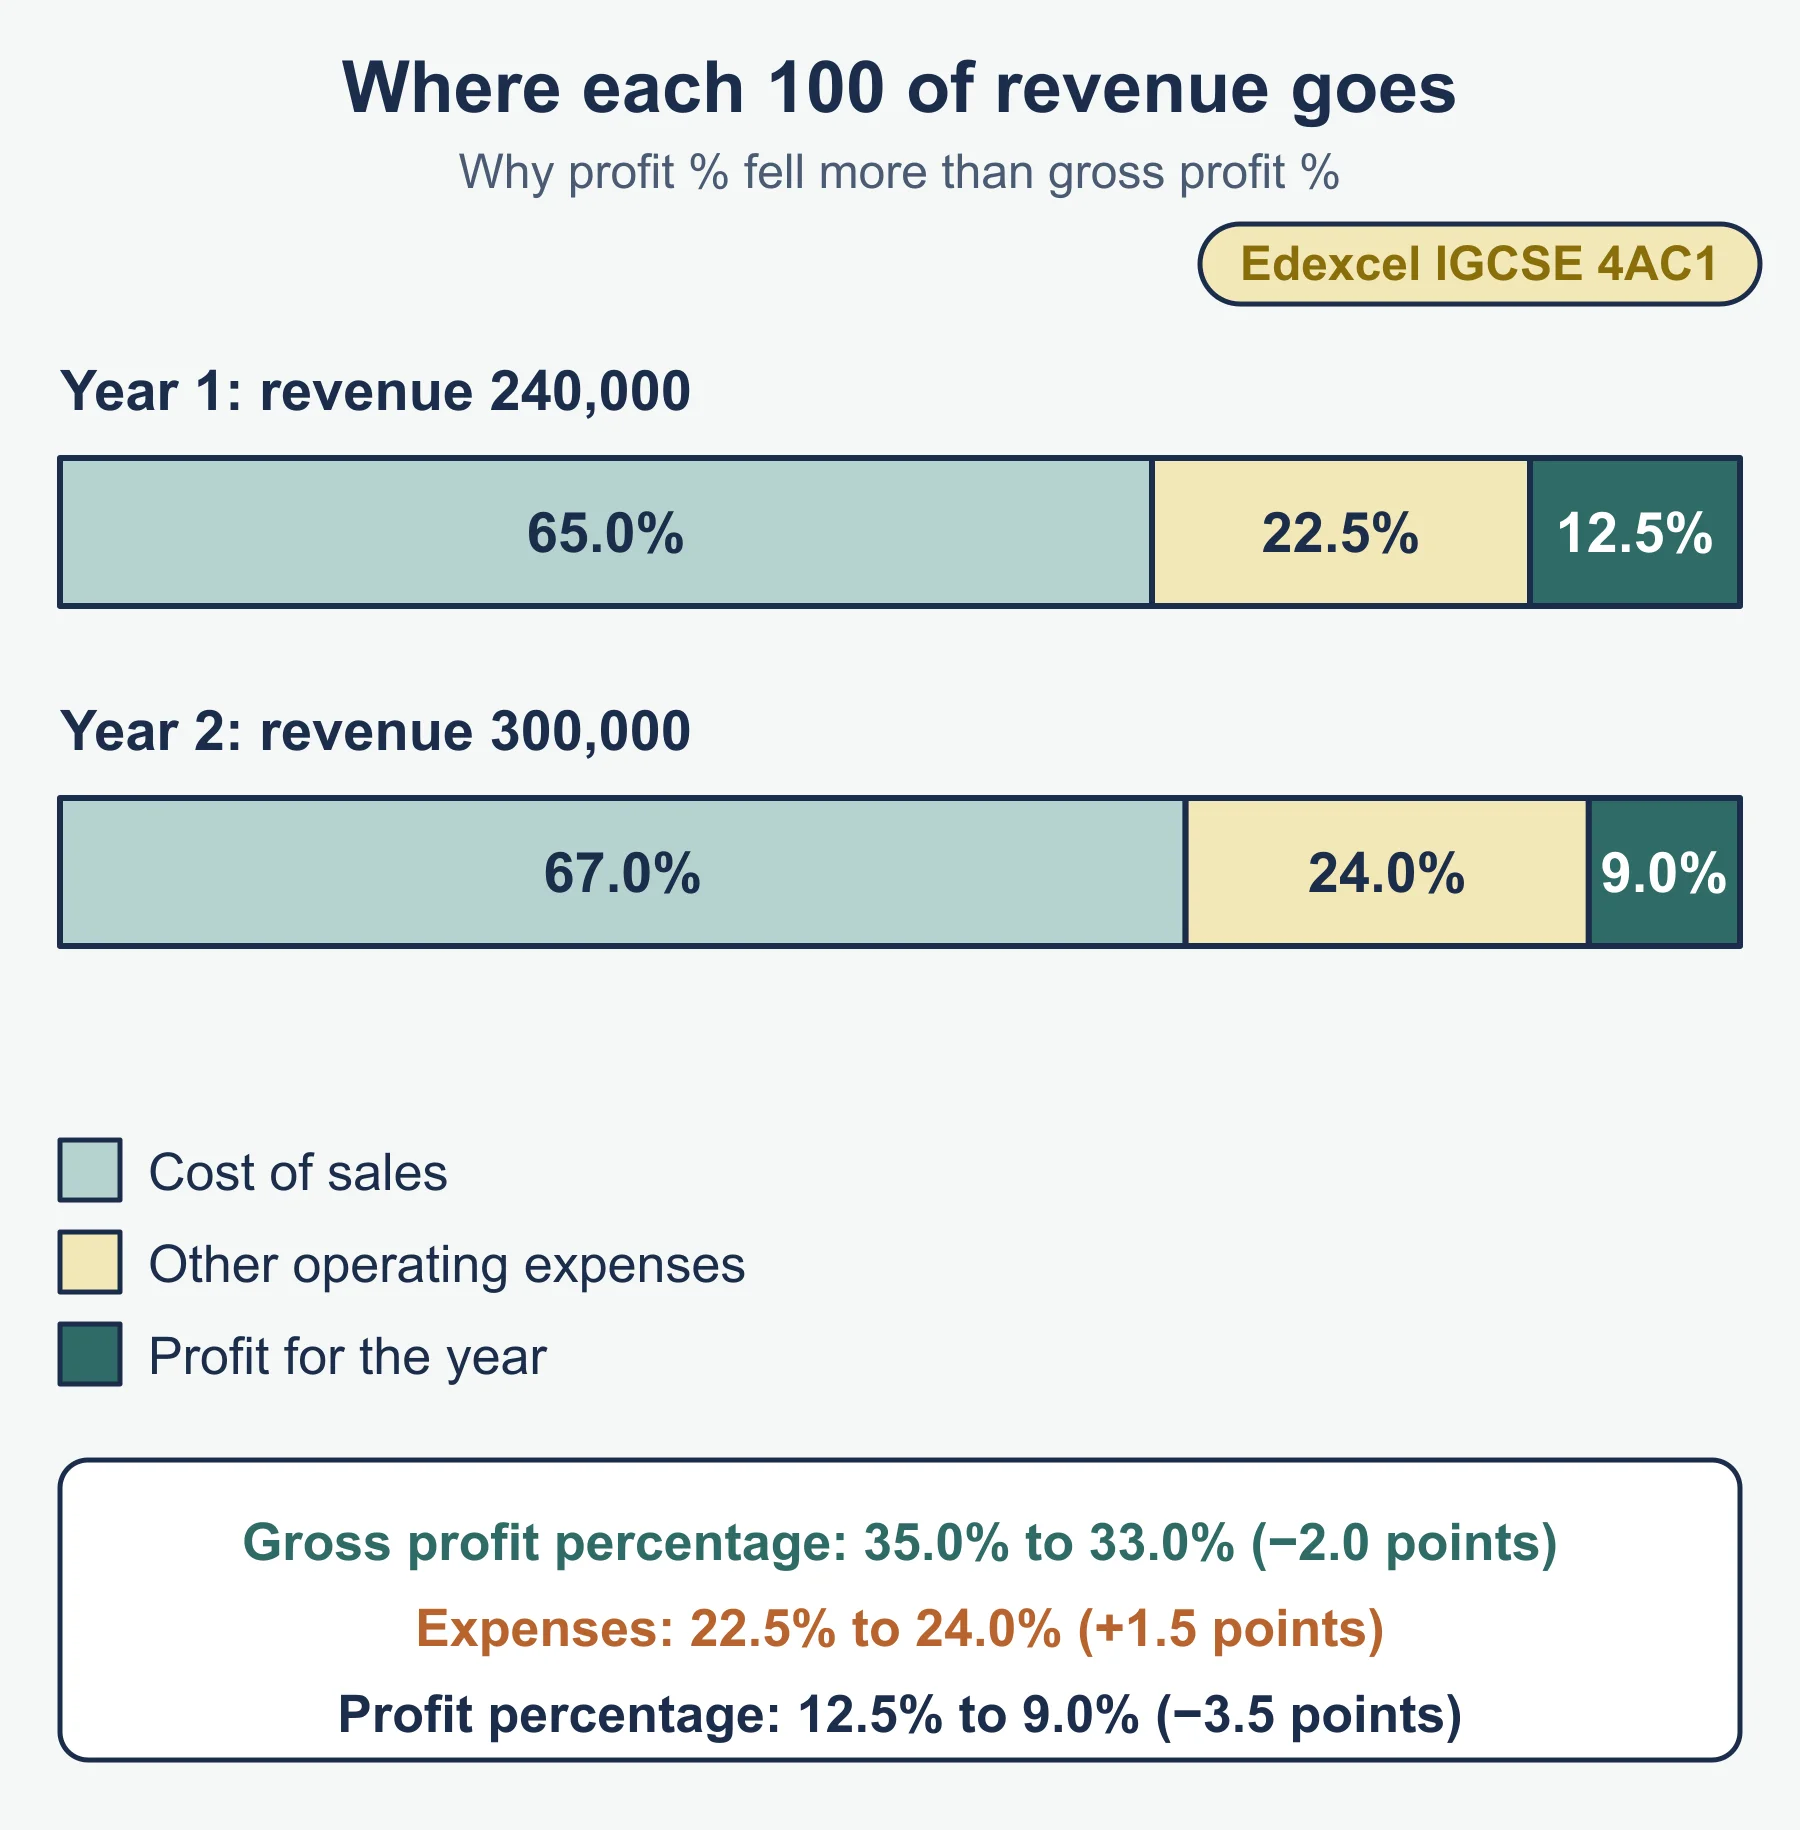
- Revenue rose by 25% (240,000 to 300,000) but gross profit percentage fell from 35.0% to 33.0%. Possible reasons: lower selling prices or discounts to win sales, or higher prices paid to suppliers.
- Profit for the year fell in dollars (30,000 to 27,000) even though revenue rose. The profit percentage fell by 3.5 points, more than the gross margin did. Check the expenses: they were 22.5% of revenue in Year 1 and 24.0% in Year 2, so expenses grew faster than sales.
- ROCE fell from 15.0% to 11.74%. Capital employed rose by 30,000 while profit fell, so each dollar invested earned less. The owner could compare 11.74% with what the same money might earn elsewhere.
Liquidity for Vossberg Garden Centre
- The current ratio fell from 1.88 : 1 to 1.26 : 1. Current liabilities rose from 32,000 to 65,000 while current assets rose by less.
- The acid test fell from 0.94 : 1 to 0.52 : 1. Liquid assets of 34,000 now cover only about half of the 65,000 due soon.
- Inventory rose from 30,000 to 48,000 and the bank balance fell from 12,000 to 4,000. The business may have used credit from suppliers to fund more inventory.
- Overall: Year 2 shows higher revenue but lower profitability and weaker liquidity. The owner should control expenses, review pricing and reduce the inventory held.
Useful comparisons are with the previous year, with a target, or with a similar business. Be careful when comparing businesses of different types, as their normal ratios differ.
6. Common errors
- Using revenue as the base for ROCE, or capital employed as the base for the profit percentages.
- Taking gross profit instead of profit for the year in ROCE or in the second percentage.
- Leaving inventory in the acid test, or taking out trade receivables too.
- Adding non-current liabilities into current liabilities.
- Writing the liquidity ratios as percentages.
- Describing a change (“it went up”) without a reason or consequence.
- Saying a high profit means good liquidity, which confuses the two ideas in 4.4 (a).
Next steps
Condense the formulas with the revision notes, then test yourself on the practice questions. Return to the 4AC1 Accounting hub or tick off progress on the checklist. Find weak spots with the free diagnostics.
Frequently asked questions
What is the difference between profitability and liquidity in Edexcel IGCSE Accounting? Profitability is about whether a business earns a profit and how big it is compared with revenue or the money invested. Liquidity is about whether it can pay what it owes in the short term, so a profitable business can still be short of cash.
What are the five accounting ratios in the 4AC1 specification? The five ratios are gross profit as a percentage of revenue, profit for the year as a percentage of revenue, return on capital employed, the current ratio and the liquid (acid test) ratio. The specification sets no benchmark figures for any of them.
How do you calculate capital employed? The specification does not give a formula, so state yours; the usual one is equity plus non-current liabilities. The same figure comes from non-current assets plus current assets minus current liabilities, which gives a useful check.
How should liquidity ratios be written? Write the current ratio and acid test ratio in the form x : 1, to 2 decimal places, not as percentages. Profitability ratios are shown as percentages with the % sign.
How do you interpret an accounting ratio? Say what the ratio did, give a possible reason, link it to the other ratios and state the consequence for the business. Describing a change without a reason or consequence earns little credit.
Official syllabus
Pearson Edexcel International GCSE in Accounting (4AC1), Specification, Issue 1, October 2016, published by Pearson Education Limited. Topic 4: The preparation of financial statements, section 4 “The calculation and interpretation of accounting ratios”, points (a) to (c).
Get free revision emails (optional)
Occasional emails with practice questions, worked explanations and links to free resources for the qualification and subjects you choose. No spam, and you can unsubscribe from any email. The free tools on this site never need an email.
Related resources
-
Practice questions
Edexcel IGCSE Accounting: Accounting ratios (4AC1) – Practice Questions
Original practice questions with worked answers on profitability and liquidity ratios for Edexcel IGCSE Accounting (4AC1), Topic 4 section 4.4.
Accounting · Pearson Edexcel · IGCSE
Try questions -
Revision notes
Edexcel IGCSE Accounting: Accounting ratios (4AC1) – Revision Notes
Condensed Edexcel IGCSE Accounting revision notes on the five ratios, profitability versus liquidity, interpretation phrases and a self-test.
Accounting · Pearson Edexcel · IGCSE
Revise topic -
Study guides
Edexcel IGCSE Accounting: Financial statements of a manufacturer (4AC1)
Study guide to the manufacturing account for Edexcel International GCSE Accounting 4AC1: three inventories, prime cost, production cost, total cost.
Accounting · Pearson Edexcel · IGCSE
Read guide
Related articles
-
teaching
A Level tuition in Dubai: Cambridge or Pearson Edexcel International A Level?
Schools in Dubai and Abu Dhabi teach either Cambridge International AS & A Level or Pearson Edexcel International A Level. How the two are structured, why it matters for tuition, and how online classes from Lahore work.
9 October 2026
-
curriculum guides
Choosing subjects at IGCSE and A Level
How subject choices at 14 and 16 affect university options later, and how to keep pathways open without overloading a timetable.
28 July 2026
Studying this with a teacher
Working through Accounting IGCSE?
This page is free and stays free. If you would rather be taught it, Marlbridge runs Accounting classes one-to-one and in small groups of up to 15, online in your own time zone. The first trial class is free. WhatsApp replies within an hour (8am–11pm Pakistan time, every day); email the same day.
Pearson Edexcel Accounting teachers at Marlbridge