
Study Guides
Edexcel IGCSE Business: Costs and break-even analysis (4BS1)
Study guide to costs, profit and break-even charts for Pearson Edexcel International GCSE Business 4BS1, with worked examples and common errors.
- Subject
- Business
- Level
- IGCSE
- Topic
- Business finance
- Author
- Marlbridge Academic Team
- Updated
- Reviewed by
- Asif Iqbal (what this means)
Aligned to Pearson Edexcel IGCSE Business (4BS1), Issue 2, February 2026. Official specification .
Syllabus page (what it covers and how it is assessed): Pearson Edexcel IGCSE Business.
Syllabus points this page covers
4BS1
- 3 Business finance (whole topic)
- 3.3 Costs and break-even analysis
Found an error? Report a correction.
Want a teacher for this? Marlbridge teaches Business online. Request a free trial class.
This guide teaches section 3.3 Costs and break-even analysis of the Pearson Edexcel International GCSE in Business (4BS1) specification, Issue 2, February 2026. It sits in Topic 3, Business finance. The specification has two papers, each lasting 1 hour 30 minutes and worth 80 marks, and each has four compulsory 20-mark questions. Paper 1 is set around a small business (up to 49 employees) and Paper 2 around a large business (more than 250 employees). Both can draw on the whole content, so expect this topic in either. All money amounts below are in pounds and every business is invented.
Course links: Edexcel IGCSE Business hub, the printable checklist and the free 10-minute diagnostics. Companion pages: the revision notes and the practice questions.
What 3.3 asks you to do
| Ref | You must be able to | Where in this guide |
|---|---|---|
| 3.3.1 | Explain and calculate revenue, fixed and variable costs, total costs, and profit and loss | Part 1 |
| 3.3.2 | Explain break-even and calculate the break-even level of output, from a formula or from a diagram | Parts 2 and 3 |
| 3.3.3 | Interpret break-even charts: the impact of changes in revenue and costs, and the limitations of break-even charts | Parts 4 and 5 |
The specification’s quantitative skills list includes revenue, costs and profit, and information from graphs and charts, and it says calculators may be used. Show your workings: the command word Calculate asks for them.
Part 1: revenue, costs and profit (3.3.1)
Revenue is the income a business earns from the sales of what it makes or provides. Revenue = selling price per unit × quantity sold.
Fixed costs do not change when output changes, at least over the short run. Rent, insurance and a manager’s salary are typical. They are still paid in a month when nothing is made.
Variable costs change in direct proportion to output. Raw materials and packaging are typical. Double the output and the total variable cost doubles. Be careful with two figures: variable cost per unit stays the same, but total variable cost rises with output.
Total costs = fixed costs + total variable costs.
Profit = revenue − total costs. If the answer is negative, the business has made a loss. If revenue equals total costs, profit is zero.
Worked example 1: Sana’s Soap Studio
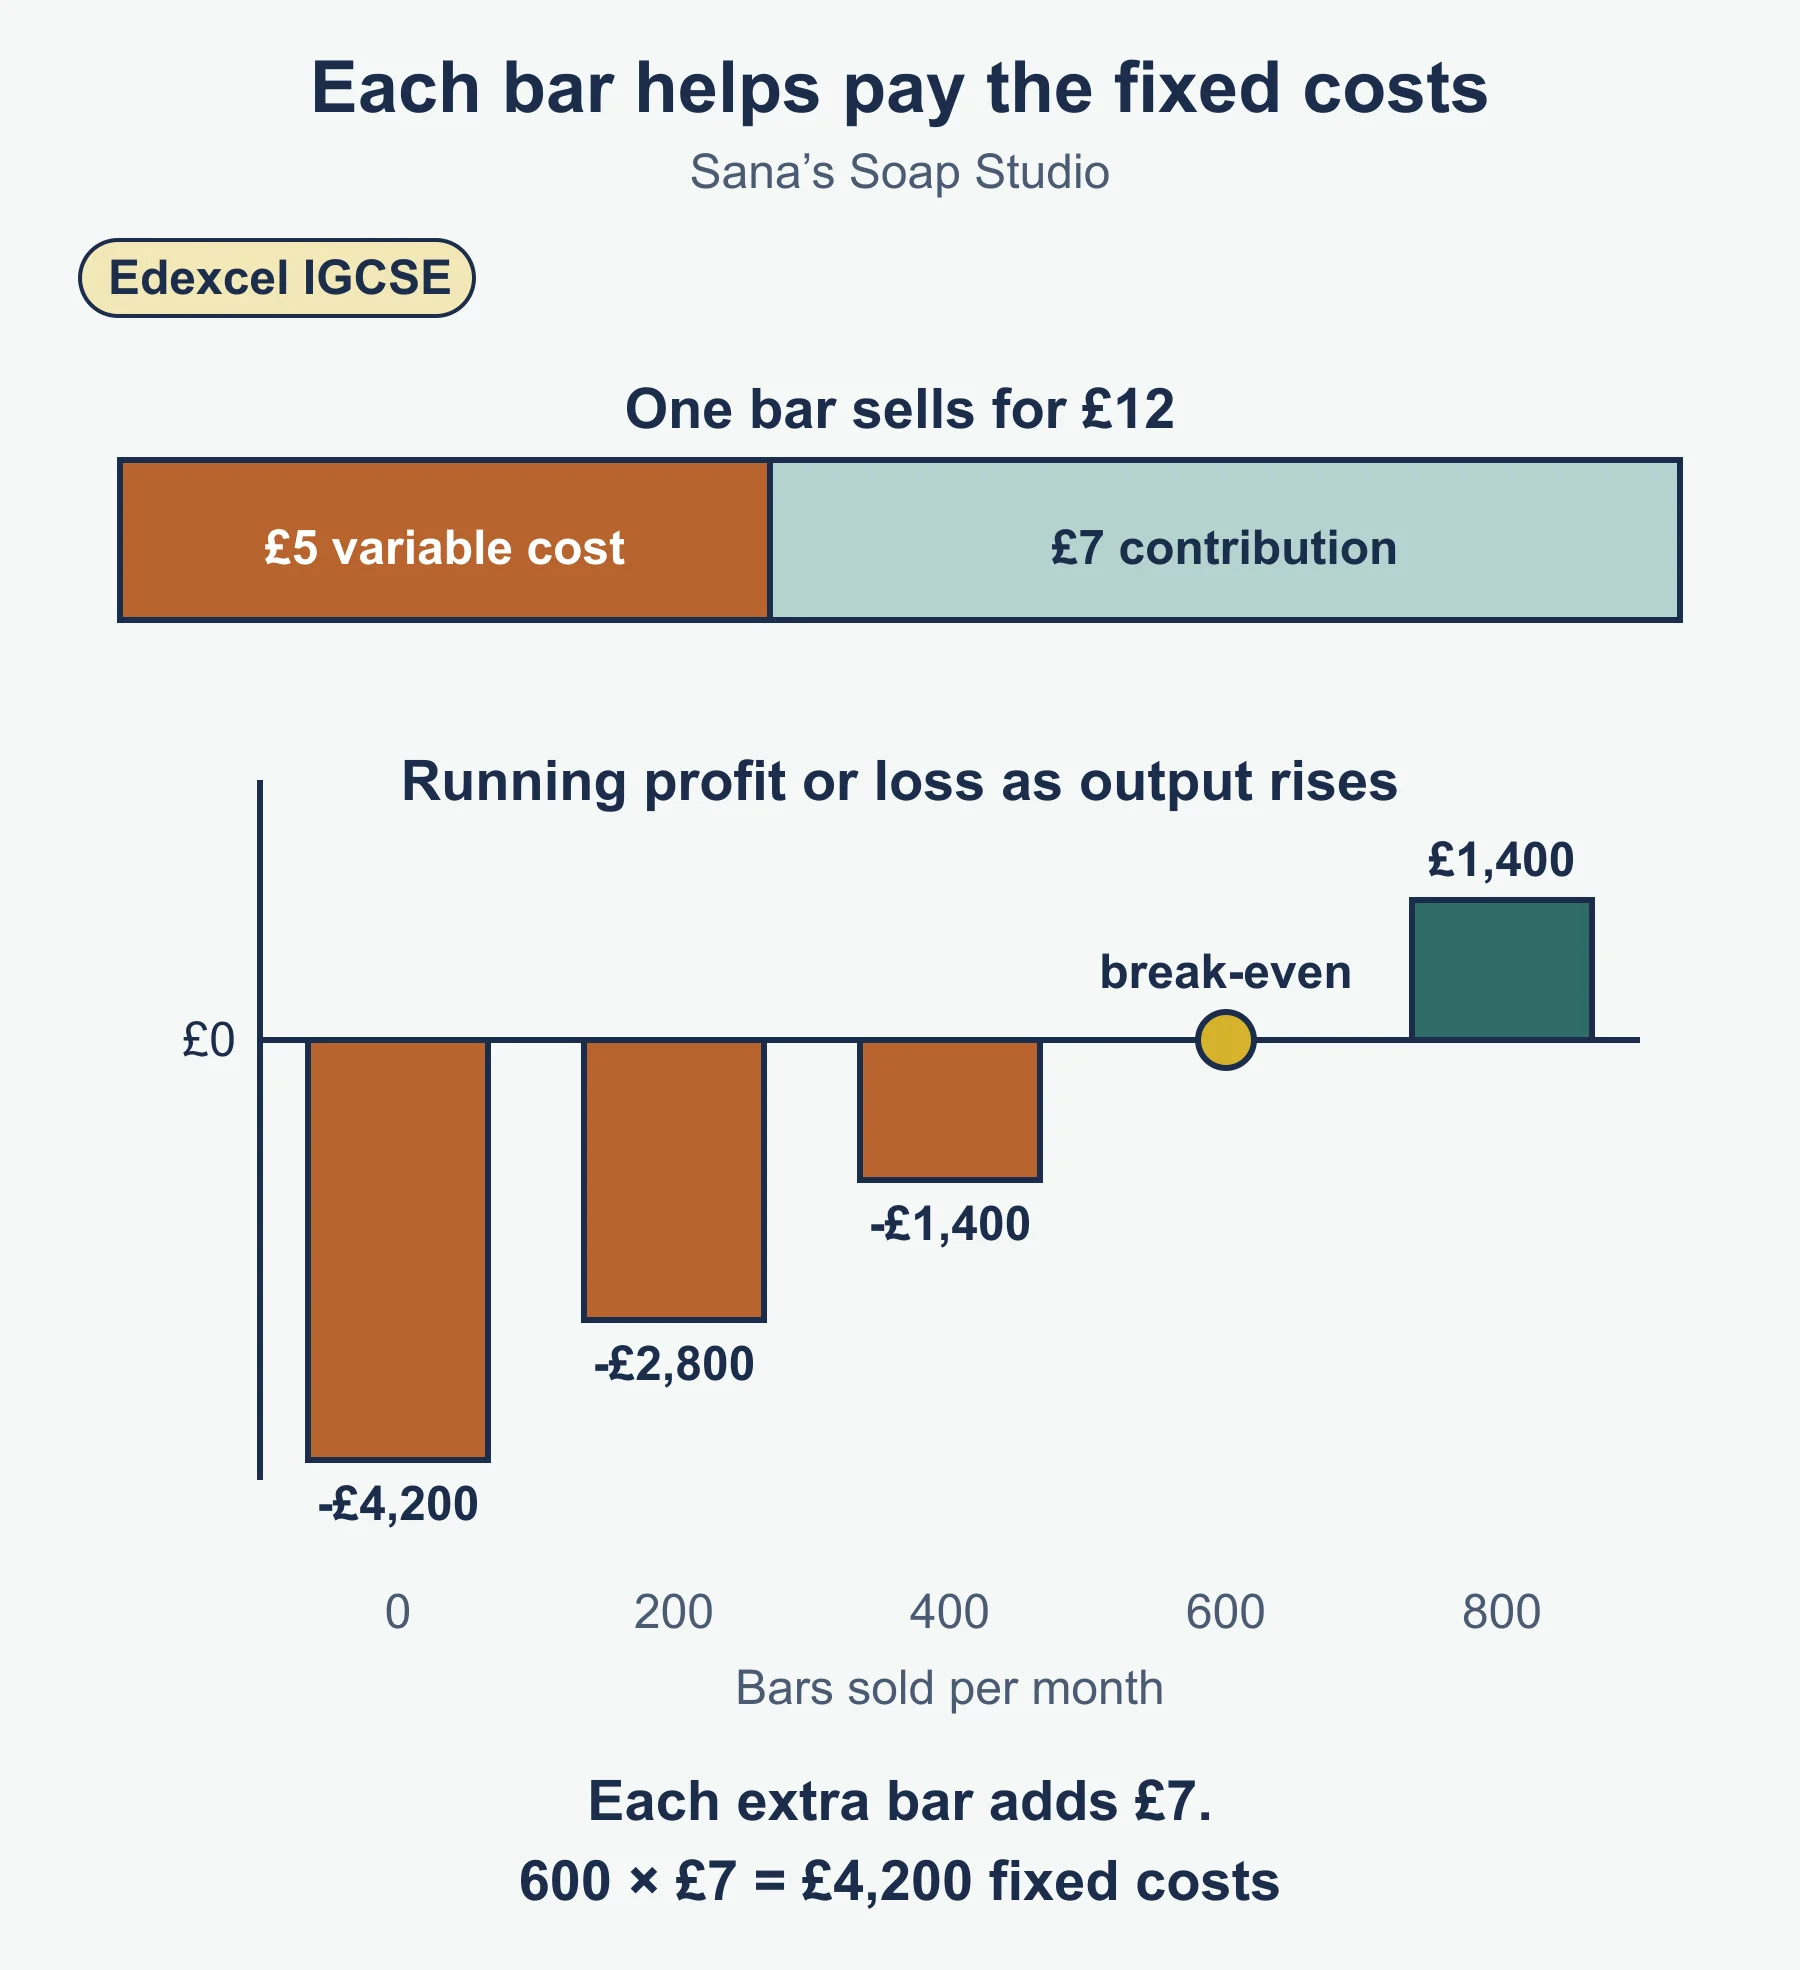
Sana sells handmade soap at £12 a bar. Variable cost is £5 a bar. Fixed costs are £4,200 a month.
| Bars | Revenue (£) | Total variable cost (£) | Fixed costs (£) | Total costs (£) | Profit or loss (£) |
|---|---|---|---|---|---|
| 0 | 0 | 0 | 4,200 | 4,200 | -4,200 |
| 200 | 2,400 | 1,000 | 4,200 | 5,200 | -2,800 |
| 400 | 4,800 | 2,000 | 4,200 | 6,200 | -1,400 |
| 600 | 7,200 | 3,000 | 4,200 | 7,200 | 0 |
| 800 | 9,600 | 4,000 | 4,200 | 8,200 | 1,400 |
Step through the 800-bar row: revenue = 12 × 800 = 9,600. Total variable cost = 5 × 800 = 4,000. Total costs = 4,200 + 4,000 = 8,200. Profit = 9,600 − 8,200 = 1,400.
Now 450 bars: revenue = 5,400, total variable cost = 2,250, total costs = 6,450, so the result is a loss of 1,050.
Notice the pattern. Each extra bar adds £12 to revenue and £5 to cost, so each bar improves the position by £7. That £7 is the key to the next section.
Part 2: the idea of break-even and the formula (3.3.2)
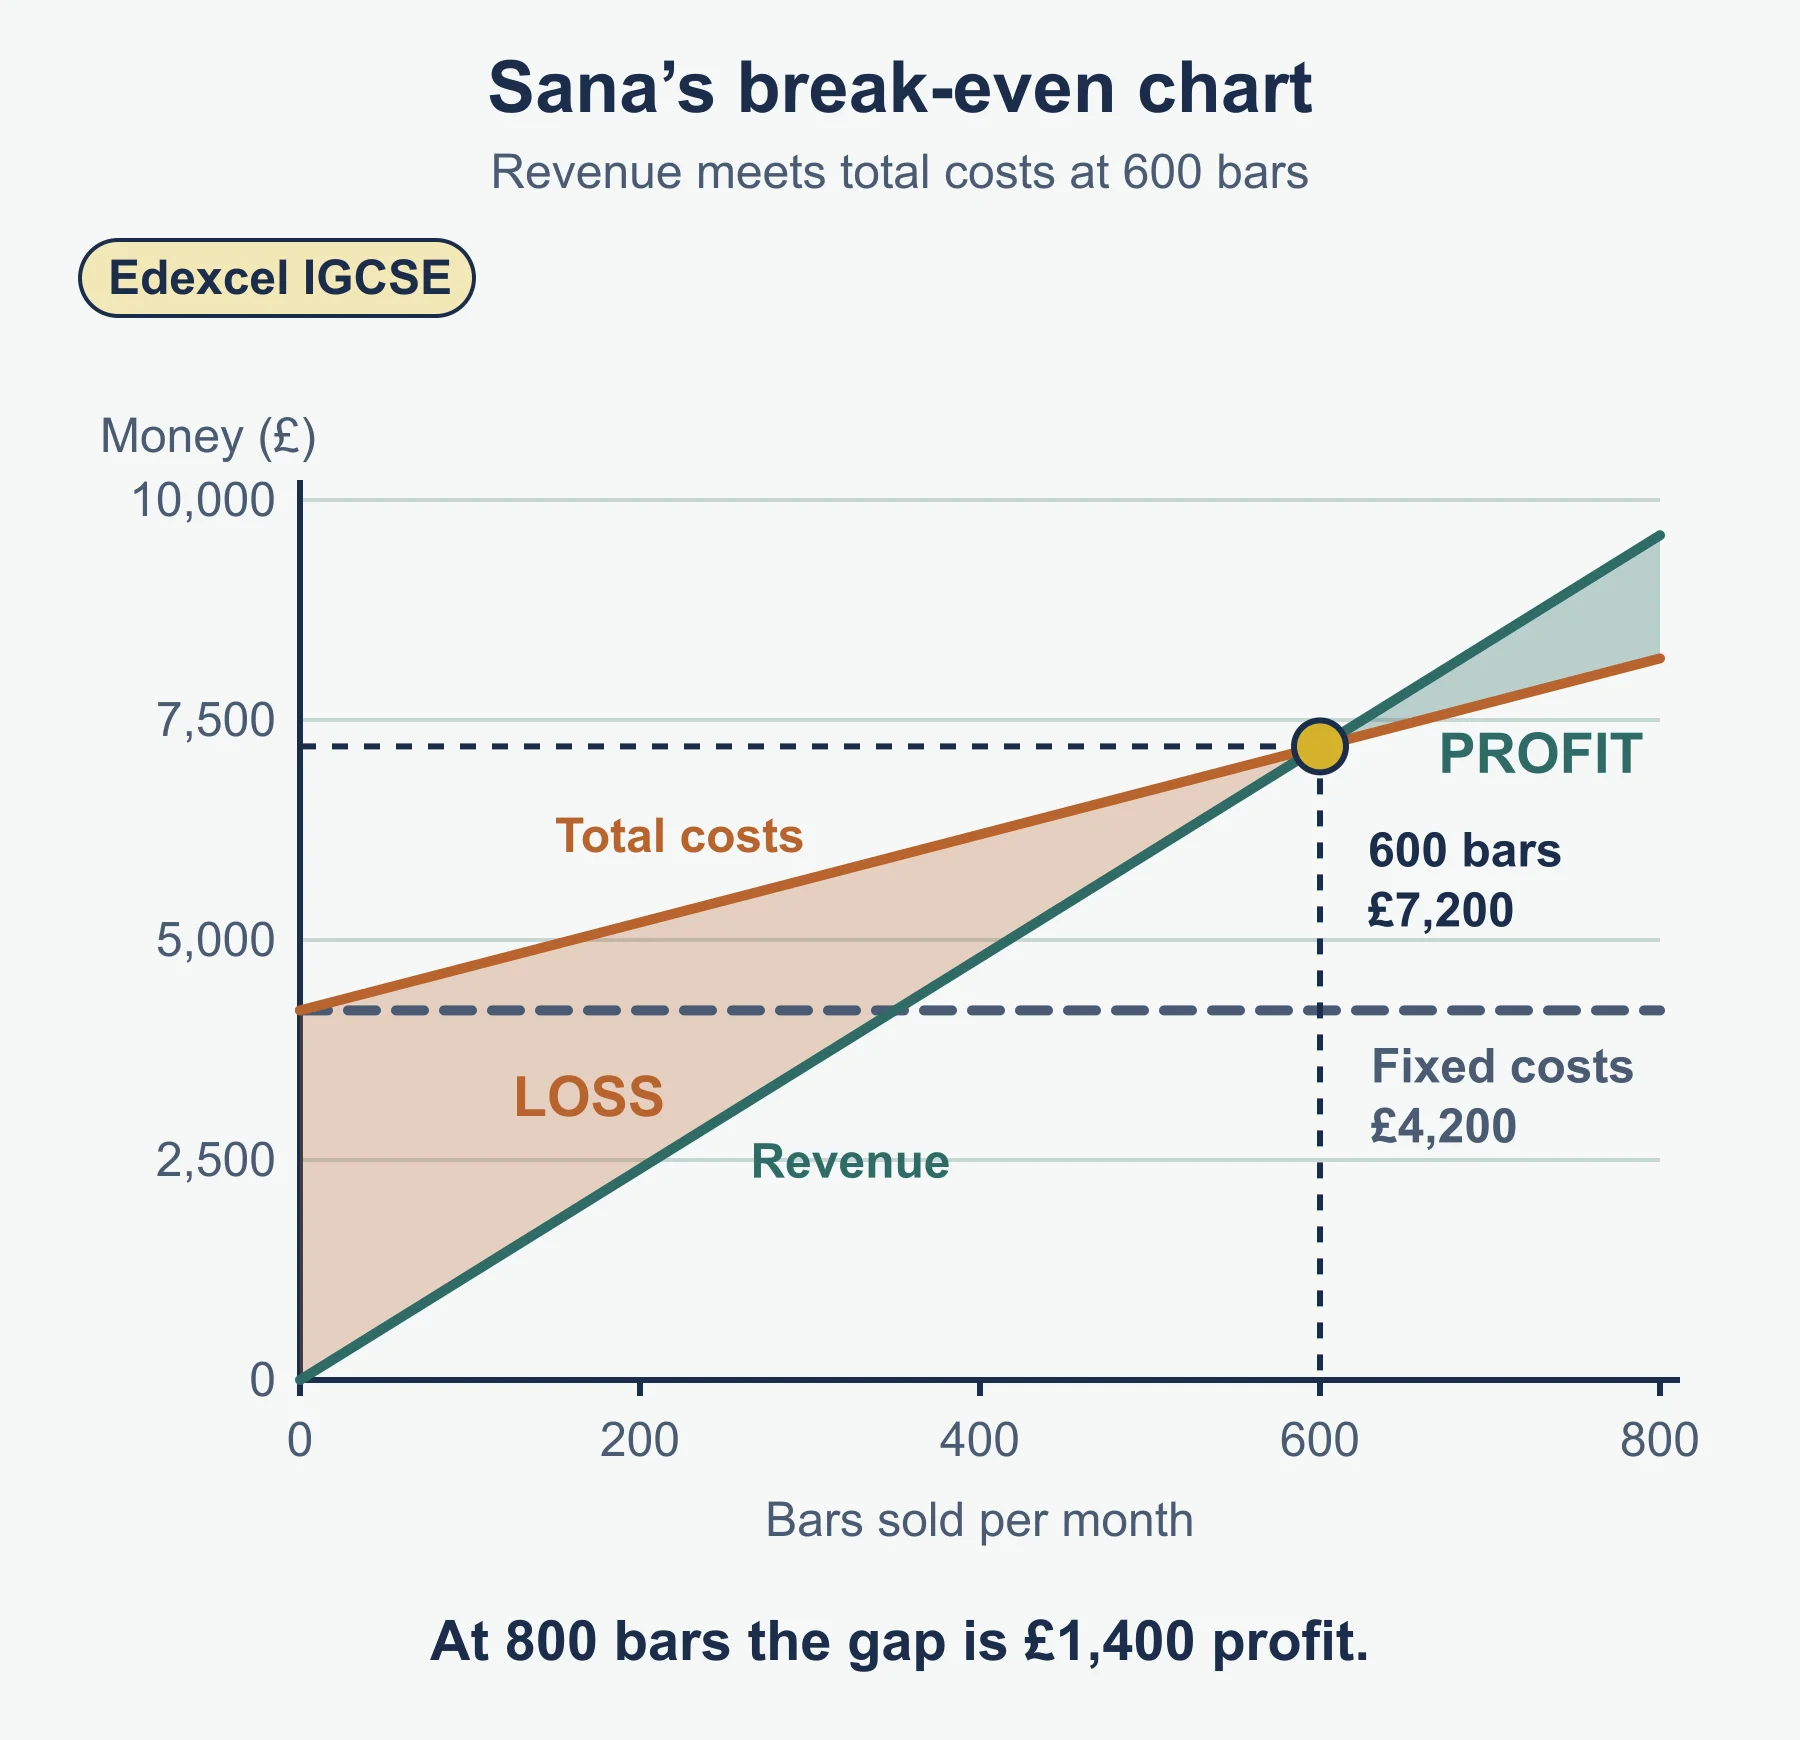
Break-even is the level of output at which revenue equals total costs, so the business makes neither a profit nor a loss. Below that output it makes a loss. Above it, a profit. In Sana’s table it is 600 bars.
Each unit sold covers its own variable cost and then has something left over to put towards fixed costs. That leftover is the contribution per unit:
contribution per unit = selling price per unit − variable cost per unit
The specification does not give a break-even formula (its formulae list does not include one). The standard form, which is not specification text, is:
break-even level of output = fixed costs ÷ contribution per unit
Learn it. Check it on Sana: contribution = 12 − 5 = £7, and 4,200 ÷ 7 = 600 bars. This matches the table.
If the division does not come out whole, round the output up to the next whole unit. This rounding rule is the writer’s own advice, not specification text. At 466 units the business is still just short of covering its costs, so the break-even output is 467.
Once you know break-even output you can find break-even revenue: output × price. For Sana, 600 × 12 = £7,200, which equals total costs at that output.
Worked example 2: a food van
Imran runs a coffee van. A cup sells for £3.50 and costs £1.10 in variable costs. Fixed costs are £2,400 a month.
- Contribution per cup = 3.50 − 1.10 = £2.40.
- Break-even output = 2,400 ÷ 2.40 = 1,000 cups a month.
- If he sells 1,350 cups, the cups above break-even are 350. Each adds £2.40, so profit = 350 × 2.40 = £840.
Check by the long route: revenue = 1,350 × 3.50 = 4,725. Total costs = 2,400 + (1.10 × 1,350) = 3,885. Profit = 4,725 − 3,885 = 840. The two methods agree.
Part 3: break-even charts and reading them (3.3.2, 3.3.3)
On a break-even chart, output runs along the horizontal axis and pounds up the vertical axis. It shows three lines:
- The fixed costs line is horizontal, because fixed costs do not move with output.
- The total costs line starts at the fixed cost figure on the vertical axis (output of zero) and slopes upward. Its slope is the variable cost per unit.
- The revenue line starts at zero and slopes upward more steeply than total costs, as long as price is above variable cost per unit.
The point where the revenue and total costs lines cross is the break-even point. Drop a vertical line to the horizontal axis to read the break-even level of output, and across to the vertical axis to read break-even revenue.
Profit and loss show up as gaps. To the left of the crossing, total costs are above revenue, so the gap is a loss. To the right, revenue is above total costs, so the gap is a profit. At any output, the vertical distance between the two lines is the profit or loss for that output.
Worked example 3: reading a chart
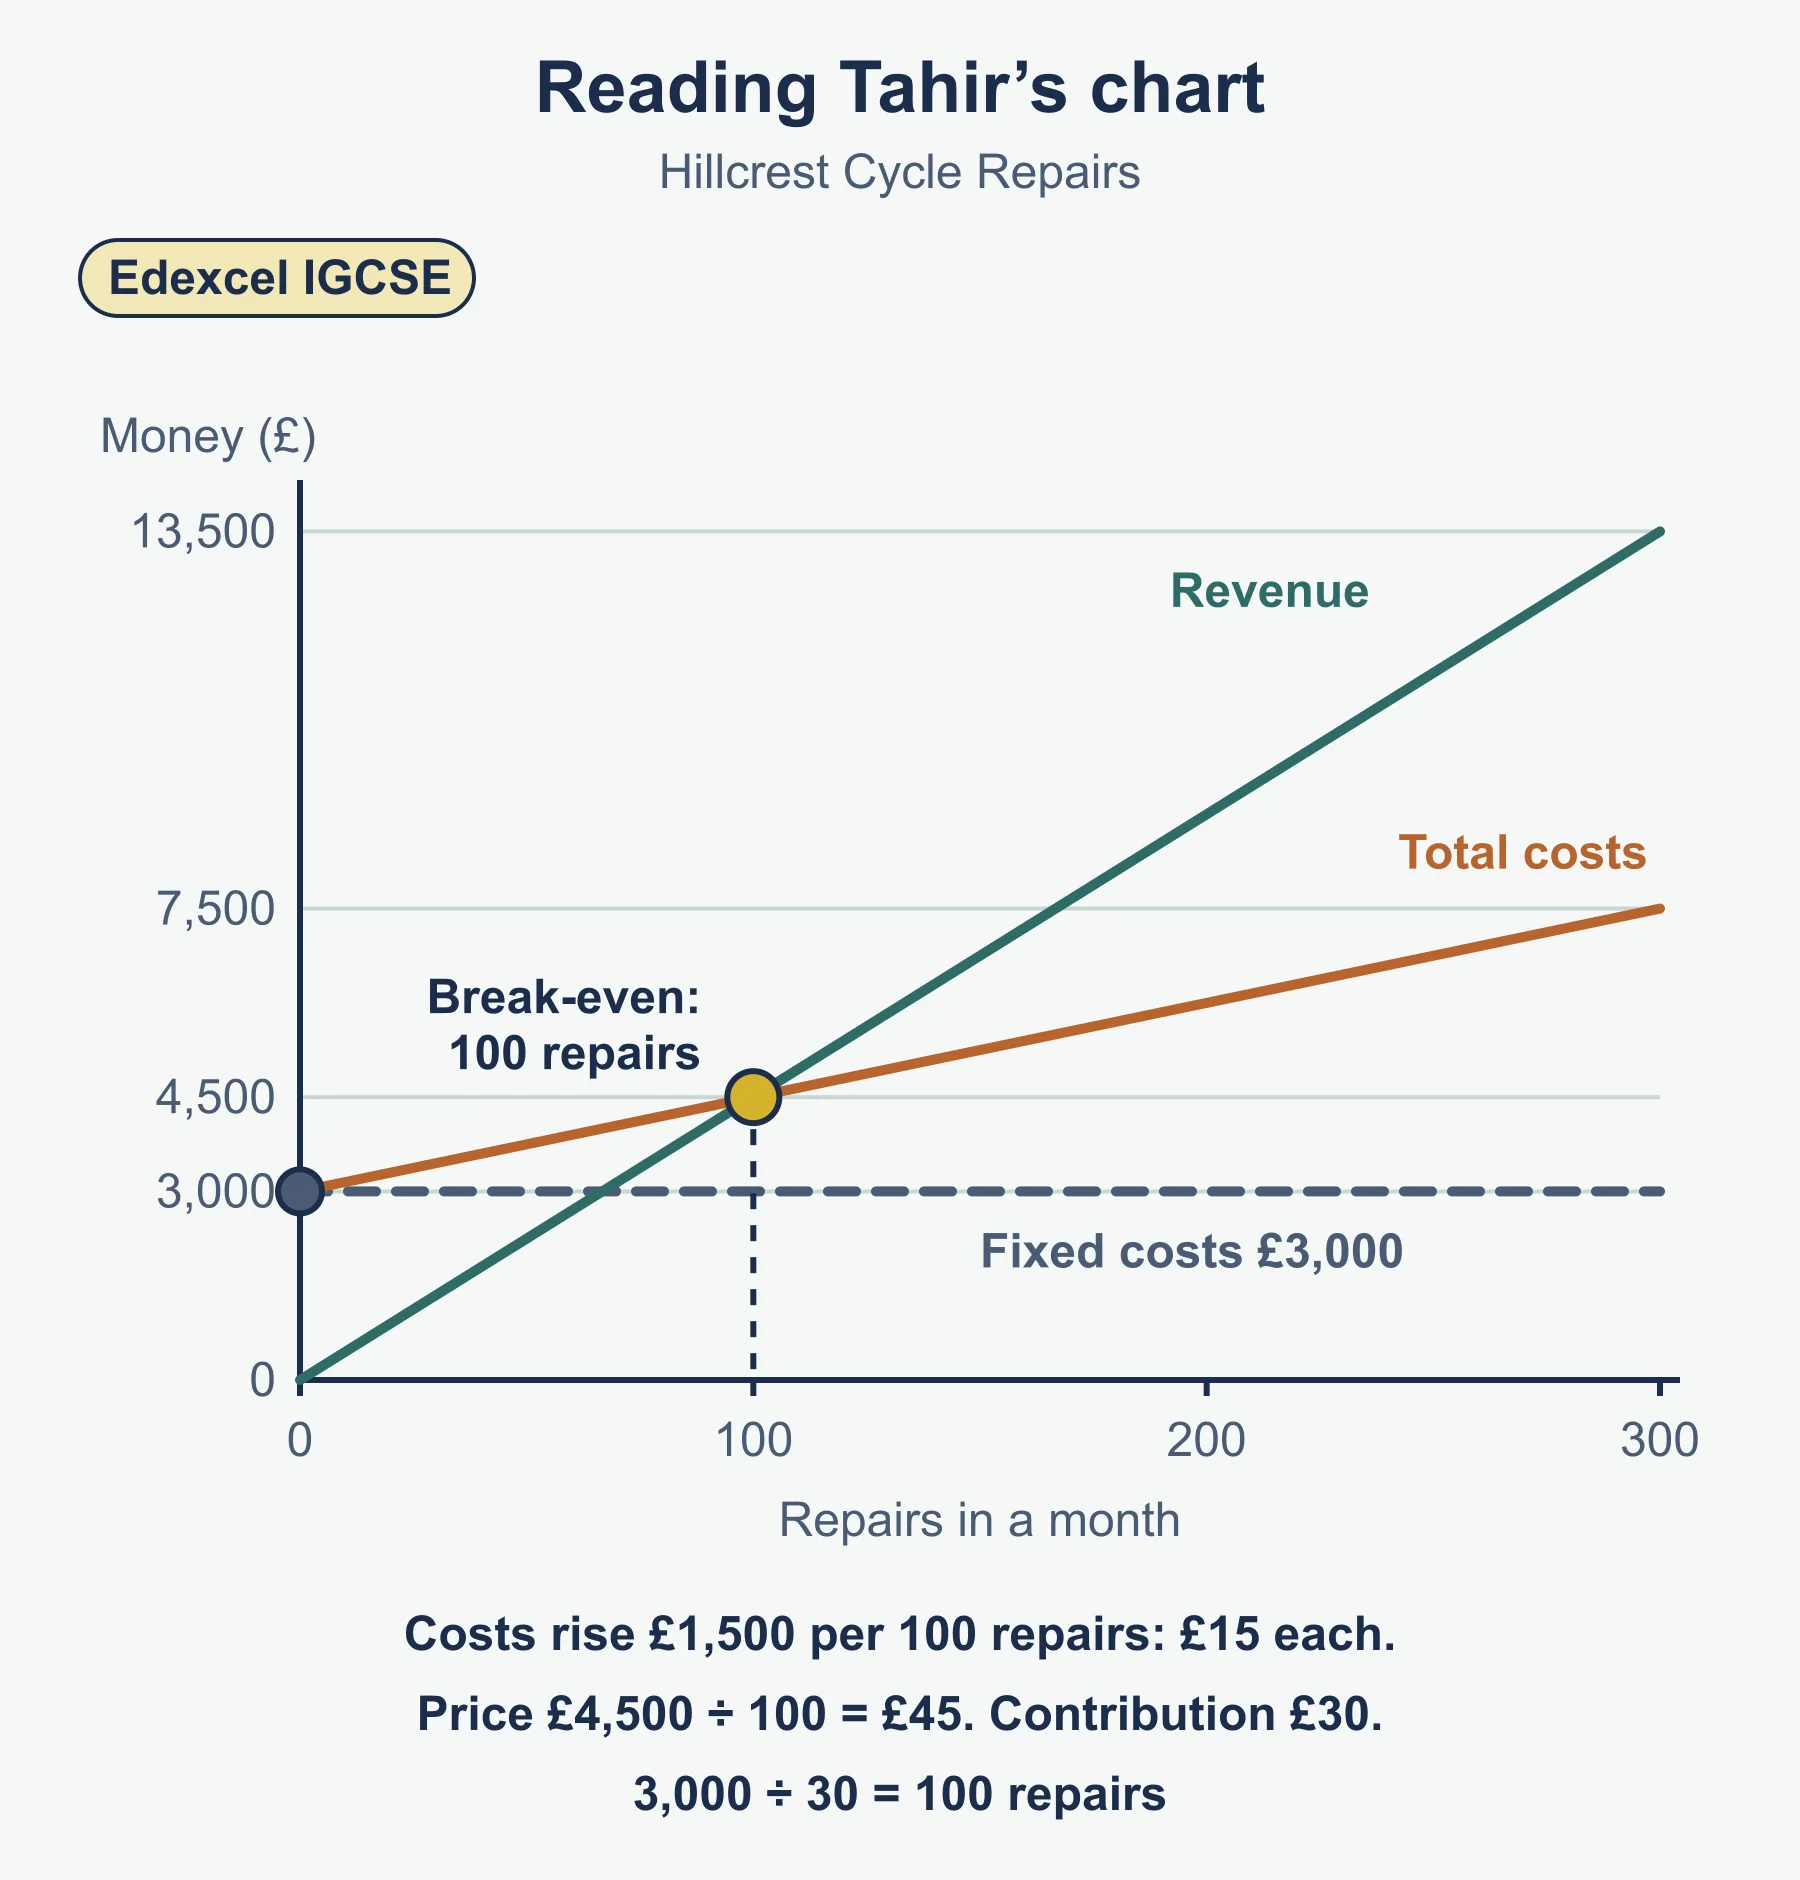
Tahir runs Hillcrest Cycle Repairs. Points taken from his chart:
| Repairs in a month | Revenue (£) | Total costs (£) |
|---|---|---|
| 0 | 0 | 3,000 |
| 100 | 4,500 | 4,500 |
| 200 | 9,000 | 6,000 |
| 300 | 13,500 | 7,500 |
Plot these and you get revenue starting at the origin and total costs starting at 3,000 on the vertical axis, with the two lines meeting at 100 repairs.
- Break-even output. The lines meet where revenue and total costs are both 4,500, at 100 repairs.
- Fixed costs. Total costs at zero output are 3,000, so fixed costs are £3,000.
- Variable cost per repair. Total costs rise by 1,500 for every 100 repairs, so variable cost is £15 a repair. Price is 4,500 ÷ 100 = £45.
- Check with the formula. Contribution = 45 − 15 = £30. 3,000 ÷ 30 = 100 repairs. The chart and formula agree.
- Profit at 260 repairs. Contribution of £30 × 260 = 7,800, less fixed costs of 3,000 = £4,800. At 70 repairs the result is 70 × 30 − 3,000 = a loss of £900.
If a question gives you a blank grid, plot fixed costs, plot total costs at two outputs and join them, then plot revenue at two outputs and join them. Label the axes, each line and the crossing.
Part 4: the impact of changes in revenue and costs (3.3.3)
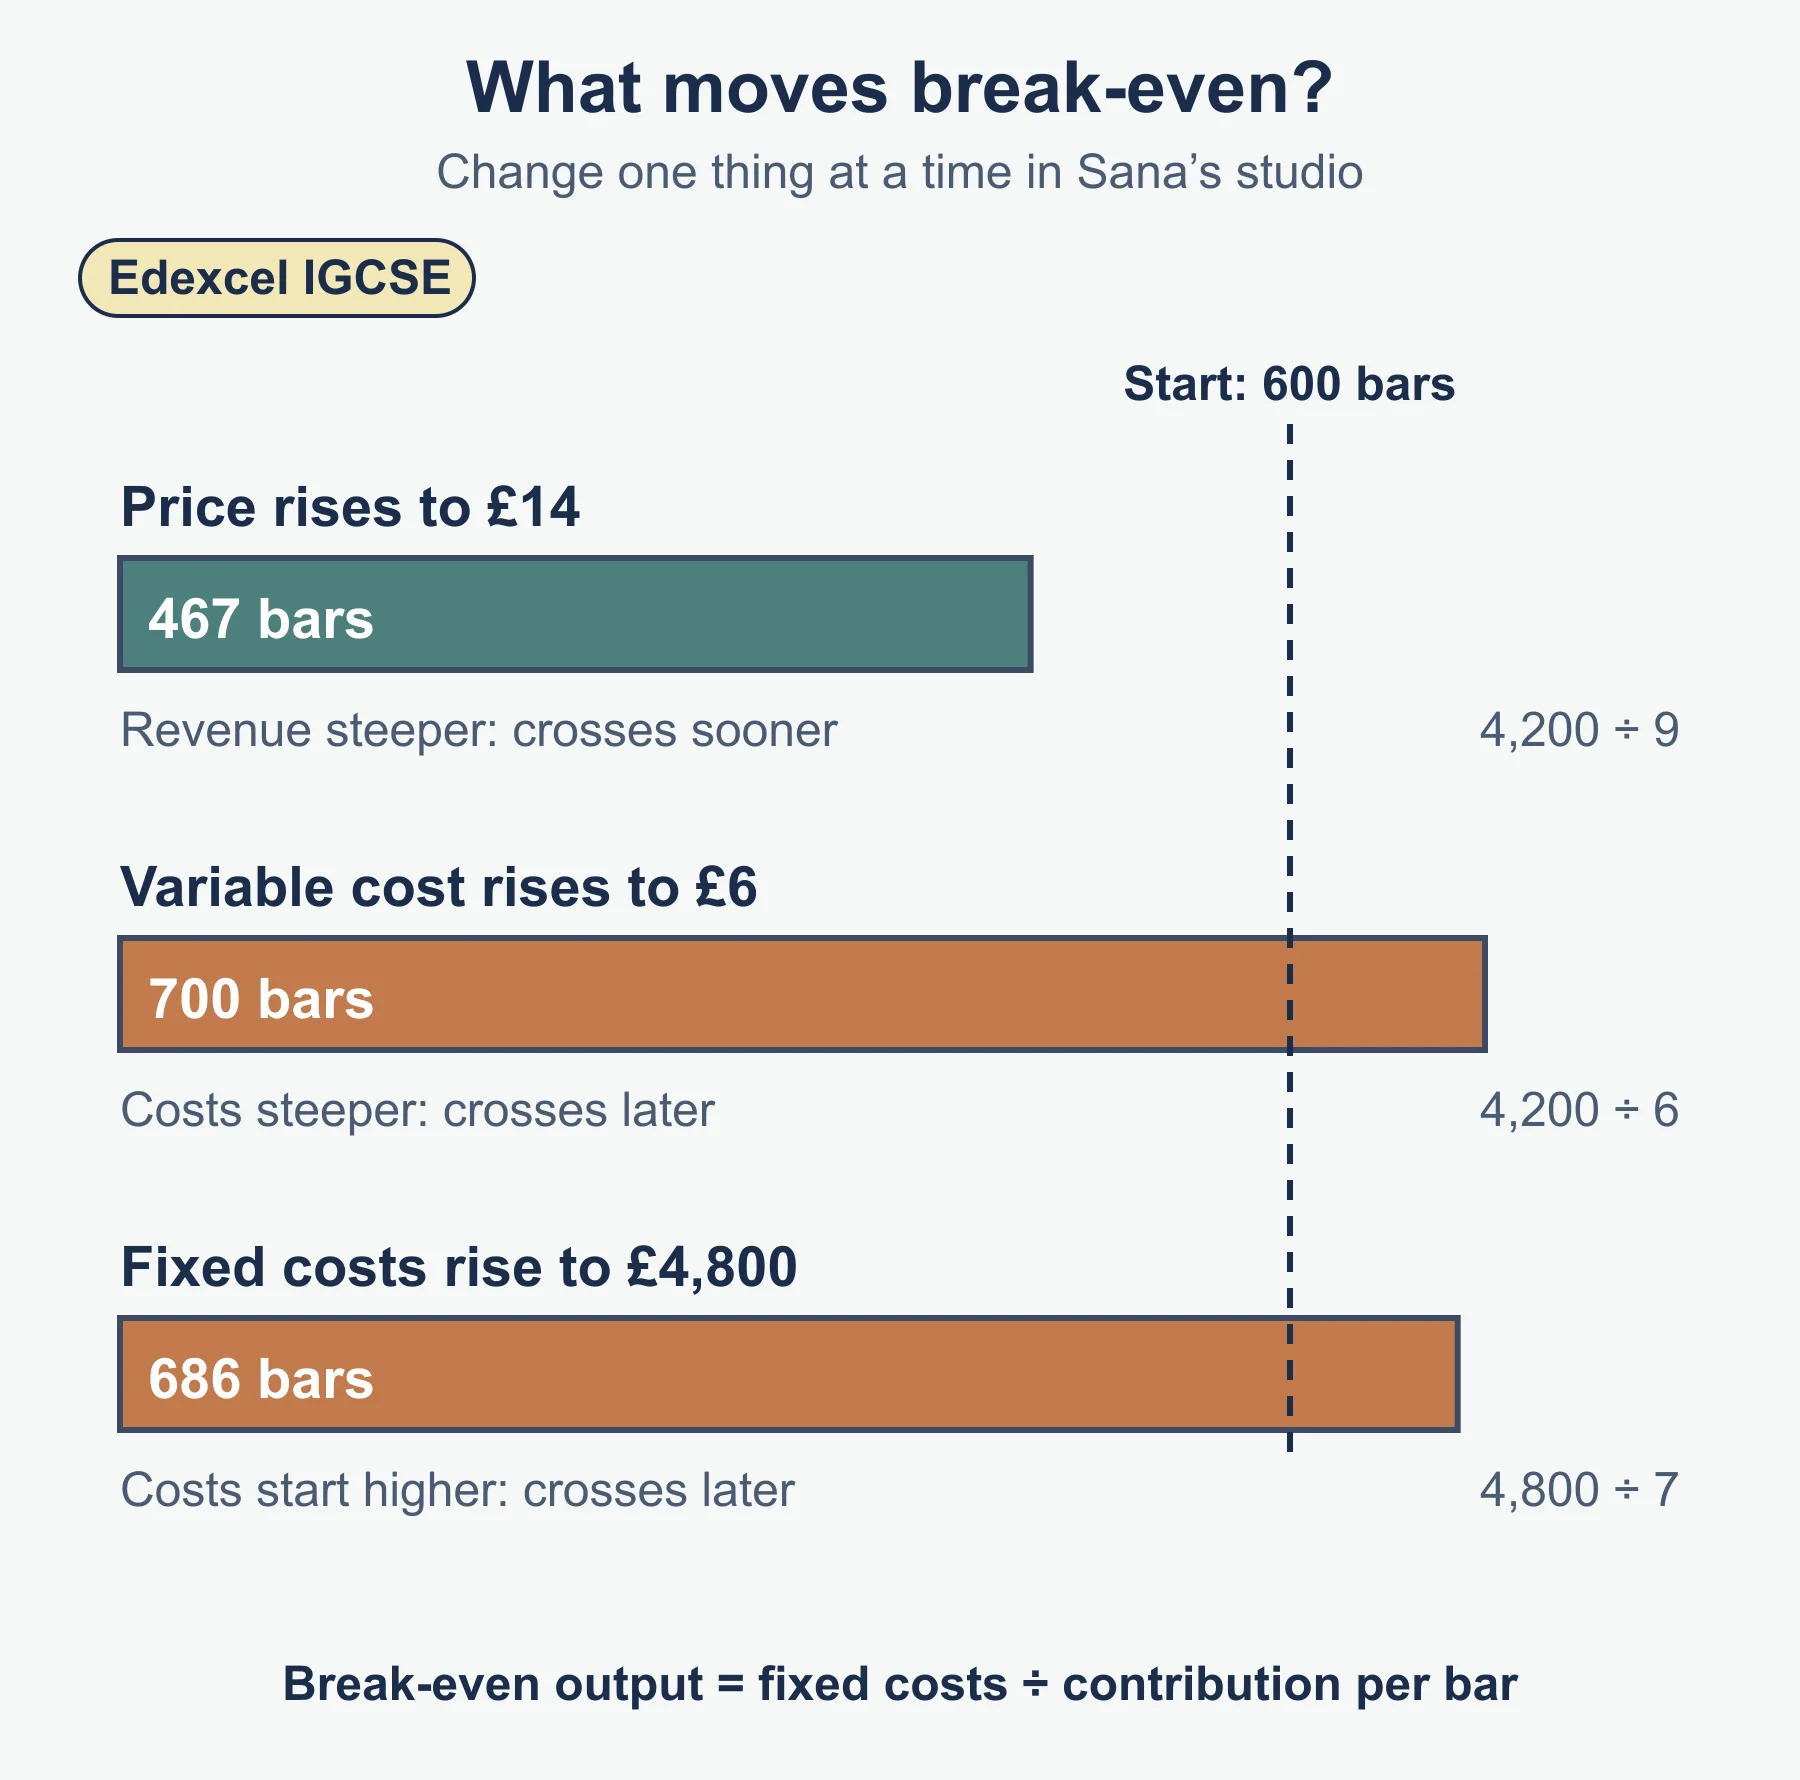
Changes in revenue and costs move the lines on the chart, and so move the break-even point. Take Sana’s studio (price £12, variable cost £5, fixed costs £4,200, break-even 600 bars) and change one thing at a time.
| Change | New contribution | New break-even | What happens on the chart |
|---|---|---|---|
| Price rises to £14 | £9 | 4,200 ÷ 9 = 467 bars | Revenue line is steeper, so it crosses sooner |
| Variable cost rises to £6 | £6 | 4,200 ÷ 6 = 700 bars | Total costs line is steeper, so it crosses later |
| Fixed costs rise to £4,800 | £7 | 4,800 ÷ 7 = 686 bars | Total costs line starts higher, so it crosses later |
Break-even output rises by 100 bars in the second row and by 86 bars in the third. A lower variable cost or lower fixed costs would lower break-even output instead, while a lower price would raise it.
Break-even output is only part of the story. A price rise lowers break-even output but could also lower the number of bars customers buy. At 800 bars, the higher price gives profit of 800 × 9 − 4,200 = £3,000, against £1,400 at the old price. That only holds if she still sells 800 at £14, which is a judgement about customers that the chart does not make for her.
The same method works for a fall in revenue from a different cause, such as a competitor opening nearby. Work out the new sales level and compare it with break-even output.
Part 5: limitations of break-even charts (3.3.3)
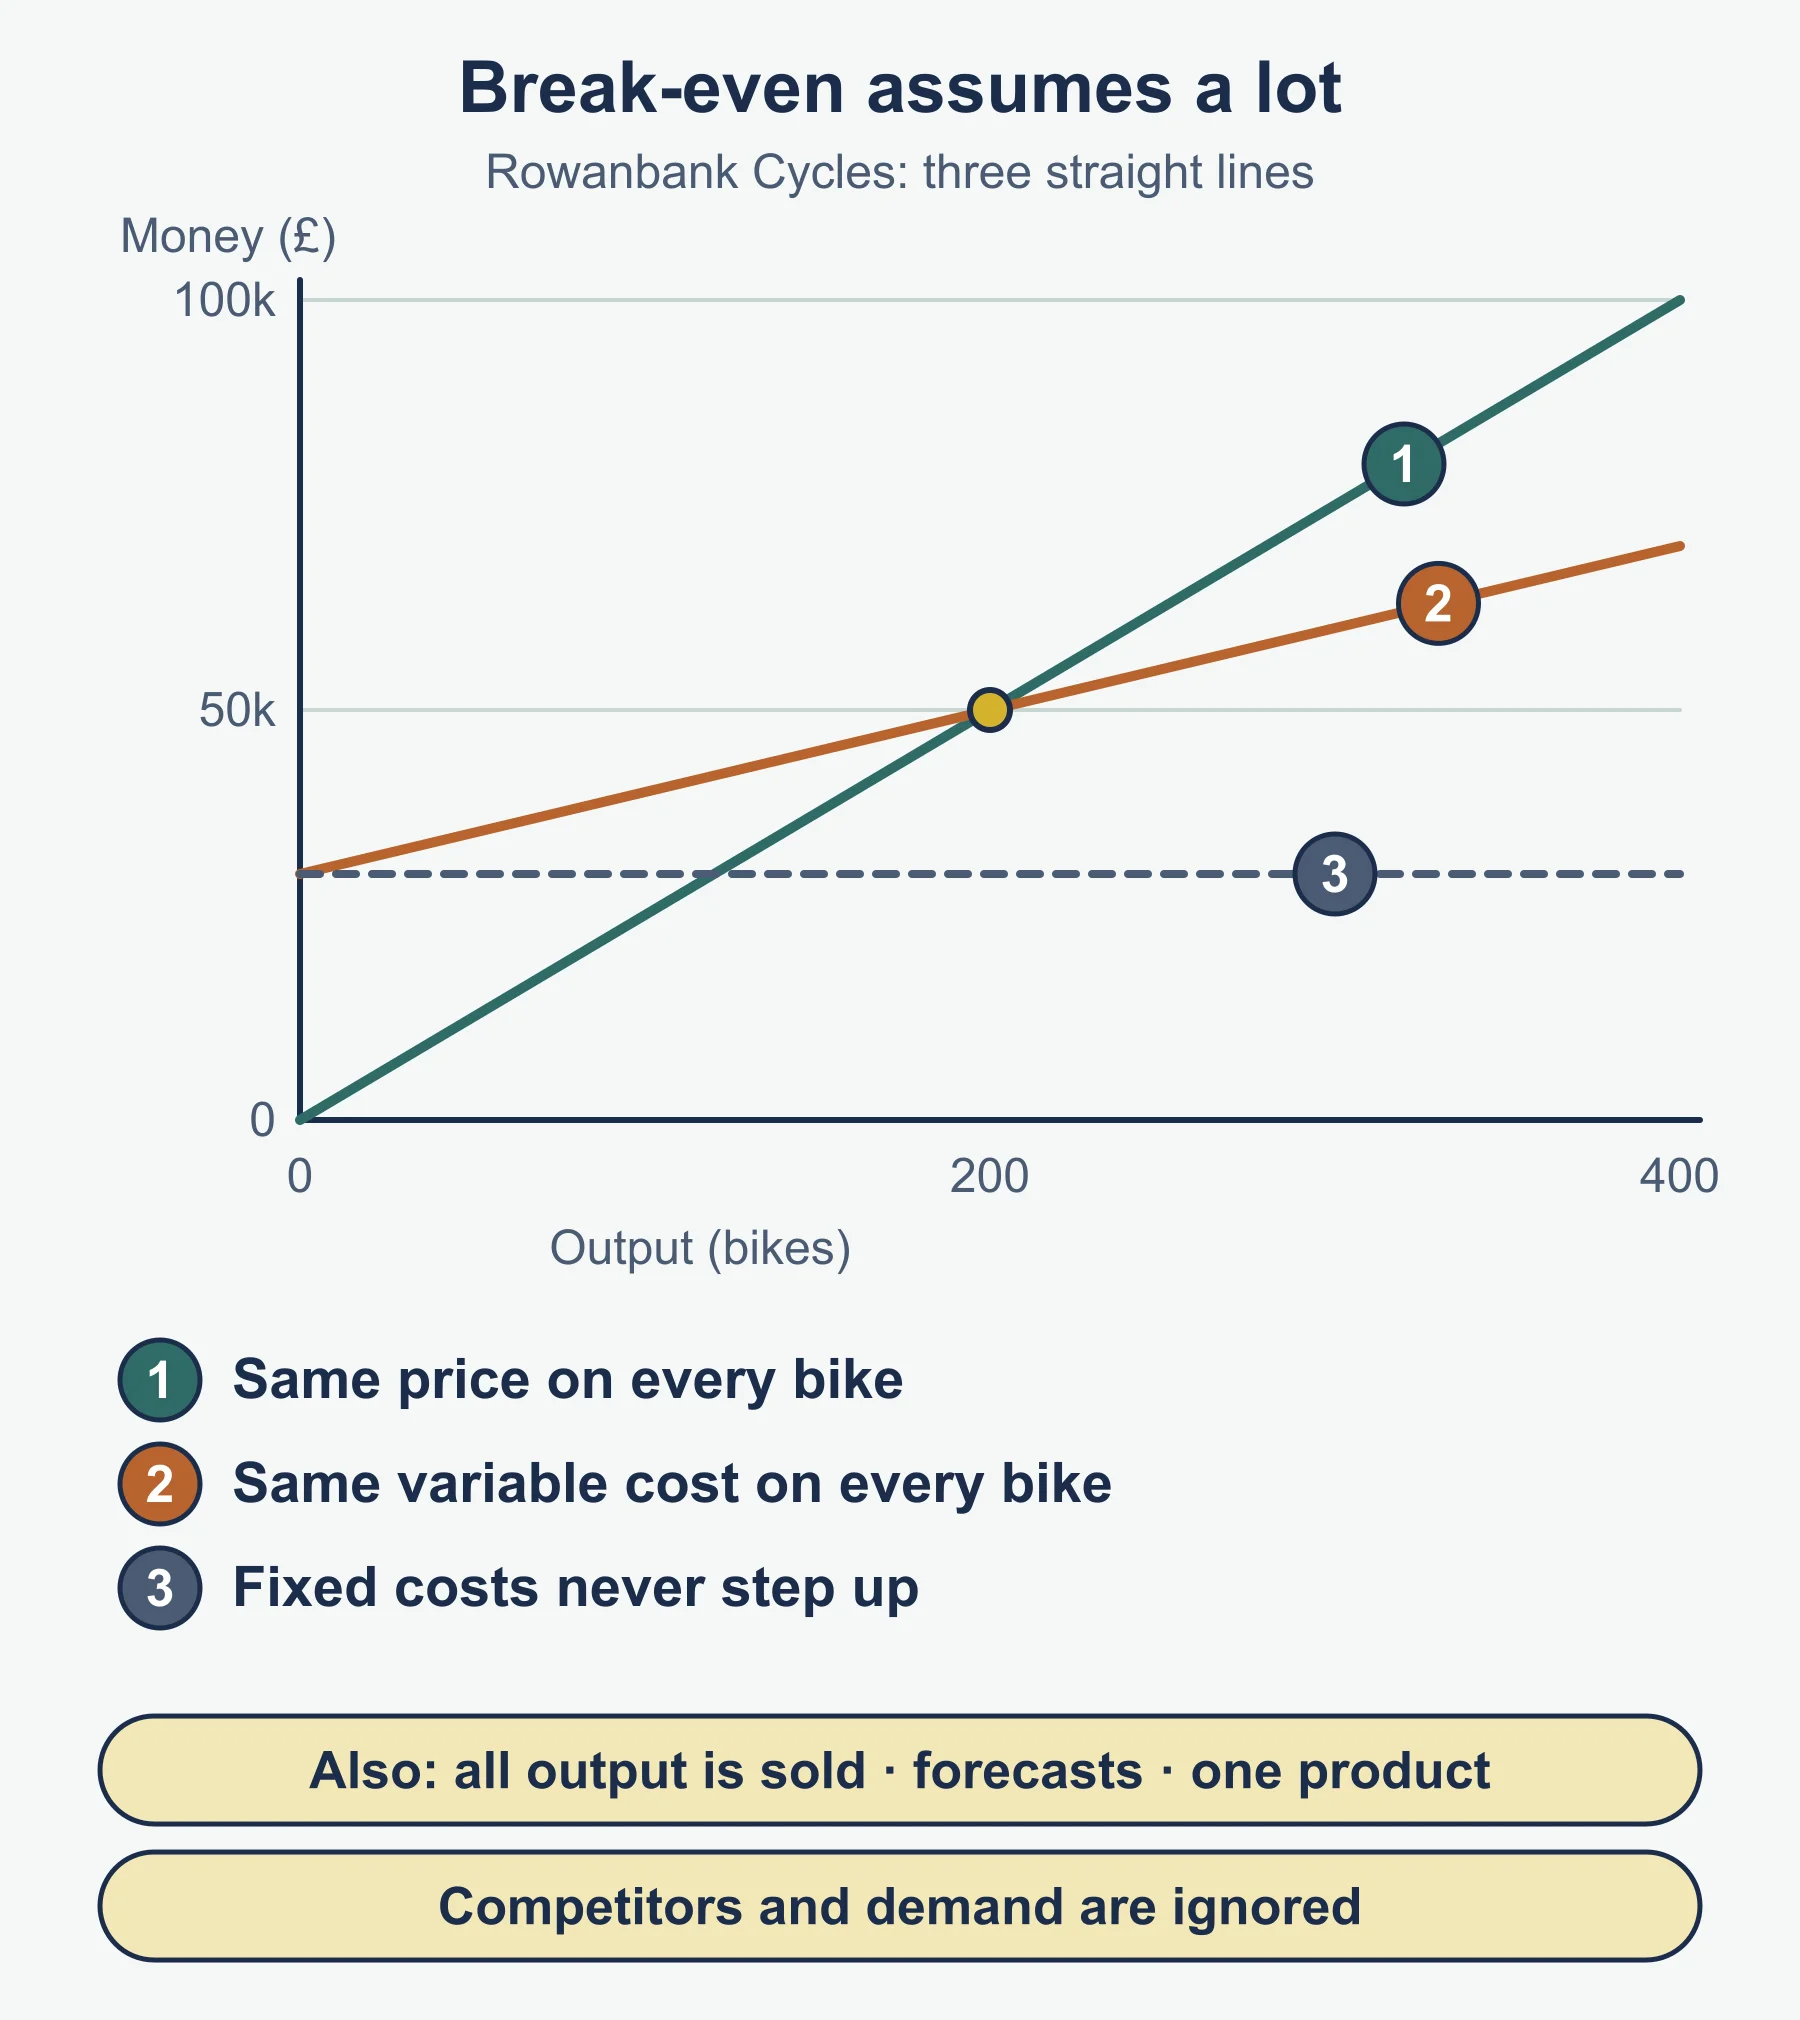
A break-even chart is a model. It is useful for planning, but you must know where it can mislead.
- Straight lines. Revenue is drawn as a straight line, which assumes the same price at every output. Real businesses give discounts for bulk orders or cut prices to clear stock.
- Constant variable cost per unit. Suppliers may give cheaper rates on large orders, or overtime may raise labour cost at high output.
- Fixed costs stay fixed. At much higher output the firm may need a bigger workshop, so fixed costs jump.
- Everything made is sold. Unsold stock still costs money, so profit is overstated.
- Forecasts. The figures are estimates and may prove wrong, and costs change over time.
- Demand is not shown. The chart tells you the output needed, not whether customers will buy it.
- One product. Businesses selling several products need extra assumptions about the mix.
For a high-mark answer, link the limitation to the business: say what is likely to change for that firm, and what effect it would have on the break-even point or on the decision.
Command words in this topic
The specification explains the command words. Define needs a term from the content. Calculate uses given data and needs workings. Identify asks you to select an answer from a graph or table. Complete the table needs missing values. Outline needs two linked points in context. Explain needs a statement of fact with two expansion points. Analyse, Justify and Evaluate are extended answers: Justify recommends one of two options, and Evaluate reaches a supported conclusion about the situation.
Common errors
- Treating variable cost per unit as the total variable cost, or using it as the fixed cost.
- Dividing fixed costs by the selling price instead of by the contribution per unit.
- Reporting a break-even output like 466.7 without rounding to a whole unit.
- Forgetting that the total costs line starts at the fixed cost figure, not at zero.
- Saying a price rise “always increases profit” without considering the number of units customers still buy.
- Listing limitations without applying them to the business in the question.
Frequently asked questions
What is break-even? Break-even is the level of output at which revenue equals total costs, so the business makes neither a profit nor a loss. Below it the business makes a loss, and above it a profit.
How do you read the break-even point from a chart? Find where the revenue line crosses the total costs line, then read down to the horizontal axis for break-even output and across to the vertical axis for break-even revenue.
What are the limitations of break-even charts? They assume a constant price and variable cost per unit, fixed costs that stay fixed and that everything made is sold. The figures are forecasts, demand is not shown and the chart suits a single product.
What is the difference between variable cost per unit and total variable cost? Variable cost per unit is the cost of making one item, while total variable cost is that figure multiplied by output. Treating one as the other is a common error.
Official syllabus
Pearson Edexcel International GCSE in Business (4BS1), Specification, Issue 2, February 2026, published by Pearson Education Limited. Topic 3: Business finance, section 3.3 Costs and break-even analysis, points 3.3.1 to 3.3.3.
Get free revision emails (optional)
Occasional emails with practice questions, worked explanations and links to free resources for the qualification and subjects you choose. No spam, and you can unsubscribe from any email. The free tools on this site never need an email.
Related resources
-
Practice questions
Edexcel IGCSE Business: Costs and break-even analysis (4BS1) – Practice Questions
Original practice questions with worked answers on costs, profit and break-even analysis for Edexcel International GCSE Business 4BS1, section 3.3.
Business · Pearson Edexcel · IGCSE
Try questions -
Revision notes
Edexcel IGCSE Business: Costs and break-even analysis (4BS1) – Revision Notes
Condensed revision notes on costs, profit, break-even output and break-even charts for Edexcel International GCSE Business 4BS1, section 3.3.
Business · Pearson Edexcel · IGCSE
Revise topic -
Study guides
Edexcel IGCSE Business: Financial documents and accounts analysis (4BS1)
Study guide to statements of comprehensive income, statements of financial position and the six Edexcel IGCSE Business ratios, with worked examples.
Business · Pearson Edexcel · IGCSE
Read guide
Related articles
-
teaching
A Level tuition in Dubai: Cambridge or Pearson Edexcel International A Level?
Schools in Dubai and Abu Dhabi teach either Cambridge International AS & A Level or Pearson Edexcel International A Level. How the two are structured, why it matters for tuition, and how online classes from Lahore work.
9 October 2026
-
curriculum guides
Choosing subjects at IGCSE and A Level
How subject choices at 14 and 16 affect university options later, and how to keep pathways open without overloading a timetable.
28 July 2026
Studying this with a teacher
Working through Business IGCSE?
This page is free and stays free. If you would rather be taught it, Marlbridge runs Business classes one-to-one and in small groups of up to 15, online in your own time zone. The first trial class is free. WhatsApp replies within an hour (8am–11pm Pakistan time, every day); email the same day.
Pearson Edexcel Business teachers at Marlbridge

