
Revision Notes
IB DP Business Management: Growth and evolution and Multinational companies (MNCs) – Revision Notes
Condensed revision notes for IB DP Business Management sections 1.5 and 1.6: scale, growth methods, staying small and the impact of MNCs on host countries.
- Subject
- Business
- Level
- IB
- Topic
- Unit 1: Introduction to business management
- Author
- Marlbridge Academic Team
- Updated
- Reviewed by
- Salman Ahmad (what this means)
Aligned to International Baccalaureate IB Diploma Programme Business (DP Business Management), First assessment 2024. Official specification .
Syllabus page (what it covers and how it is assessed): IB Diploma Programme Business.
Syllabus points this page covers
DP Business Management
- 1.5 Growth and evolution
- 1.6 Multinational companies (MNCs)
Found an error? Report a correction.
Need help with this topic? Request a free trial class for IB Diploma Programme Business (DP Business Management).
These notes condense sections 1.5 (Growth and evolution) and 1.6 (Multinational companies (MNCs)) of Unit 1 in the IB Business management guide, first assessment 2024. Neither section carries an HL-only label in the guide. Full explanations and longer worked examples are in the study guide. Test yourself with the practice questions, tick off topics on the checklist, and see the course page. To find weak spots first, try the free diagnostics.
The guide names these topics but defines none of them, so the definitions below are the standard textbook forms.
Command words for these sections
The guide classes “analyse”, “explain” and “suggest” as AO2, and “evaluate”, “justify”, “recommend”, “discuss” and “to what extent” as AO3. “Calculate” is AO4, “define”, “identify”, “state” and “outline” are AO1.
| Command term | What the guide’s glossary asks for | Typical use here |
|---|---|---|
| Define | The precise meaning | Define franchising |
| Explain | A detailed account including reasons or causes | Explain one internal economy of scale |
| Evaluate | An appraisal weighing strengths and limitations | Evaluate a takeover |
| Justify | Valid reasons or evidence supporting a conclusion | Justify staying small |
| Recommend | An advisable course of action with supporting evidence | Recommend a growth method |
1.5 Economies and diseconomies of scale
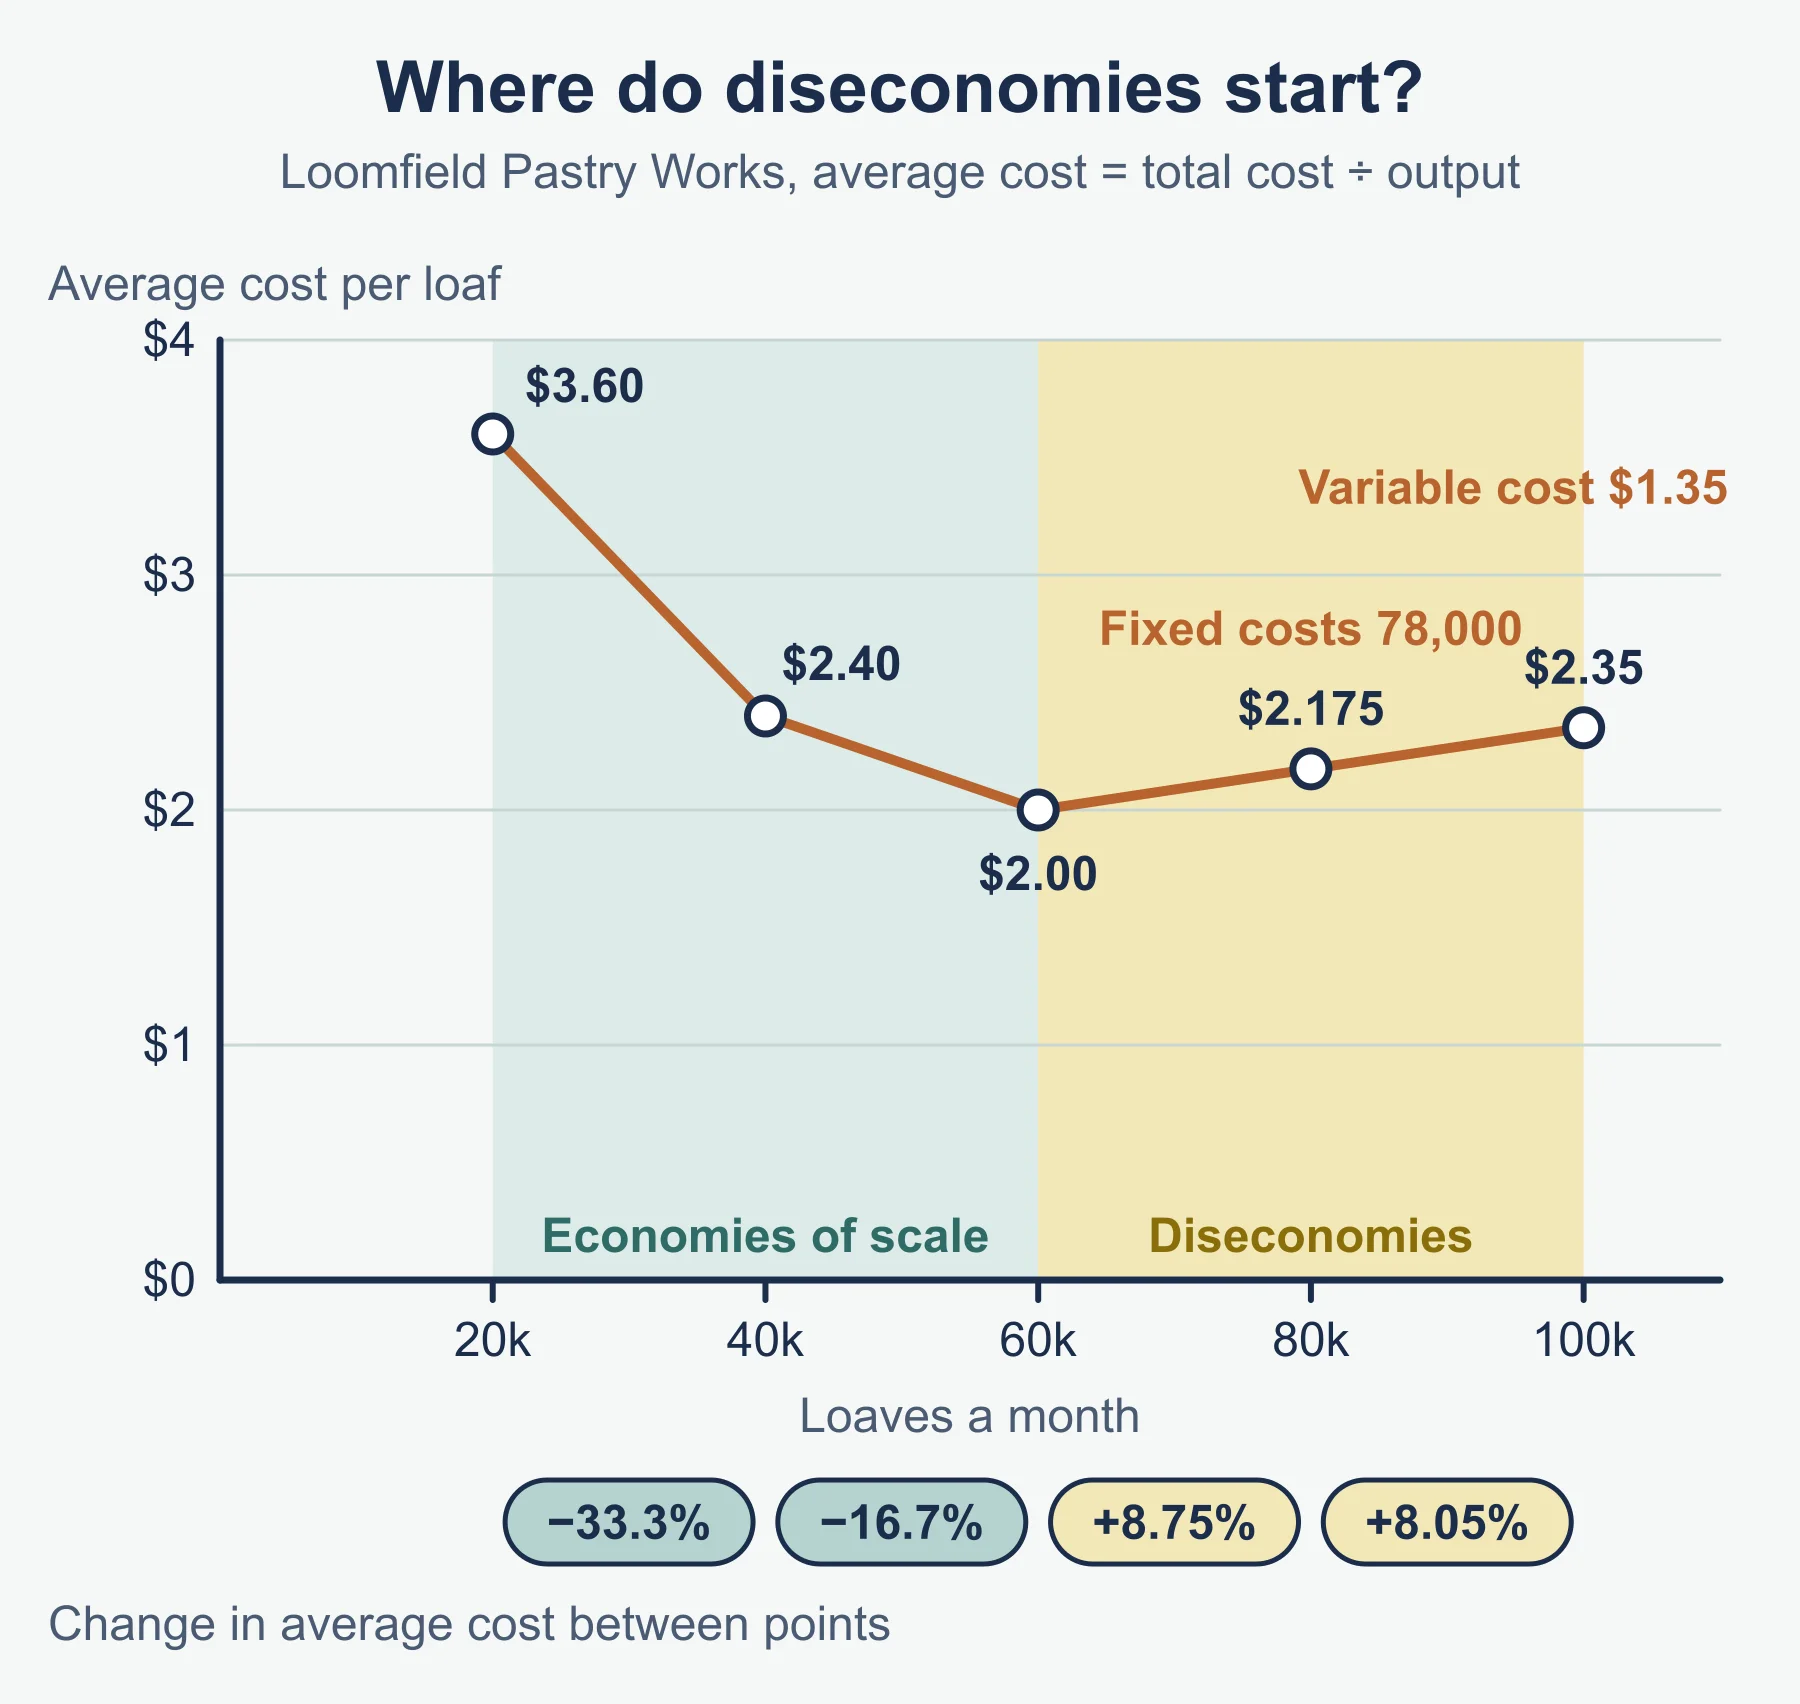
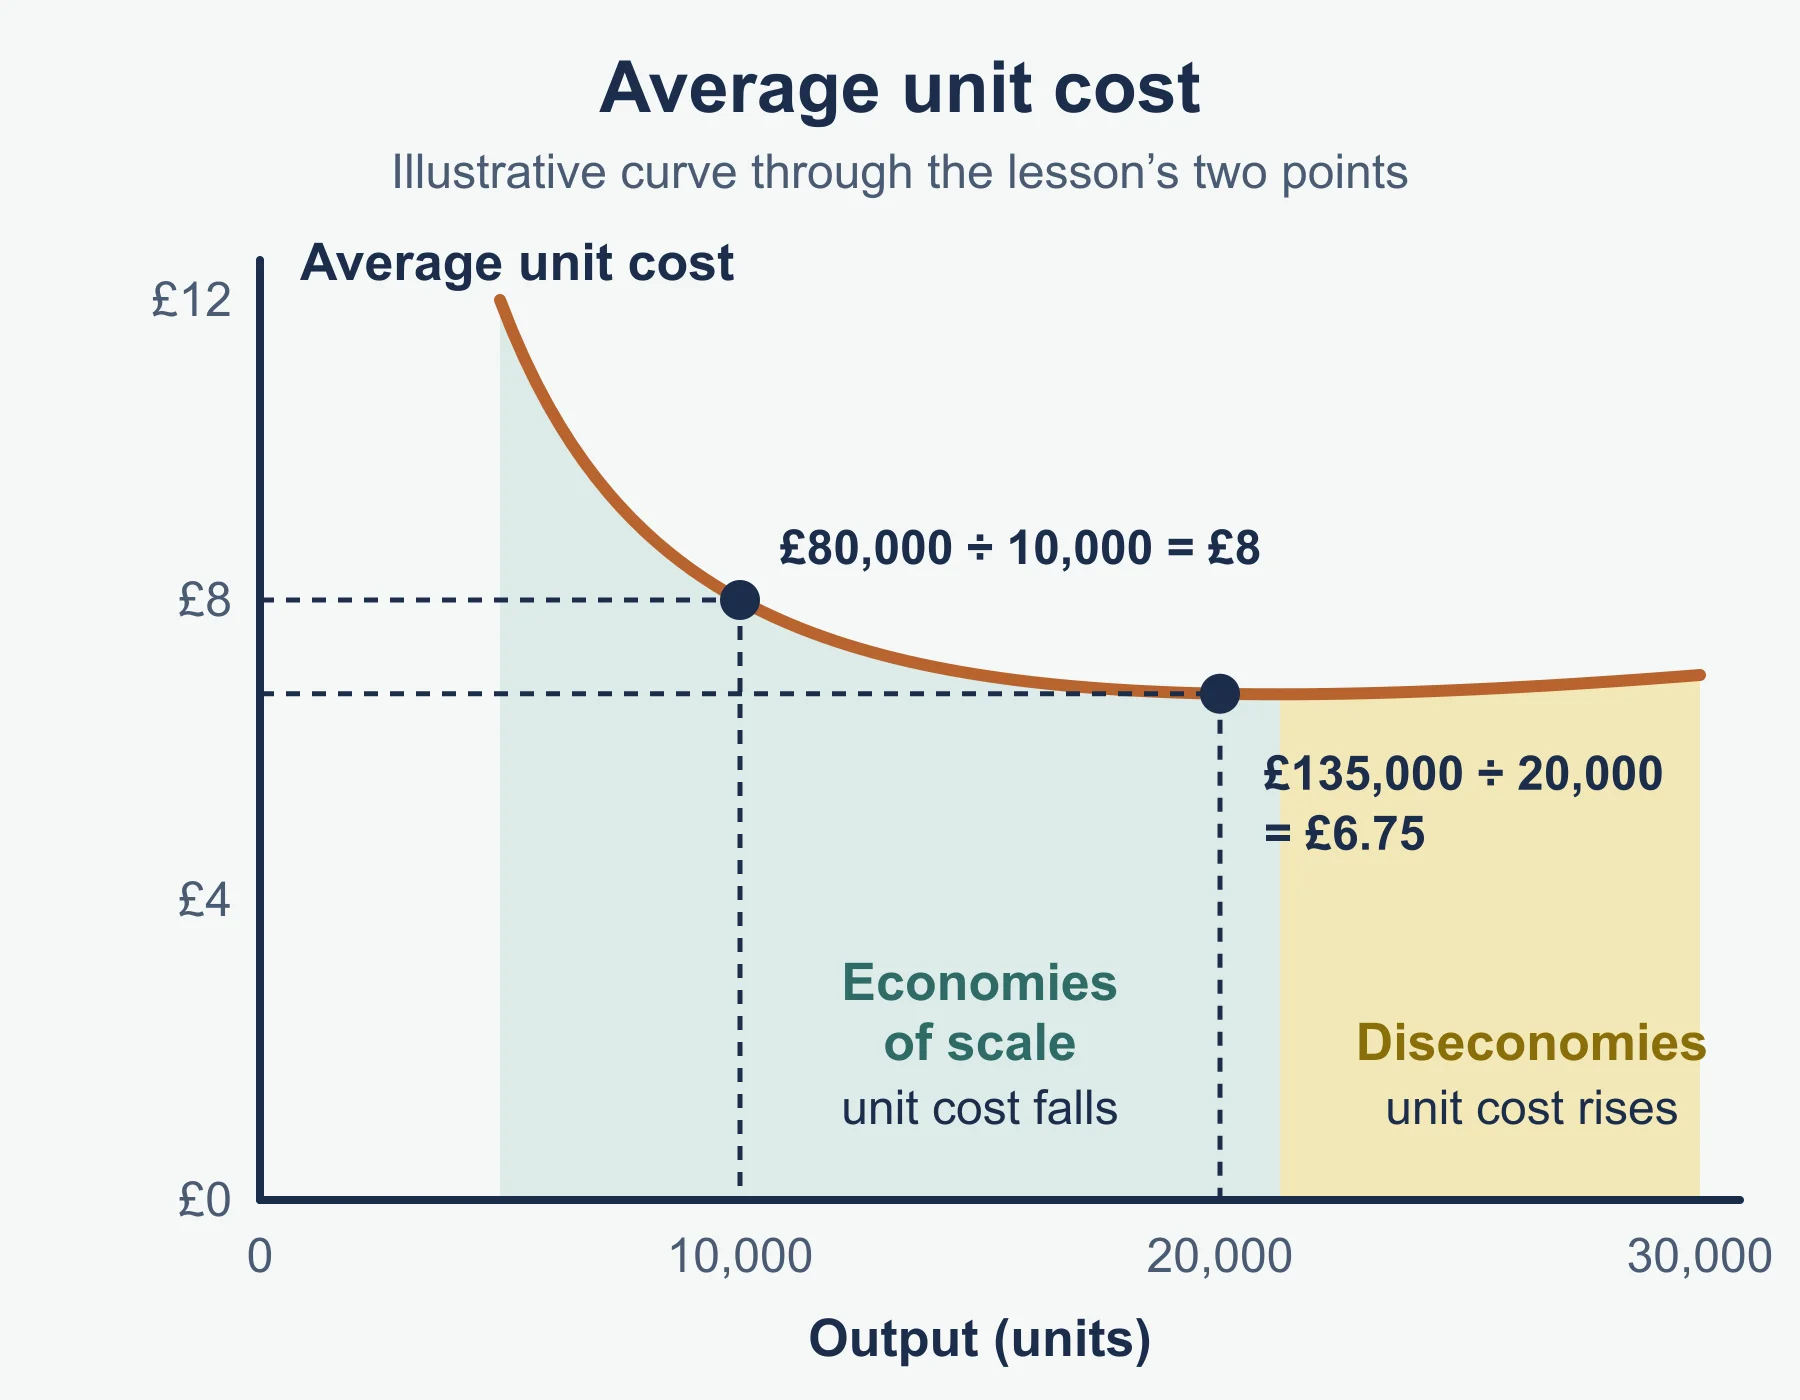
Average cost is found as total cost / output. With economies of scale, rising output comes with a lower average cost. With diseconomies of scale, rising output comes with a higher average cost.
| Type | Internal (from the firm’s own size) | External (from the industry or area) |
|---|---|---|
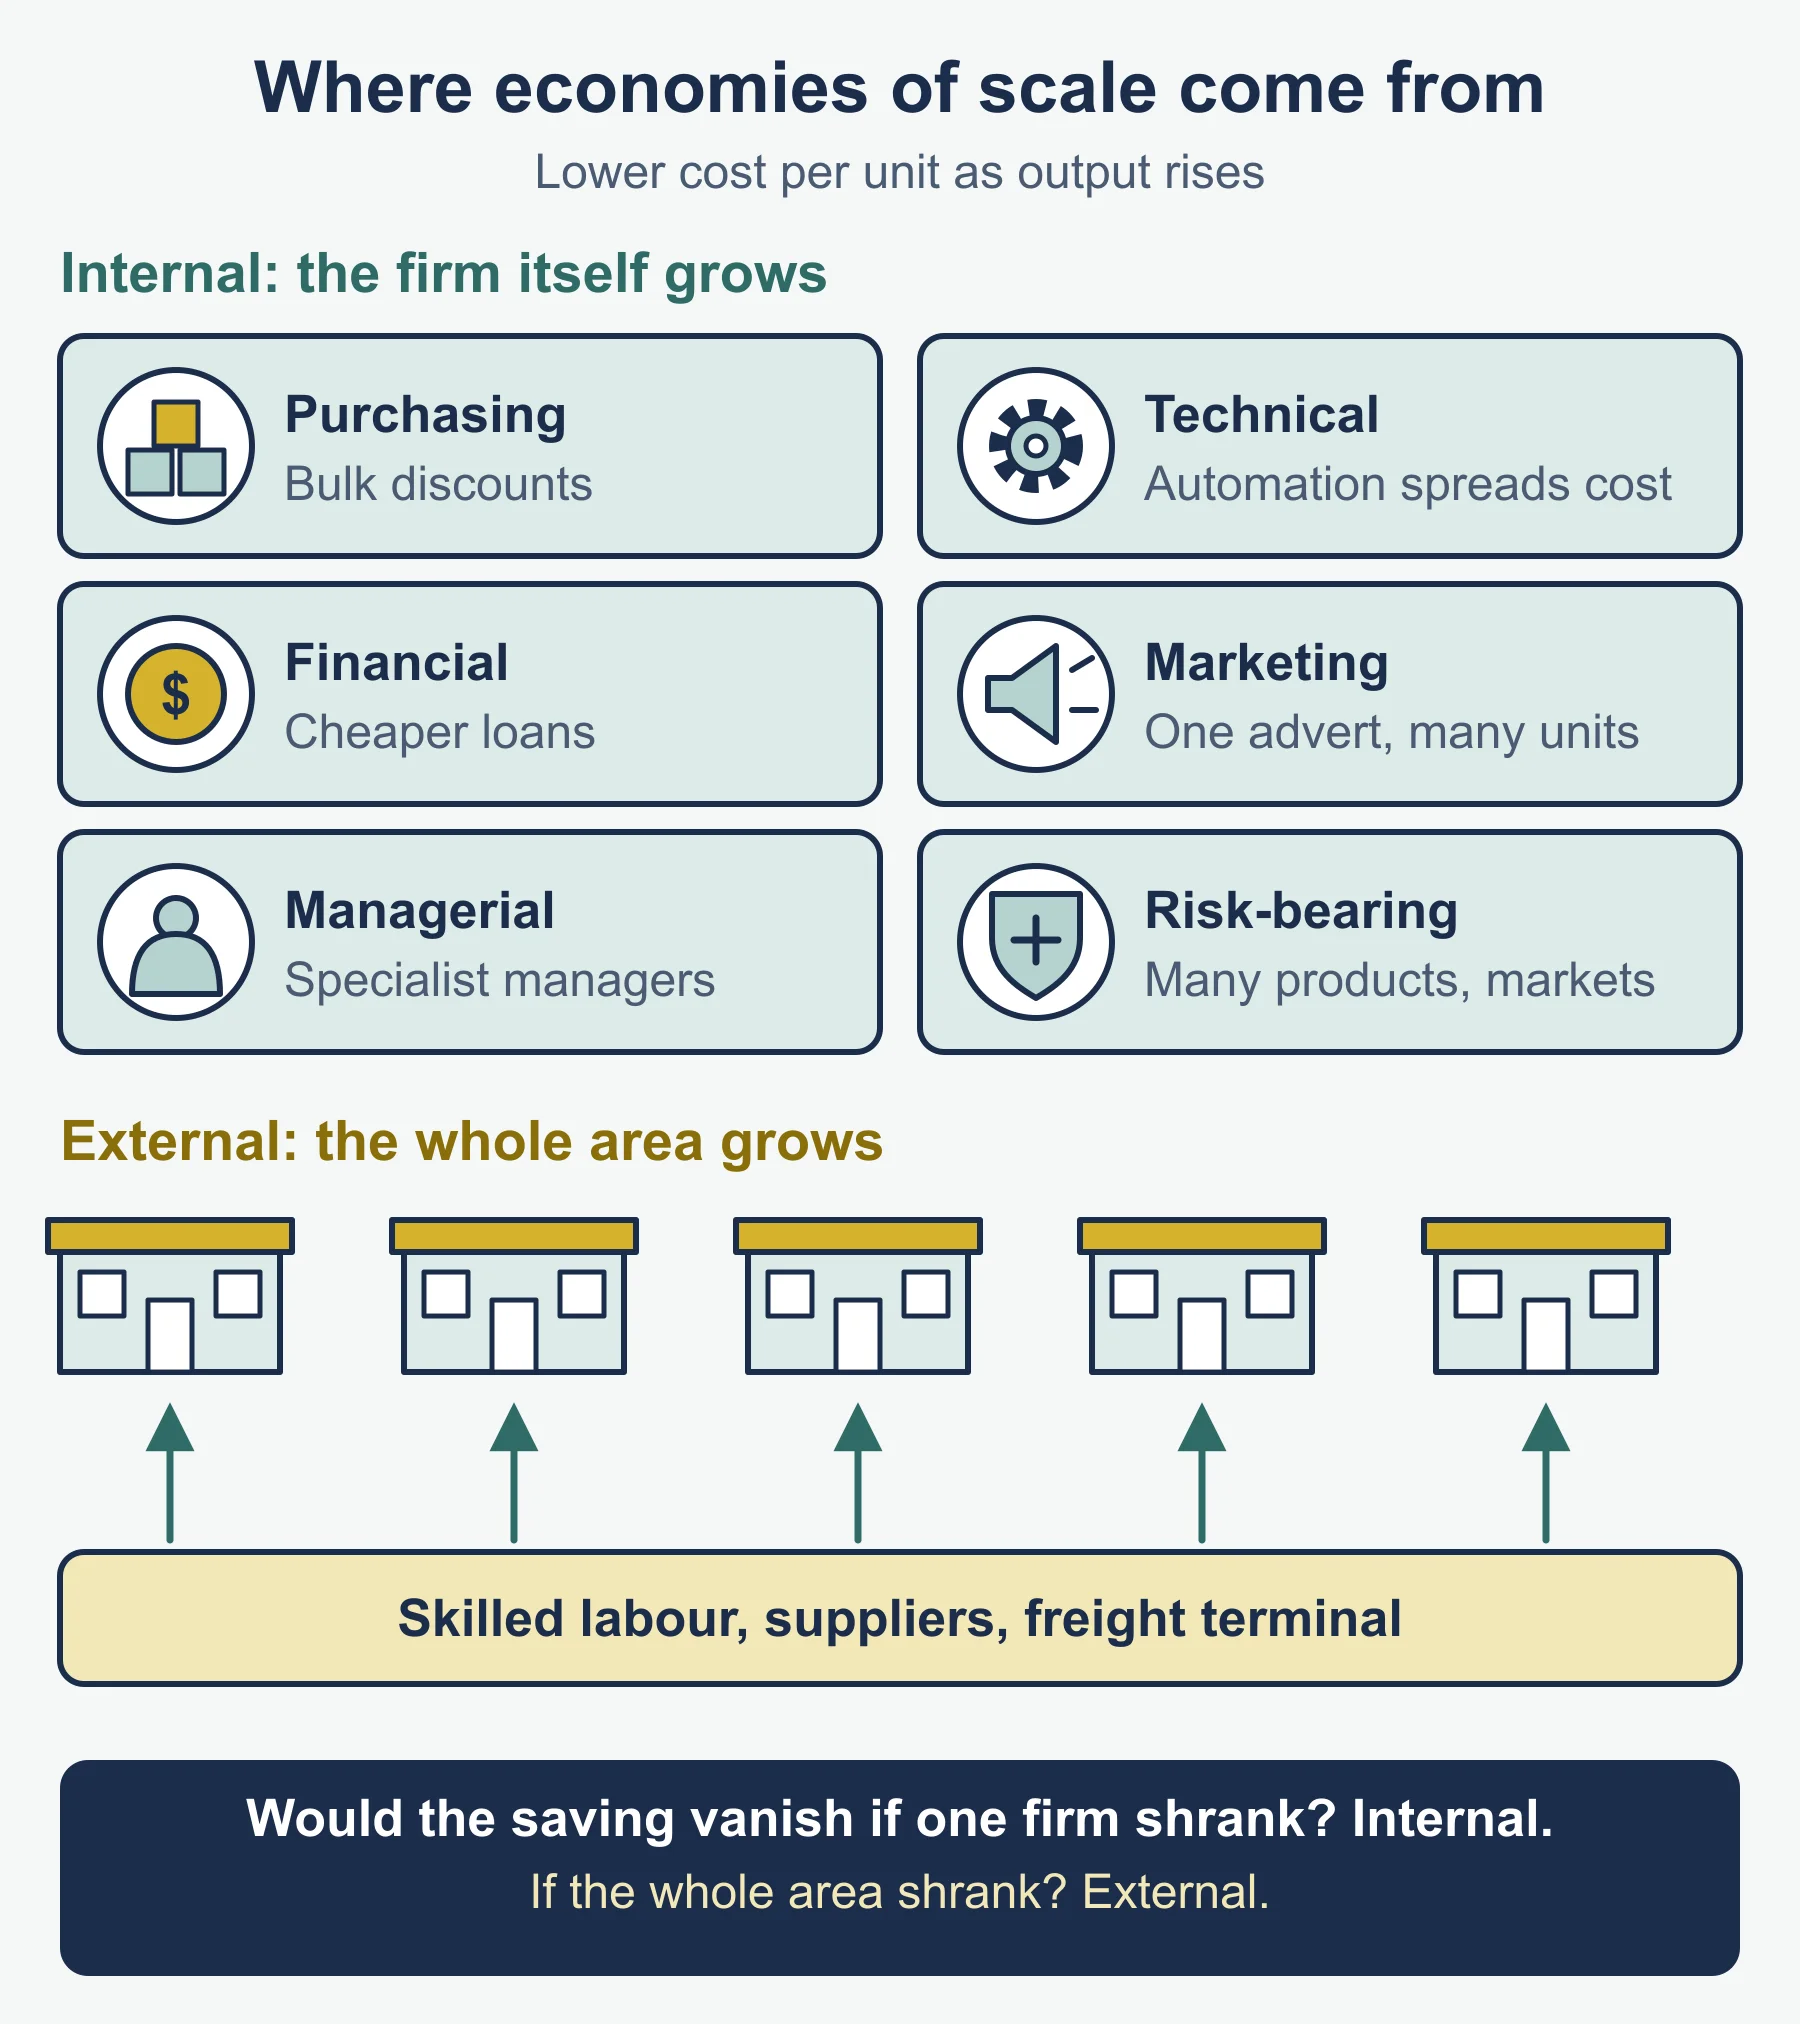
| Economies | Bulk buying, large machinery, cheaper loans, shared advertising, specialist managers, wider product range | Skilled labor pool, supplier clusters, shared transport and infrastructure |
| Diseconomies | Slow communication, poor coordination, weak motivation | Congestion, higher rents and wages, competition for the same inputs |
Quick test: if the saving would vanish when this one firm shrinks, it is internal. If it would vanish when the whole cluster shrinks, it is external.
Worked reminder
Tessaro Tiles makes 15,000 tiles at a total cost of 90,000 and 30,000 tiles at a total cost of 135,000 (all in $).
- Average cost at 15,000 tiles: 90,000 / 15,000 = 6.00.
- Average cost at 30,000 tiles: 135,000 / 30,000 = 4.50.
- Change: (4.50 - 6.00) / 6.00 = -25.0%.
The fall of 25.0% shows economies of scale, probably because the kiln and rent are spread over more tiles.
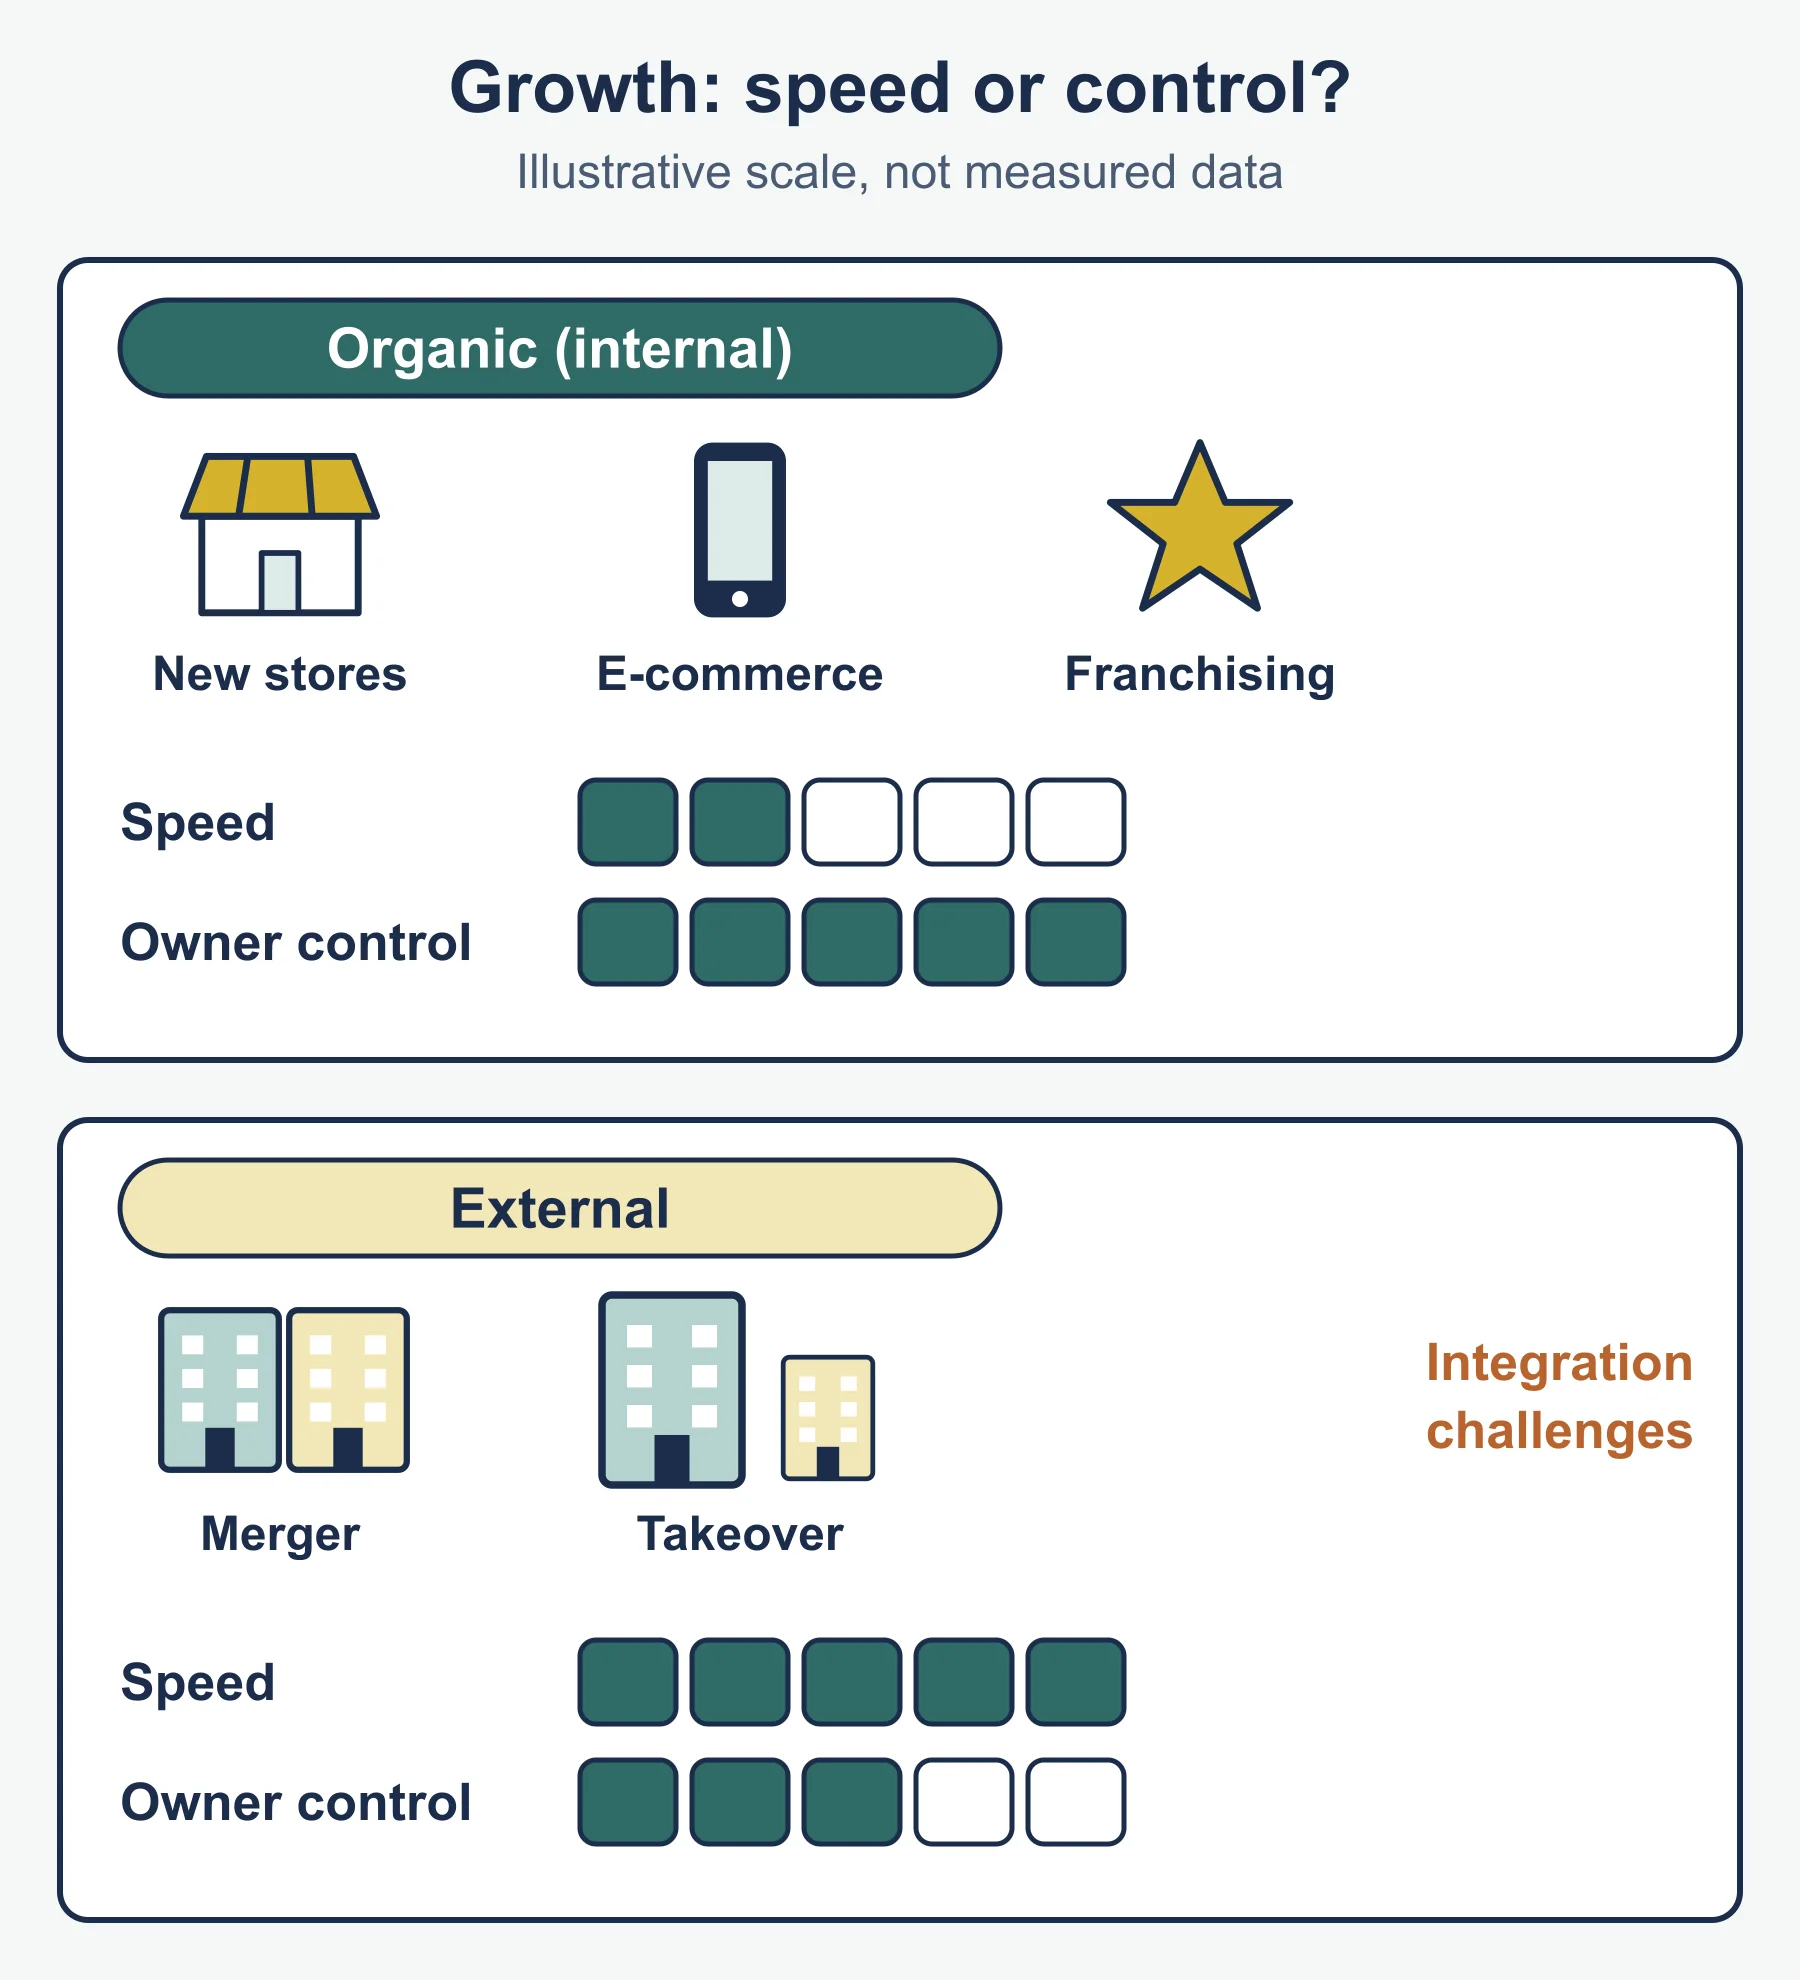
1.5 Internal growth versus external growth
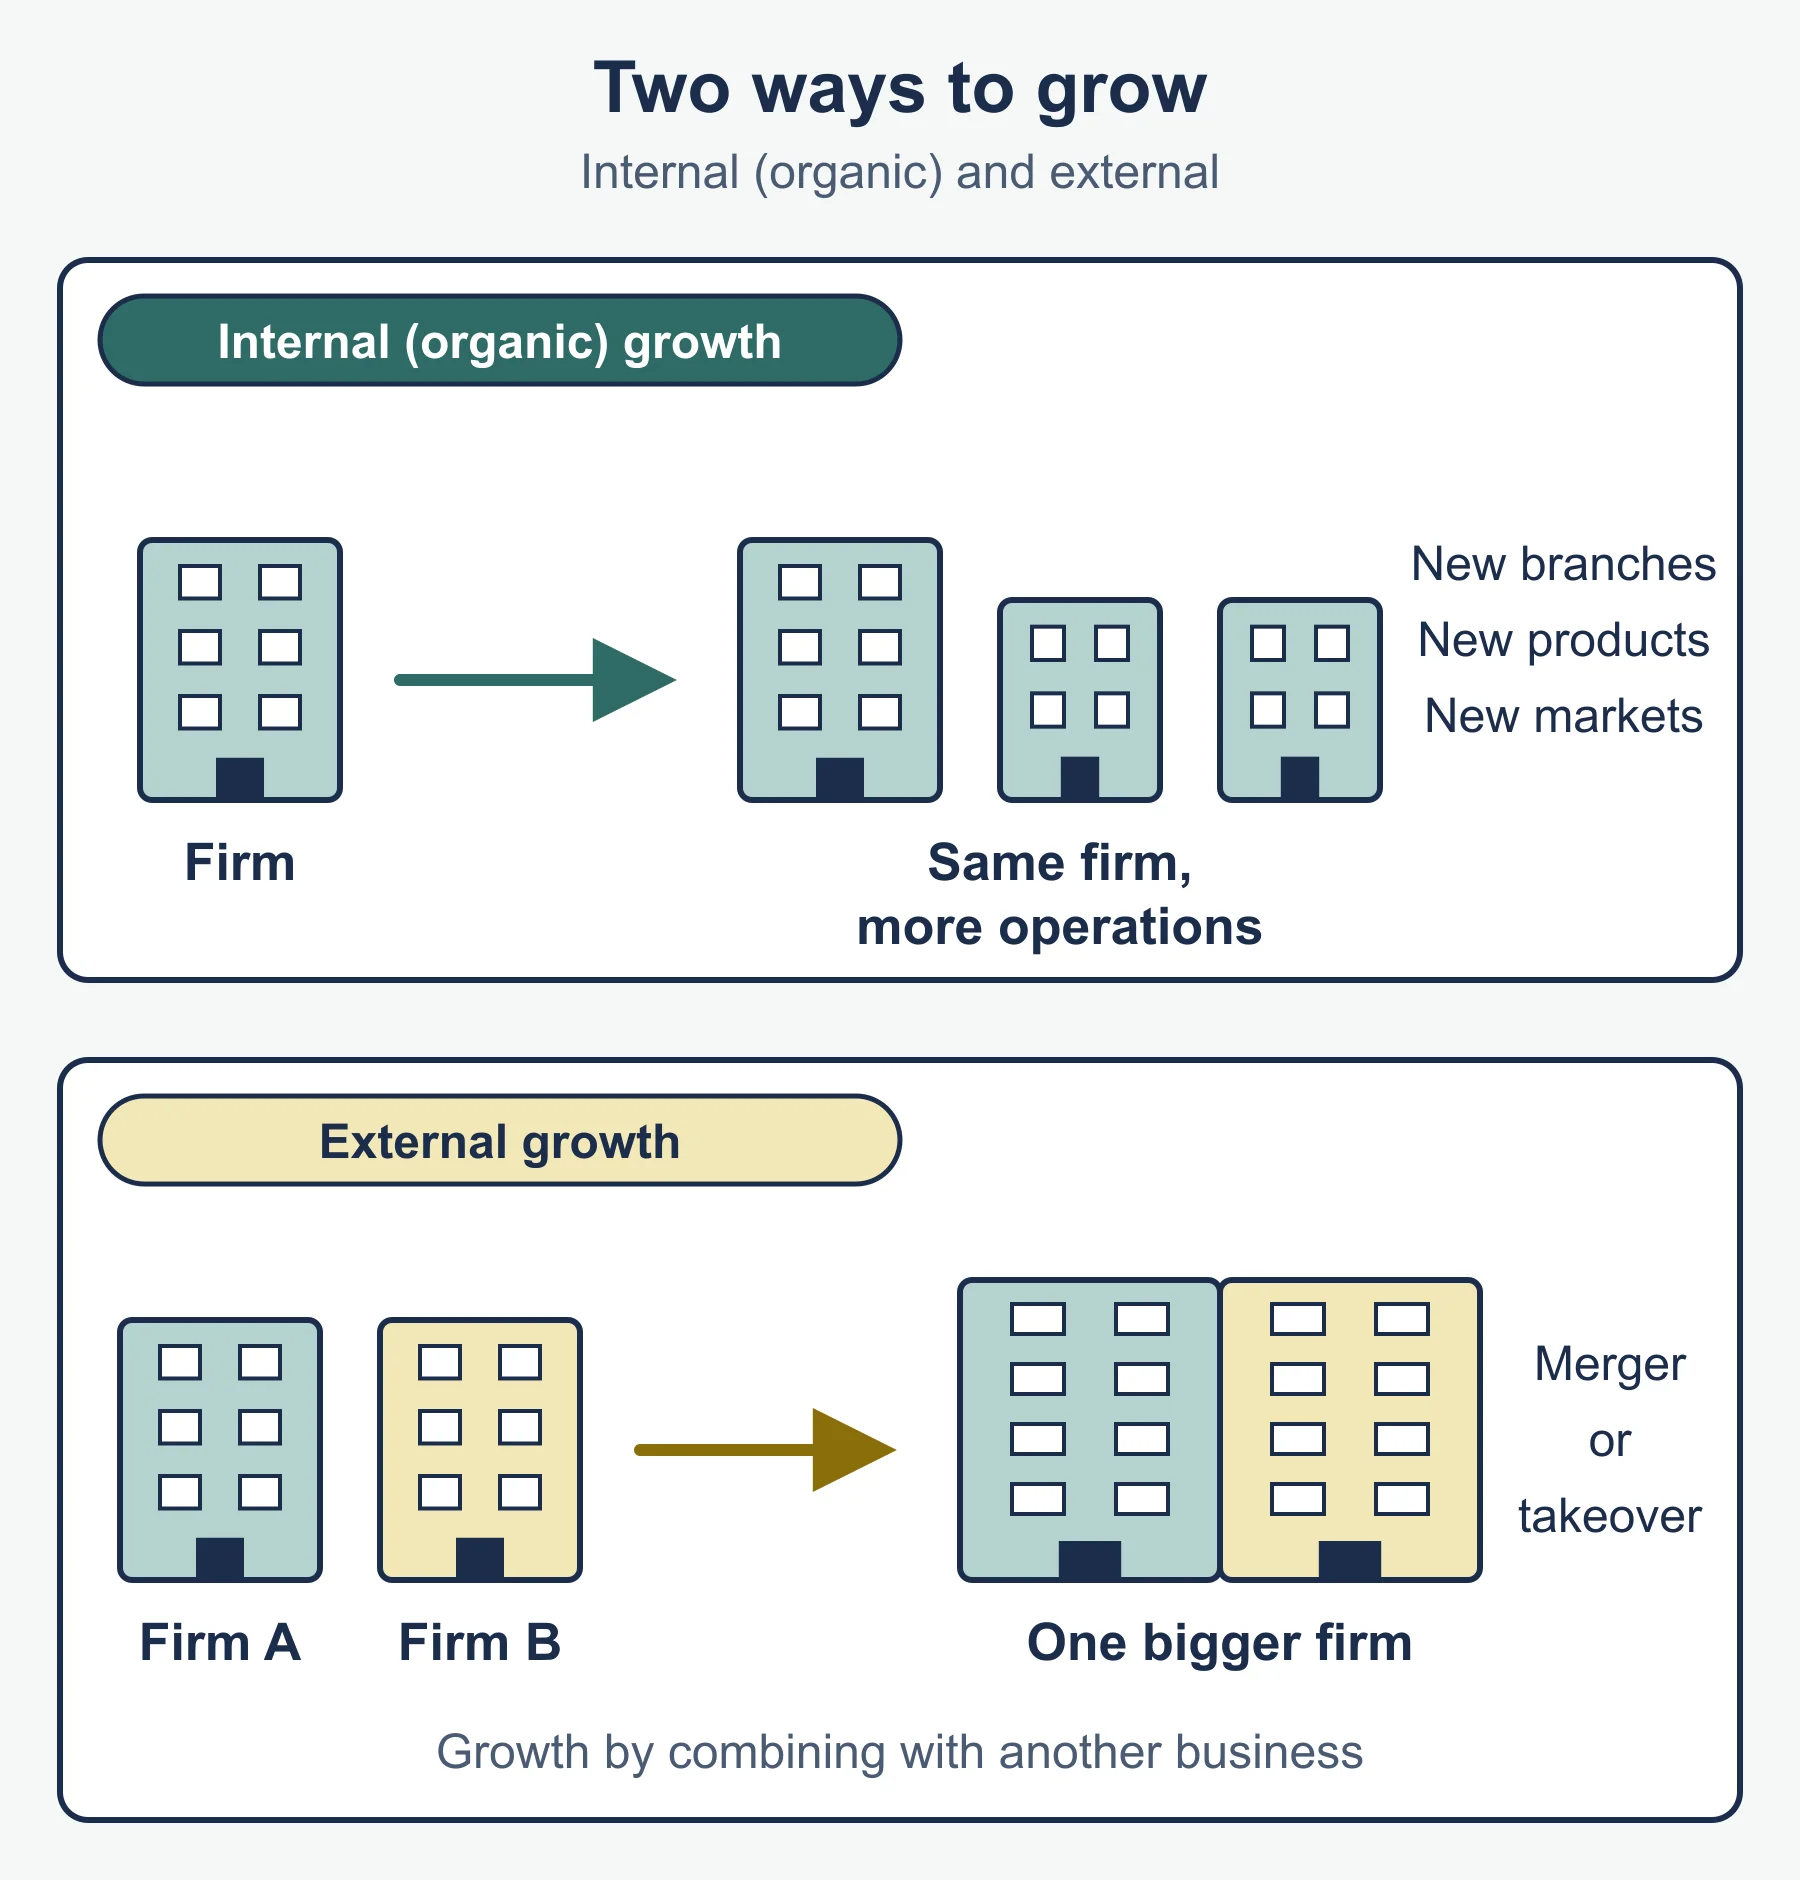
| Internal (organic) | External (inorganic) | |
|---|---|---|
| Source | Own resources, own sales effort | Another business involved |
| Pace | Gradual | Can be sudden |
| Risk | Lower | Higher, because of price and fit |
| Culture | Preserved | Two cultures to join |
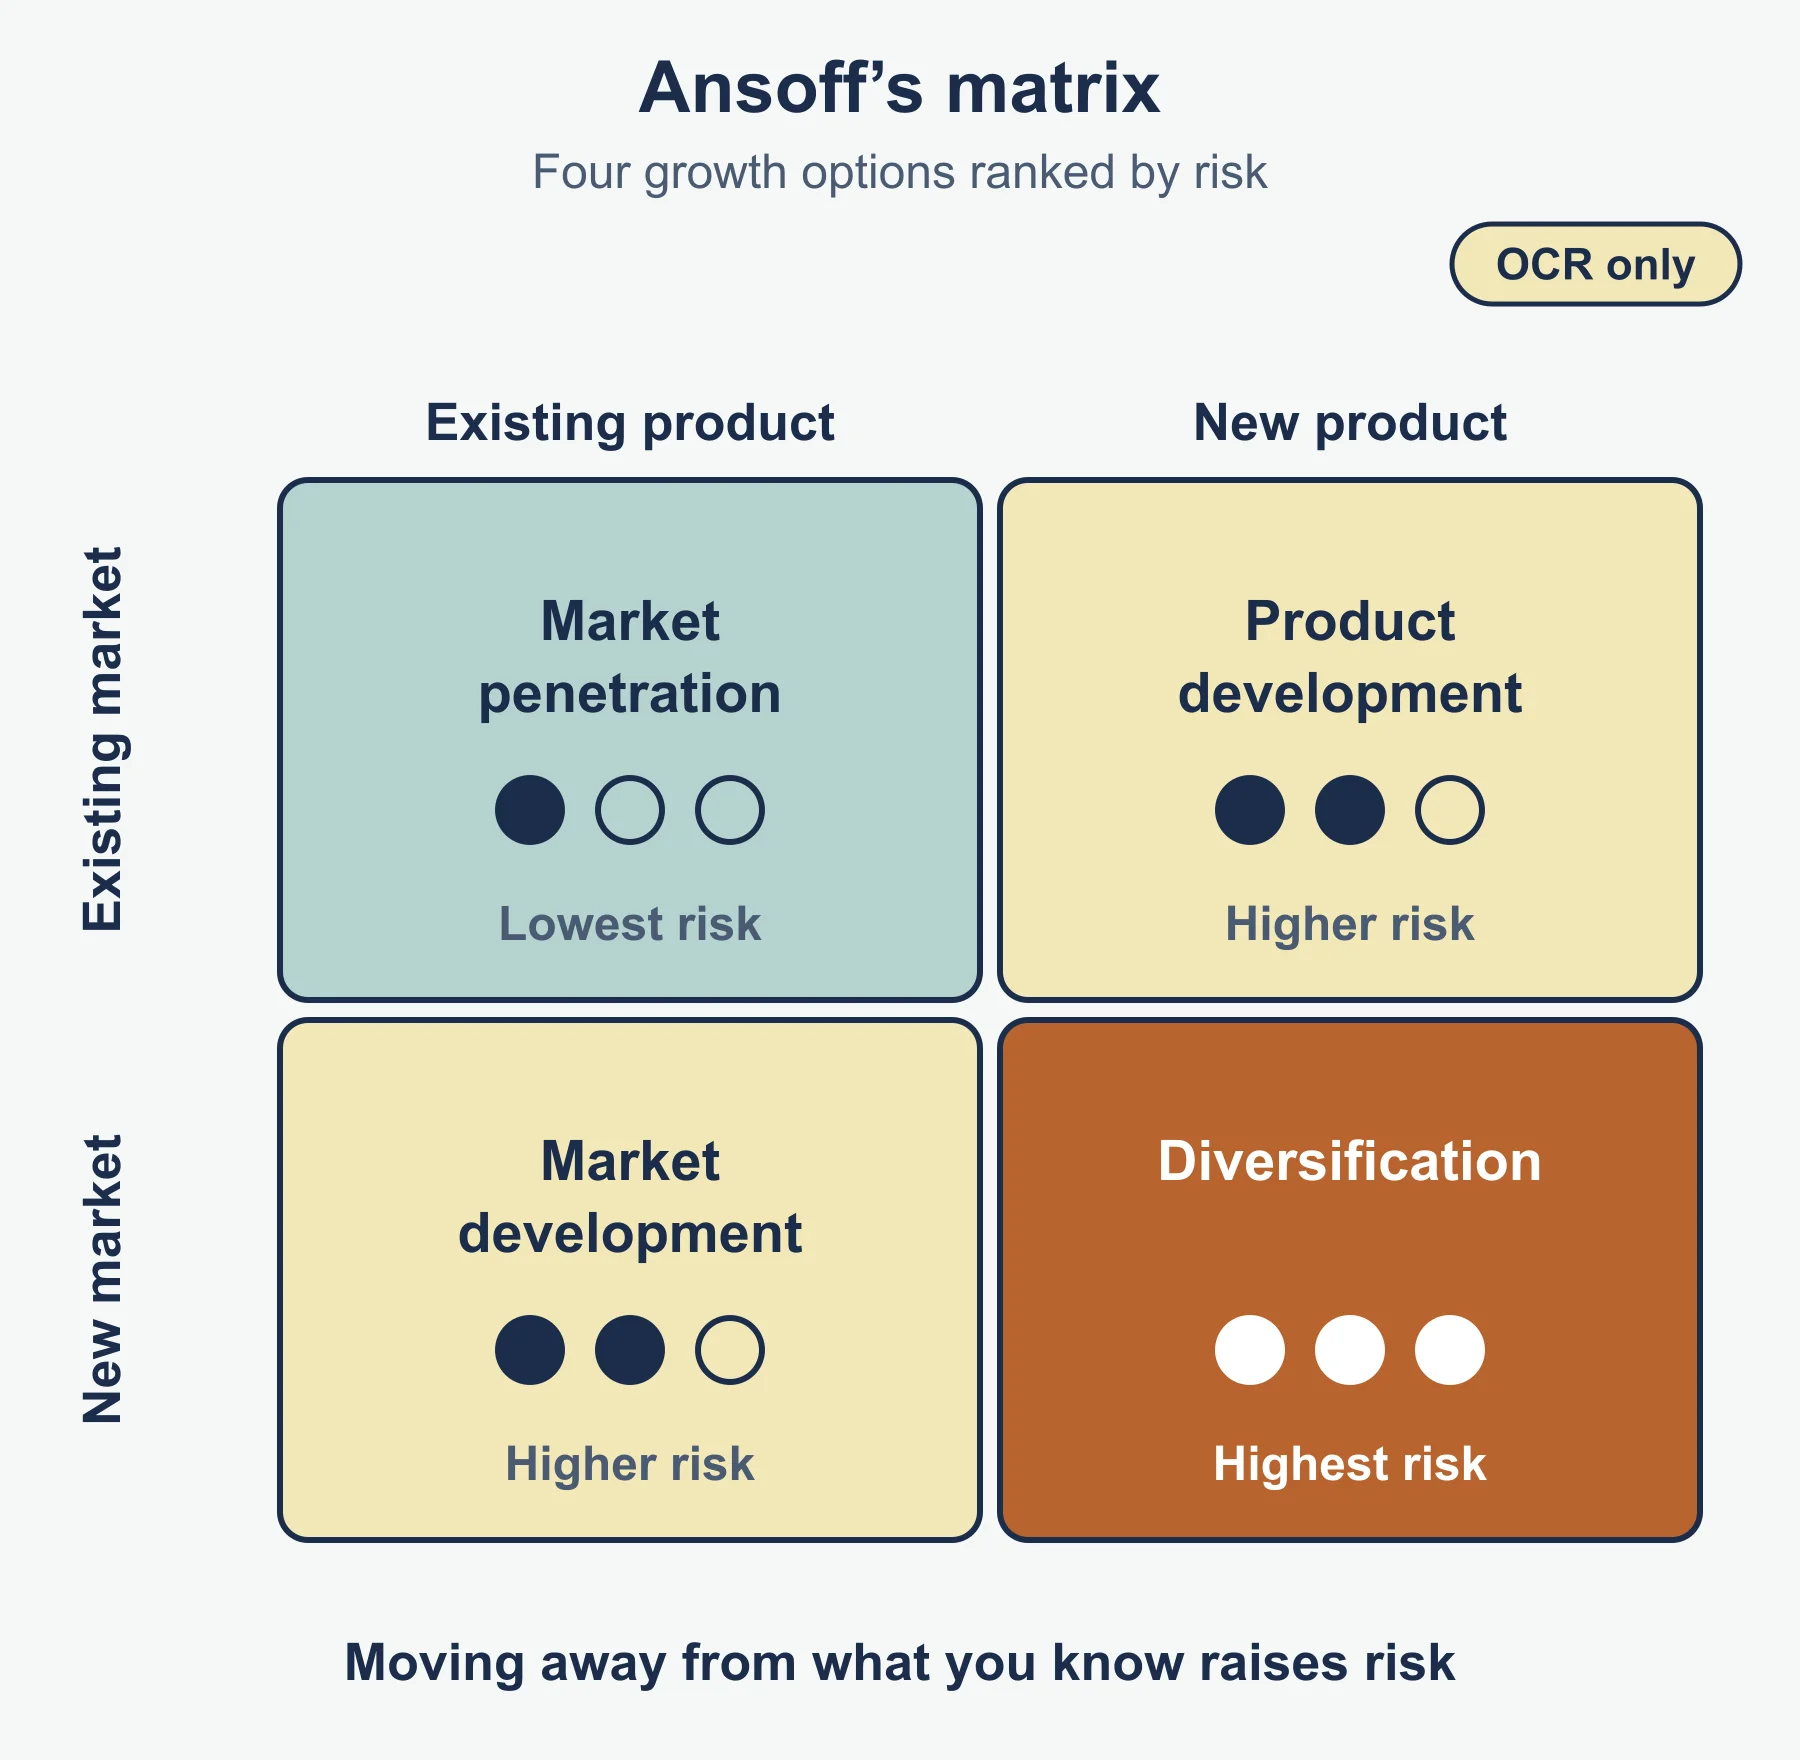
Ansoff Matrix (a suggested tool for Unit 1): market penetration, product development, market development, diversification. The further a firm moves from its current products and markets, the higher the risk, and the more likely it is to seek a partner.
1.5 Reasons to grow, reasons to stay small
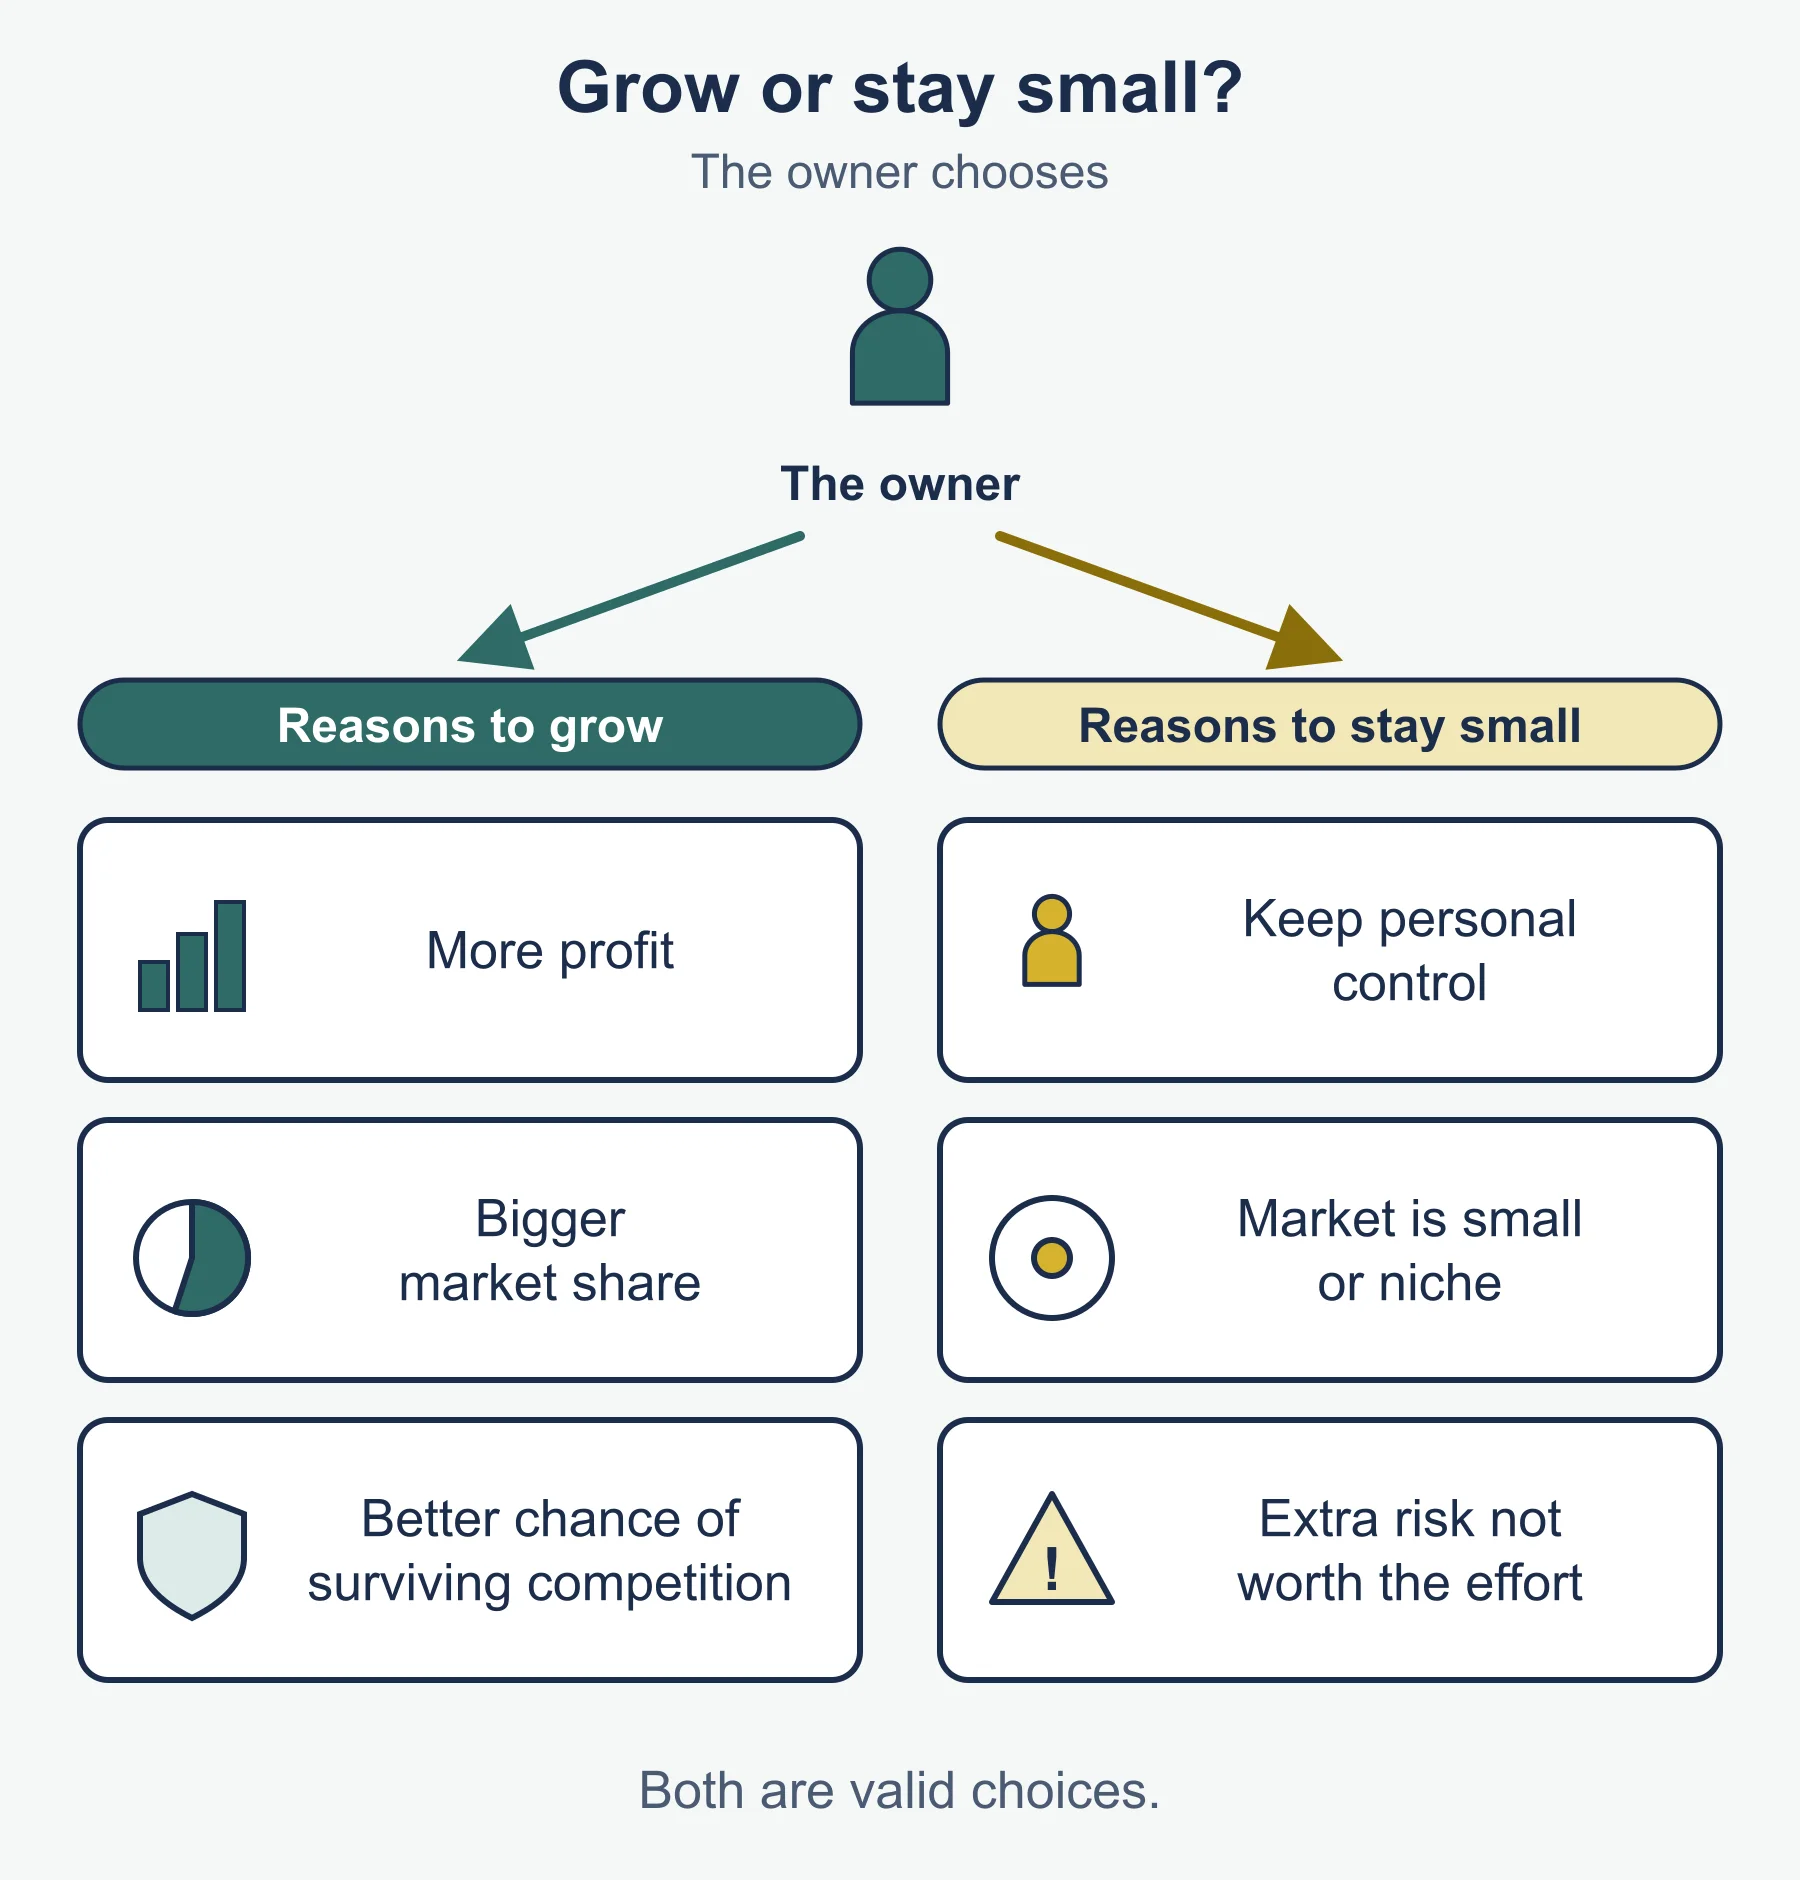
| Reasons to grow | Reasons to stay small |
|---|---|
| Lower unit cost | Keep control and personal service |
| Bigger market share | Serve a niche |
| Spread risk | Stay flexible |
| More profit and shareholder value | Avoid debt and stress |
| Better chance of survival | Limited finance or resources |
| Managers’ status and rewards | Owner goals other than profit |
AO3 reminder: a reason is only worth credit if you tie it to the case. “Growth gives economies of scale” scores less than “growth lets this bakery buy flour in bulk, because 70% of its cost is ingredients”.
Short model of an AO3 paragraph
Claim: a niche leather workshop may be wise to stay small. Evidence: its prices are high because each bag is made by hand, and customers pay for that. Analysis: expansion would force machine production, so the selling point would weaken, and a second site could add coordination costs. Counterpoint: a larger output would lower average cost and raise income. Judgement: staying small is the better choice while the brand depends on craft, but this changes if demand outgrows capacity for a sustained period.
1.5 External growth methods at a glance
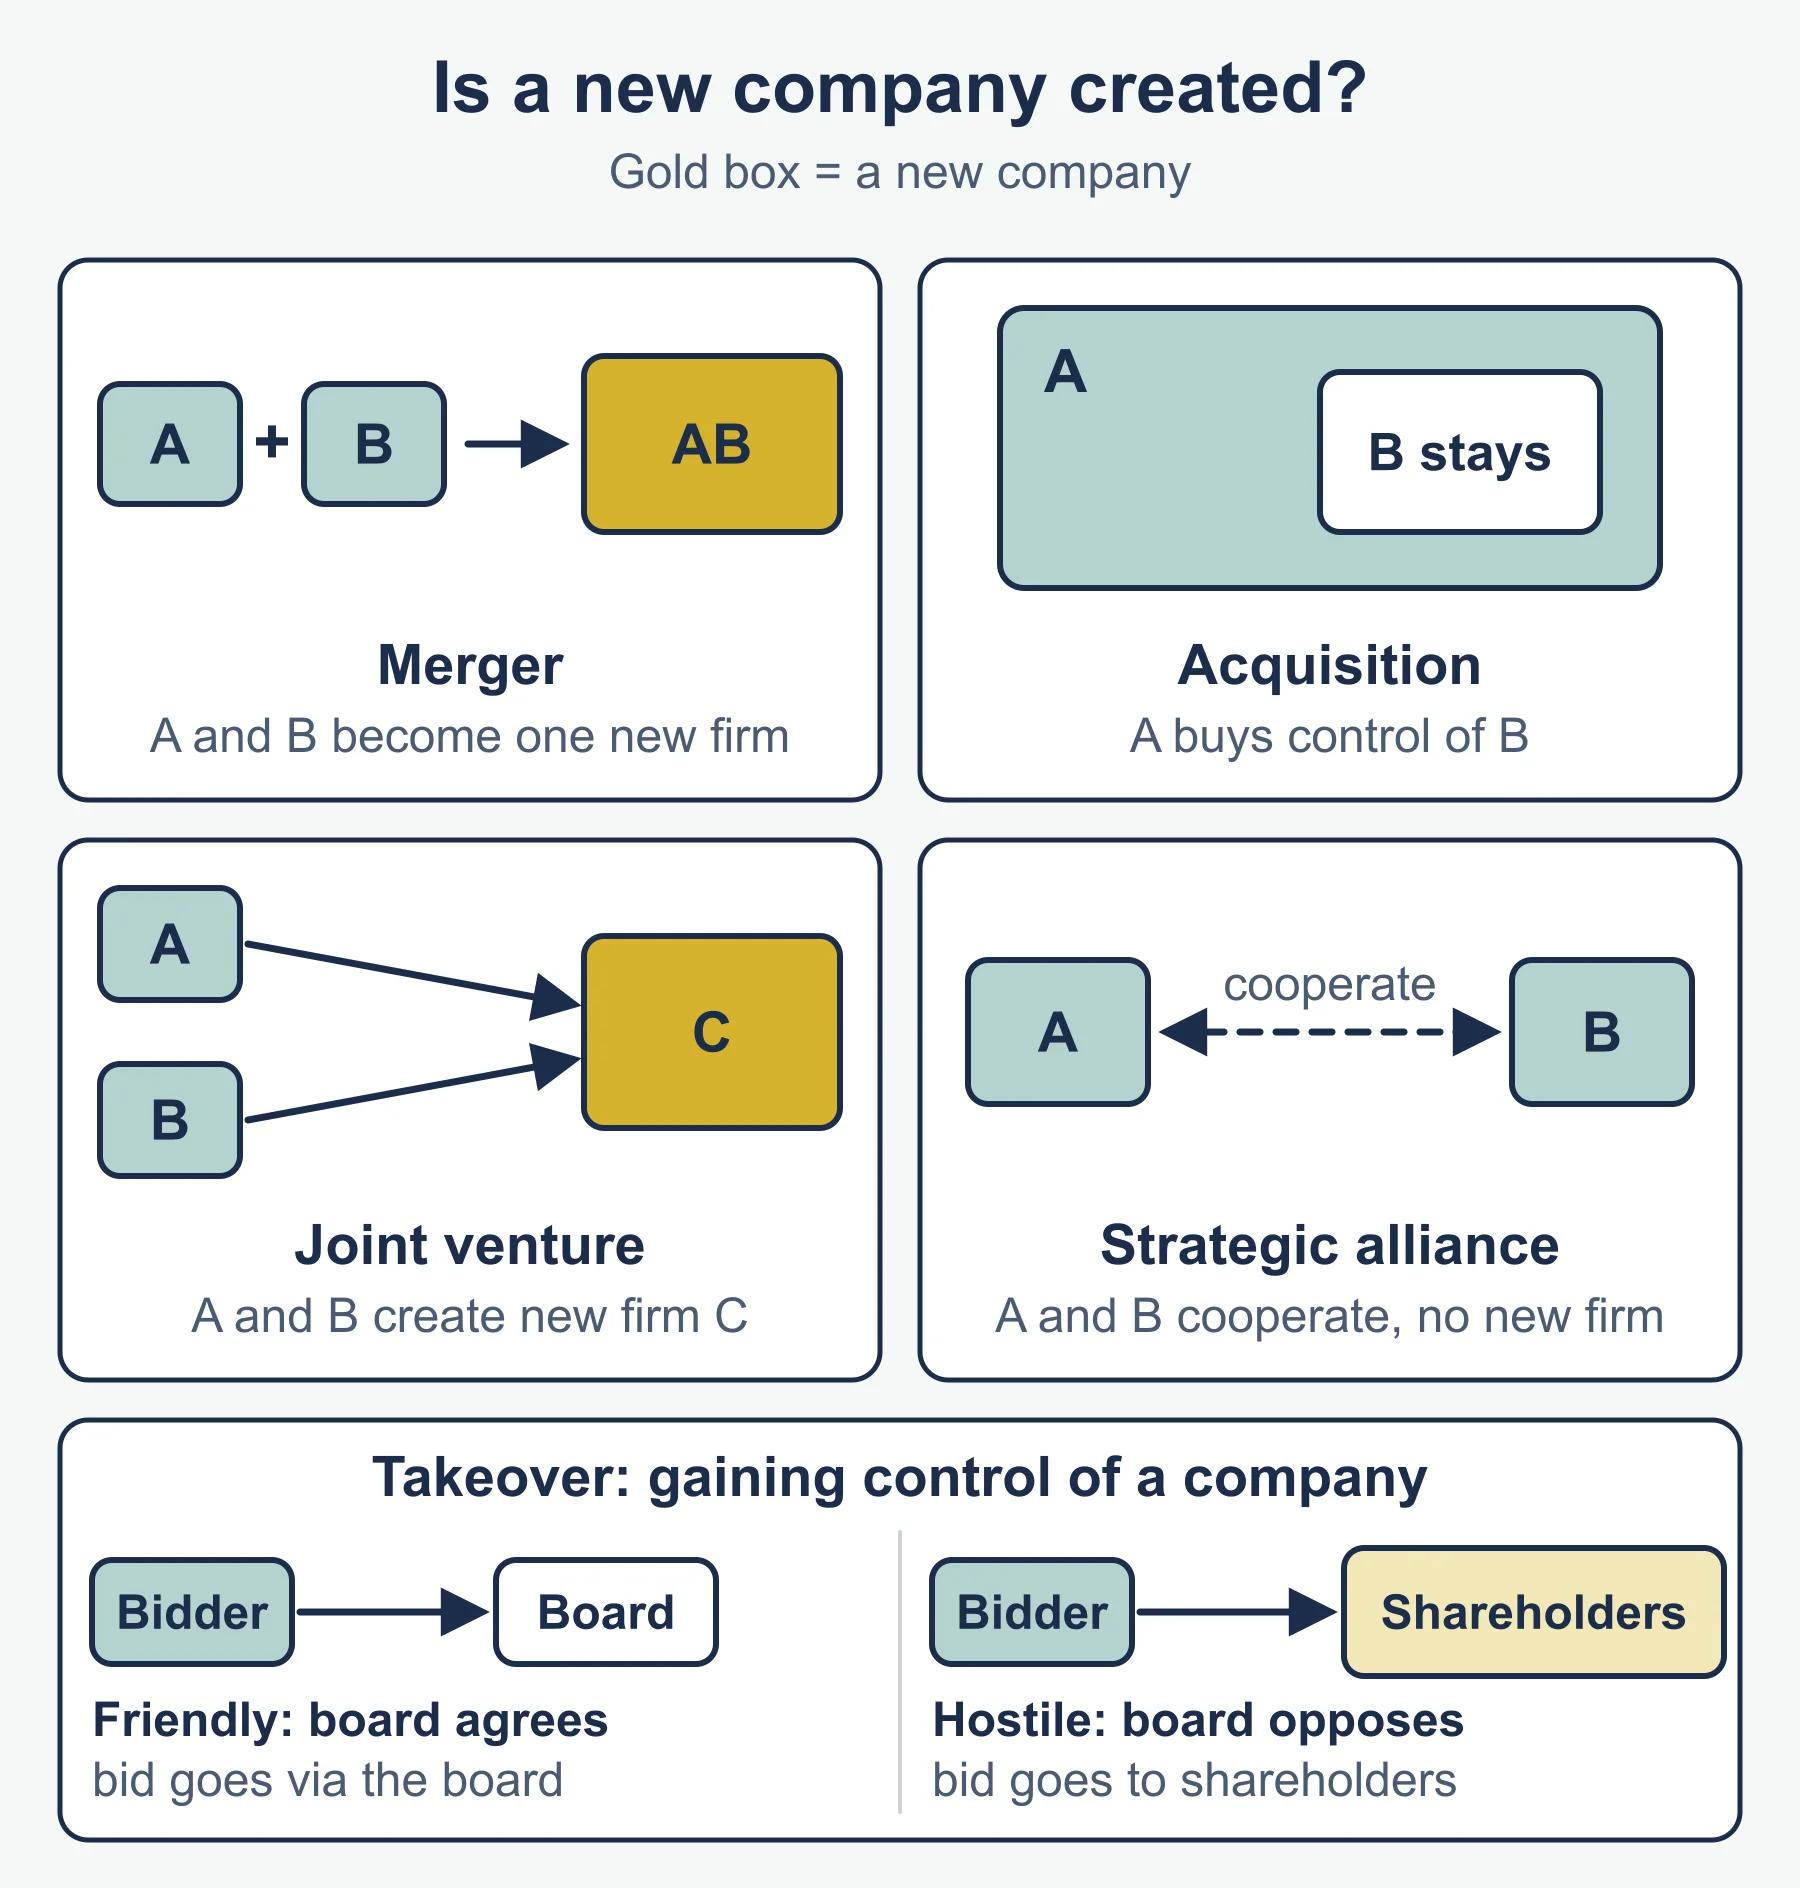
| Method | Standard-form definition | Key advantage | Key risk |
|---|---|---|---|
| Merger | Two firms agree to combine into one new business | Shared costs and strengths | Culture clash |
| Acquisition | One firm buys a controlling share of another | Quick access to market or skills | Overpaying |
| Takeover | Gaining control of a company by buying its shares; friendly or hostile | Speed and control | Resistance and low morale if hostile |
| Joint venture | Separate new entity owned jointly by the partners | Shared cost, risk and local knowledge | Disputes, loss of know-how |
| Strategic alliance | Cooperation without a new entity | Flexible, easy to exit | Weak commitment |
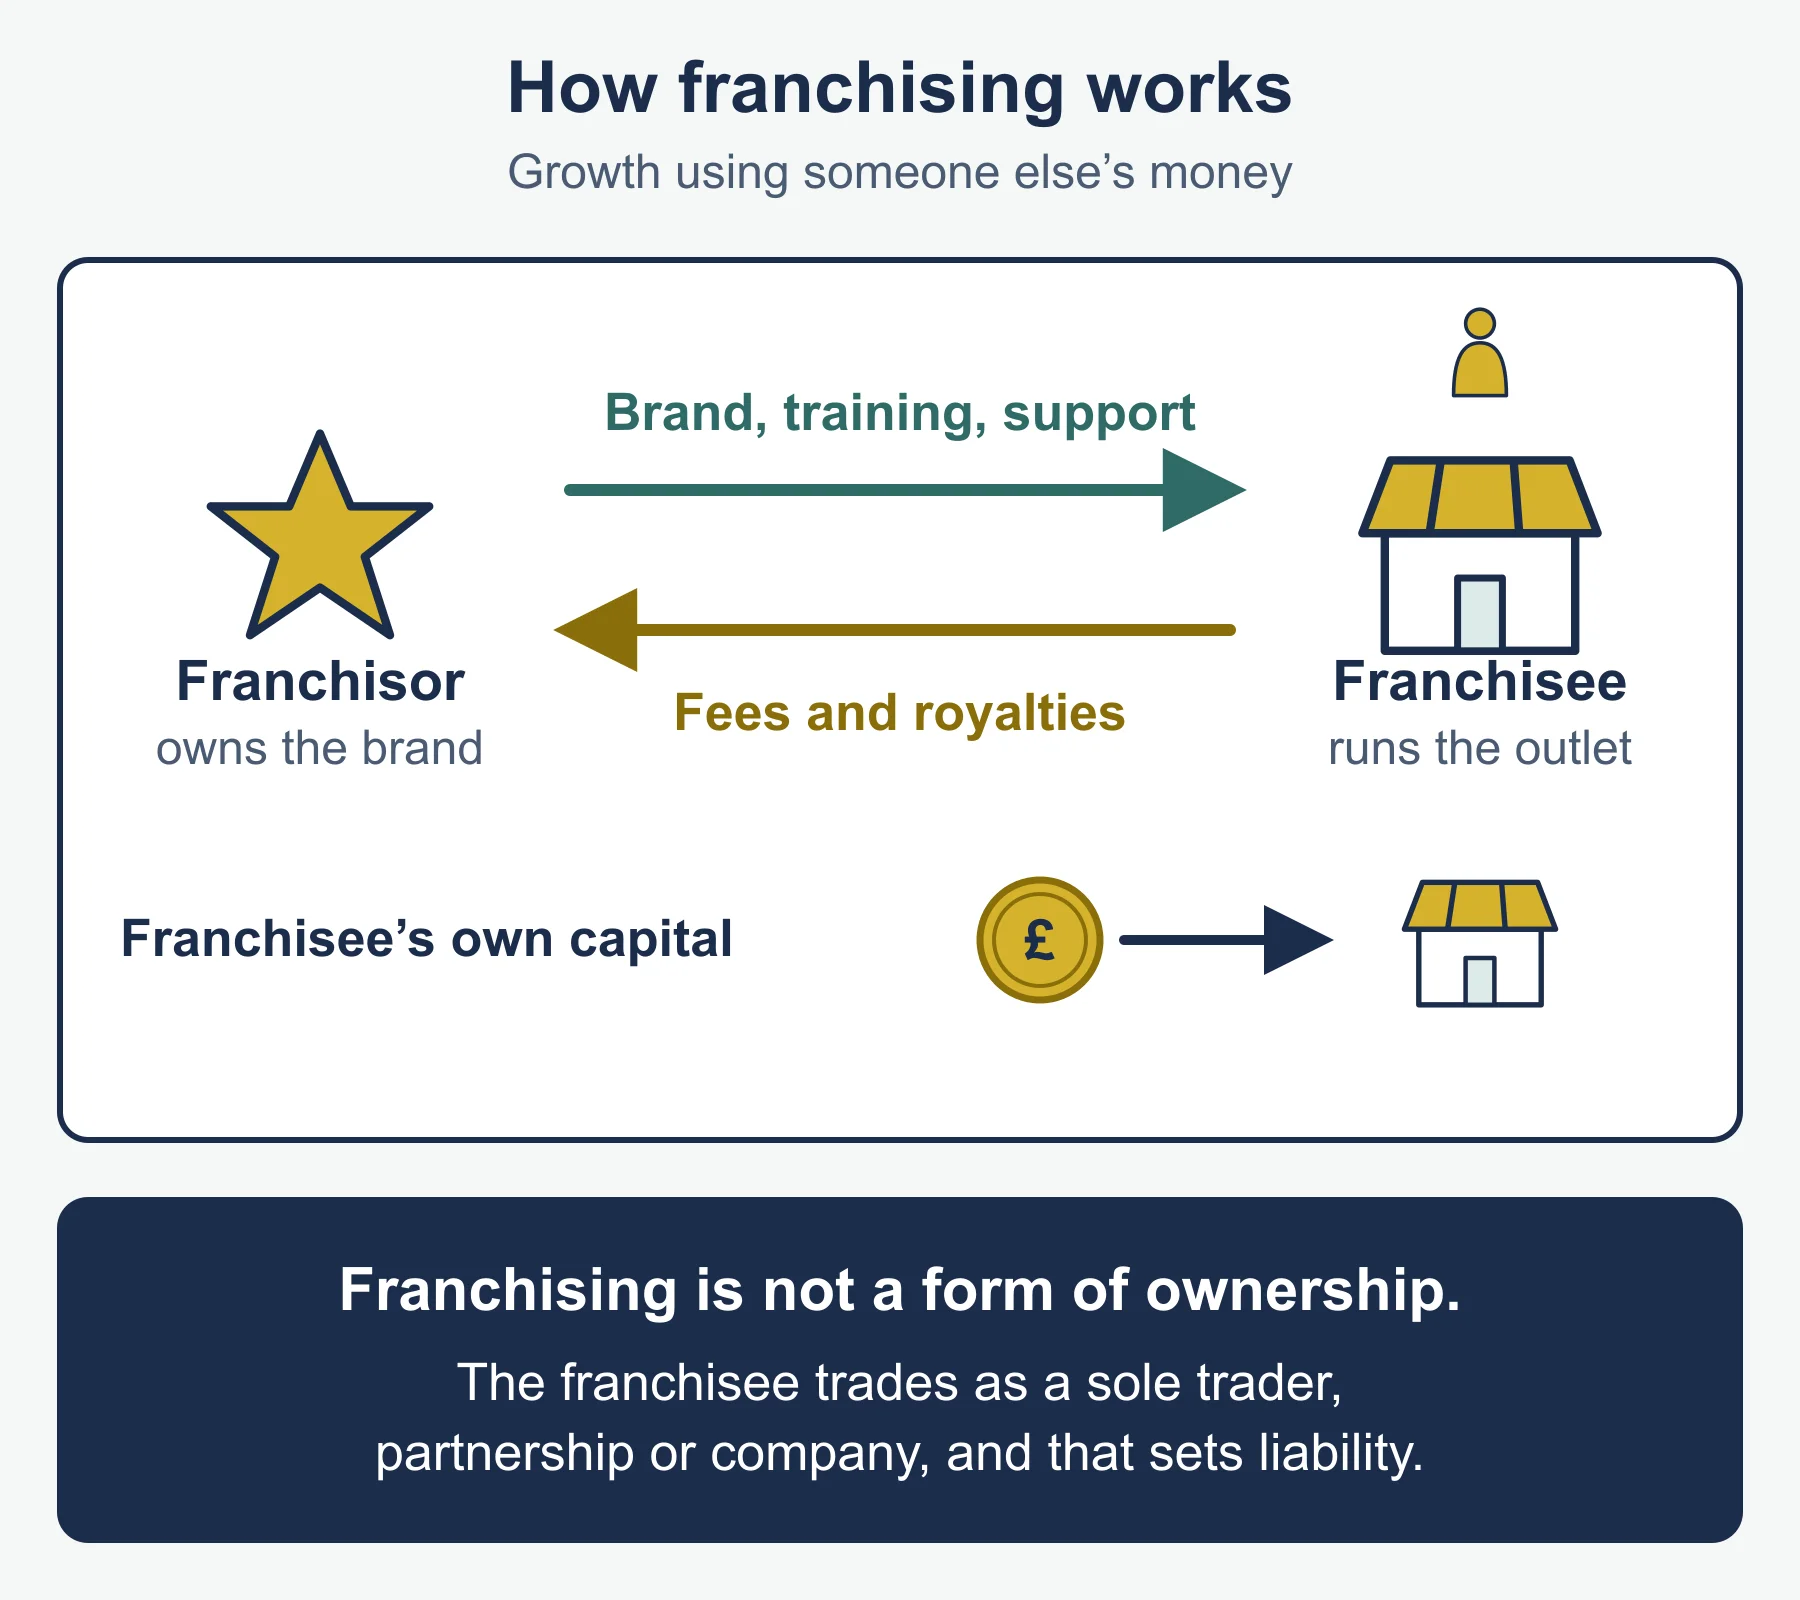
| Franchising | Franchisor licenses brand and methods; franchisee pays fee and royalty | Fast growth with others’ capital | Brand damage, loss of control |
Distinctions to know cold
- Merger (agreed combination) versus takeover (control gained, possibly against the board’s wishes).
- Joint venture (new entity, shared ownership) versus strategic alliance (agreement only, no new entity).
- Franchisor (owns brand, receives fees) versus franchisee (runs the outlet, pays fees).
Method in steps: evaluating a growth method
- Name the method and the case’s objective, for example more market share.
- Give one advantage with a number or fact from the case.
- Give one limitation, again from the case.
- Compare with at least one alternative, such as organic growth.
- Judge, with a criterion (cost, speed, risk, fit) and a short reason.
Worked reminder: franchise and joint venture
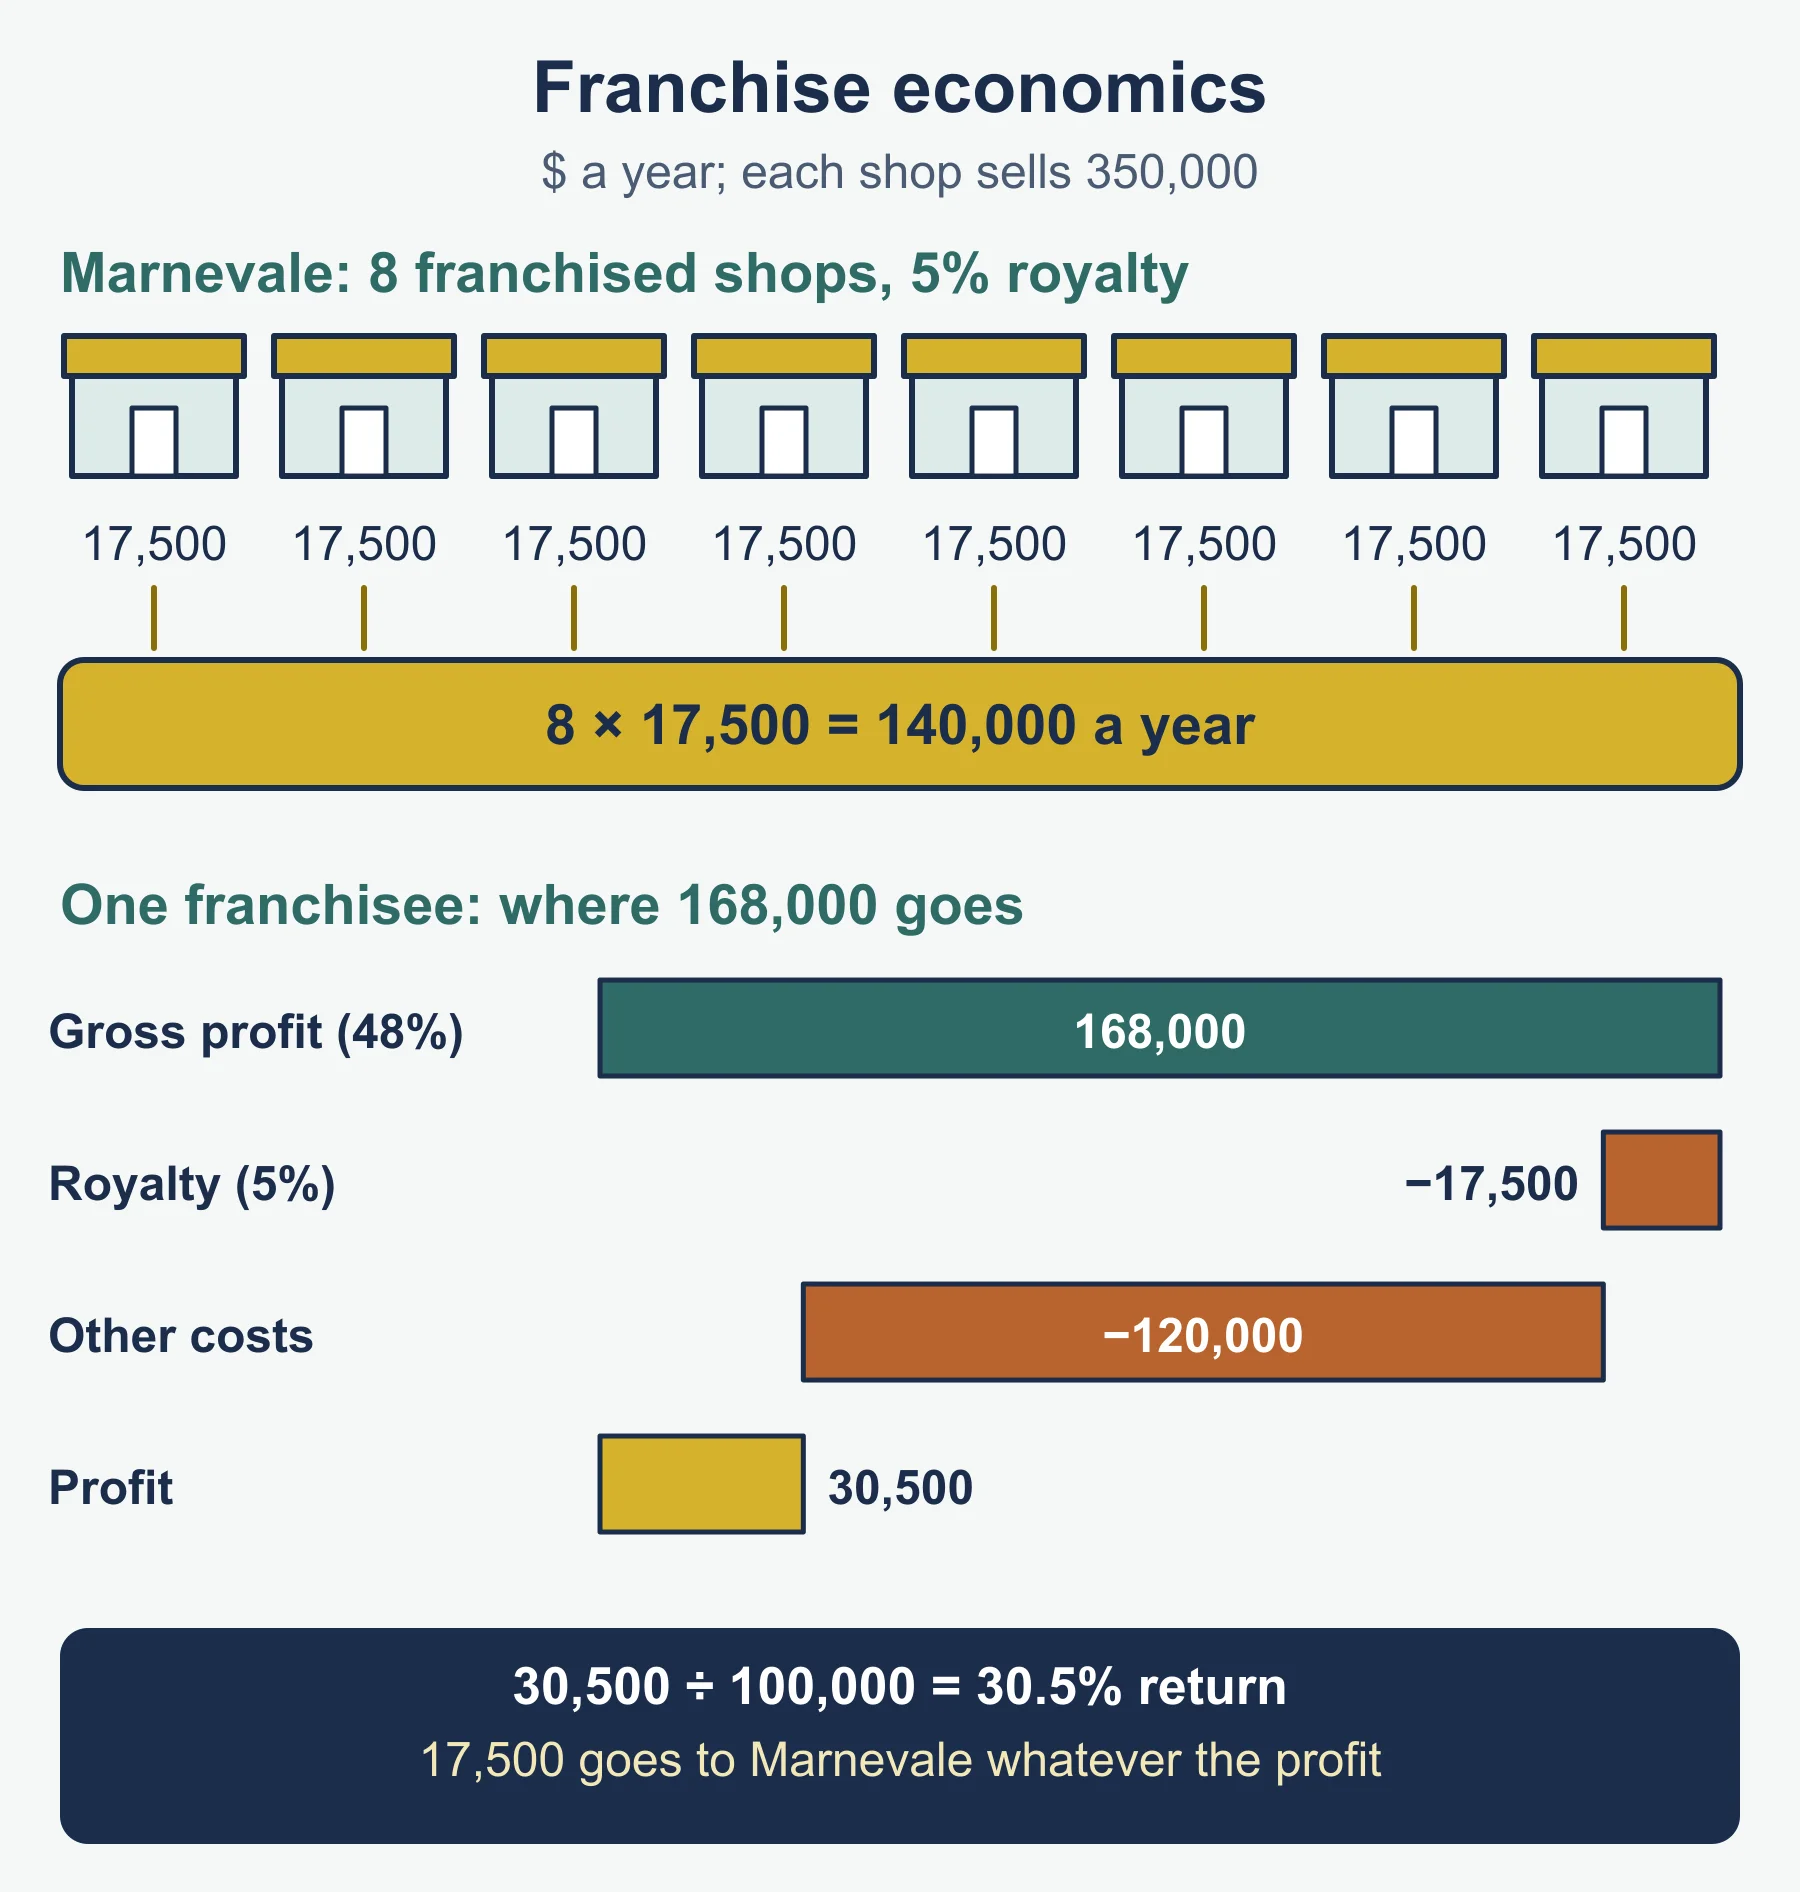
Dorrowmere Scoops, a franchisor, has four outlets with annual sales of 250,000 each (all in $) and charges a 6% royalty: 4 x 250,000 x 6% = 60,000 a year.
A joint venture earns 2.5m profit and is owned 60% by one partner and 40% by the other: 2.5 x 0.6 = 1.5m and 2.5 x 0.4 = 1.0m.
1.6 Impact of MNCs on host countries
An MNC has operations in more than one country; the host country is where it sets up. Every answer needs both sides and a verdict.
| Area | Possible positive | Possible negative |
|---|---|---|
| Employment | Jobs, wages, training | Low pay, insecure jobs, closure threats |
| Investment | Capital, technology | Profit sent abroad |
| Government | Tax revenue, export earnings | Tax avoidance, political influence |
| Local business | Supplier contracts | Local firms lose to bigger rivals |
| Consumers | More choice, often lower prices | Pressure on traditional products |
| Society and environment | Skills transfer, cleaner methods | Cultural change, pollution |
Worked reminder
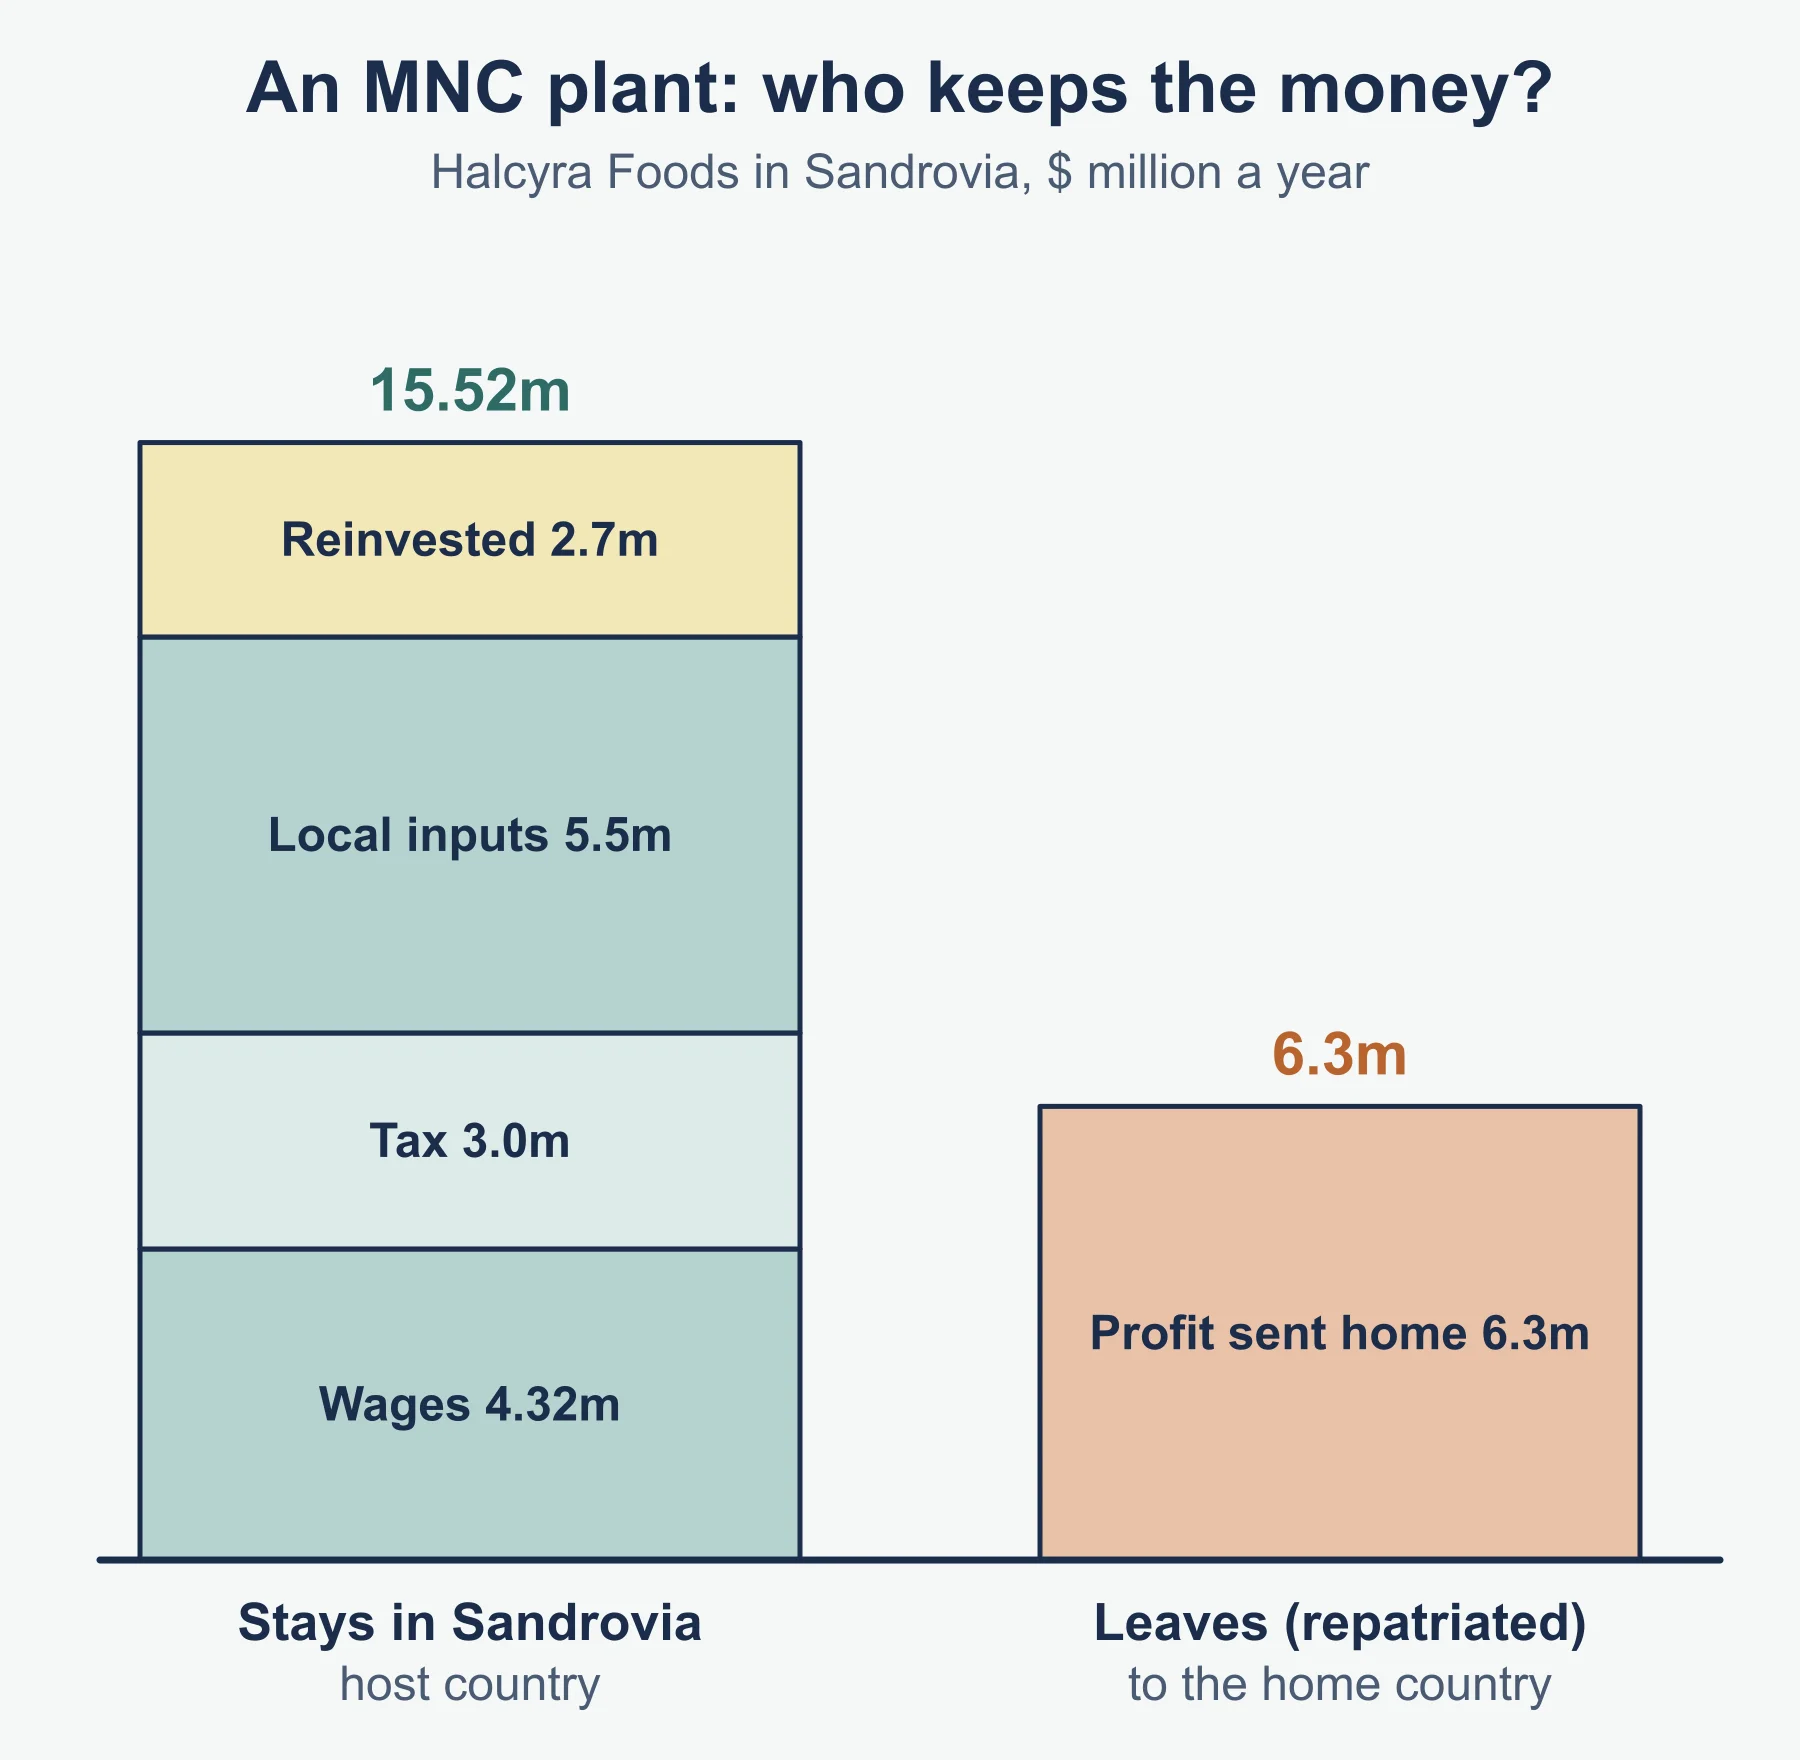
A mining MNC in a host country makes 18m profit (in $). Tax at 30% takes 5.4m, leaving 12.6m. If 60% is repatriated, 7.56m leaves and 5.04m is reinvested. Tax and reinvestment total 10.44m that stays in the host country, but the 7.56m leaving is significant. The judgement depends on wages, environmental costs and how long the mine lasts.
Method in steps: evaluating MNC impact
- Pick the stakeholders (workers, government, local firms, communities).
- Give one benefit and one cost for at least two of them.
- Quantify when the case allows.
- Weigh short term against long term.
- Judge using a criterion such as long-term benefit to the host economy.
Quick self-test
- Define “economies of scale”.
- Total cost is 50,000 at 2,000 units and 66,000 at 3,000 units. Calculate the average cost at each output.
- Is a cluster of specialist suppliers near a port an internal or external economy?
- Name one internal diseconomy of scale.
- State two reasons a business might choose to stay small.
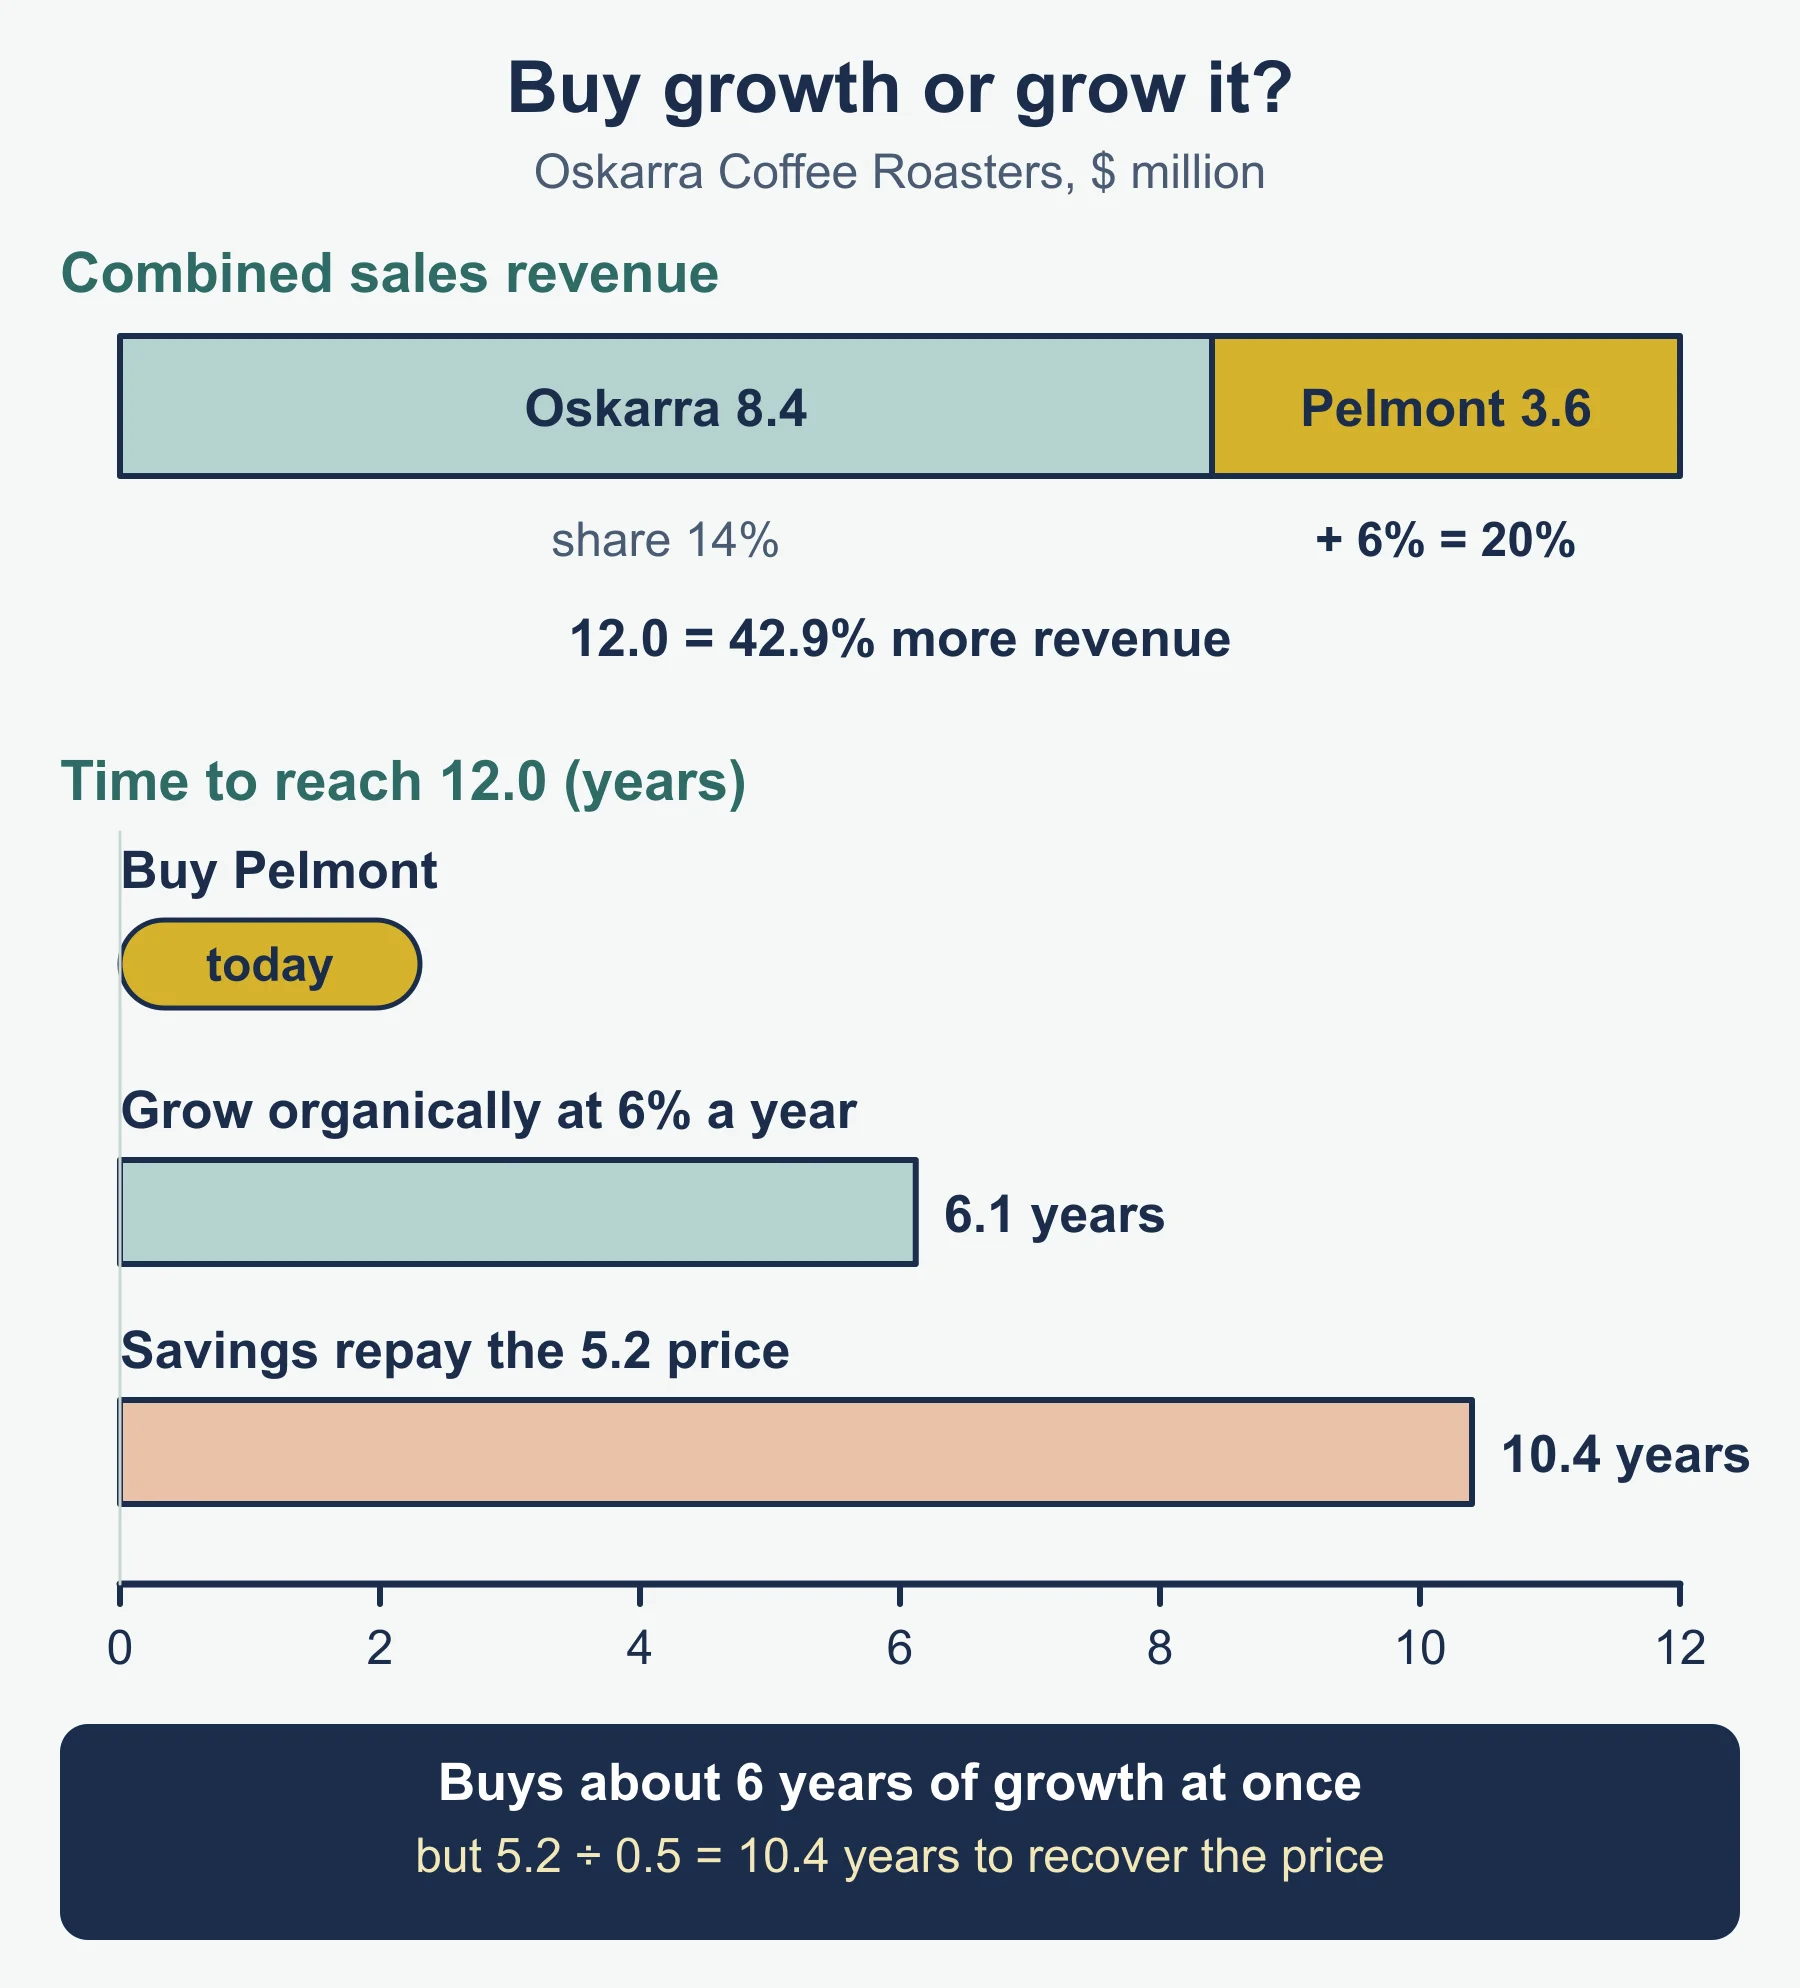
- A firm’s market share is 22% and it merges with a firm that has 9%. State the combined share.
- Distinguish a joint venture from a strategic alliance.
- A franchisor charges 6% royalty. Calculate the royalty on sales of 250,000.
- Sales rise from 20m to 23m. Calculate the percentage growth.
- State one possible cost of an MNC to a host country.
Answers
- Falls in average (unit) cost as output rises.
- 50,000 / 2,000 = 25.00; 66,000 / 3,000 = 22.00, so average cost falls.
- External, because it comes from the industry cluster.
- For example slower communication, poor coordination or lower motivation.
- For example keeping control, serving a niche or avoiding debt.
- 22% + 9% = 31%.
- A joint venture creates a new jointly owned entity; an alliance is an agreement with no new entity.
- 250,000 x 6% = 15,000.
- (23 - 20) / 20 = 15.0%.
- For example profits repatriated, local firms displaced or environmental damage.
Where marks are usually lost
- Naming a type of economy of scale but never connecting it to the case.
- Calling a cost rise a diseconomy when output has not risen.
- Writing “bigger is better” about growth without costs or risks.
- Treating takeovers, joint ventures and alliances as the same thing.
- Describing franchising from the franchisor’s side only.
- Answering “evaluate” or “justify” with a list and no verdict.
- Giving only positives or only negatives for an MNC.
- Quoting figures from the stimulus without saying what they show.
- Dropping the unit or the % sign from a result.
Frequently asked questions
How do you tell an internal economy of scale from an external one? Ask whether the saving would vanish if this one firm shrank (internal) or if the whole industry or area shrank (external). Bulk buying is internal; a skilled labour pool in a cluster is external.
How do you calculate average cost to show economies of scale? Average cost is total cost divided by output. If average cost falls as output rises, the business is gaining economies of scale; if it rises with output, diseconomies are appearing.
What is the difference between a merger and a takeover? A merger is an agreed combination of two firms into one new business. A takeover is gaining control of a company, often by buying enough of its shares, possibly against its board’s wishes.
What is the Ansoff Matrix? The Ansoff Matrix sorts growth into market penetration, product development, market development and diversification. It is a suggested tool for Unit 1, and risk rises as a business moves further from its existing products and markets.
Official syllabus
IB Diploma Programme Business management guide (first assessment 2024), International Baccalaureate Organization, Unit 1, sections 1.5 and 1.6.
Get free revision emails (optional)
Occasional emails with practice questions, worked explanations and links to free resources for the qualification and subjects you choose. No spam, and you can unsubscribe from any email. The free tools on this site never need an email.
Related resources
-
Study guides
IB DP Business Management: Stakeholders
Study guide to internal and external stakeholders and conflict between stakeholders for IB DP Business Management, section 1.4, with two worked cases.
Business · International Baccalaureate · IB
Read guide -
Practice questions
IB DP Business Management: Stakeholders – Practice Questions
Original practice questions with worked answers on internal and external stakeholders and stakeholder conflict, IB DP Business Management section 1.4.
Business · International Baccalaureate · IB
Try questions -
Revision notes
IB DP Business Management: Stakeholders – Revision Notes
Condensed revision notes on internal and external stakeholders and stakeholder conflict for IB DP Business Management section 1.4, with a self-test.
Business · International Baccalaureate · IB
Revise topic
Related articles
-
teaching
A Level tuition in Dubai: Cambridge or Pearson Edexcel International A Level?
Schools in Dubai and Abu Dhabi teach either Cambridge International AS & A Level or Pearson Edexcel International A Level. How the two are structured, why it matters for tuition, and how online classes from Lahore work.
9 October 2026
-
curriculum guides
Choosing subjects at IGCSE and A Level
How subject choices at 14 and 16 affect university options later, and how to keep pathways open without overloading a timetable.
28 July 2026
Studying this with a teacher
Working through Business IB?
This page is free and stays free. If you would rather be taught it, Marlbridge runs Business classes one-to-one, online in your own time zone. The first trial class is free. WhatsApp replies within an hour (8am–11pm Pakistan time, every day); email the same day.
IB Business teachers at Marlbridge

