
Study Guides
IB DP Business Management: Profitability and liquidity ratio analysis and Efficiency ratio analysis (HL only)
IB DP Business Management study guide to profitability, liquidity and HL efficiency ratios, with worked examples, strategies and insolvency.
- Subject
- Business
- Level
- IB
- Topic
- Unit 3: Finance and accounts
- Author
- Marlbridge Academic Team
- Updated
- Reviewed by
- Salman Ahmad (what this means)
Aligned to International Baccalaureate IB Diploma Programme Business (DP Business Management), First assessment 2024. Official specification .
Syllabus page (what it covers and how it is assessed): IB Diploma Programme Business.
Syllabus points this page covers
DP Business Management
- 3.5 Profitability and liquidity ratio analysis
- 3.6 Efficiency ratio analysis (HL only)
Found an error? Report a correction.
Need help with this topic? Request a free trial class for IB Diploma Programme Business (DP Business Management).
This guide covers sections 3.5 (Profitability and liquidity ratio analysis) and 3.6 (Efficiency ratio analysis, HL only) of the IB Business management guide, first assessment 2024. Section 3.5 applies at SL and HL. Section 3.6 carries the HL only label. The guide lists these skills at AO2 and AO4 for the calculations and AO3 for the strategies, so you need to calculate, interpret and recommend.
All money figures in the examples are in dollars. The businesses are invented. For the rest of the unit, use the Unit 3 overview and the Unit 3 revision notes. For the course map, see the Business Management hub and the printable checklist. When you have finished, use the revision notes, the practice set and the free diagnostics.
What the guide asks you to do
| Section | Content point | Level |
|---|---|---|
| 3.5 | Gross profit margin, profit margin and ROCE (return on capital employed) | SL/HL |
| 3.5 | Possible strategies to improve the profitability ratios | SL/HL |
| 3.5 | Current ratio and acid test (quick) ratio | SL/HL |
| 3.5 | Possible strategies to improve the liquidity ratios | SL/HL |
| 3.6 | Stock turnover, debtor days, creditor days, gearing ratio | HL only |
| 3.6 | Possible strategies to improve these ratios | HL only |
| 3.6 | Insolvency versus bankruptcy | HL only |
According to the guide’s appendix, students receive a copy of the formulae for the examination. Even so, learn them. You will work faster and you will notice when a number in the stimulus does not fit the formula. In assessment, expect “statement of financial position” where older books say balance sheet, and “statement of profit or loss” for the profit and loss account (also called the income statement).
3.5 Profitability ratios
Profitability ratios compare profit with sales revenue or with the money invested. They answer the question “how well does the business turn its activity or its capital into profit?”
| Ratio | Formula as the guide gives it |
|---|---|
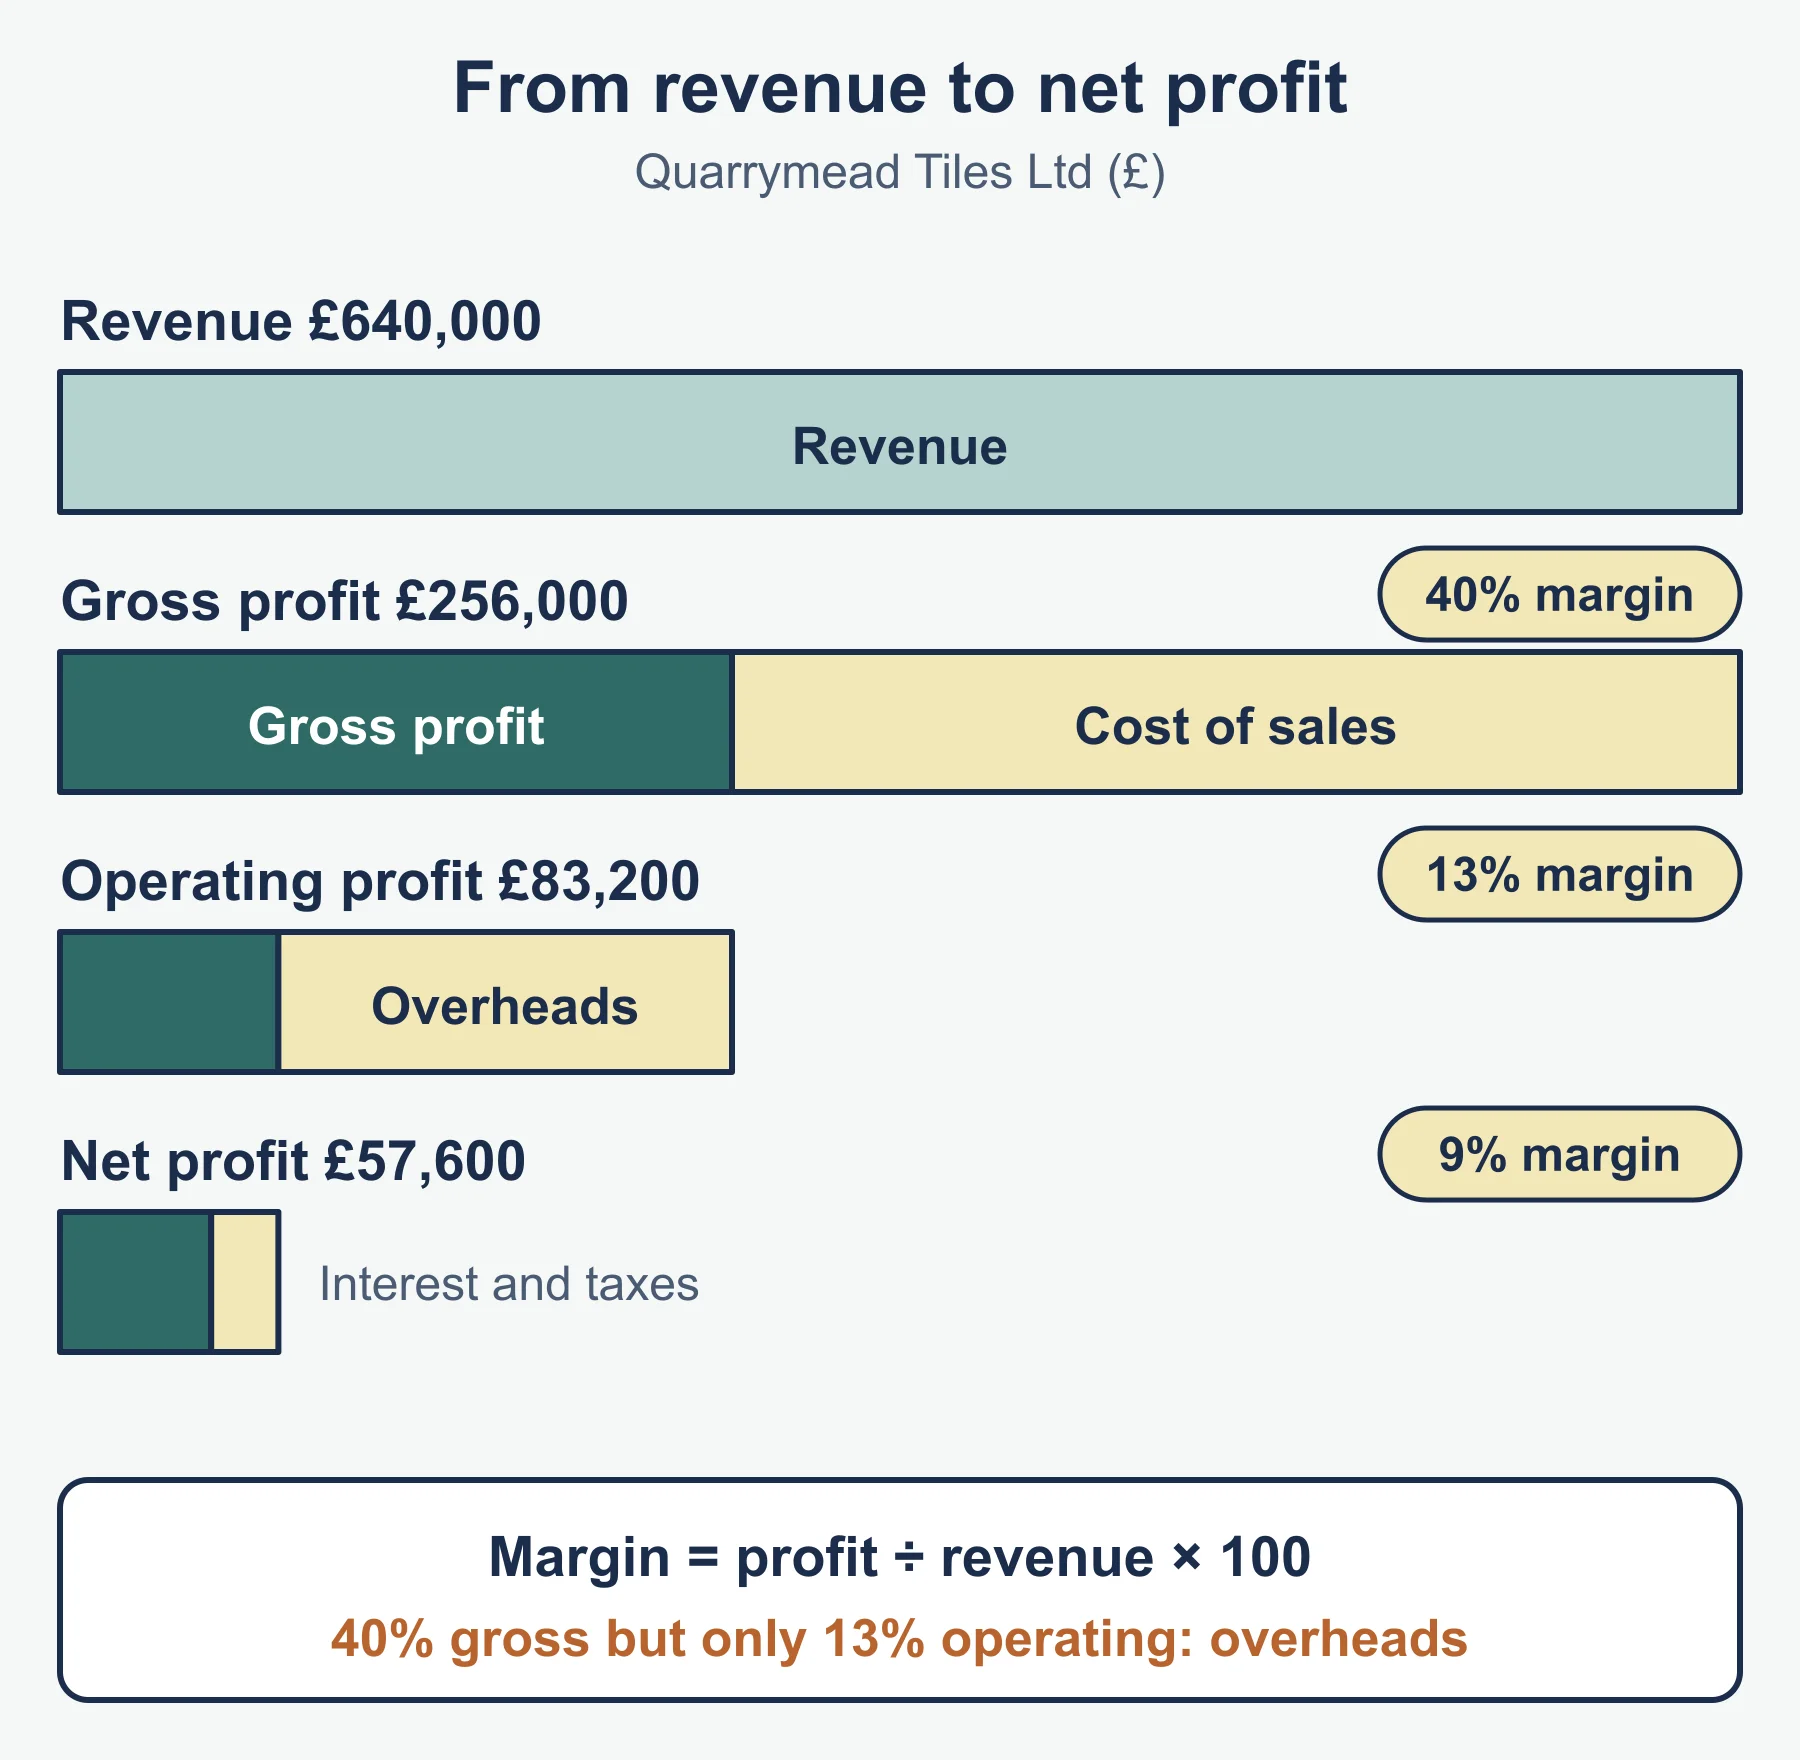
| Gross profit margin | (gross profit ÷ sales revenue) × 100 |
| Profit margin | (profit before interest and tax ÷ sales revenue) × 100 |
| ROCE | (profit before interest and tax ÷ capital employed) × 100 |
Capital employed = non-current liabilities + equity.
Two points catch people out. First, the guide’s profit margin uses profit before interest and tax, not a figure taken after interest. If the stimulus gives several profit figures, pick the one the formula names and say which you used. Second, capital employed comes from the statement of financial position, not from the statement of profit or loss.
Worked example: Vorsley Ceramics Ltd
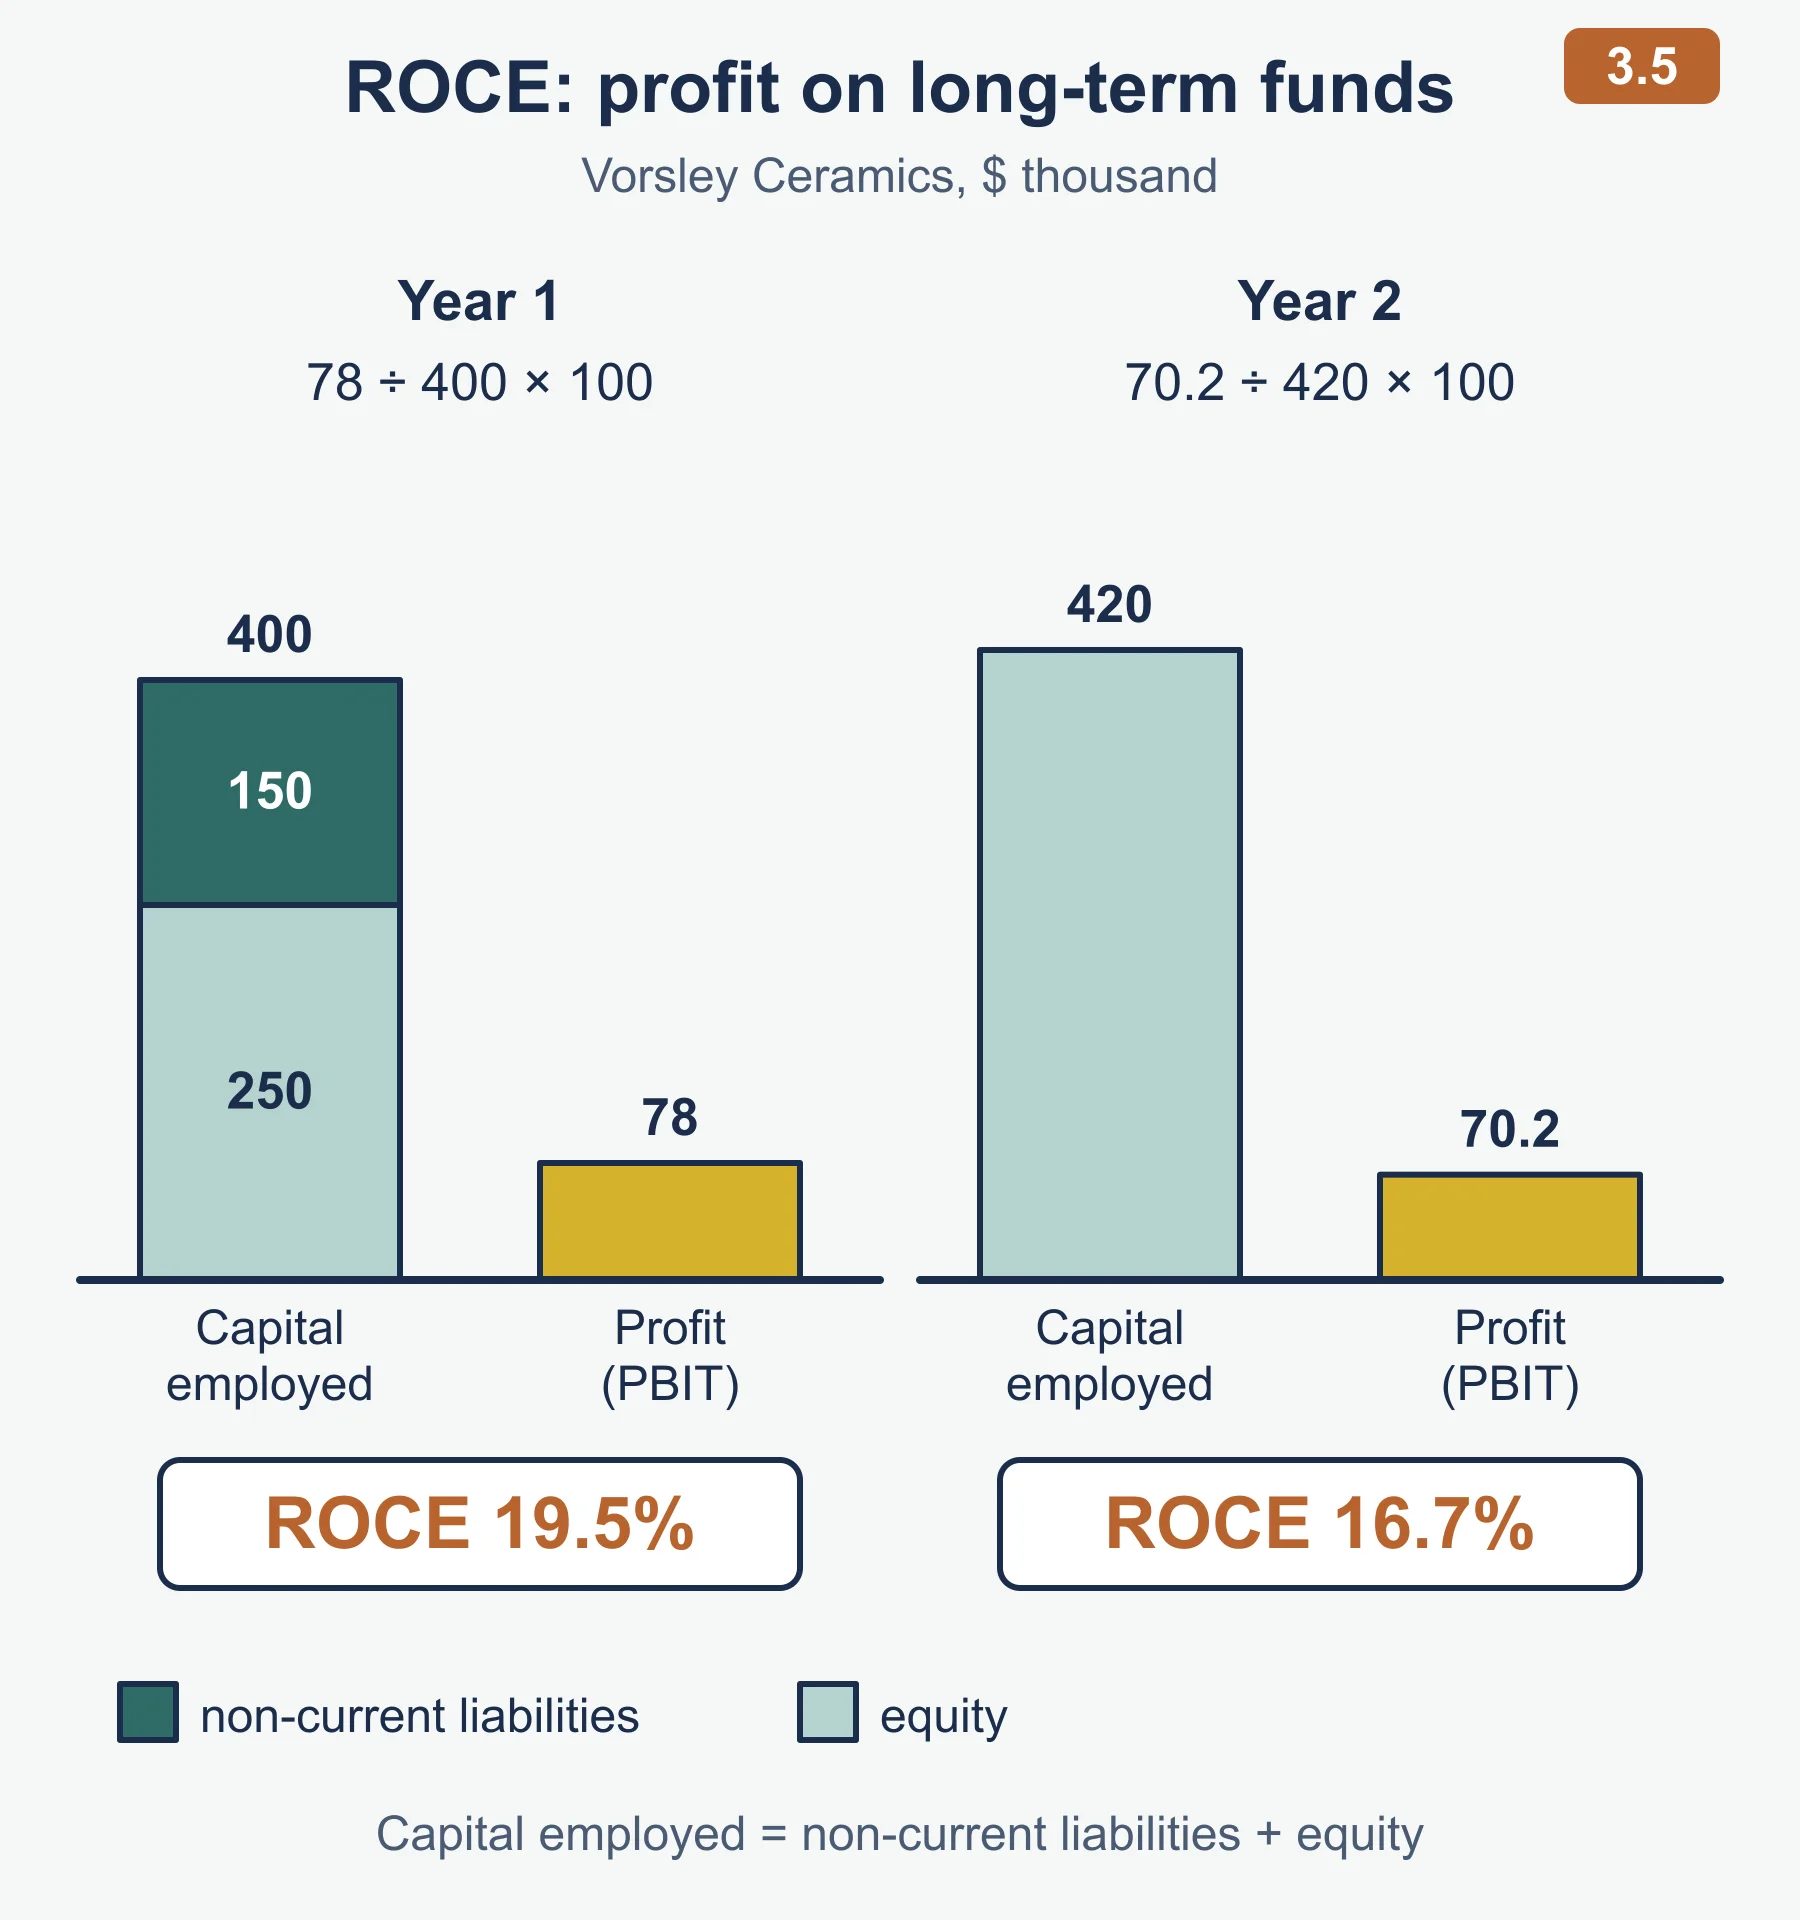
Vorsley’s statement of profit or loss shows sales revenue of 520,000, cost of sales of 312,000 and other expenses of 130,000 (interest is paid separately). Non-current liabilities are 150,000 and equity is 250,000.
Gross profit        = 520,000 - 312,000 = 208,000
Gross profit margin = 208,000 / 520,000 x 100 = 40.0%
Profit before interest and tax = 208,000 - 130,000 = 78,000
Profit margin       = 78,000 / 520,000 x 100 = 15.0%
Capital employed    = 150,000 + 250,000 = 400,000
ROCE                = 78,000 / 400,000 x 100 = 19.5%
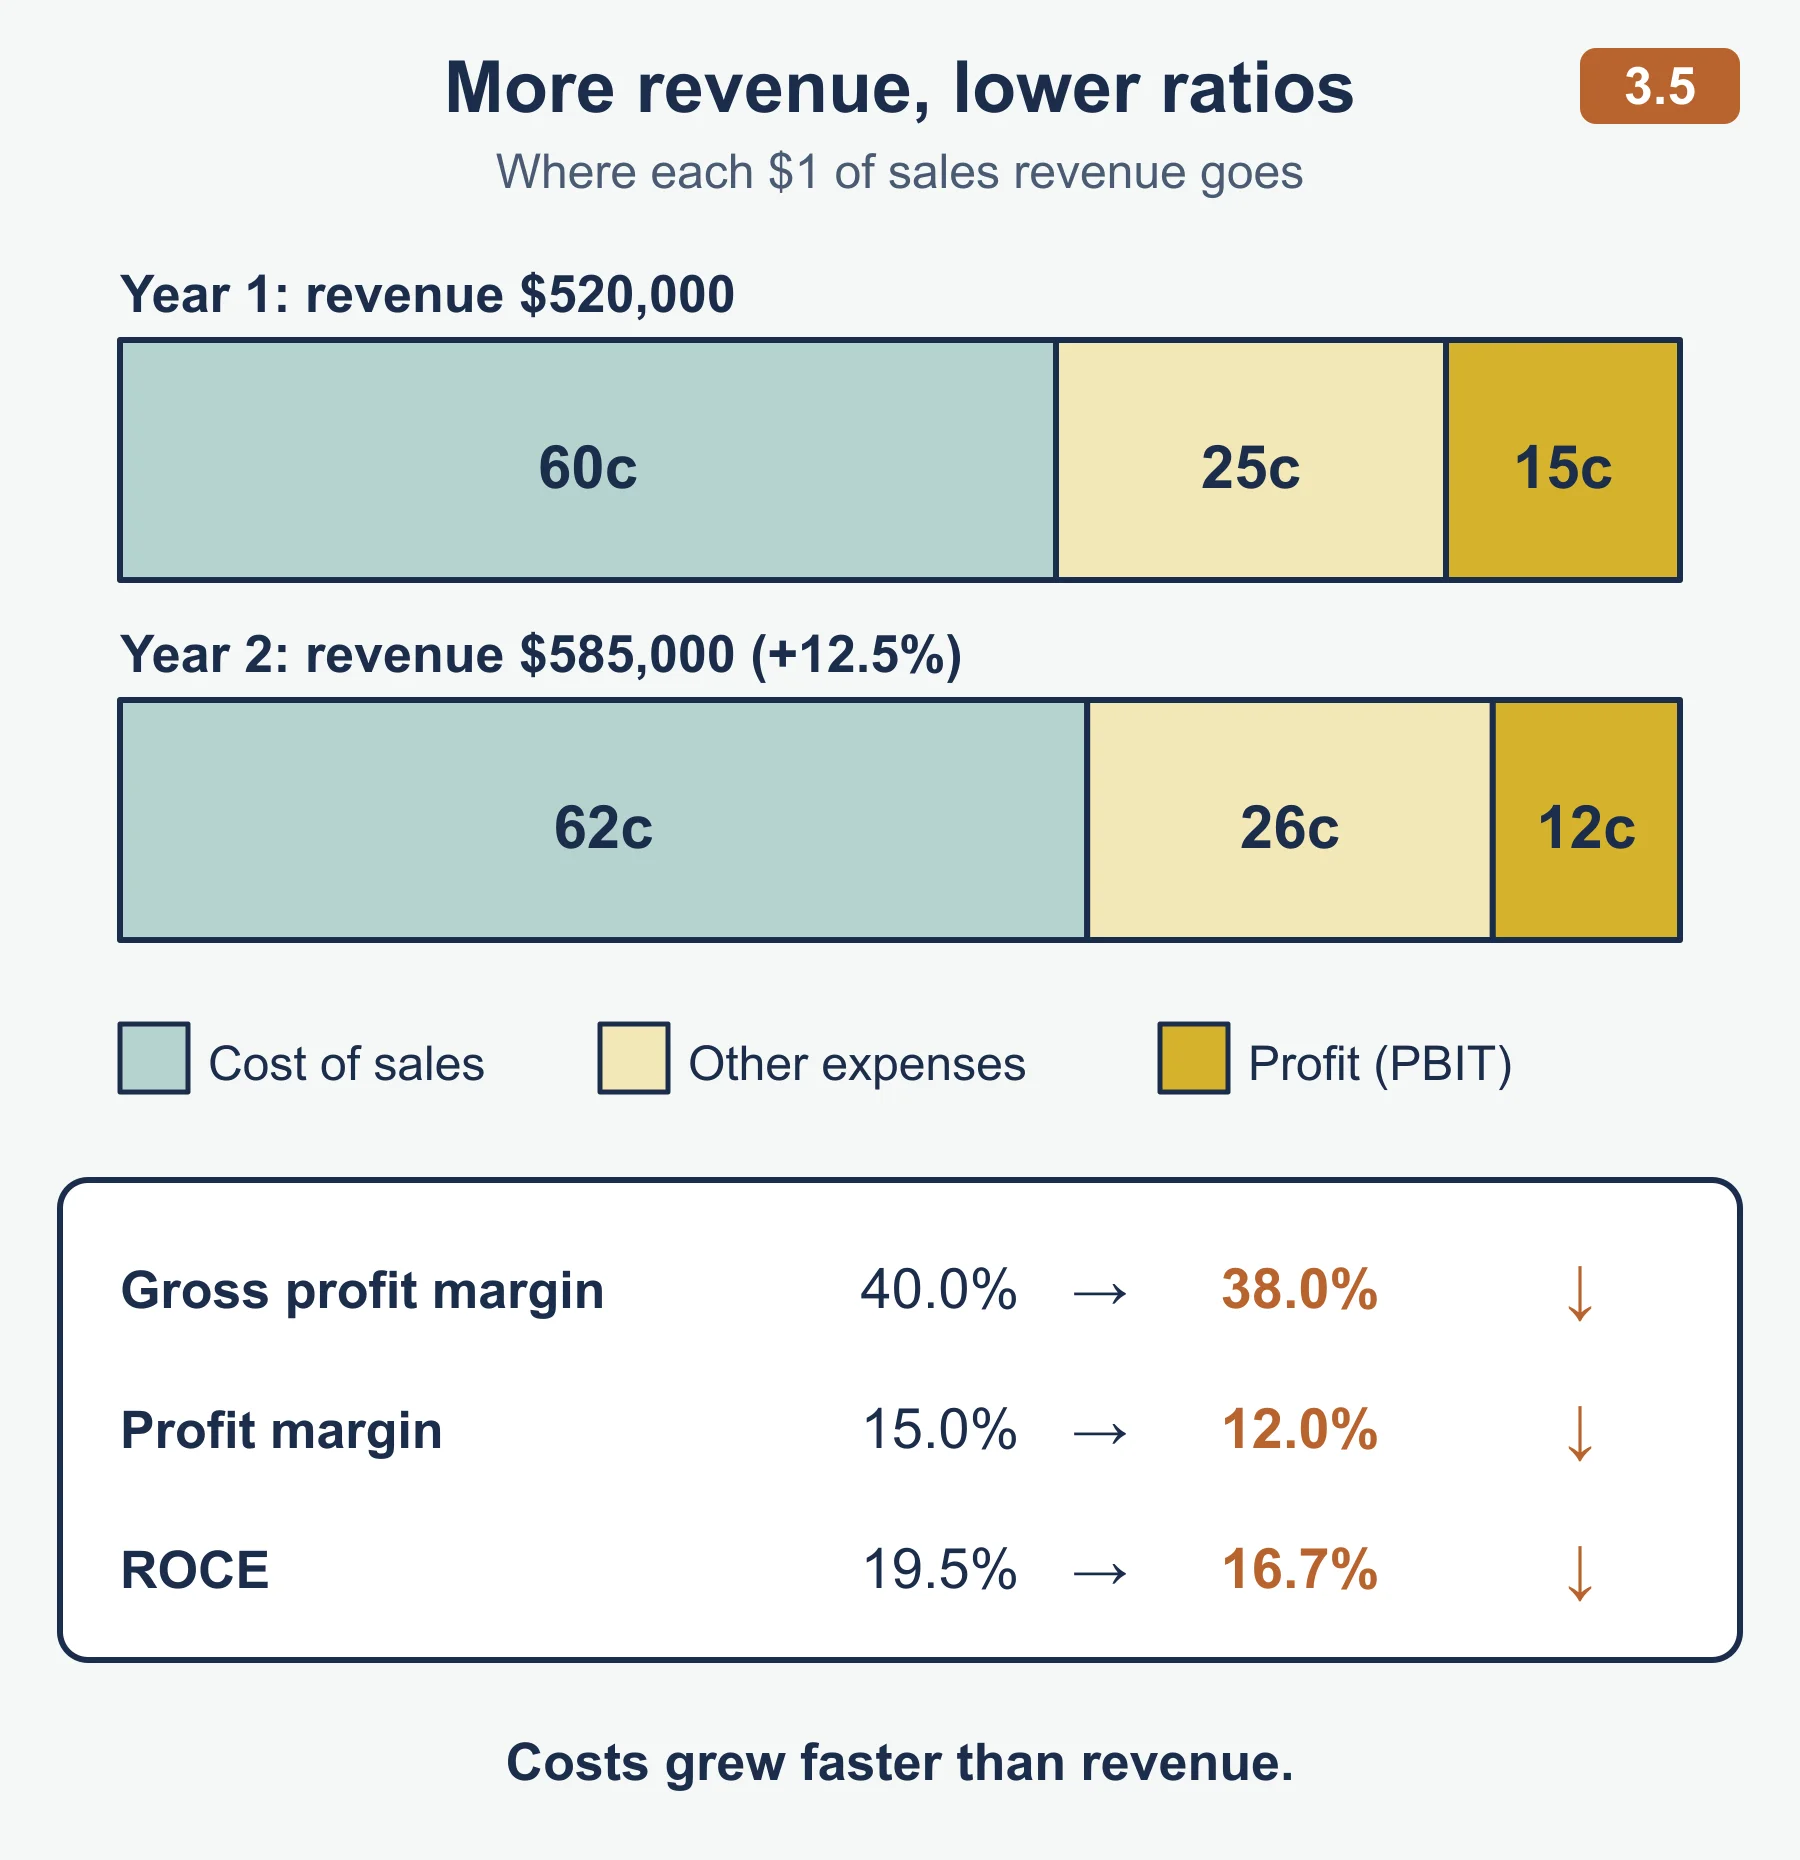
The following year sales revenue rises to 585,000, cost of sales to 362,700 and other expenses to 152,100. Capital employed grows to 420,000.
Gross profit        = 585,000 - 362,700 = 222,300  -> margin 38.0%
Profit before interest and tax = 222,300 - 152,100 = 70,200 -> profit margin 12.0%
ROCE                = 70,200 / 420,000 x 100 = 16.7% (1 d.p.)
Sales revenue grew by 12.5%, yet all three ratios fell. The cost of sales per dollar of revenue rose from 60 cents to 62 cents, and other expenses grew faster than revenue. A good comment says what moved and gives a likely reason from the case. More revenue is not the same as more profit per dollar.
How to read the ratios
- Compare against the business’s own past results, rival firms and its stated objectives. A single ratio on its own tells you little.
- A gross profit margin is affected by price and by the cost of sales. A profit margin also reflects overheads.
- ROCE links profit to the long-term funds used. A business with a healthy margin can still show a weak ROCE if it uses a lot of capital.
- Ratios come from accounts, and accounts rest on choices such as how assets are valued, so some results are more open to interpretation than others.
Strategies to improve profitability ratios
| Aim | Possible strategies | Trade-off to mention |
|---|---|---|
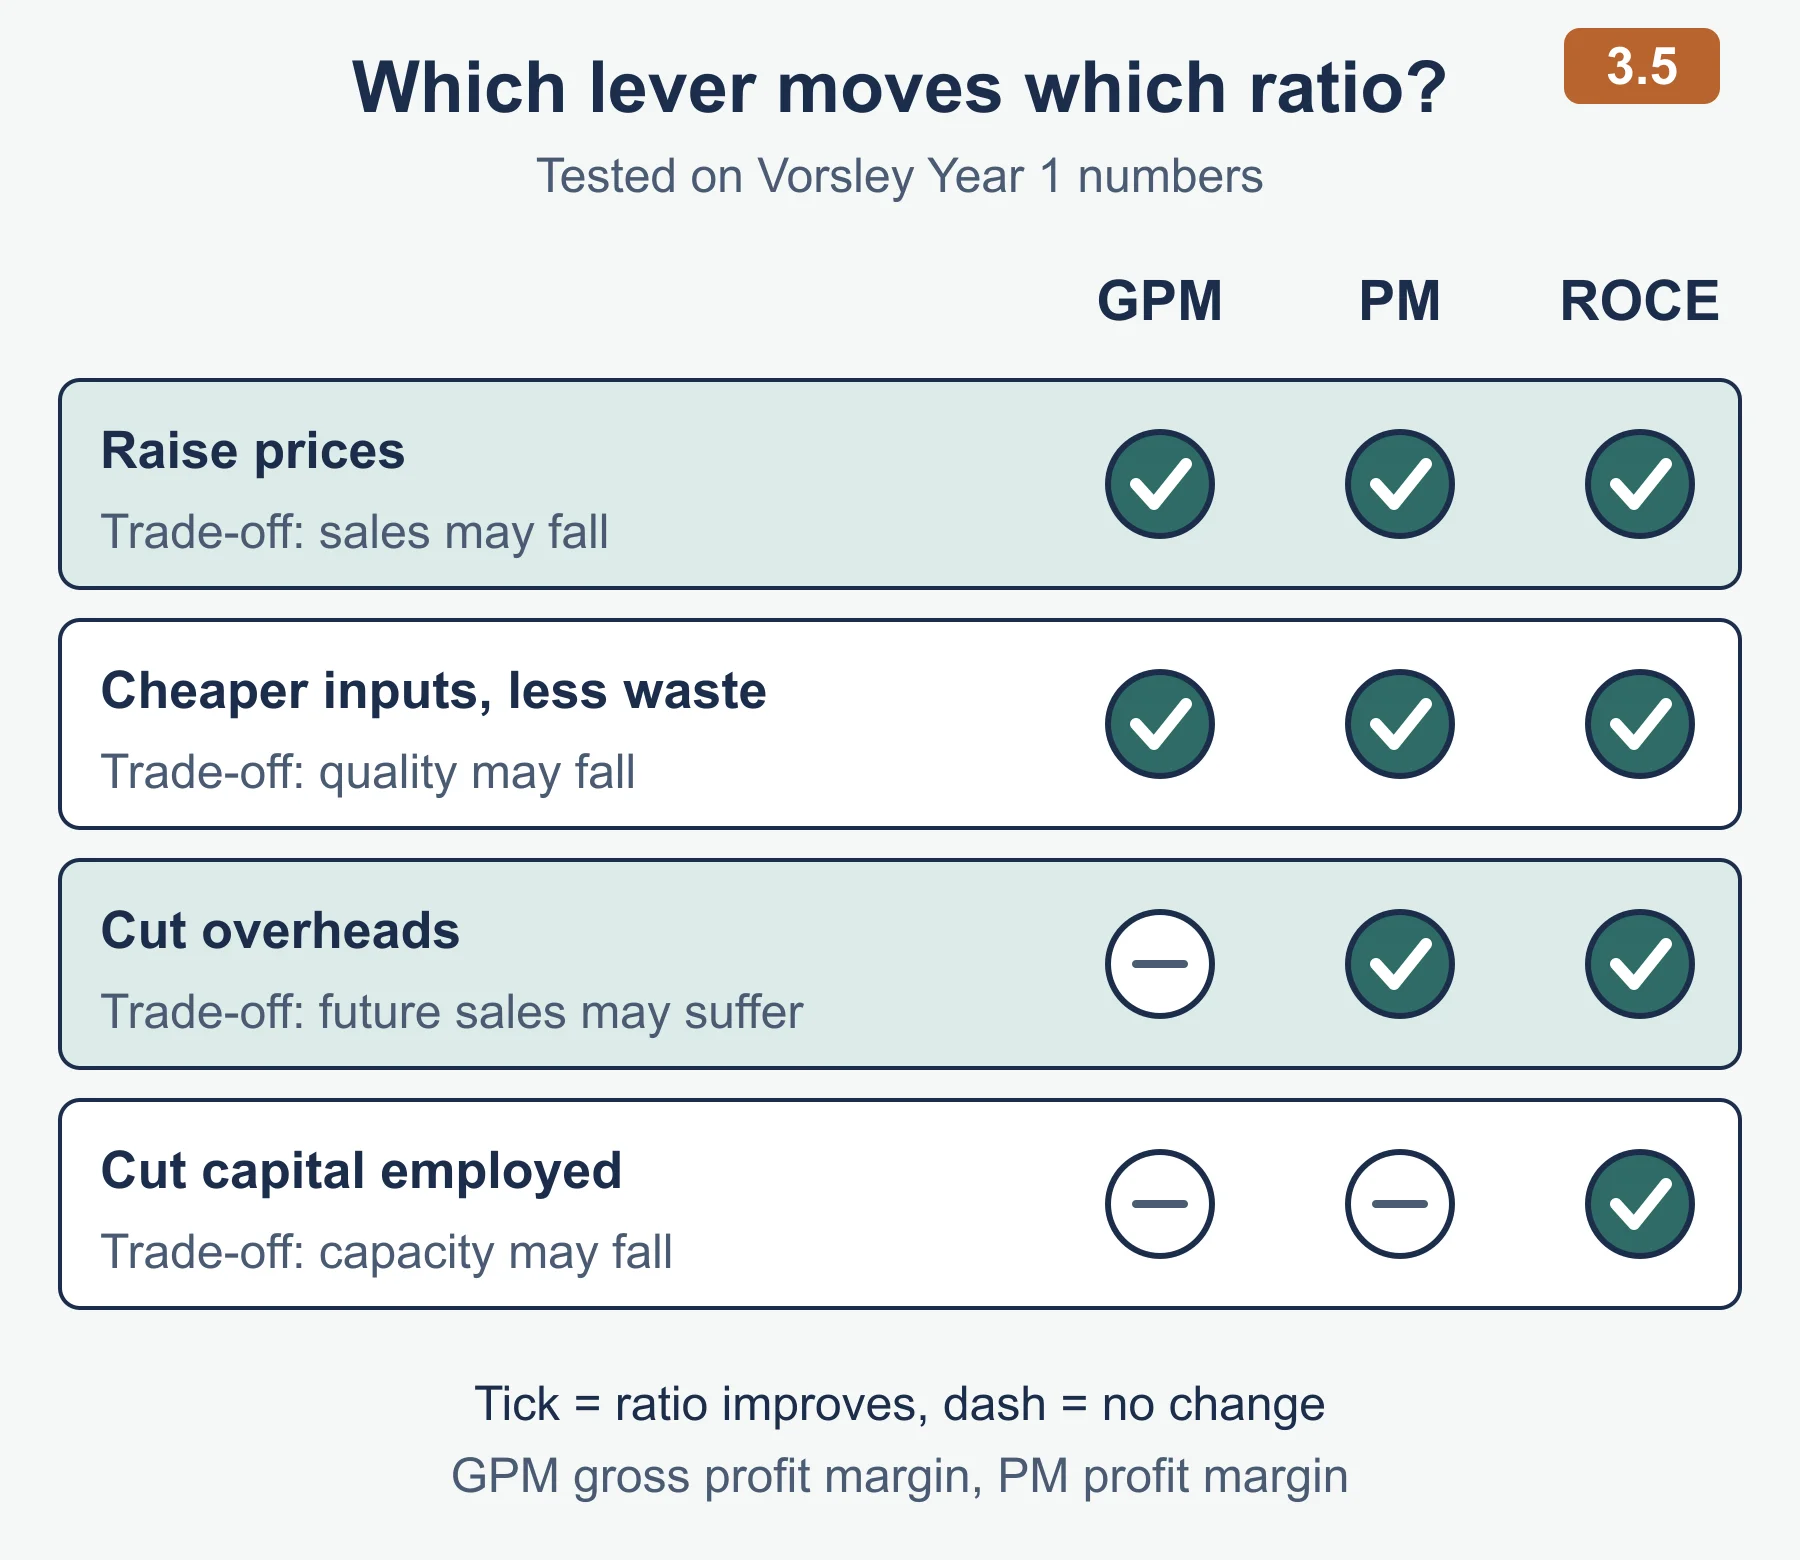
| Raise gross profit margin | Raise prices; negotiate cheaper inputs; change the product mix toward higher-margin items; reduce waste in production | Higher prices may cut sales volume; cheaper inputs may reduce quality |
| Raise profit margin | Everything above, plus cut overheads such as rent, energy or administration | Cutting marketing or training may hurt future sales |
| Raise ROCE | Raise profit before interest and tax; or reduce capital employed, for example by selling an unused non-current asset and repaying a long-term loan | Selling assets can reduce capacity; repaying debt uses cash that may be needed |
Match the strategy to the ratio. A question about weak gross profit margin is about price and cost of sales. Cutting the office cleaning contract will not change it.
3.5 Liquidity ratios
Liquidity means being able to meet short-term debts when they come due. The ratios compare current assets with current liabilities, so they use the statement of financial position.
| Ratio | Formula as the guide gives it |
|---|---|
| Current ratio | current assets ÷ current liabilities |
| Acid test (quick) ratio | (current assets − stock) ÷ current liabilities |
The guide gives both without “× 100”, so they are written as a ratio or number, for example 1.32 or 1.32:1. Stock is removed in the acid test because it is the current asset that takes longest to turn into cash.
Worked example: Mabwick Cycles
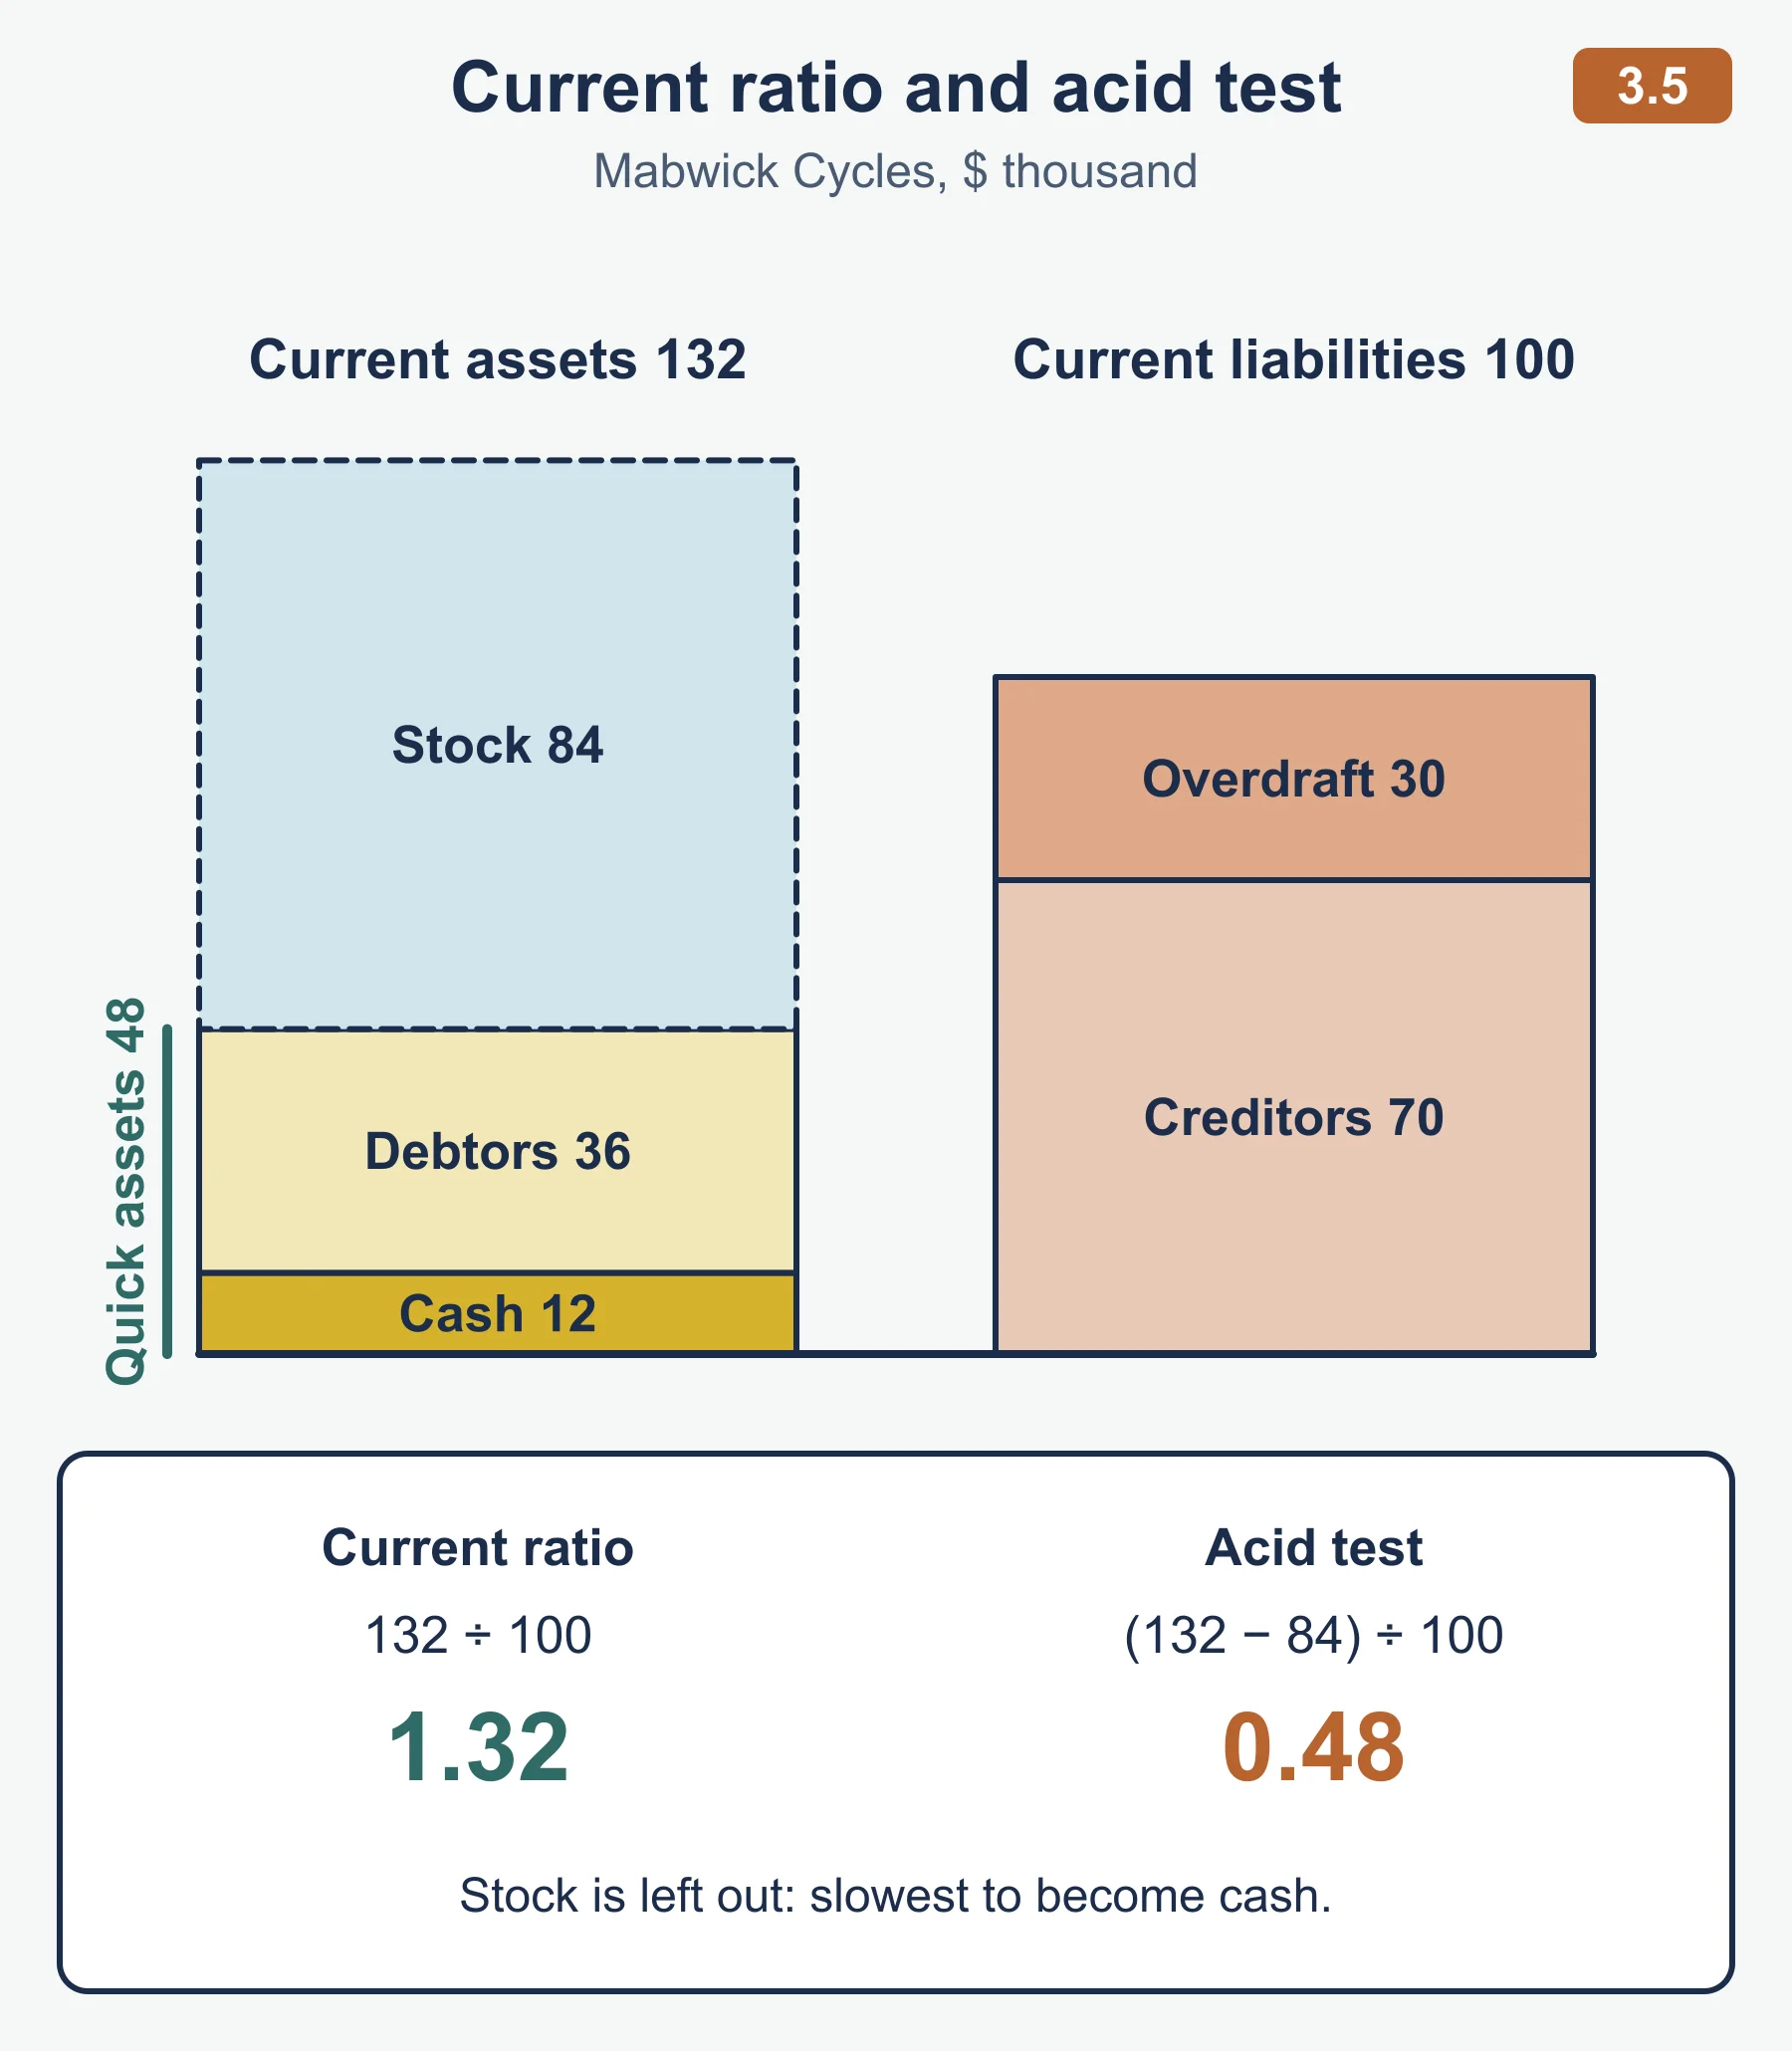
Mabwick’s current assets are stock 84,000, debtors 36,000 and cash 12,000. Its current liabilities are creditors 70,000 and a bank overdraft 30,000.
Current assets      = 84,000 + 36,000 + 12,000 = 132,000
Current liabilities = 70,000 + 30,000 = 100,000
Current ratio       = 132,000 / 100,000 = 1.32
Acid test ratio     = (132,000 - 84,000) / 100,000 = 0.48
The current ratio looks acceptable. The acid test shows that, without selling stock, Mabwick holds only 48 cents of quick assets for each dollar it owes soon. Whether that is worrying depends on how quickly stock sells and how patient the creditors are. A bicycle shop with seasonal stock is different from a business that sells for cash every day. The guide gives no target value, so say what the figure means for this business.
Strategies to improve liquidity ratios
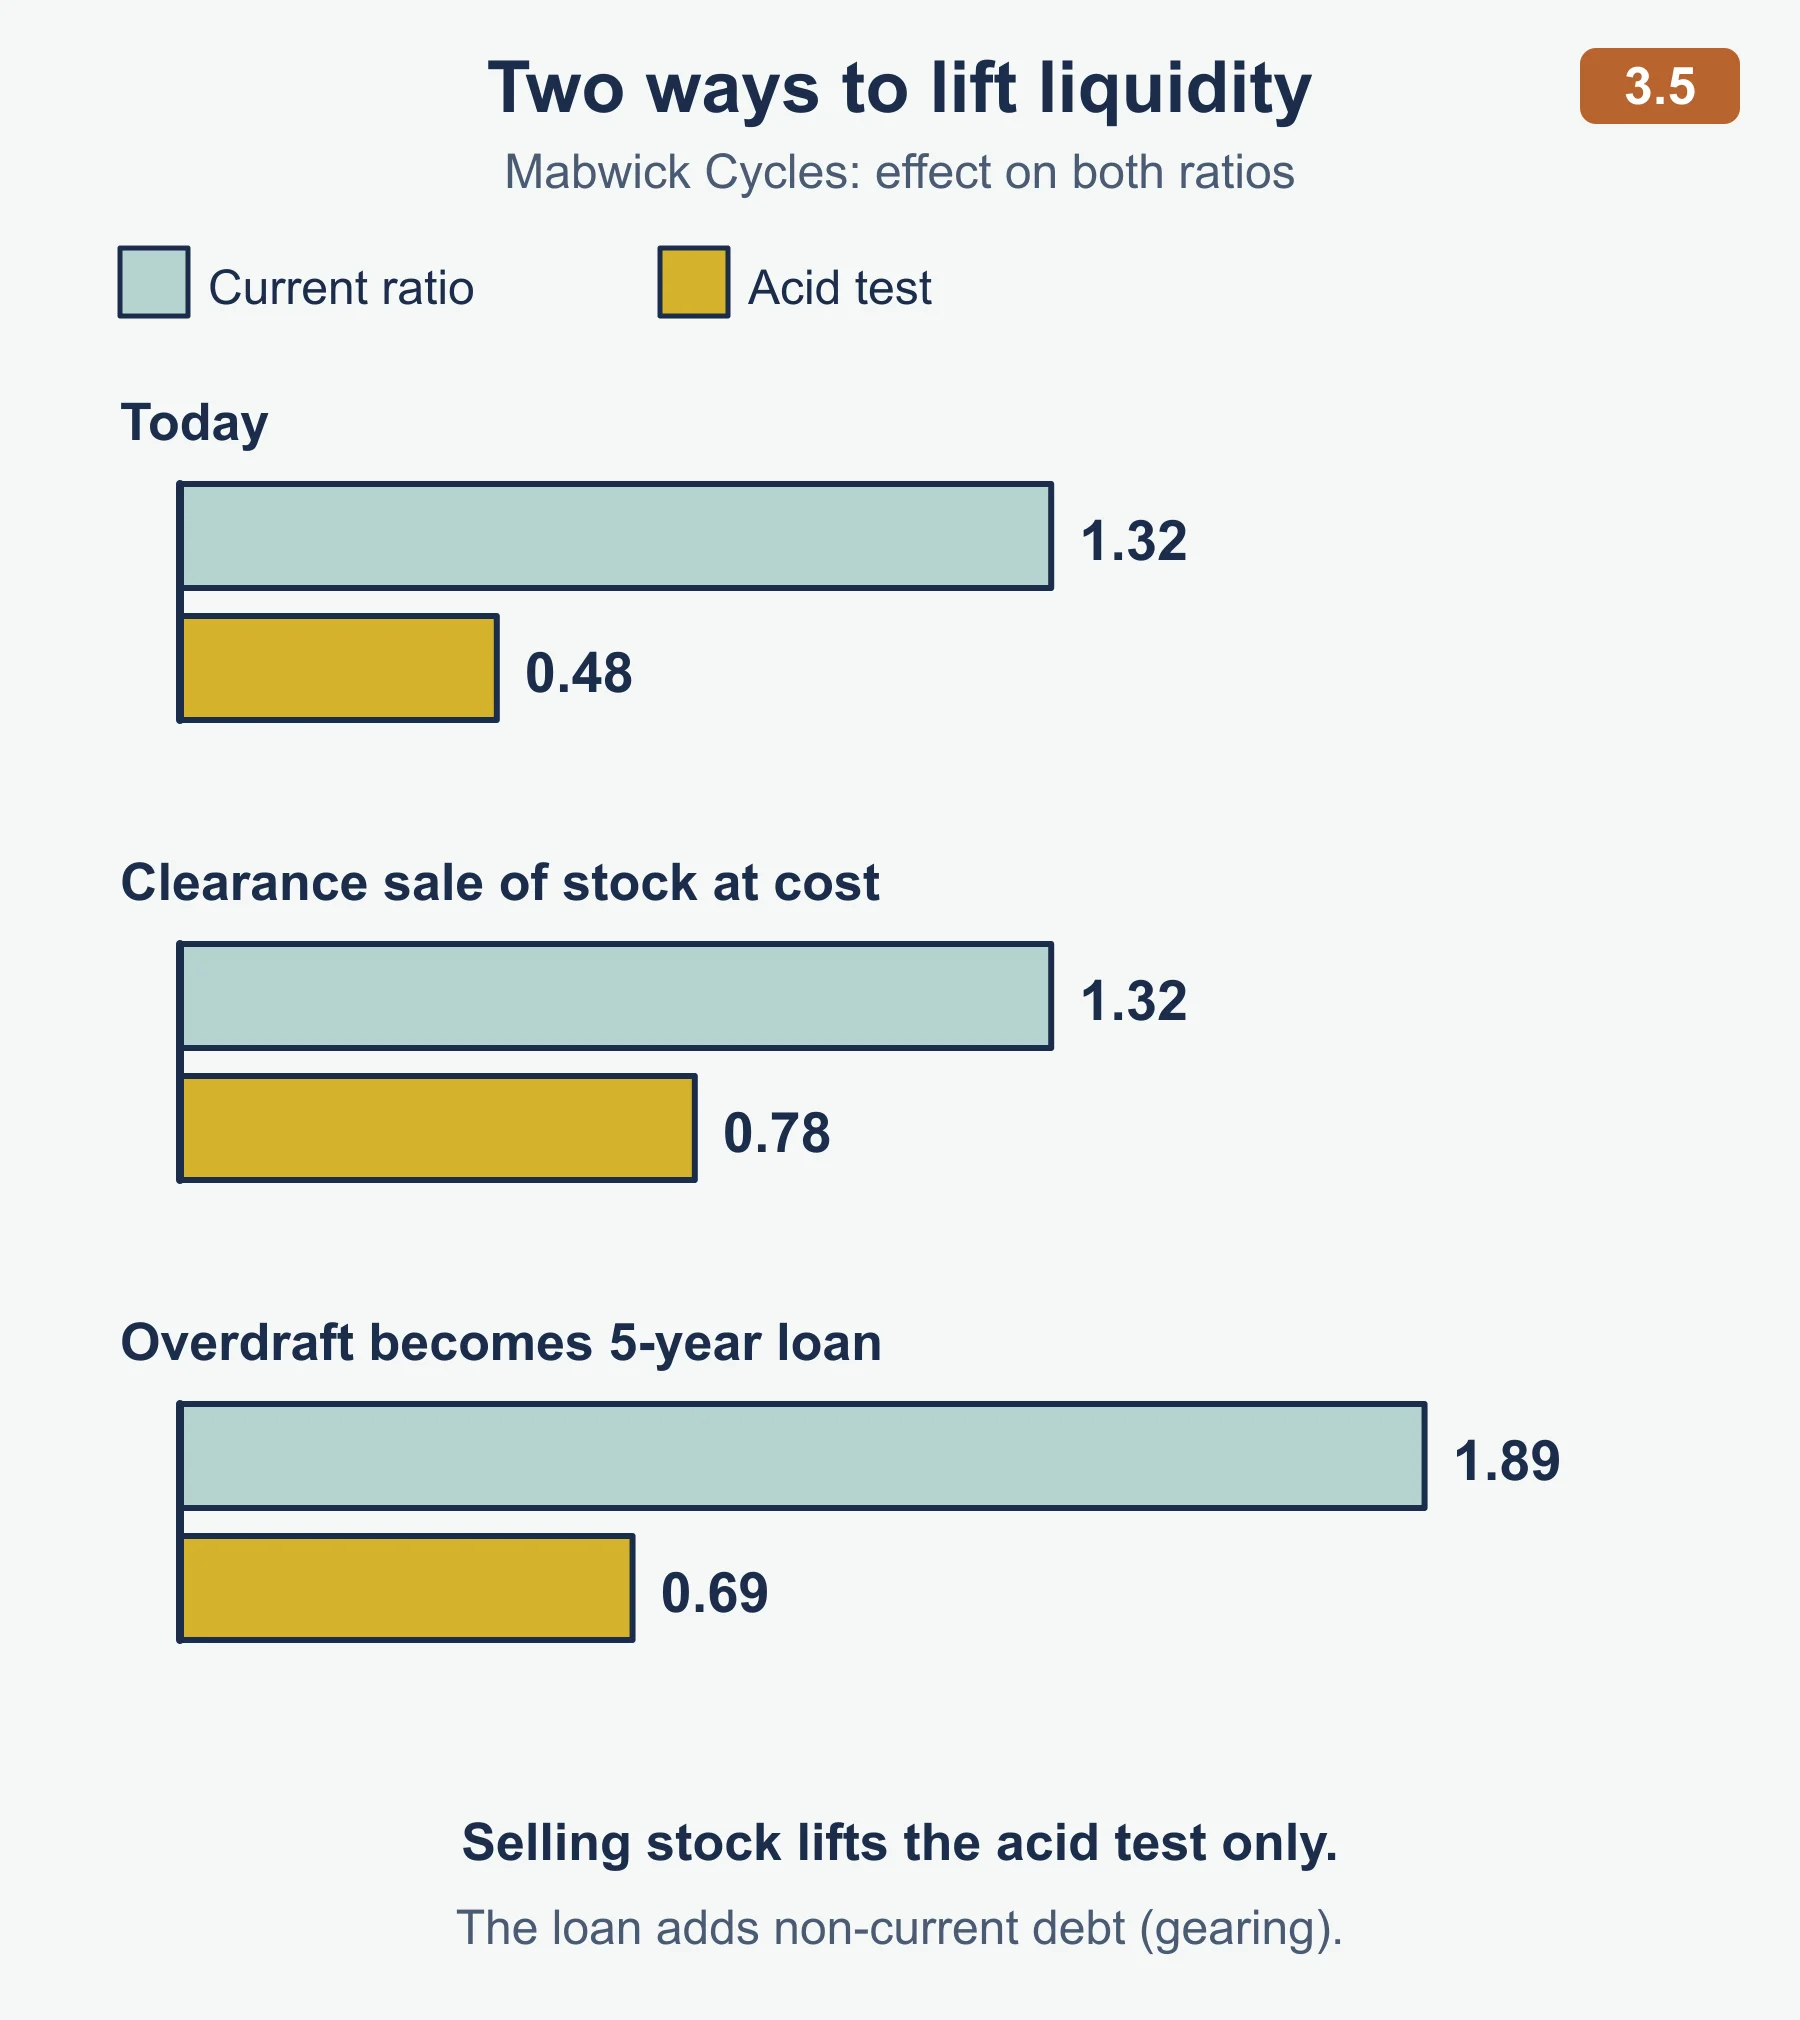
- Convert stock to cash. A clearance sale at cost for 30,000 leaves the current ratio at 1.32 (current assets only change form) but lifts the acid test to 0.78, because cash counts and stock does not. Check this: quick assets rise from 48,000 to 78,000 over the same 100,000.
- Replace short-term borrowing with long-term borrowing. Turning the 30,000 overdraft into a five-year loan cuts current liabilities to 70,000. The current ratio becomes 1.89 and the acid test 0.69. The cost is higher non-current liabilities, which matters for gearing in 3.6, and interest costs.
- Collect cash faster from debtors, for example with discounts for early payment, or ask suppliers for longer credit terms.
- Sell a non-current asset that is no longer needed, or raise equity, to bring in cash.
A higher ratio is not always better: large idle stock or cash may mean money is not working for the business.
3.6 Efficiency ratios (HL only)
Efficiency ratios show how well the business manages stock and credit, and how it is funded. The formulae are:
| Ratio | Formula as the guide gives it |
|---|---|
| Stock turnover (times) | cost of sales ÷ average stock |
| Stock turnover (days) | (average stock ÷ cost of sales) × 365 |
| Debtor days | (debtors ÷ total sales revenue) × 365 |
| Creditor days | (creditors ÷ cost of sales) × 365 |
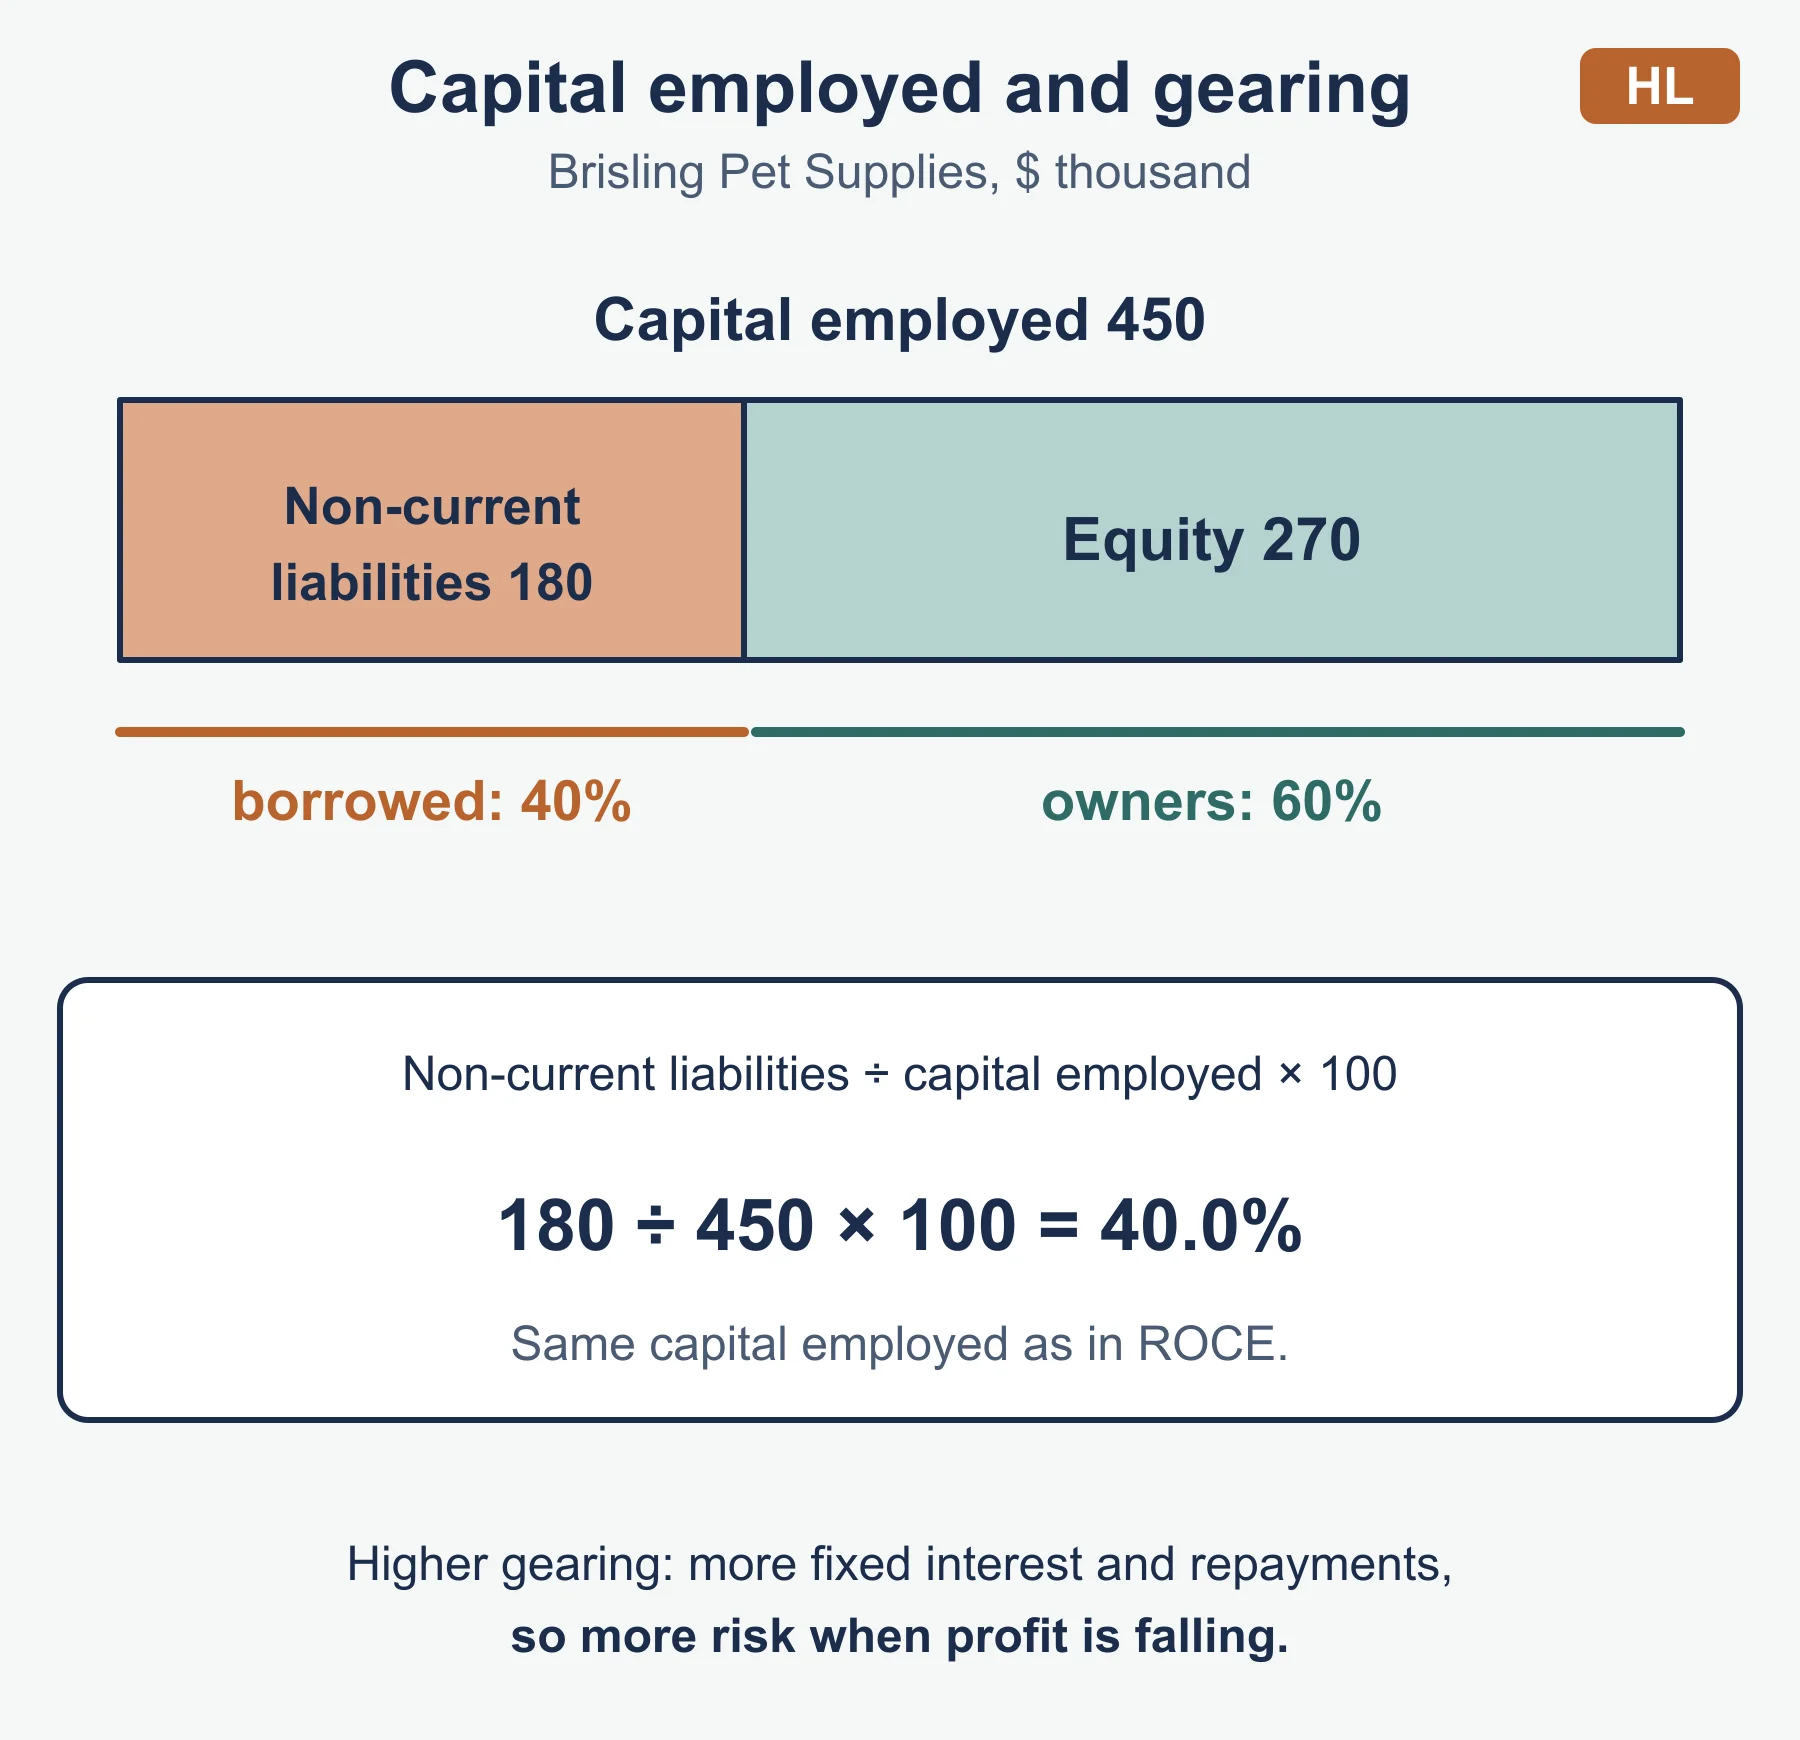
| Gearing ratio | (non-current liabilities ÷ capital employed) × 100 |
Average stock = (opening stock + closing stock) ÷ 2. Capital employed = non-current liabilities + equity, as in ROCE.
Worked example: Brisling Pet Supplies
For the year, Brisling has cost of sales 620,000, sales revenue 930,000, opening stock 70,000, closing stock 90,000, debtors 102,000 and creditors 85,000. Non-current liabilities are 180,000 and equity is 270,000.
Average stock       = (70,000 + 90,000) / 2 = 80,000
Stock turnover      = 620,000 / 80,000 = 7.75 times
Stock turnover days = 80,000 / 620,000 x 365 = 47.1 days
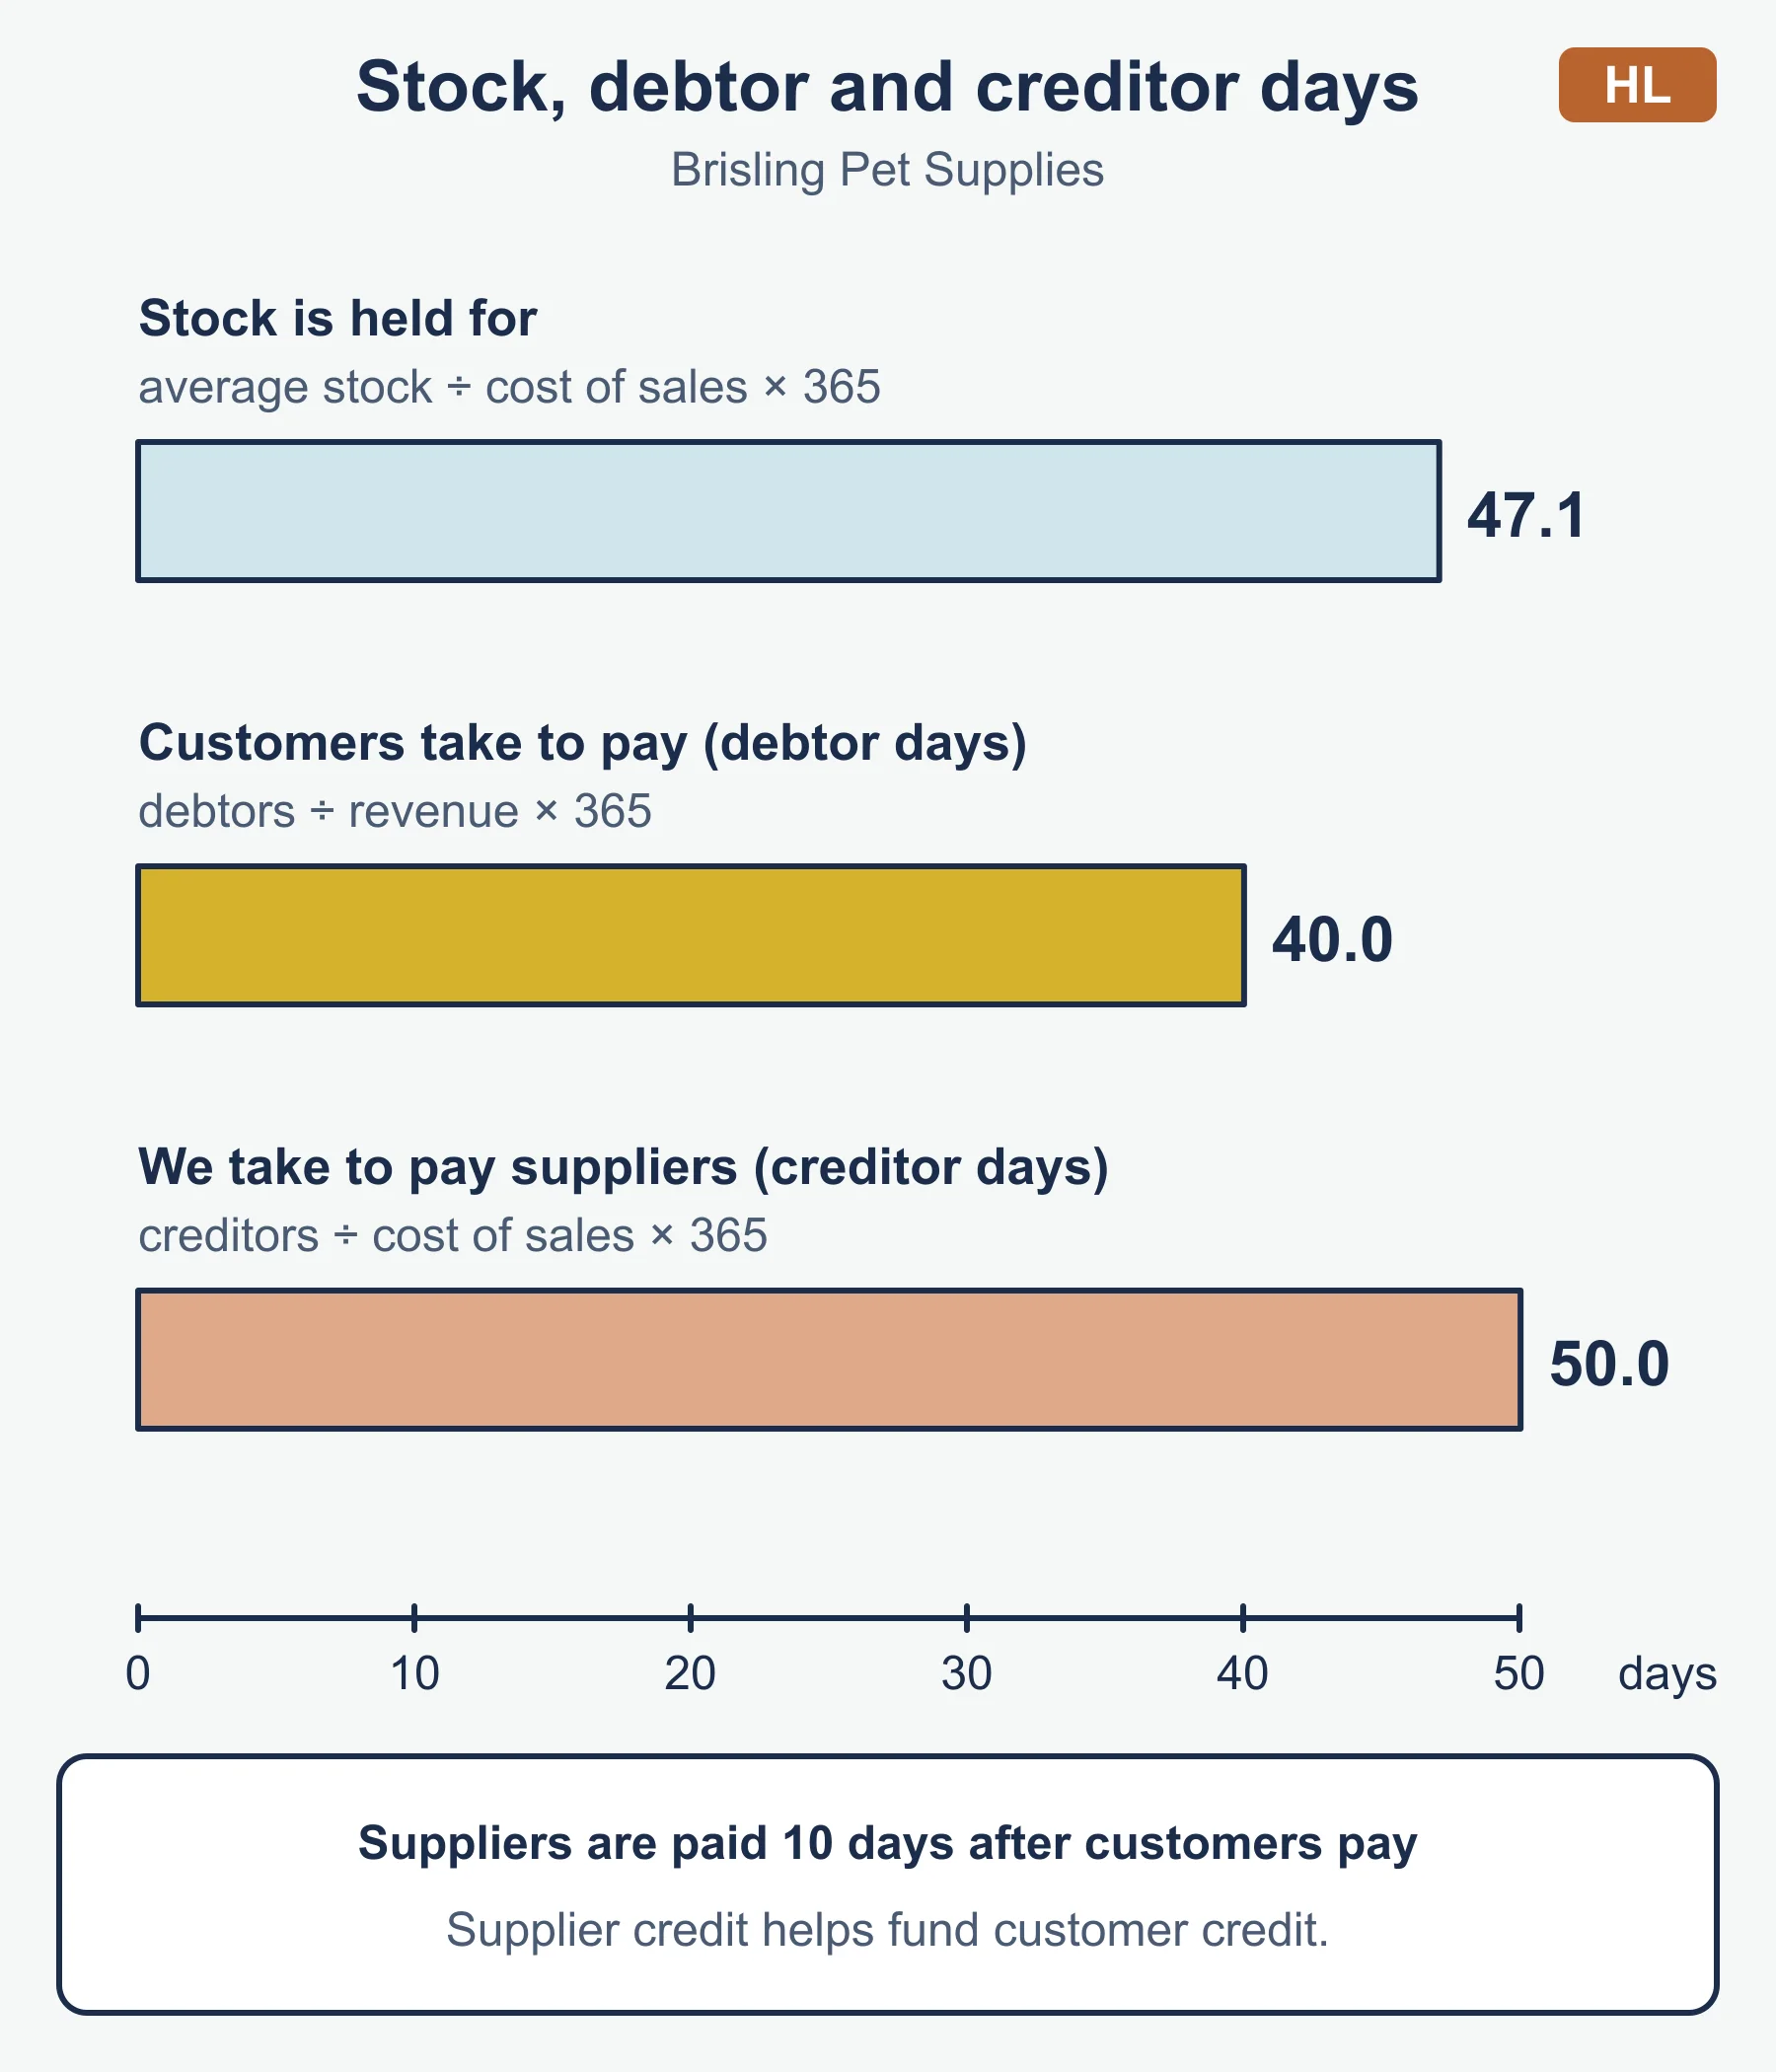
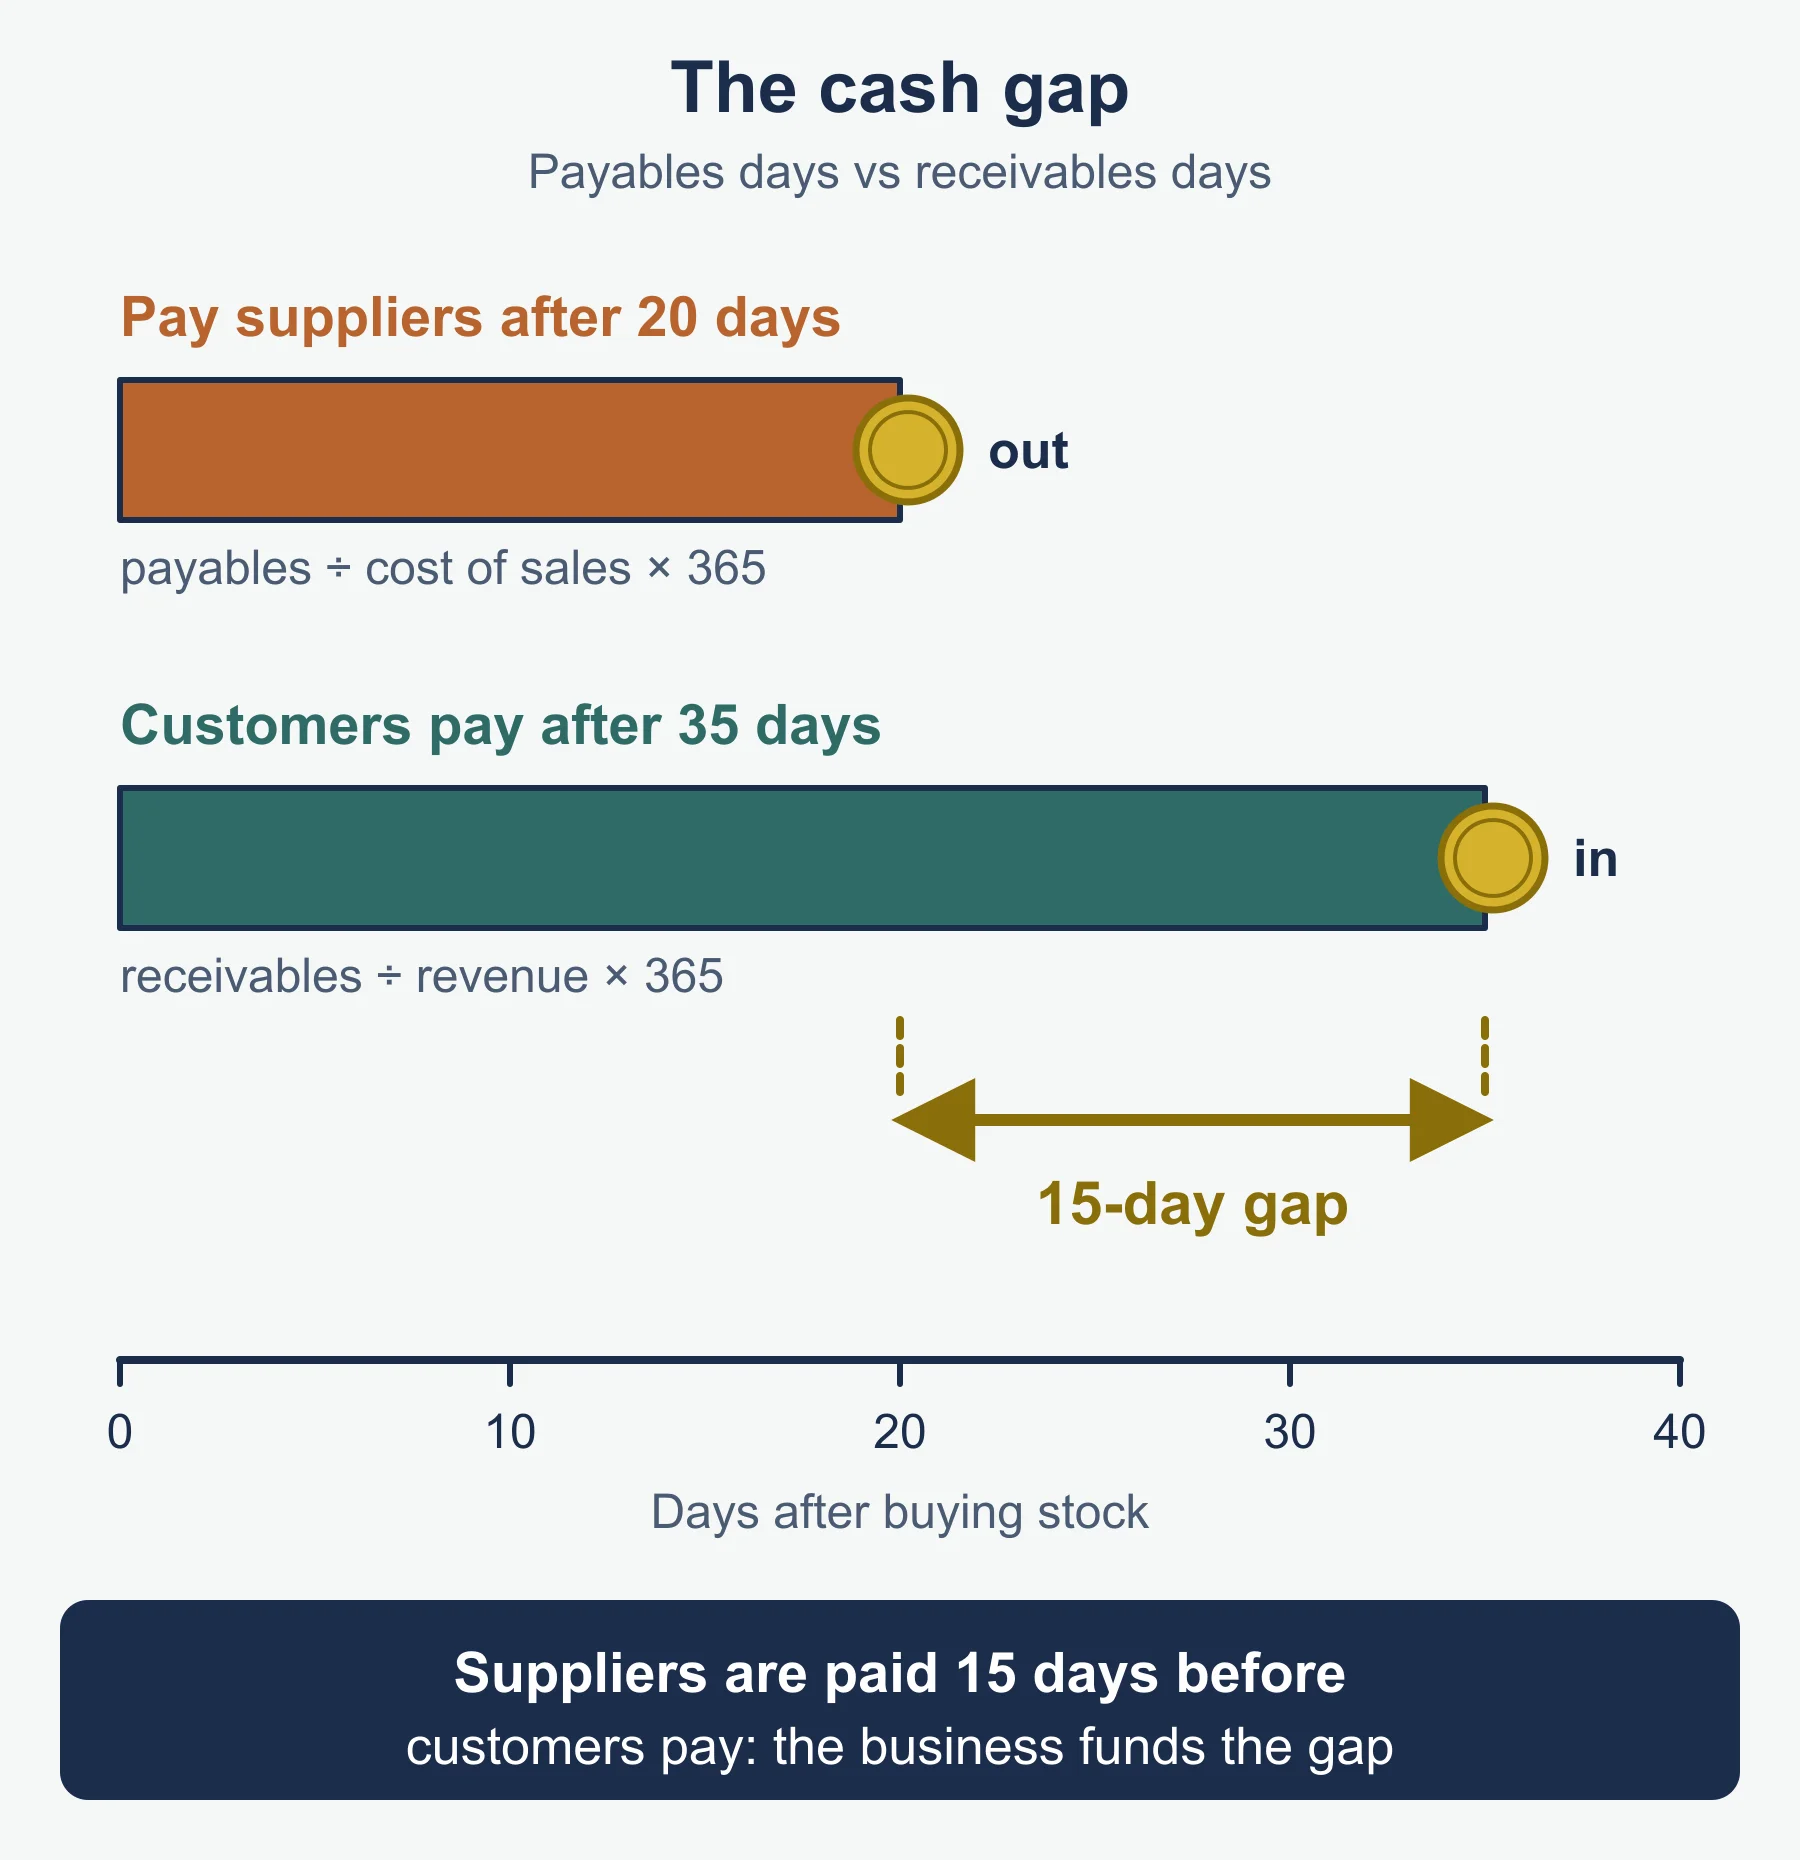
Debtor days         = 102,000 / 930,000 x 365 = 40.0 days
Creditor days       = 85,000 / 620,000 x 365 = 50.0 days
Capital employed    = 180,000 + 270,000 = 450,000
Gearing ratio       = 180,000 / 450,000 x 100 = 40.0%
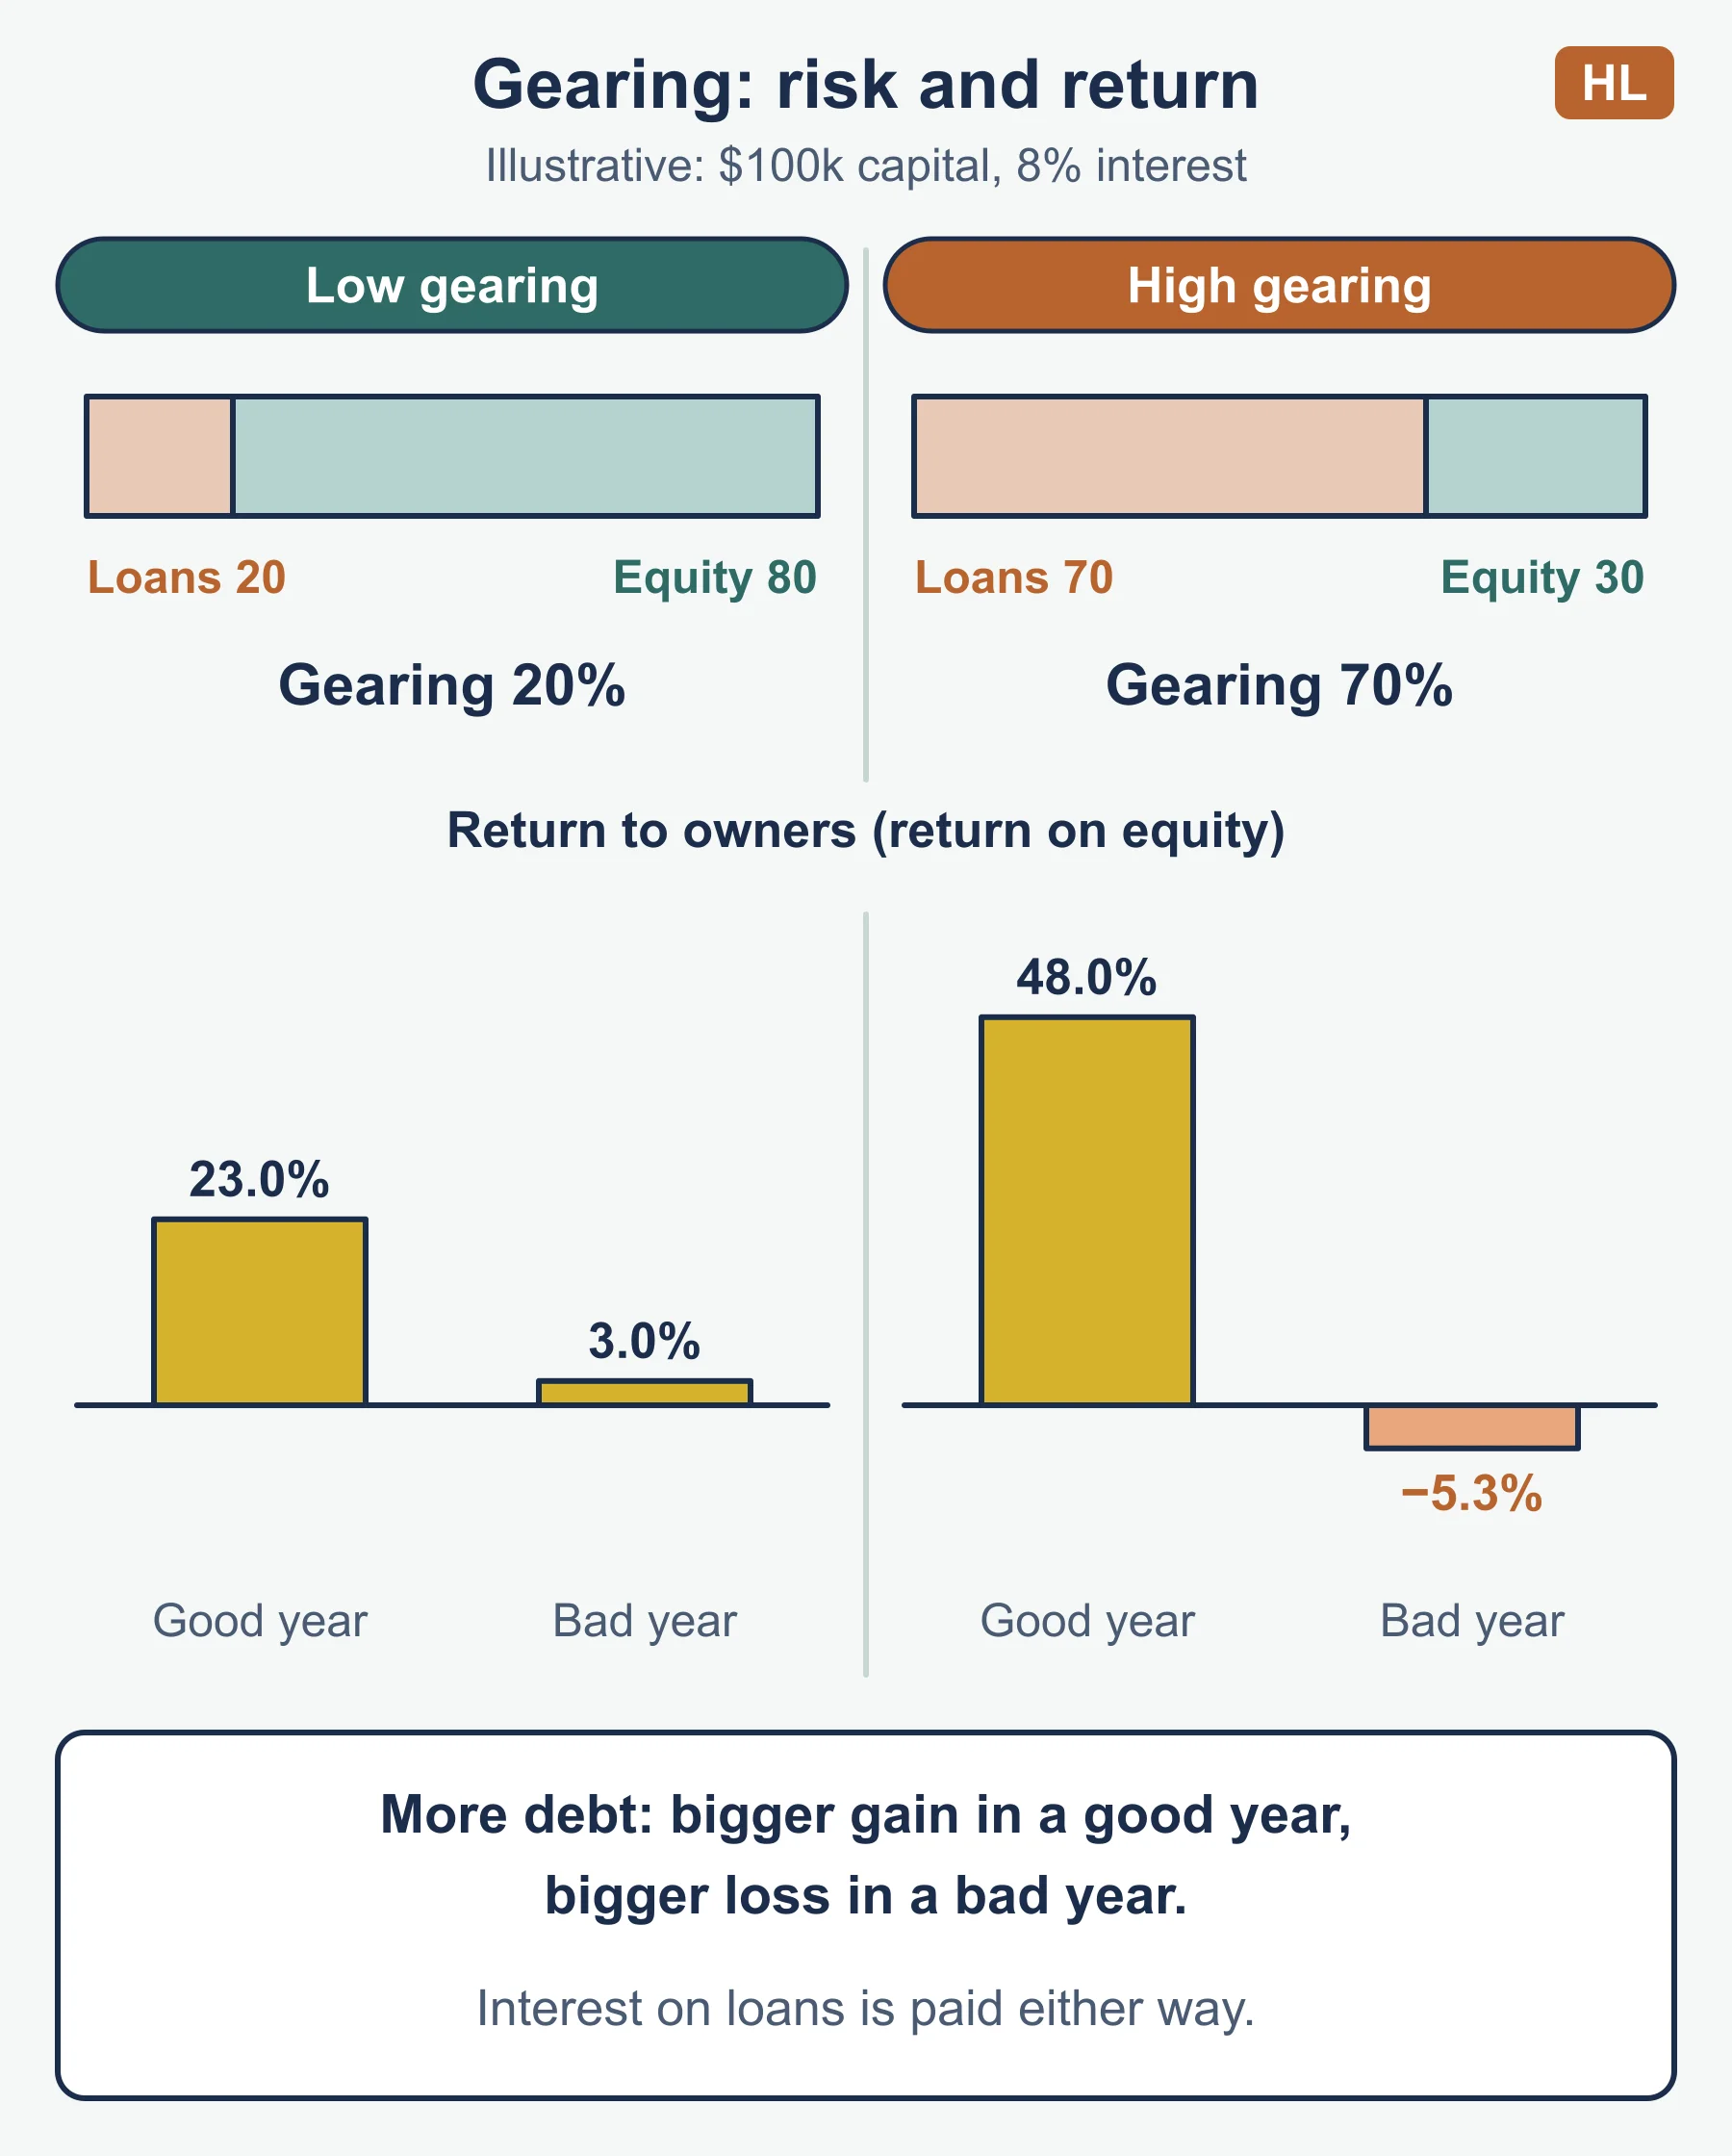
Interpretation. Brisling takes about 40 days to collect from customers but about 50 days to pay suppliers, so supplier credit helps to fund its customers’ credit. Stock is held for about 47 days. For a pet food seller, a long holding period could raise the risk of stock passing its sell-by date, though the case would need to say so. A gearing ratio of 40% means 40% of long-term funds are borrowed. A higher gearing ratio means more fixed interest and repayment commitments, which raises risk when profit is falling, but it can raise returns to owners when the business earns more on borrowed money than it pays in interest.
Strategies to improve efficiency ratios
| Ratio | A better position usually means | Possible strategies | Trade-off |
|---|---|---|---|
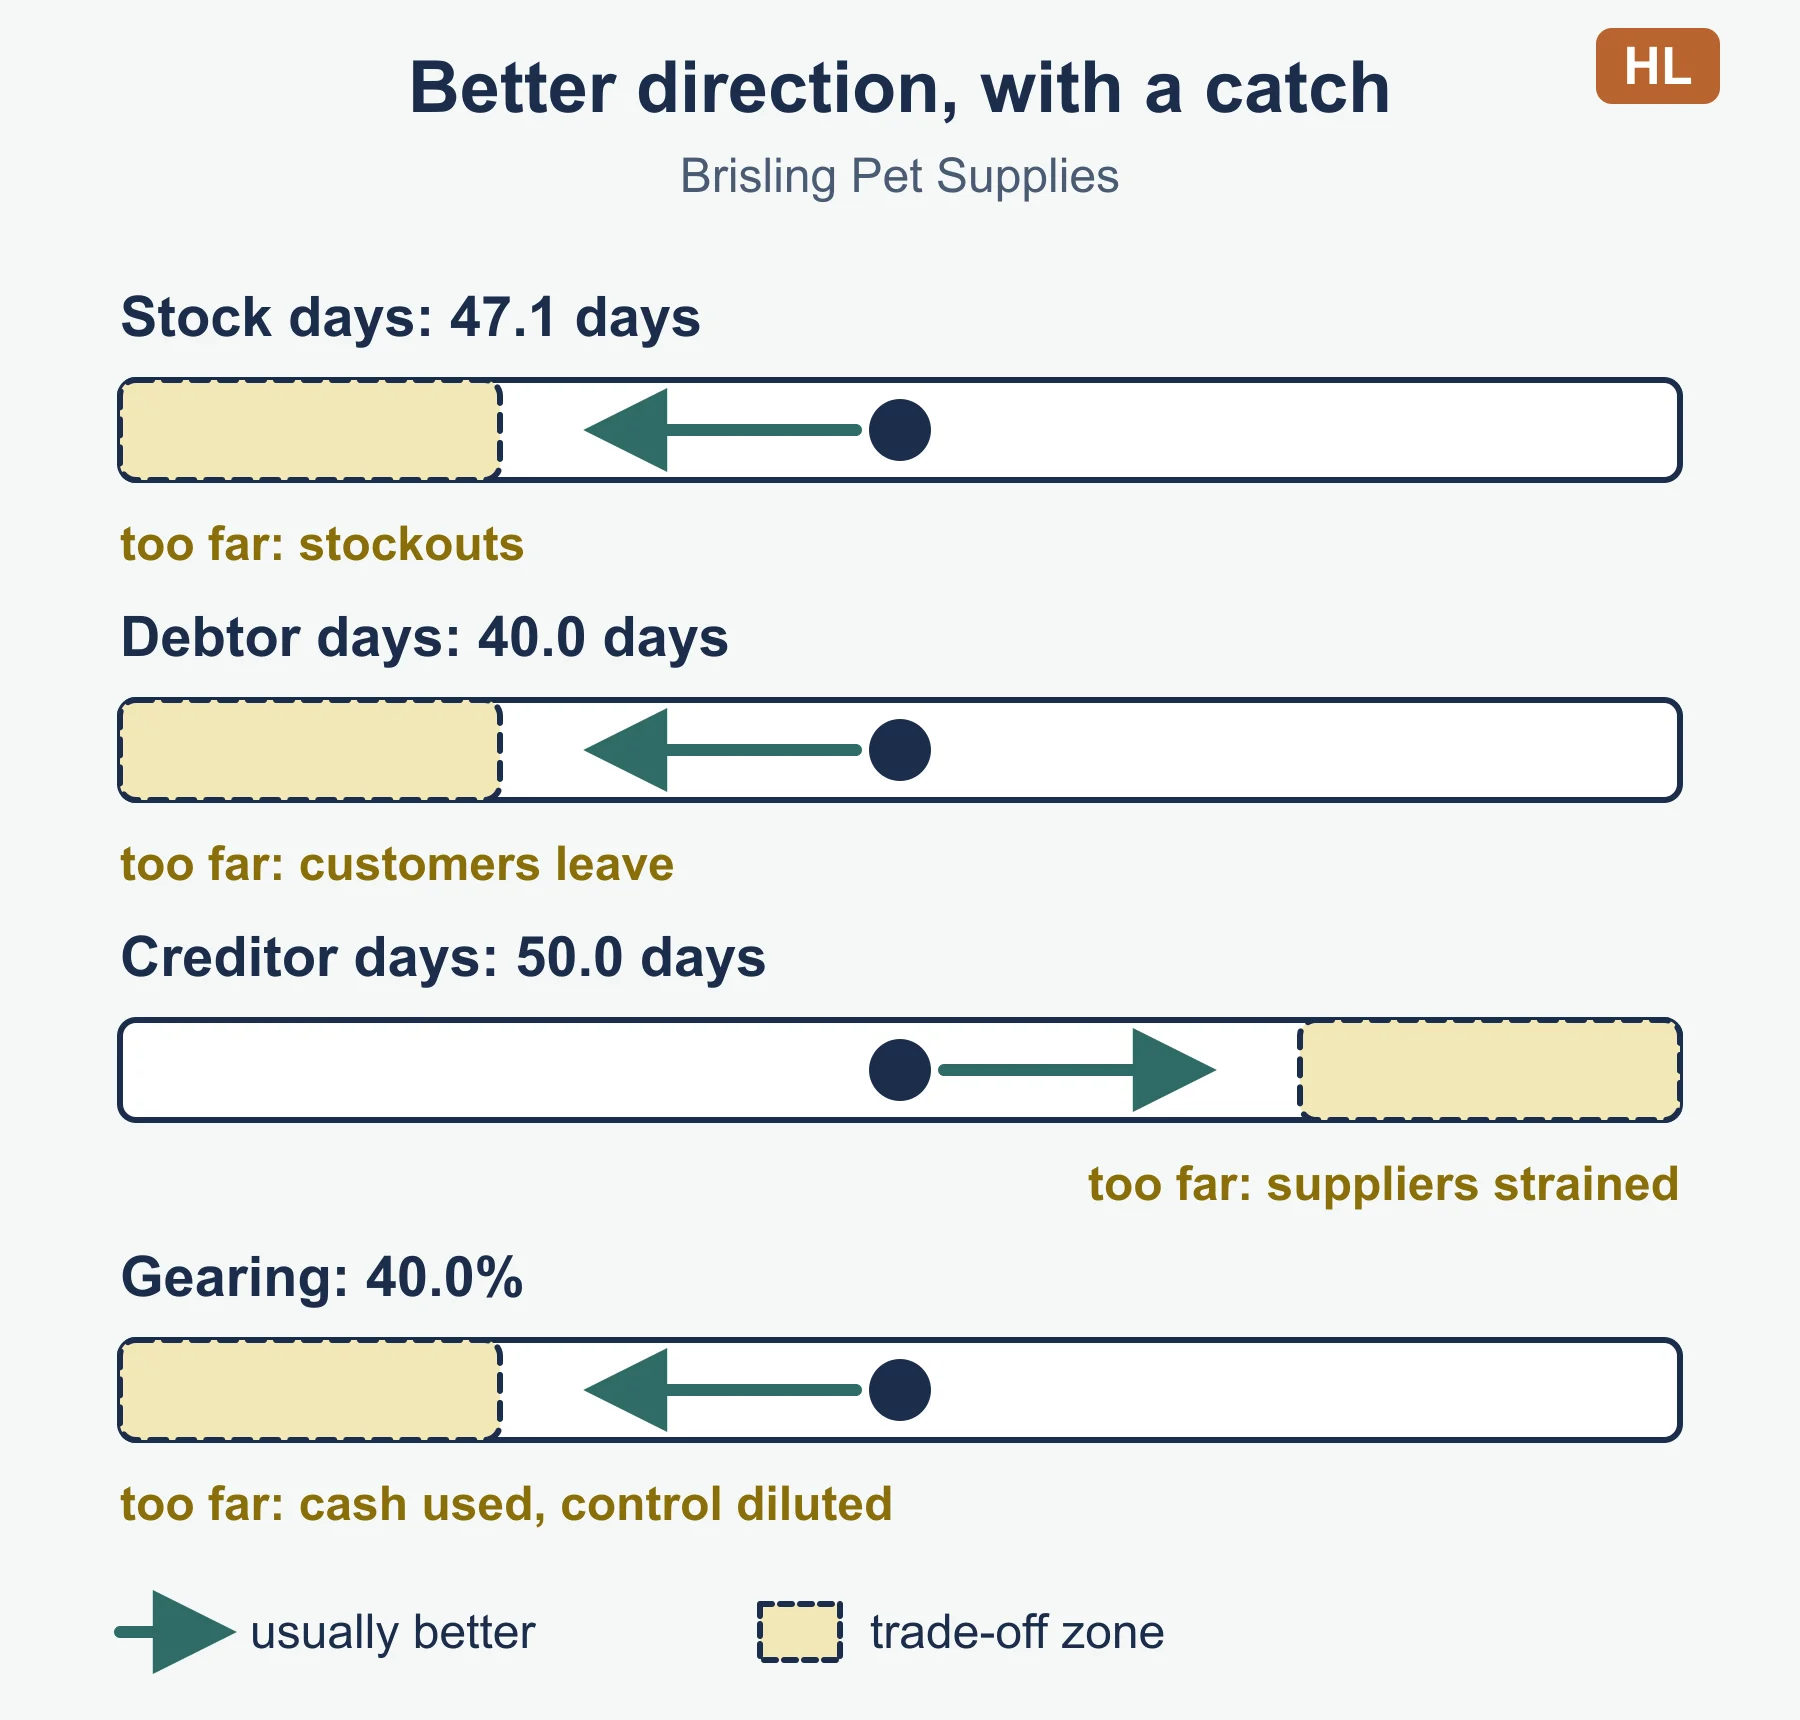
| Stock turnover | More times or fewer days, as long as sales are not lost | Just-in-time ordering; drop slow lines; promotions on old stock | Too little stock risks stockouts |
| Debtor days | Fewer days | Stricter credit control, early payment discounts, shorter terms, selling debts to a factoring company | Customers may move to rivals; discounts cut revenue |
| Creditor days | Longer, within agreed terms | Negotiate longer terms with suppliers | Strained supplier relationships; lost early payment discounts |
| Gearing | Often lower, if risk is the concern | Repay loans from retained profit; issue shares | New shares may dilute owners’ control; repayment uses cash |
Be careful with direction. Falling debtor days is usually an improvement, but a longer creditor period helps cash only if suppliers accept it. If the case says the business wants to grow quickly with borrowed money, a rise in gearing may be a deliberate choice.
Insolvency versus bankruptcy (HL only)
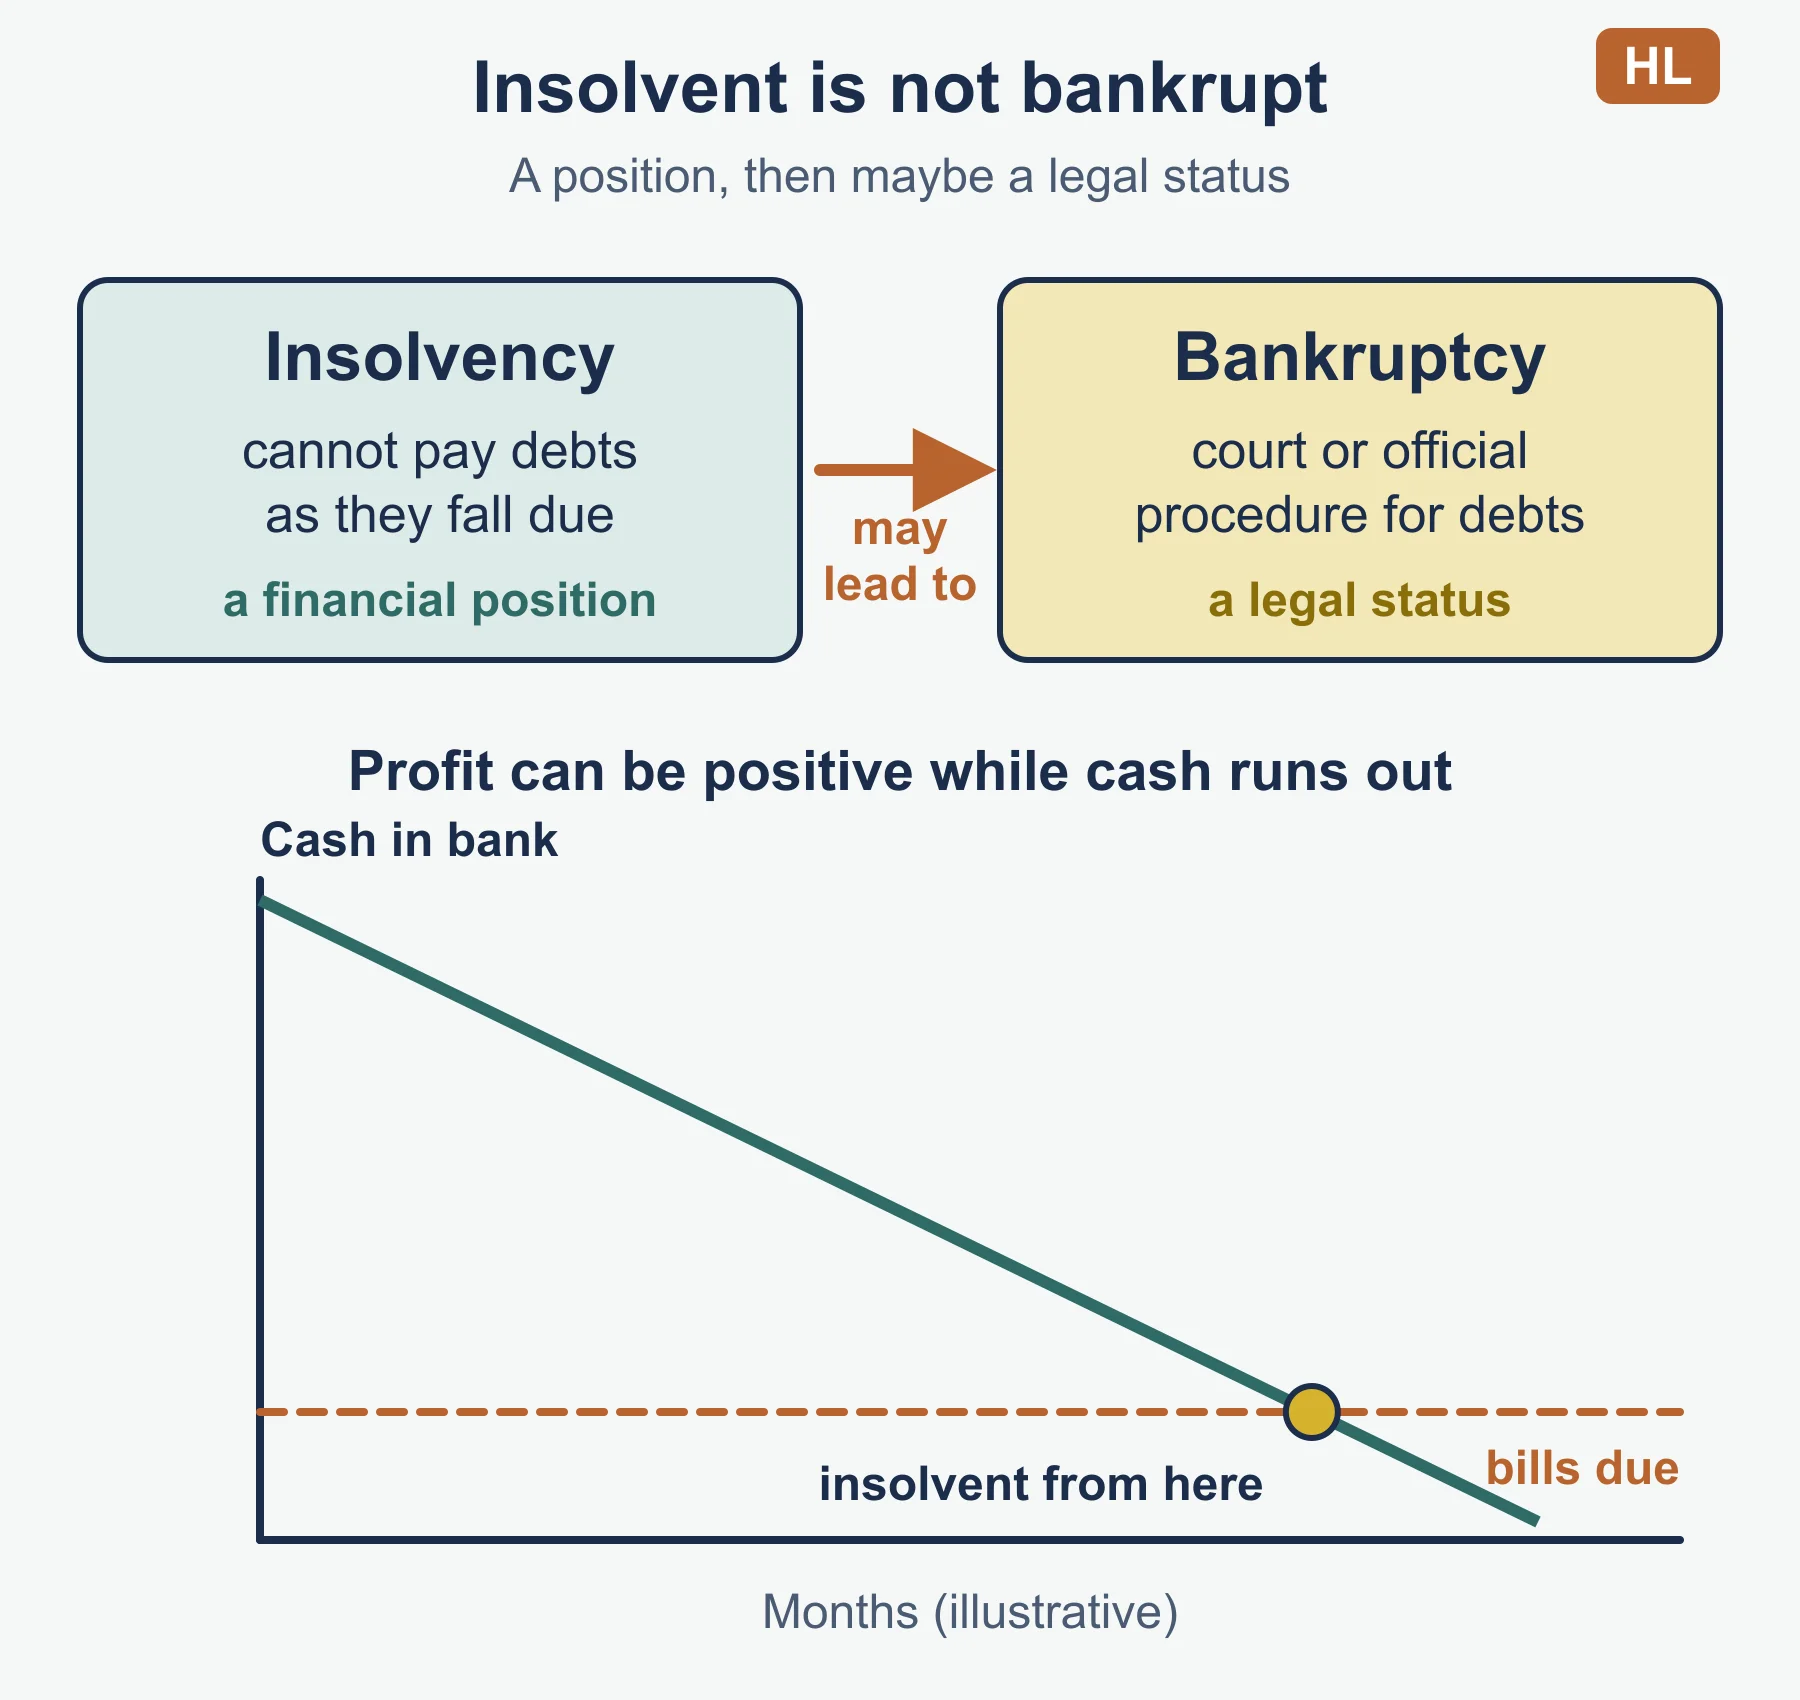
Insolvency is when a business or person cannot pay debts as they fall due. It is a financial position. Bankruptcy is a legal status or process that can follow insolvency, in which a court or official procedure deals with the debts. The guide gives this point as a heading only, so these are general definitions, not the guide’s wording. Rules differ between countries, so keep to general terms.
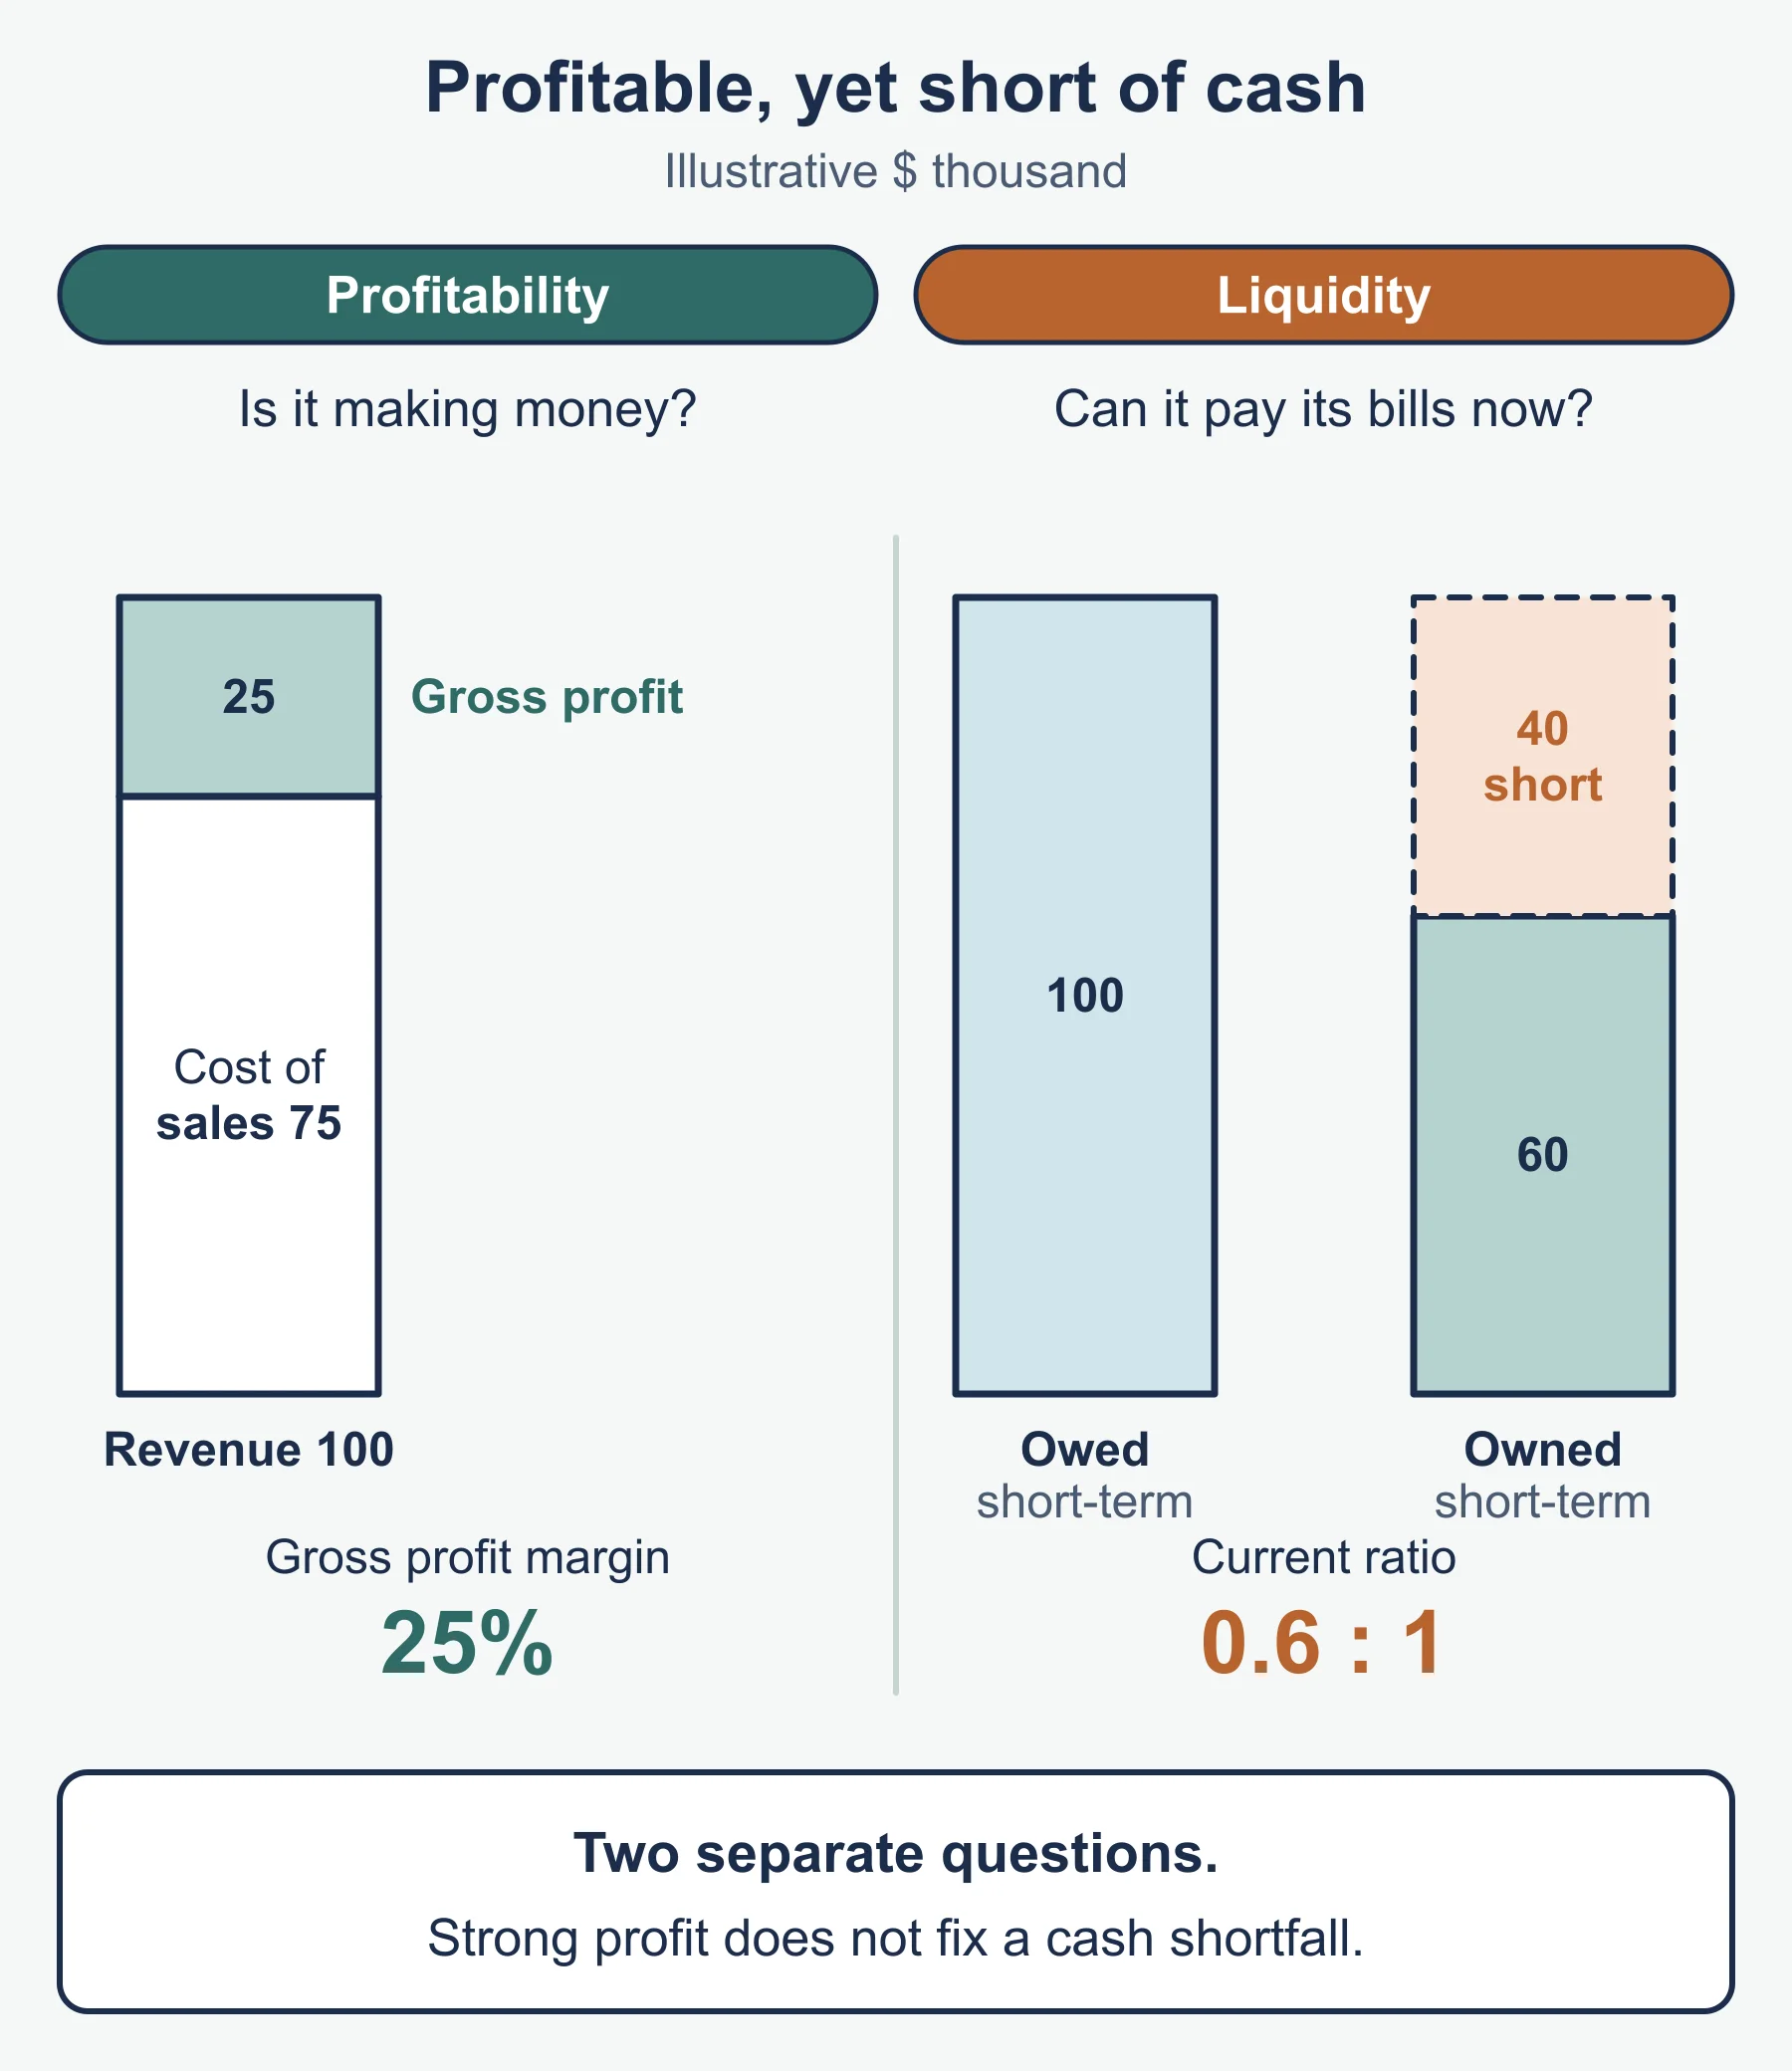
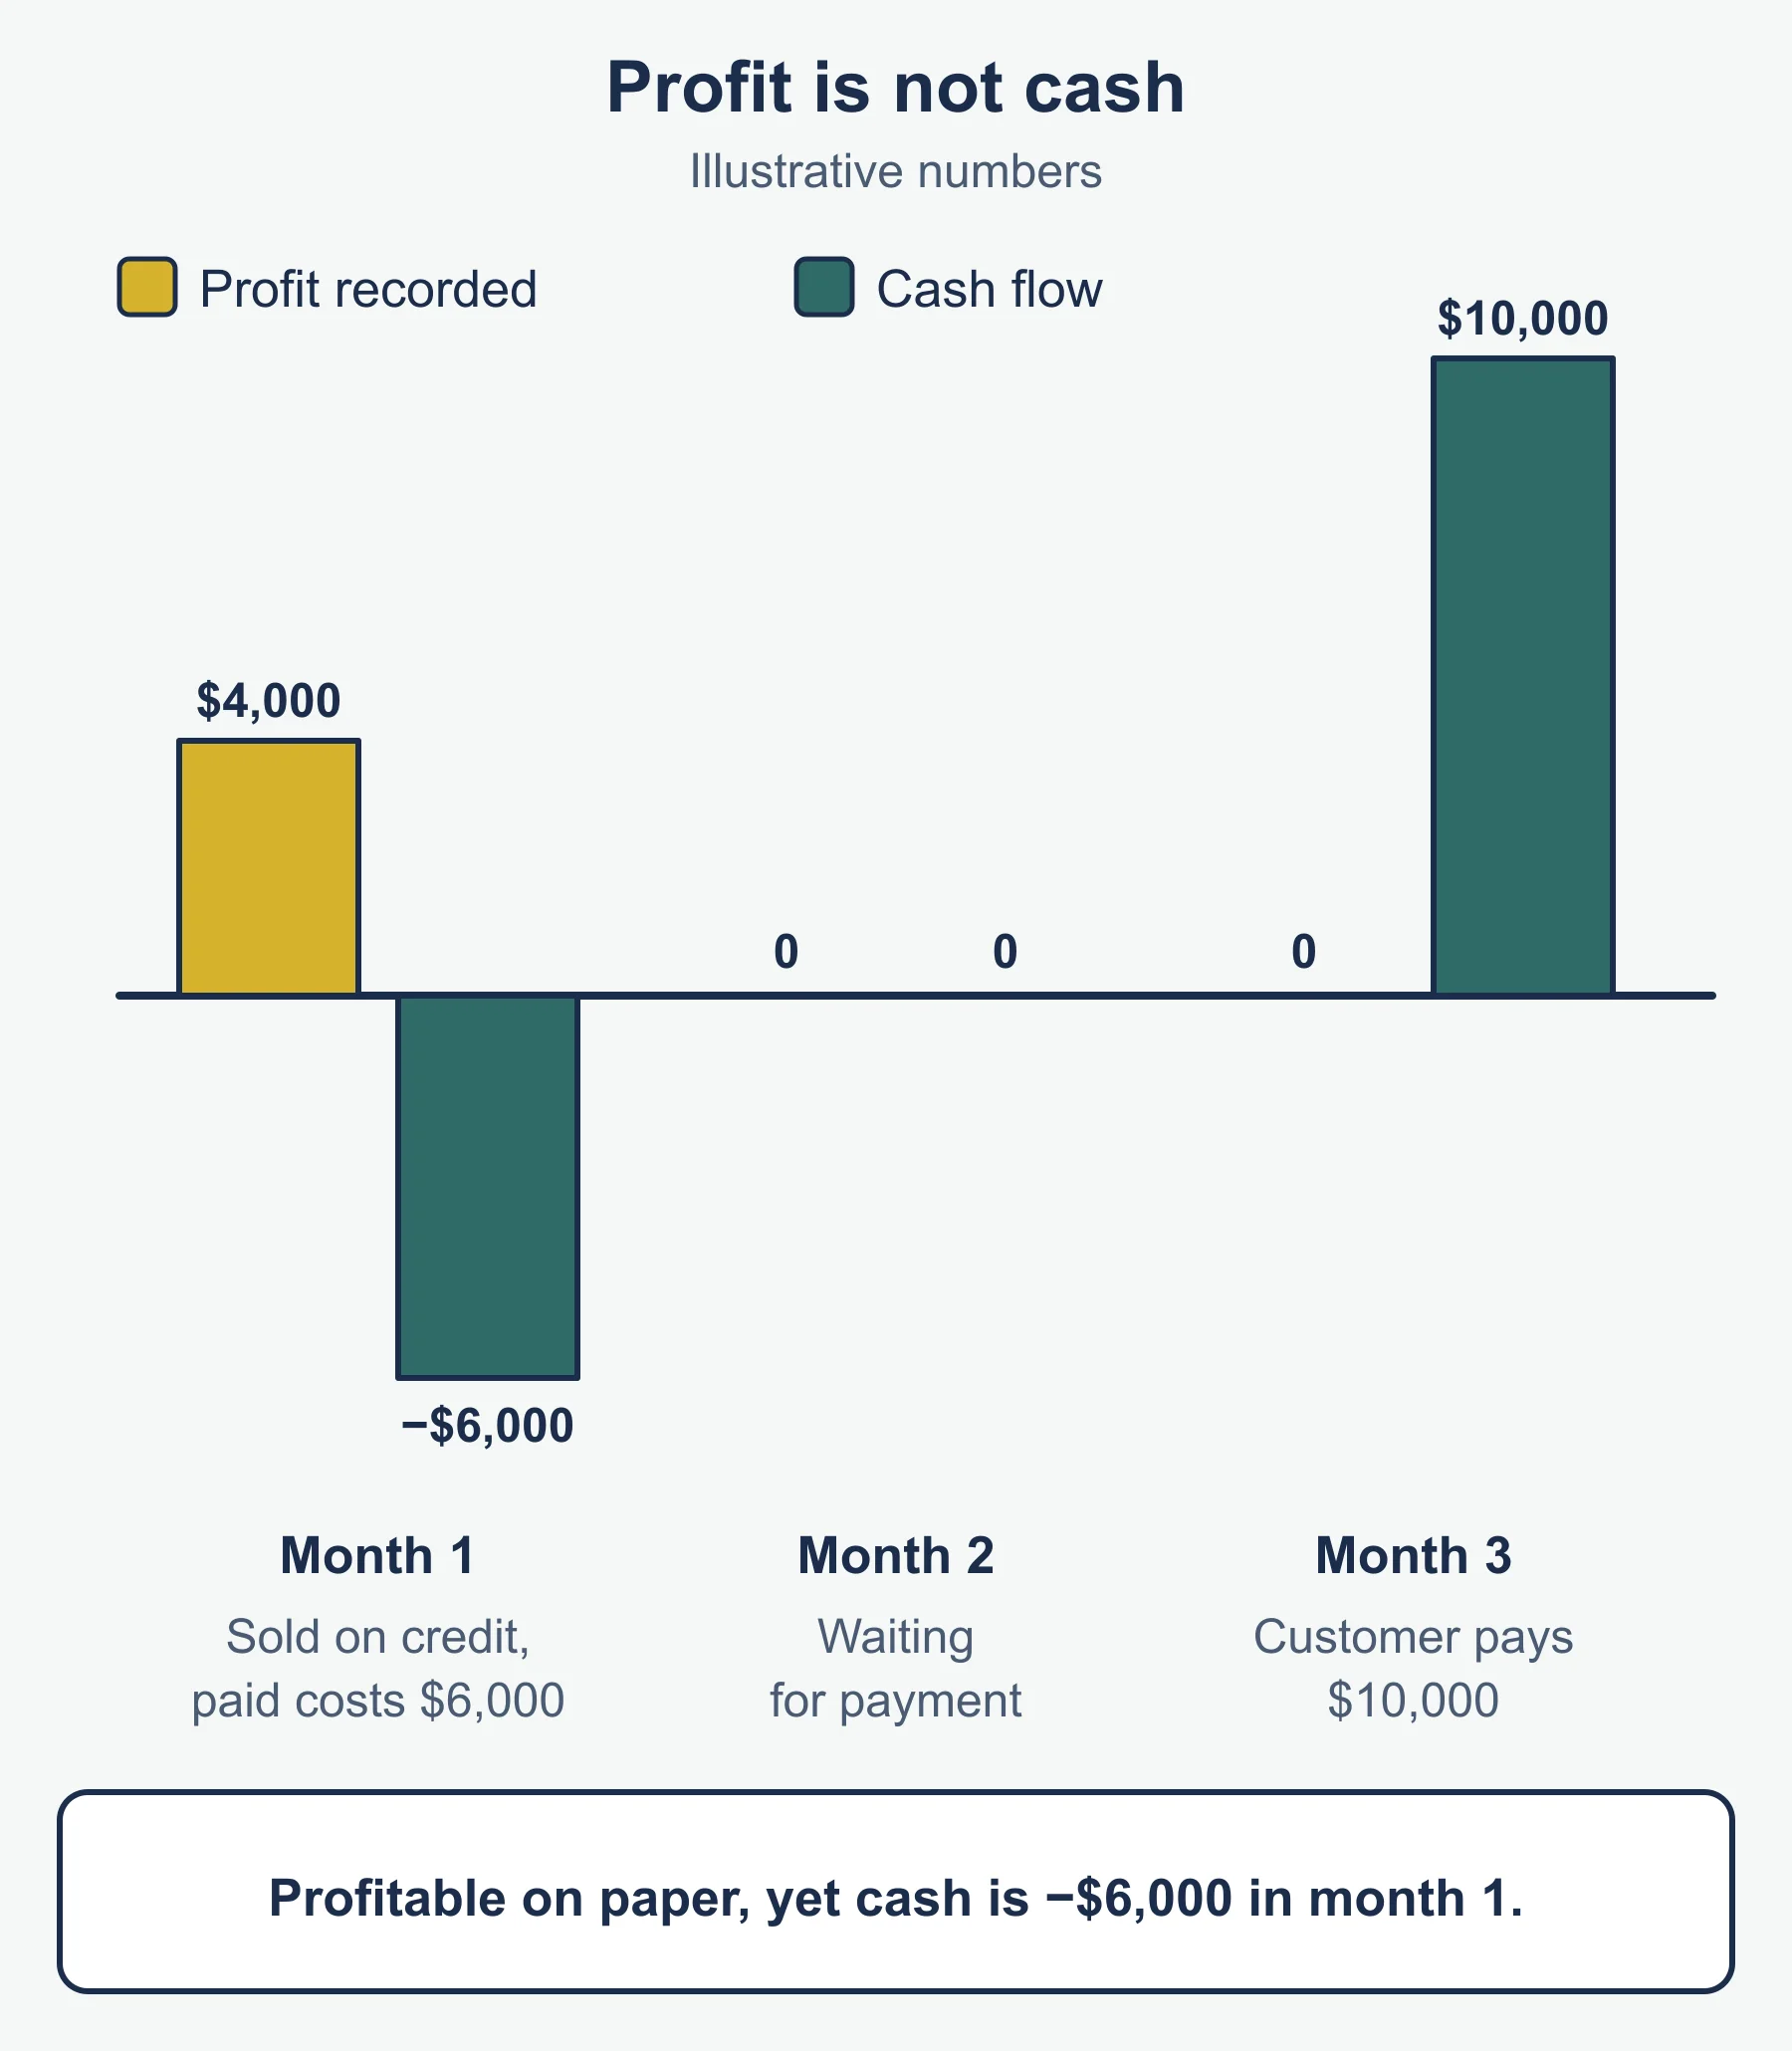
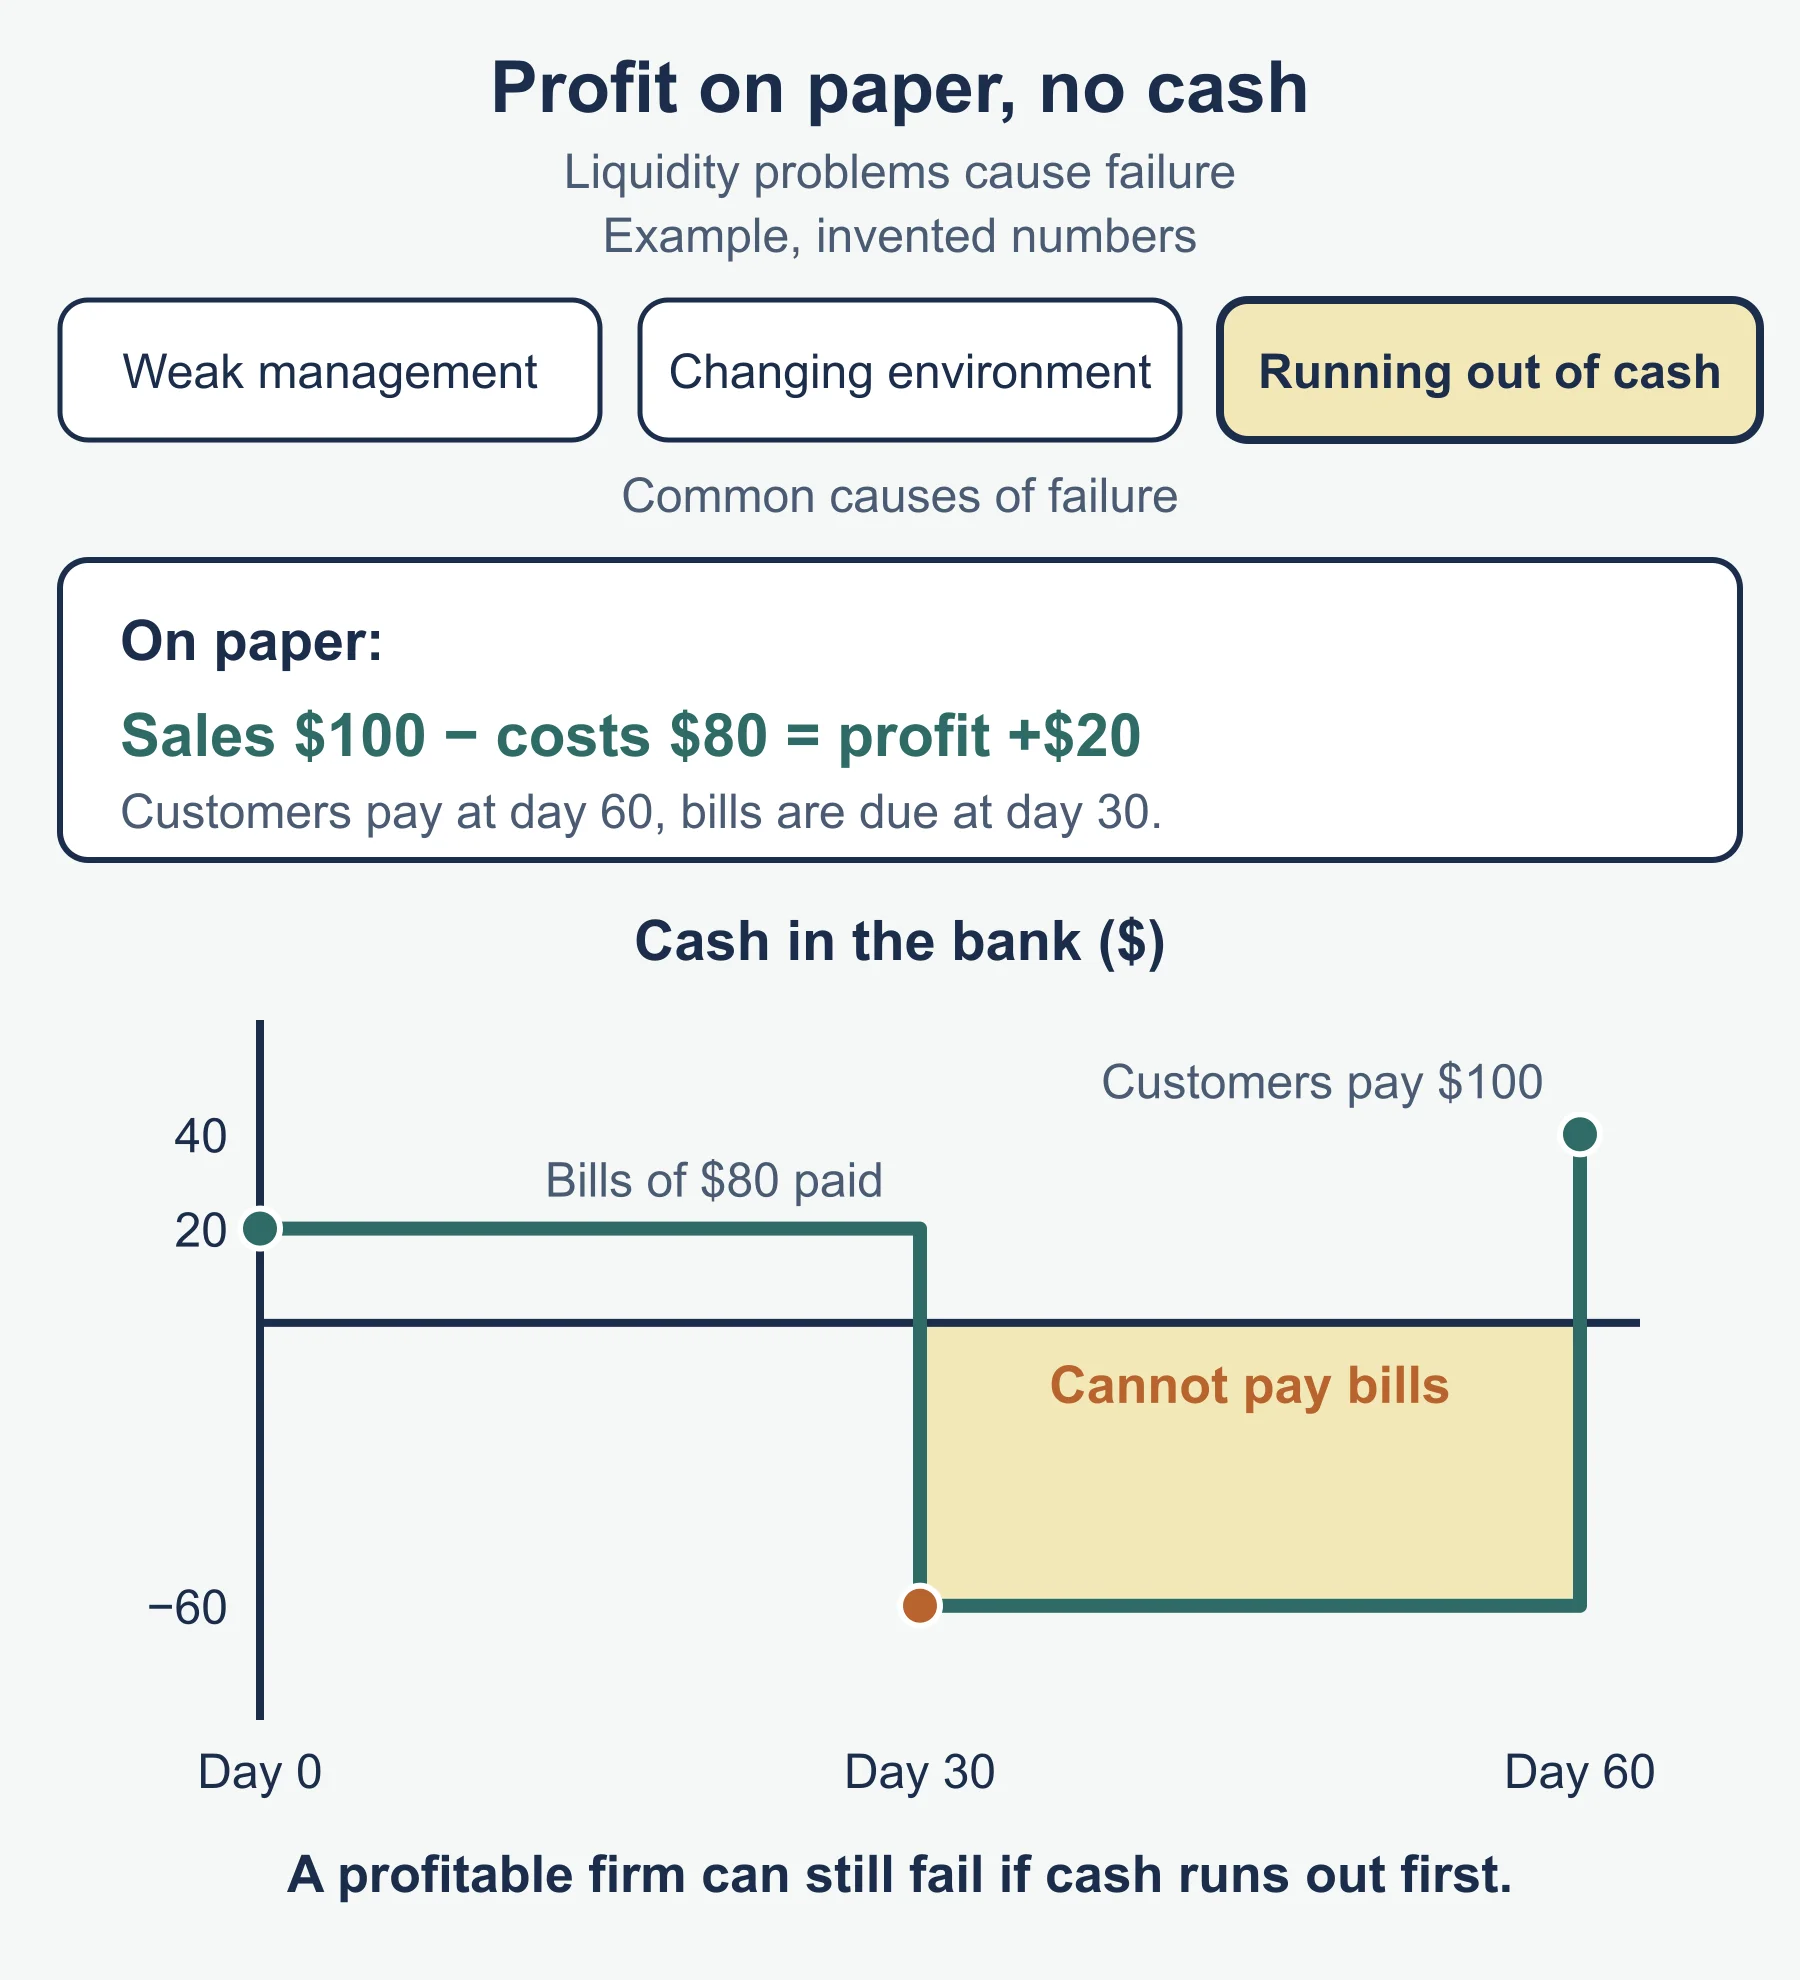
A business can make a profit and still become insolvent. Profit is recorded when a sale is made, but cash arrives later. If debtor days are long, stock is high and creditors demand payment sooner, the bank balance can run out even though the statement of profit or loss looks healthy. This links to liquidity ratios and to section 3.7 on cash flow.
Common errors
- Using net profit after interest in the profit margin or ROCE when the guide’s formulae use profit before interest and tax.
- Leaving out the “× 365” in debtor, creditor or stock days, or using sales revenue instead of cost of sales for creditor days and stock turnover.
- Using the closing stock figure alone when the case gives opening and closing stock.
- Writing “good” or “bad” without a comparison, or recommending a strategy that ignores the case facts.
Frequently asked questions
What is the difference between gross profit margin and profit margin? Gross profit margin is gross profit divided by sales revenue, times 100, so it reflects price and cost of sales. Profit margin uses profit before interest and tax, so it also reflects overheads.
How do you calculate debtor days and creditor days? Debtor days are debtors divided by total sales revenue, times 365. Creditor days are creditors divided by cost of sales, times 365; both are HL only efficiency ratios.
What is the difference between insolvency and bankruptcy? Insolvency is when a business or person cannot pay debts as they fall due, which is a financial position. Bankruptcy is the legal status or process that can follow insolvency.
Is a higher current ratio always better? No. A high current ratio can mean large idle stock or cash that is not working for the business, so interpret it against the business’s past results, rivals and objectives.
Official syllabus
International Baccalaureate Organization, Business management guide, first assessment 2024: section 3.5 (Profitability and liquidity ratio analysis), section 3.6 (Efficiency ratio analysis, HL only), the appendix on formulae for ratio analysis and the glossary of command terms.
Get free revision emails (optional)
Occasional emails with practice questions, worked explanations and links to free resources for the qualification and subjects you choose. No spam, and you can unsubscribe from any email. The free tools on this site never need an email.
Related resources
-
Practice questions
IB DP Business Management: Profitability, liquidity and efficiency ratios (HL only) – Practice Questions
Original IB DP Business Management practice questions with worked answers on profitability, liquidity and HL efficiency ratios, strategies and insolvency.
Business · International Baccalaureate · IB
Try questions -
Revision notes
IB DP Business Management: Profitability, liquidity and efficiency ratios (HL only) – Revision Notes
Condensed IB DP Business Management revision notes on ratio analysis: formulae, method steps, strategies, insolvency and a self-test for 3.5 and 3.6.
Business · International Baccalaureate · IB
Revise topic -
Study guides
IB DP Business Management: Budgets (HL only)
Study guide to IB DP Business Management 3.9 (HL only): cost and profit centres, constructing a budget, variances and budgets in decision-making.
Business · International Baccalaureate · IB
Read guide
Related articles
-
teaching
A Level tuition in Dubai: Cambridge or Pearson Edexcel International A Level?
Schools in Dubai and Abu Dhabi teach either Cambridge International AS & A Level or Pearson Edexcel International A Level. How the two are structured, why it matters for tuition, and how online classes from Lahore work.
9 October 2026
-
curriculum guides
Choosing subjects at IGCSE and A Level
How subject choices at 14 and 16 affect university options later, and how to keep pathways open without overloading a timetable.
28 July 2026
Studying this with a teacher
Working through Business IB?
This page is free and stays free. If you would rather be taught it, Marlbridge runs Business classes one-to-one, online in your own time zone. The first trial class is free. WhatsApp replies within an hour (8am–11pm Pakistan time, every day); email the same day.
IB Business teachers at Marlbridge

