
Revision Notes
IGCSE Business: Analysis of accounts (Cambridge 0264) – Revision Notes
Condensed revision notes on analysis of accounts for Cambridge IGCSE Business 0264: ratio formulas, users of accounts, limitations and a self-test.
- Subject
- Business
- Level
- IGCSE
- Topic
- Financial information and decisions
- Author
- Marlbridge Academic Team
- Updated
- Reviewed by
- Salman Ahmad (what this means)
Aligned to Cambridge IGCSE Business (0264), For examination in 2027, 2028 and 2029. Official specification .
Syllabus page (what it covers and how it is assessed): Cambridge IGCSE Business.
Syllabus points this page covers
0264
- 5.5 Analysis of accounts
Found an error? Report a correction.
Need help with this topic? Request a free trial class for IGCSE Business (0450 / 0264).
These notes condense section 5.5 (Analysis of accounts) of the Cambridge IGCSE Business 0264 syllabus for examination in 2027, 2028 and 2029. For full explanations and two-year worked examples, read the study guide. When you are ready, move to the practice questions. Both papers, Paper 1 (Short Answer and Data Response) and Paper 2 (Case Study), are based on all the subject content. Use the course hub, the printable checklist and the free diagnostics to plan your revision.
The syllabus names the ratios but gives no formulas, so those below are the standard forms. All businesses are invented and money is in dollars.
5.5.1 Profitability
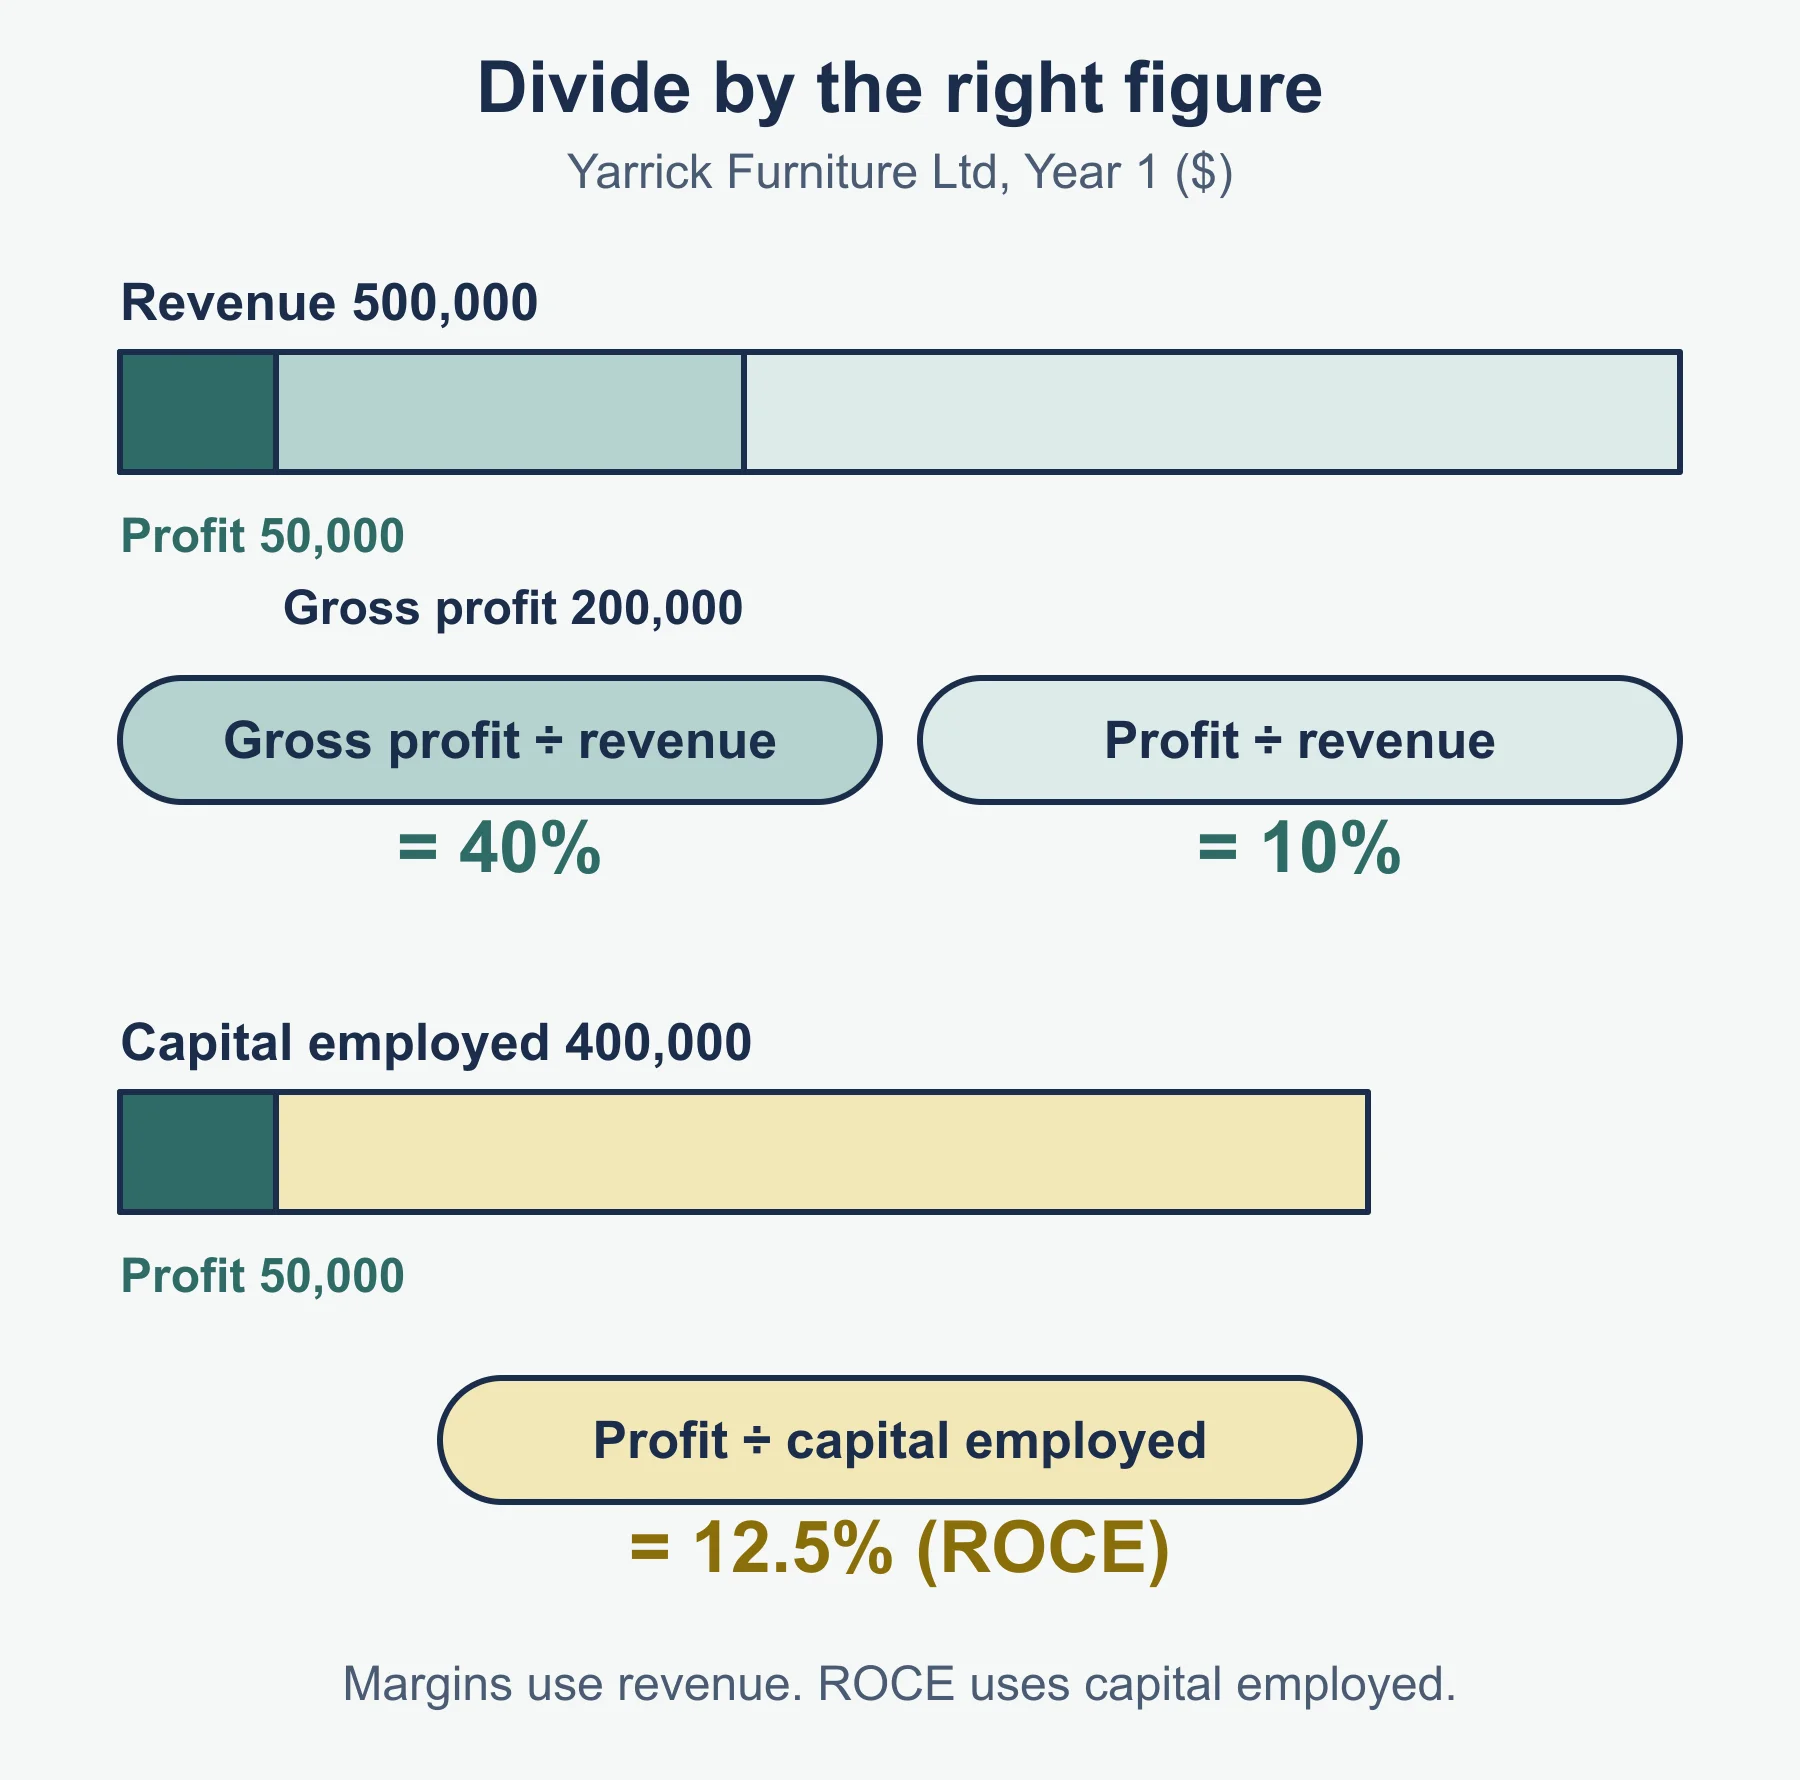
Profitability: how well a business turns sales, or the capital invested in it, into profit. Profit is an amount. Profitability compares profit with something else.
| Ratio | Formula | Unit |
|---|---|---|
| Gross profit margin | (gross profit / revenue) × 100 | % |
| Profit margin | (profit / revenue) × 100 | % |
| ROCE | (profit / capital employed) × 100 | % |
| Capital employed | total assets − current liabilities | amount |
Linked formulas from the statement of profit or loss: gross profit = revenue − cost of sales. Profit = gross profit − expenses.
Capital employed also equals non-current liabilities plus owners’ capital. It is the long-term money in the business.
Method in steps
- Find gross profit (revenue − cost of sales).
- Find profit (gross profit − expenses).
- Choose the divisor: revenue for the two margins, capital employed for ROCE.
- Multiply by 100 and give a % sign.
- Compare with another year or business, say what changed, and give a reason that fits the case.
Worked reminder
Strathen Stationers has revenue of 320,000, cost of sales of 208,000, expenses of 80,000 and capital employed of 250,000.
Gross profit = 320,000 − 208,000 = 112,000, so gross profit margin = 112,000 / 320,000 × 100 = 35%.
Profit = 112,000 − 80,000 = 32,000, so profit margin = 32,000 / 320,000 × 100 = 10%.
ROCE = 32,000 / 250,000 × 100 = 12.8%.
What moves each ratio
| If this happens | Gross profit margin | Profit margin | ROCE |
|---|---|---|---|
| Selling price rises, sales hold | Up | Up | Up |
| Cost of materials rises | Down | Down | Down |
| Expenses rise, other things equal | No change | Down | Down |
| Extra capital invested but profit unchanged | No change | No change | Down |
5.5.2 Liquidity
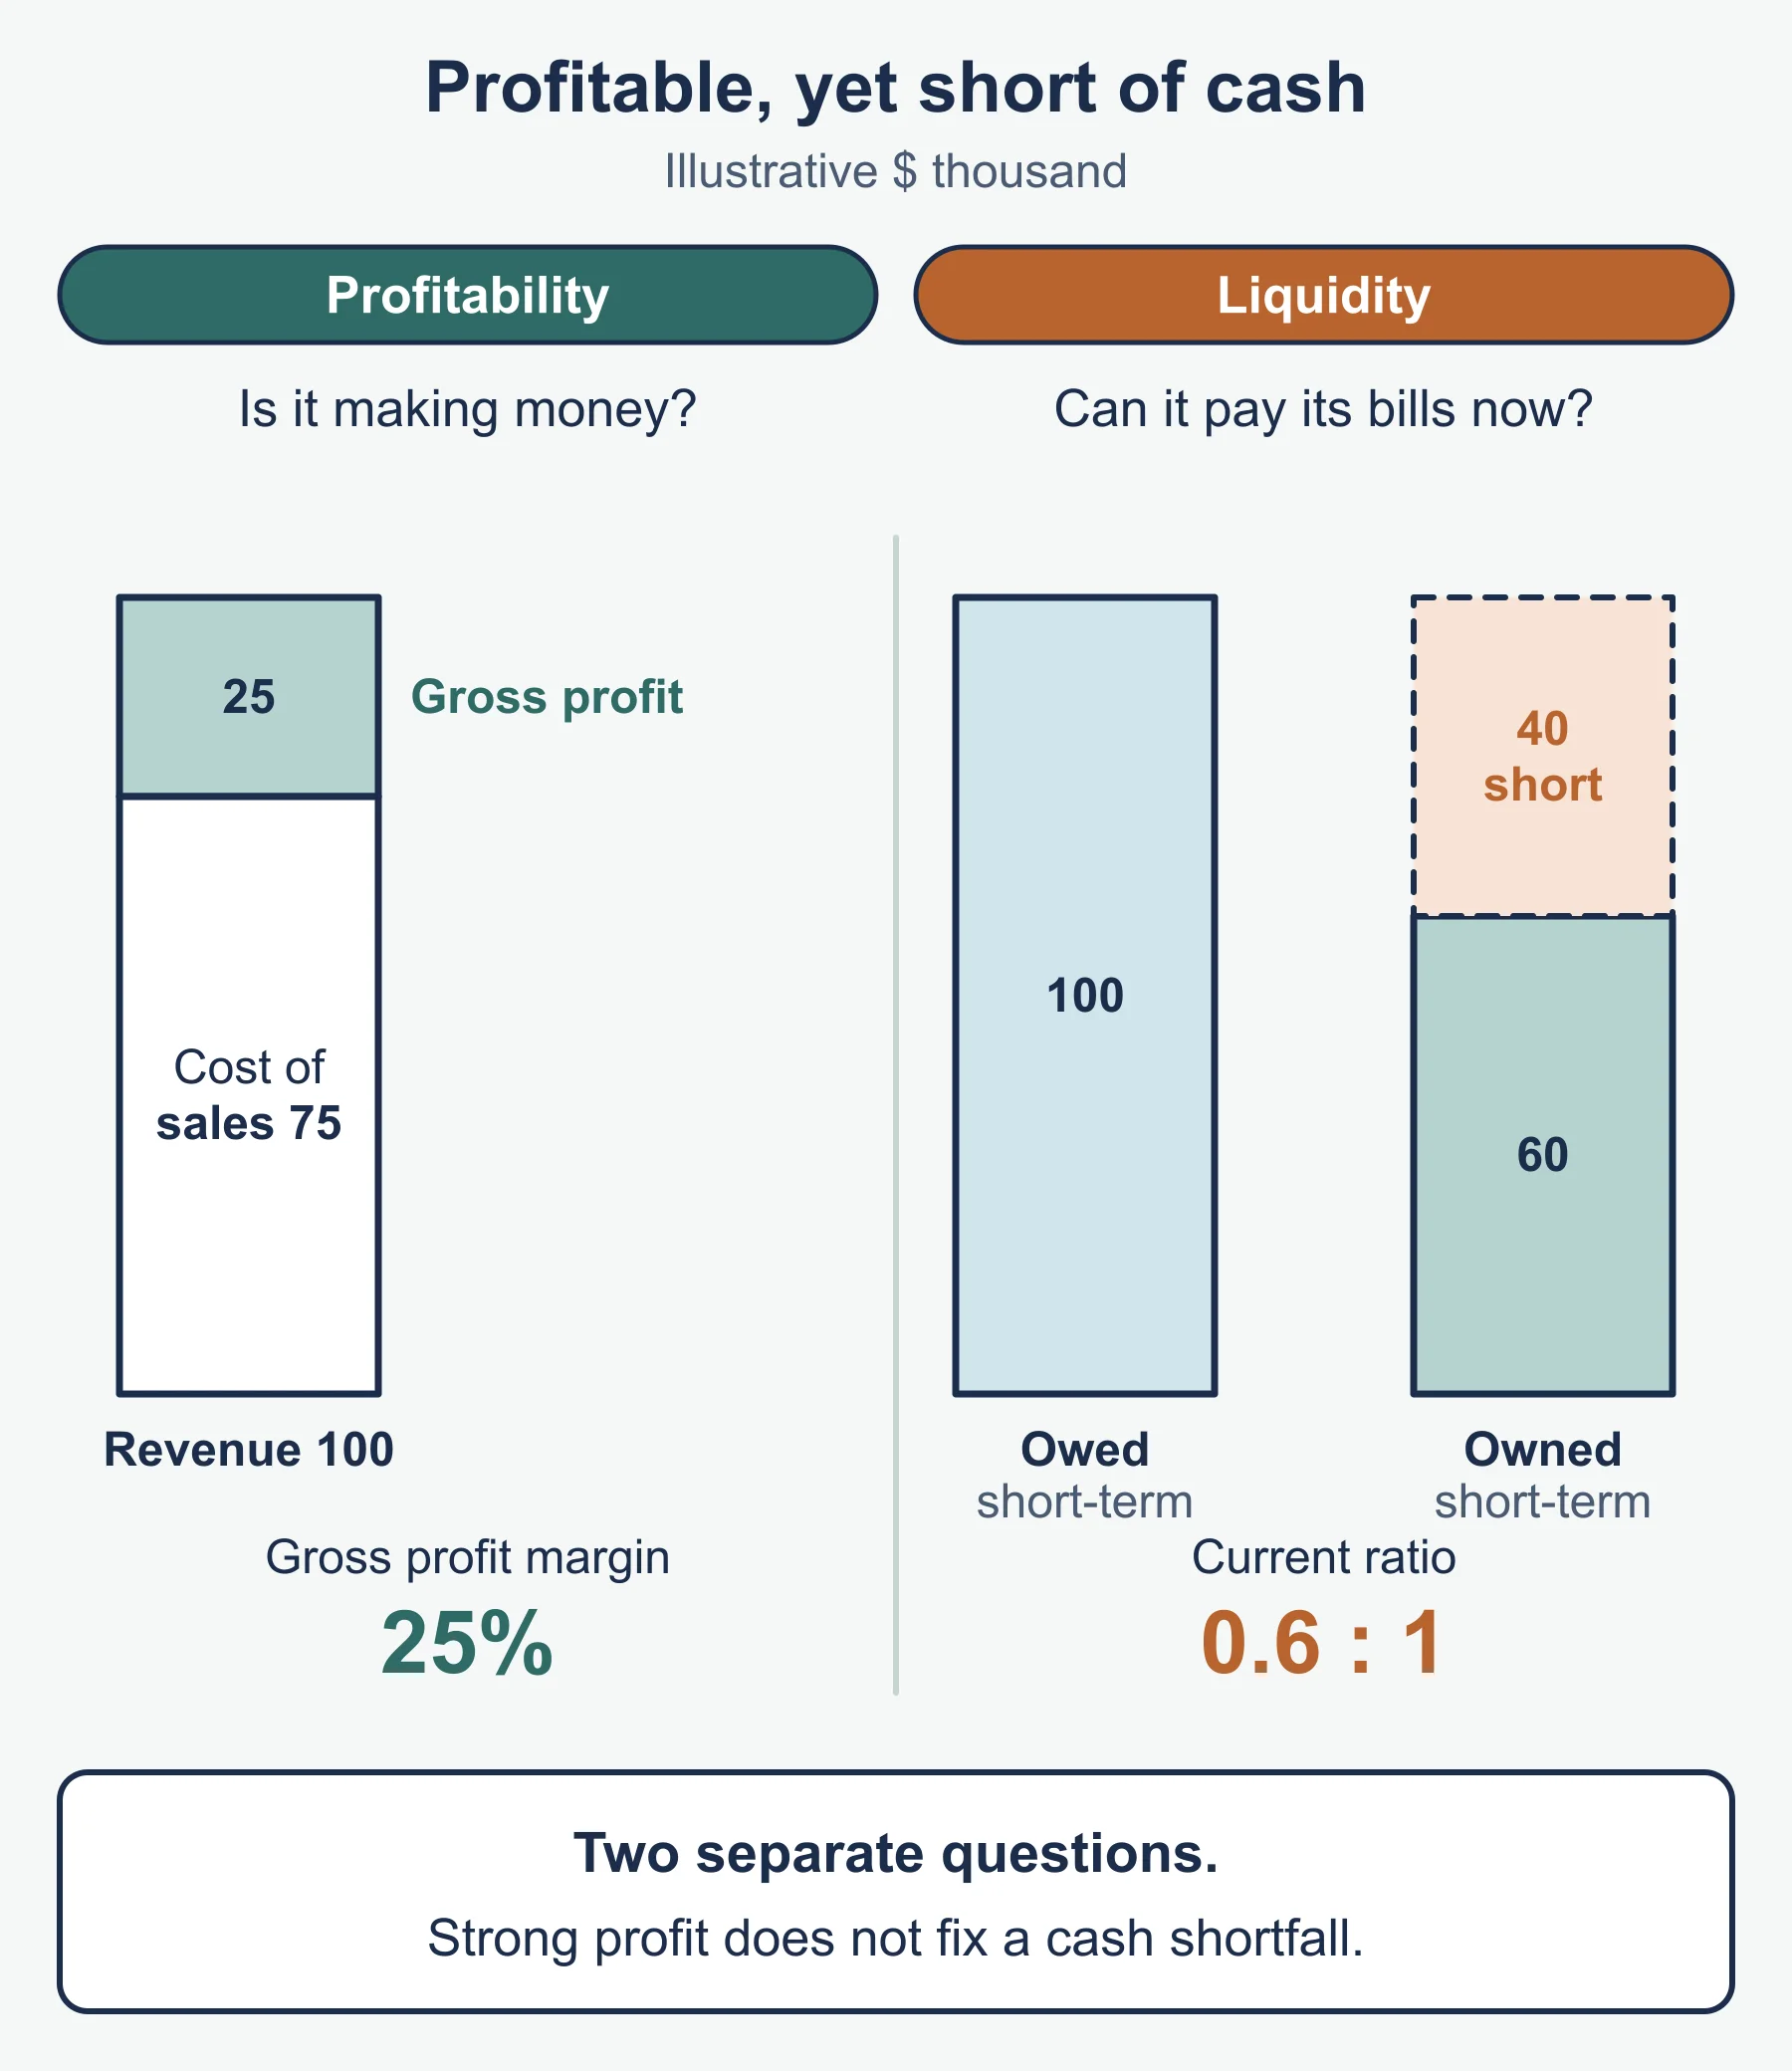
Liquidity: a business’s capacity to meet short-term debts when payment is due, using cash or assets that can quickly be turned into cash.
| Ratio | Formula | Shown as |
|---|---|---|
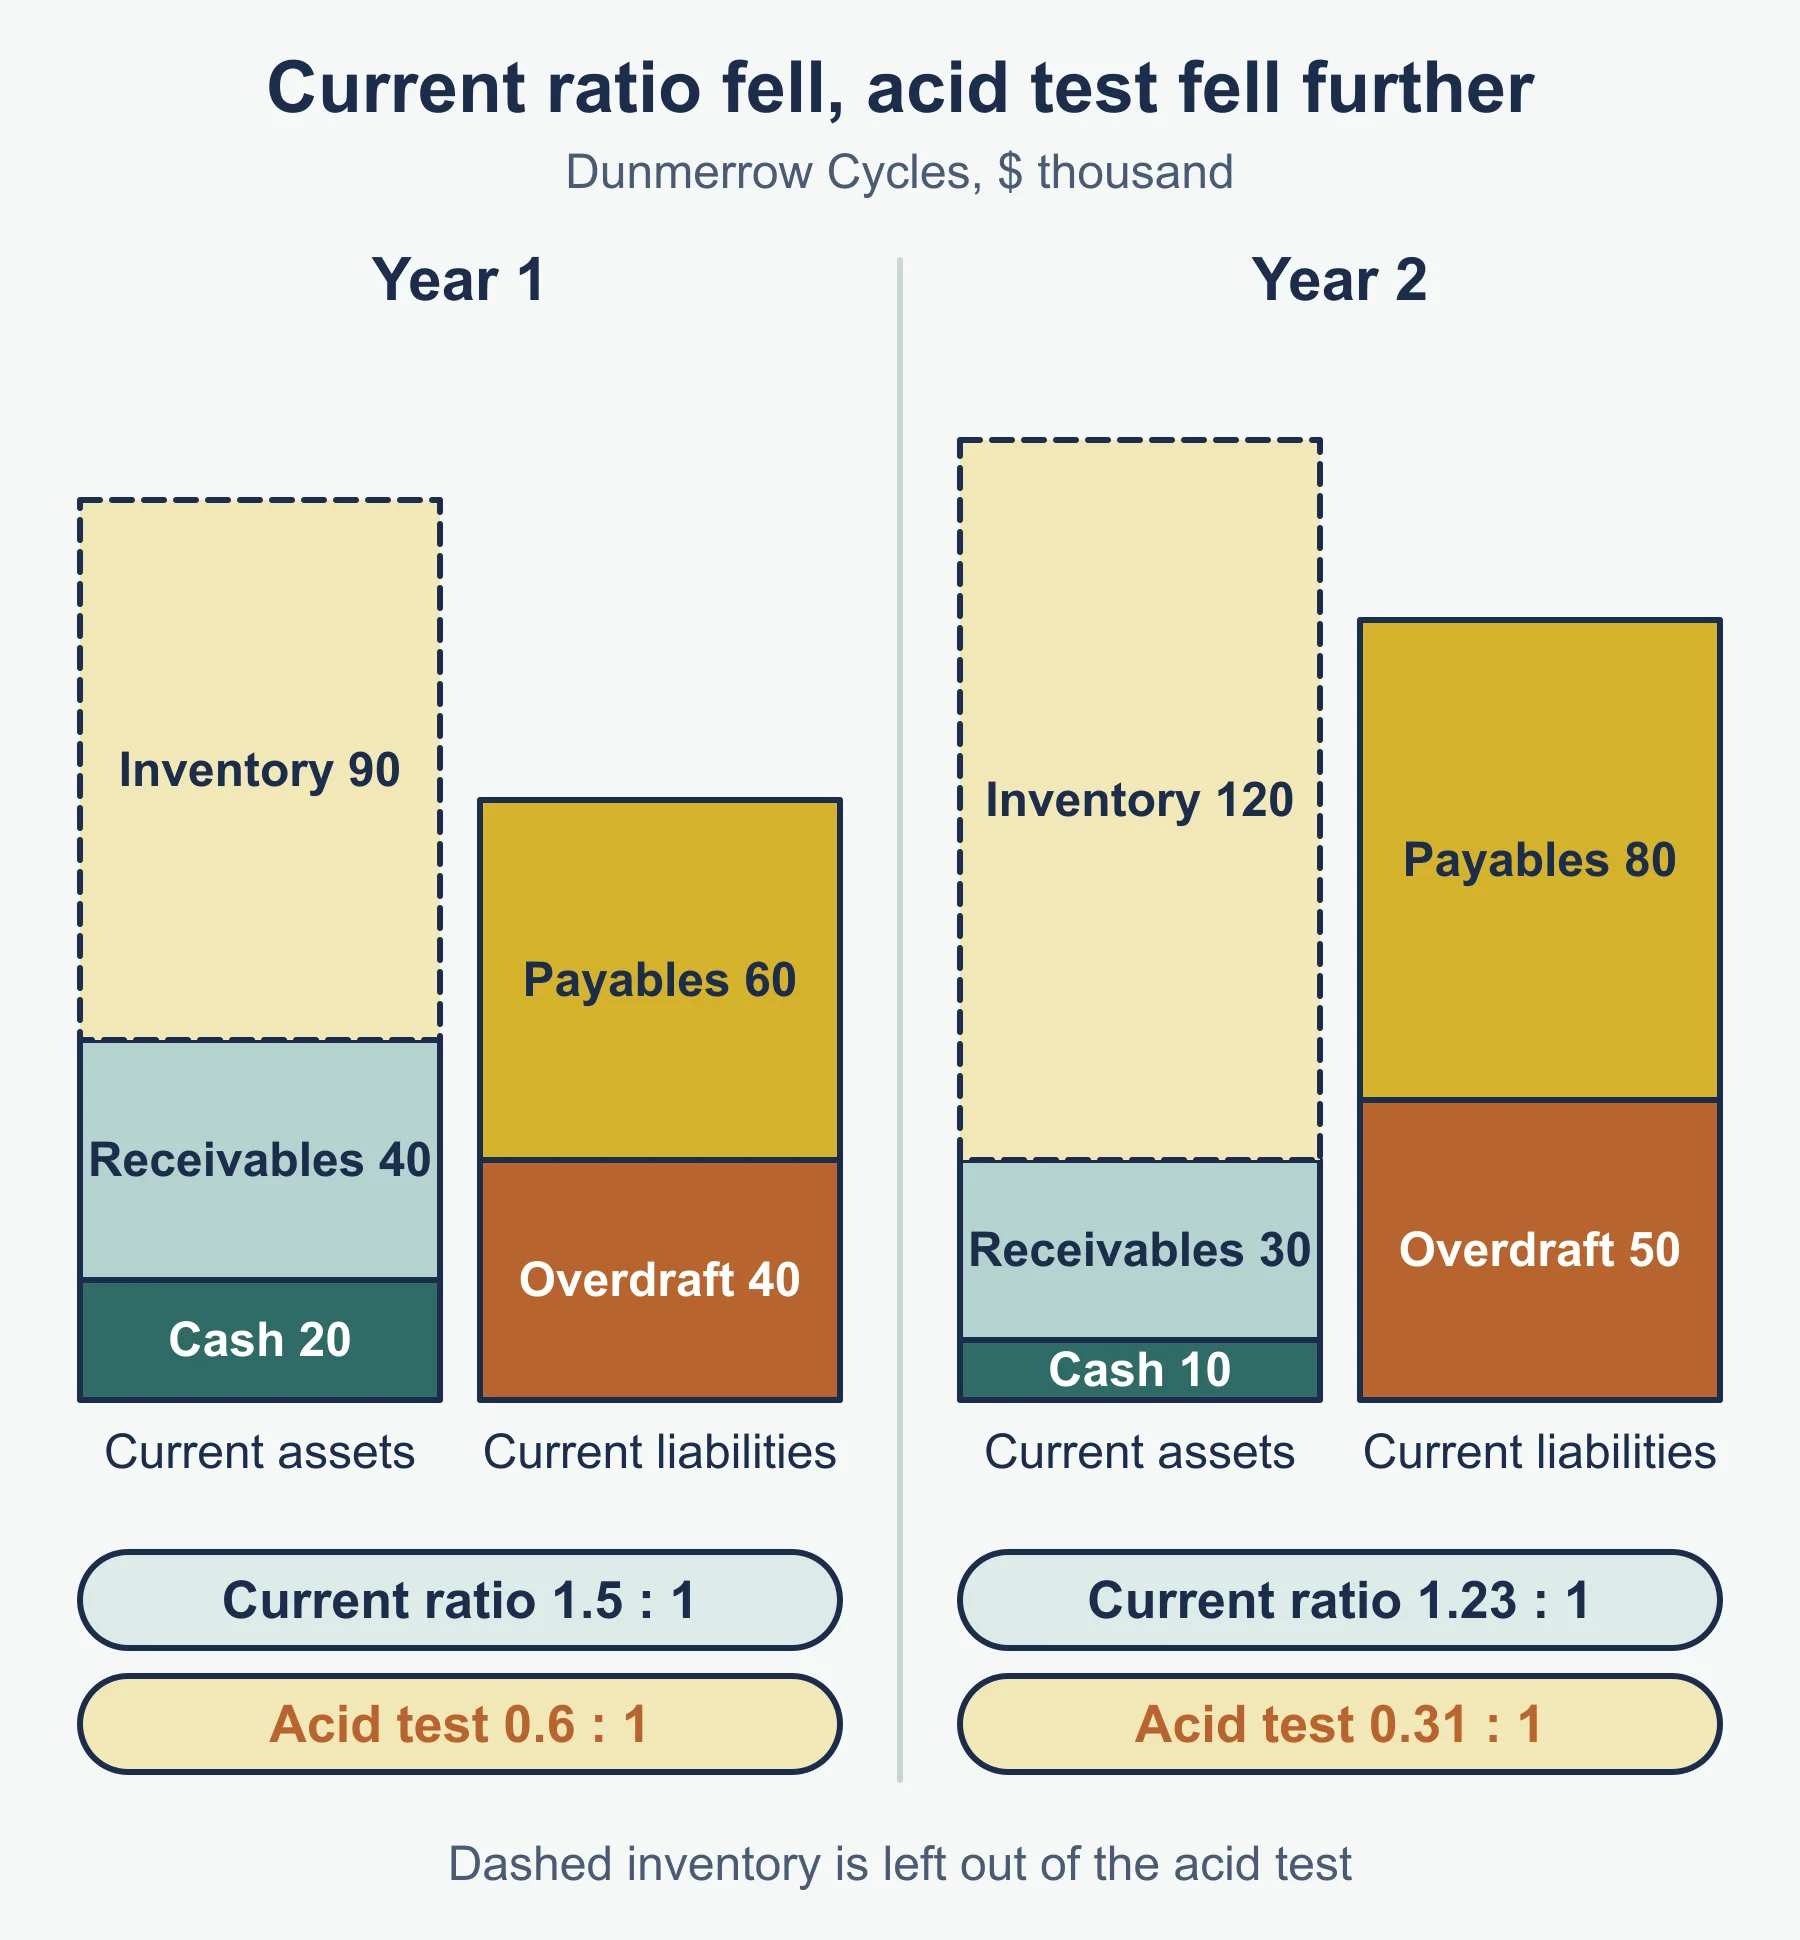
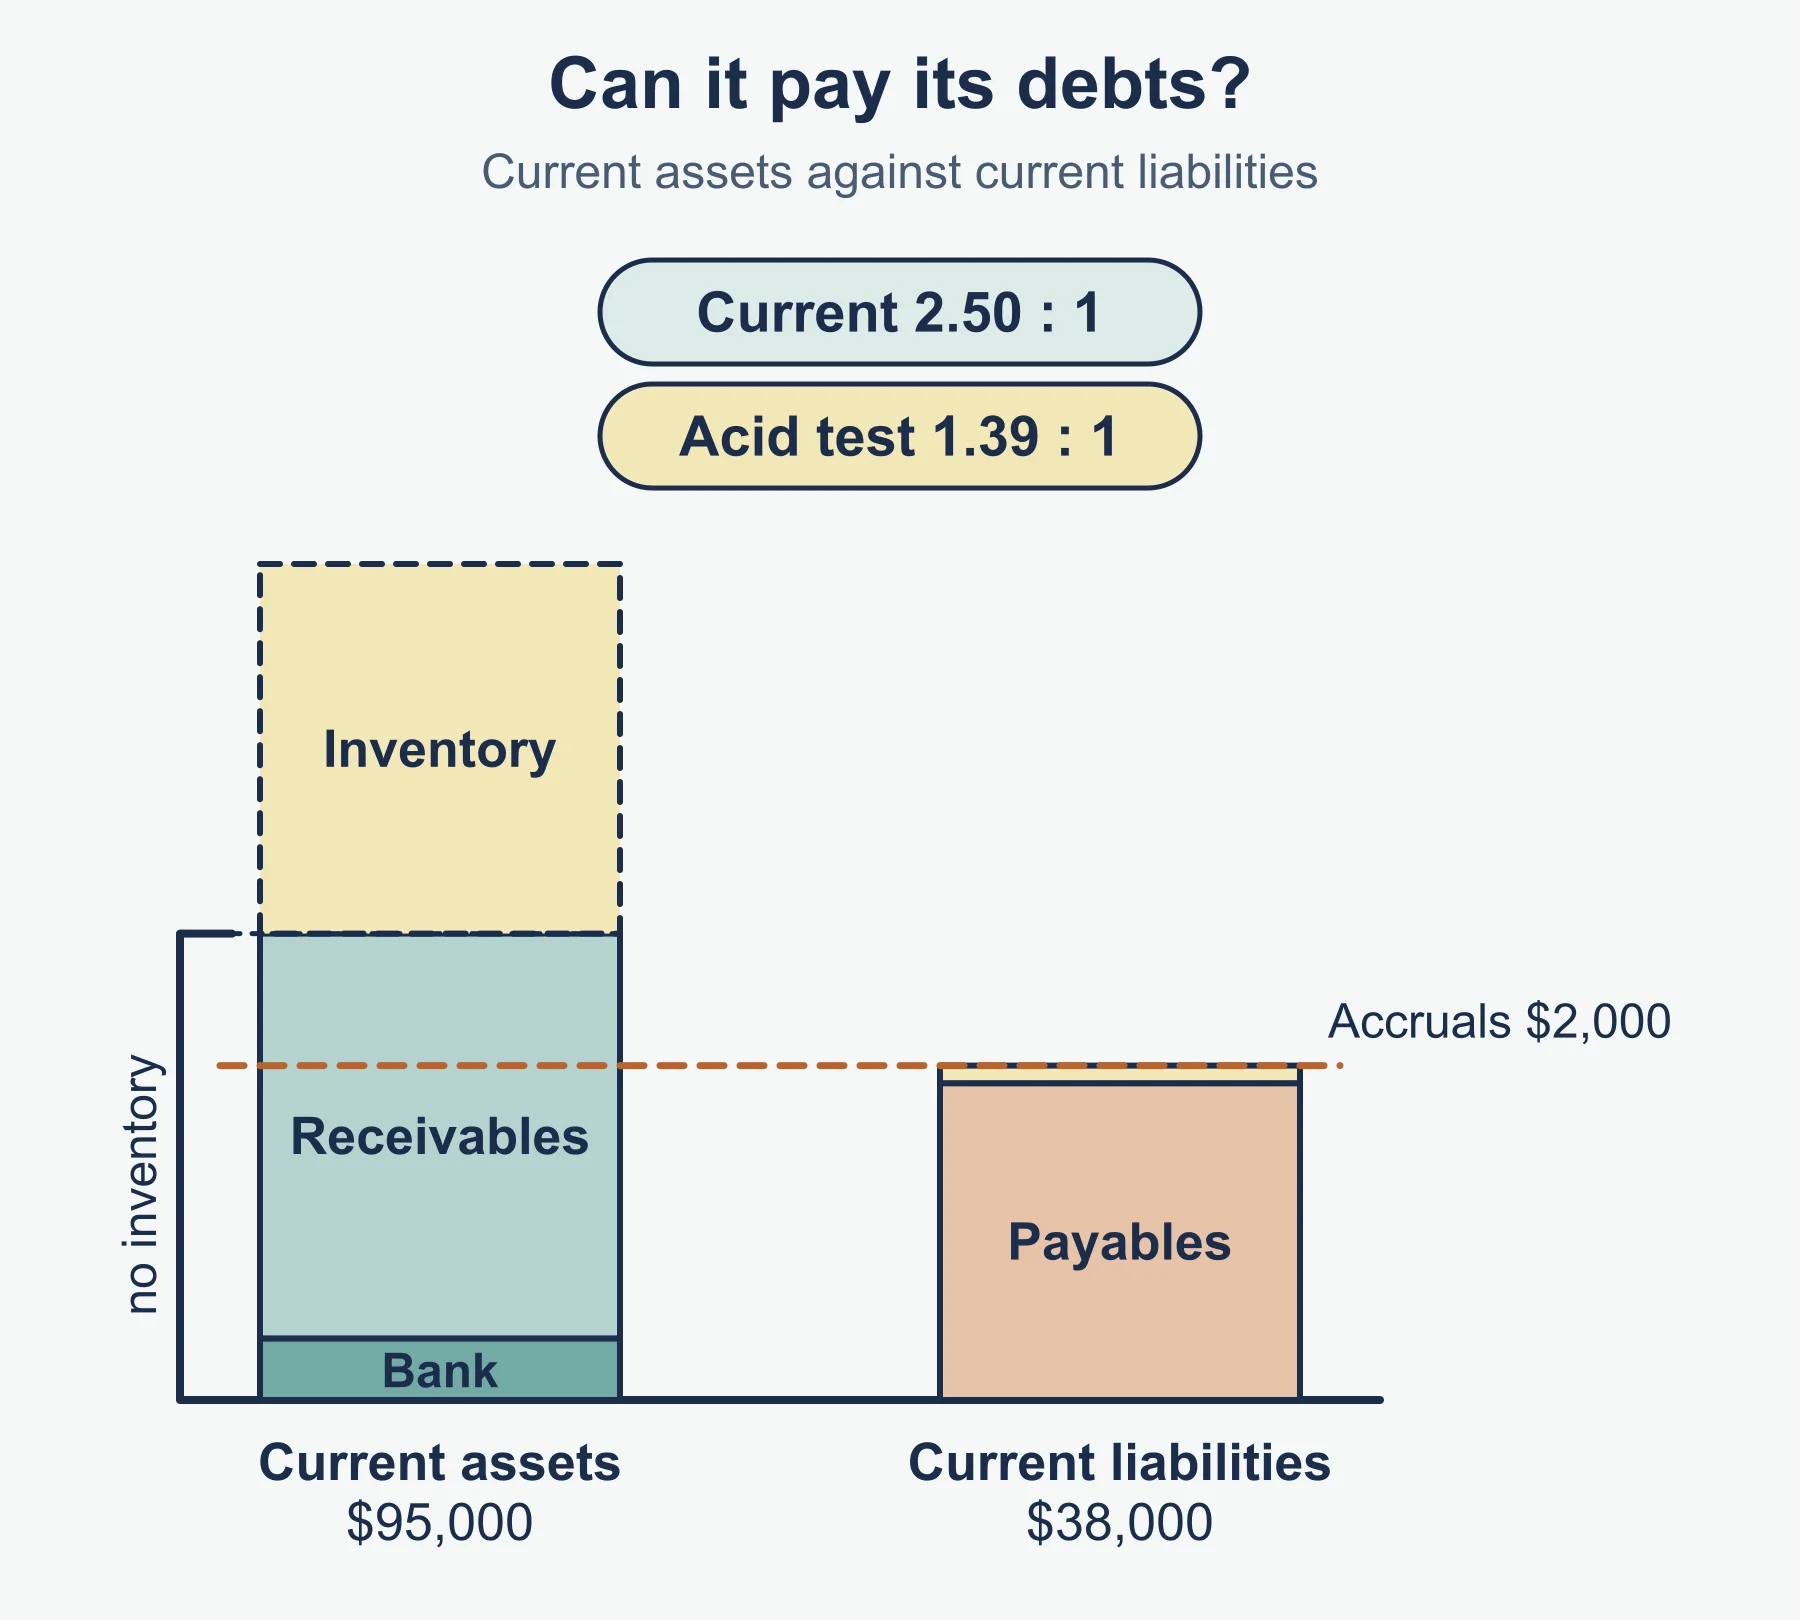
| Current ratio | current assets : current liabilities | x:1 |
| Acid test ratio | (current assets − inventory) : current liabilities | x:1 |
Current assets include inventory, trade receivables and cash. Current liabilities include trade payables and an overdraft. Working capital is current assets minus current liabilities (an amount, not a ratio).
Worked reminder
Current assets 120,000 (of which inventory 48,000). Current liabilities 80,000.
Current ratio = 120,000 / 80,000 = 1.5:1.
Acid test = (120,000 − 48,000) / 80,000 = 72,000 / 80,000 = 0.9:1.
Why the acid test is lower: inventory is the least liquid current asset, so it comes out.
Reading liquidity
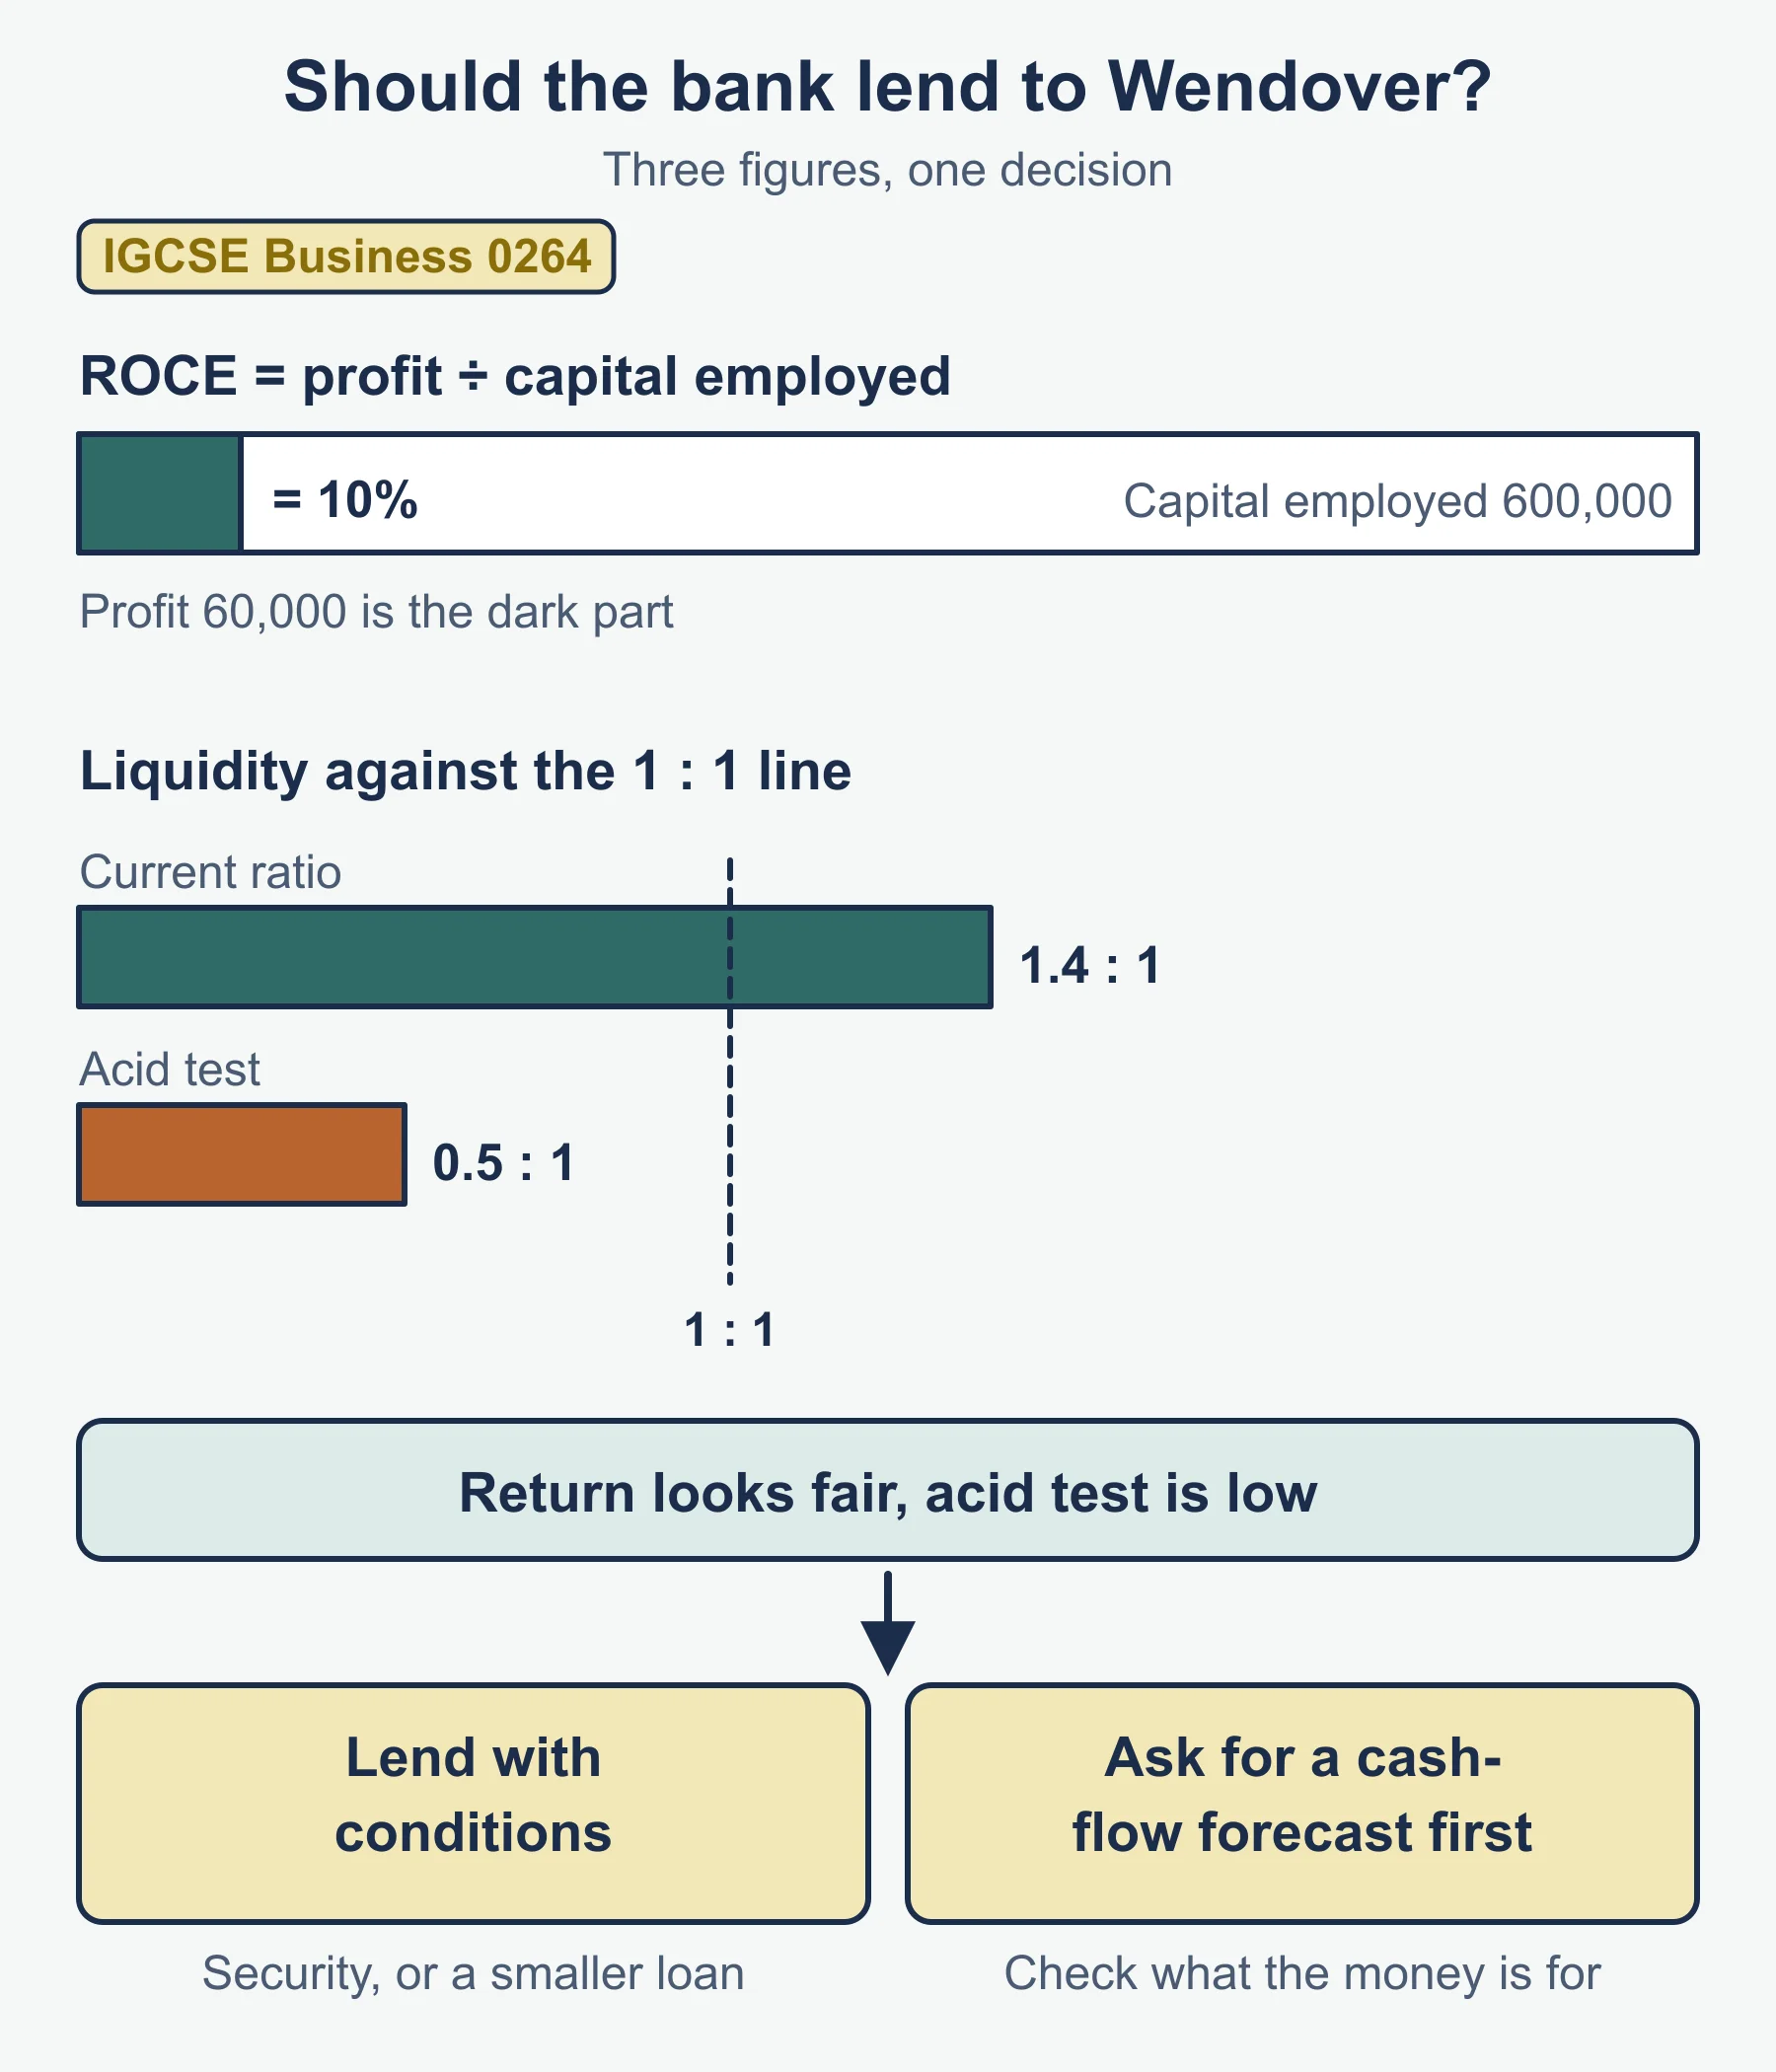
- Below 1:1 on the acid test: liquid assets do not cover short-term bills. Warning sign.
- Stock-heavy firms show a big gap between the two ratios.
- Compare with earlier years and with similar businesses. There is no one figure right for every business.
- Weak liquidity can be eased by collecting receivables sooner, holding less stock or replacing an overdraft with longer-term finance. Each has a cost.
5.5.3 Users of accounts
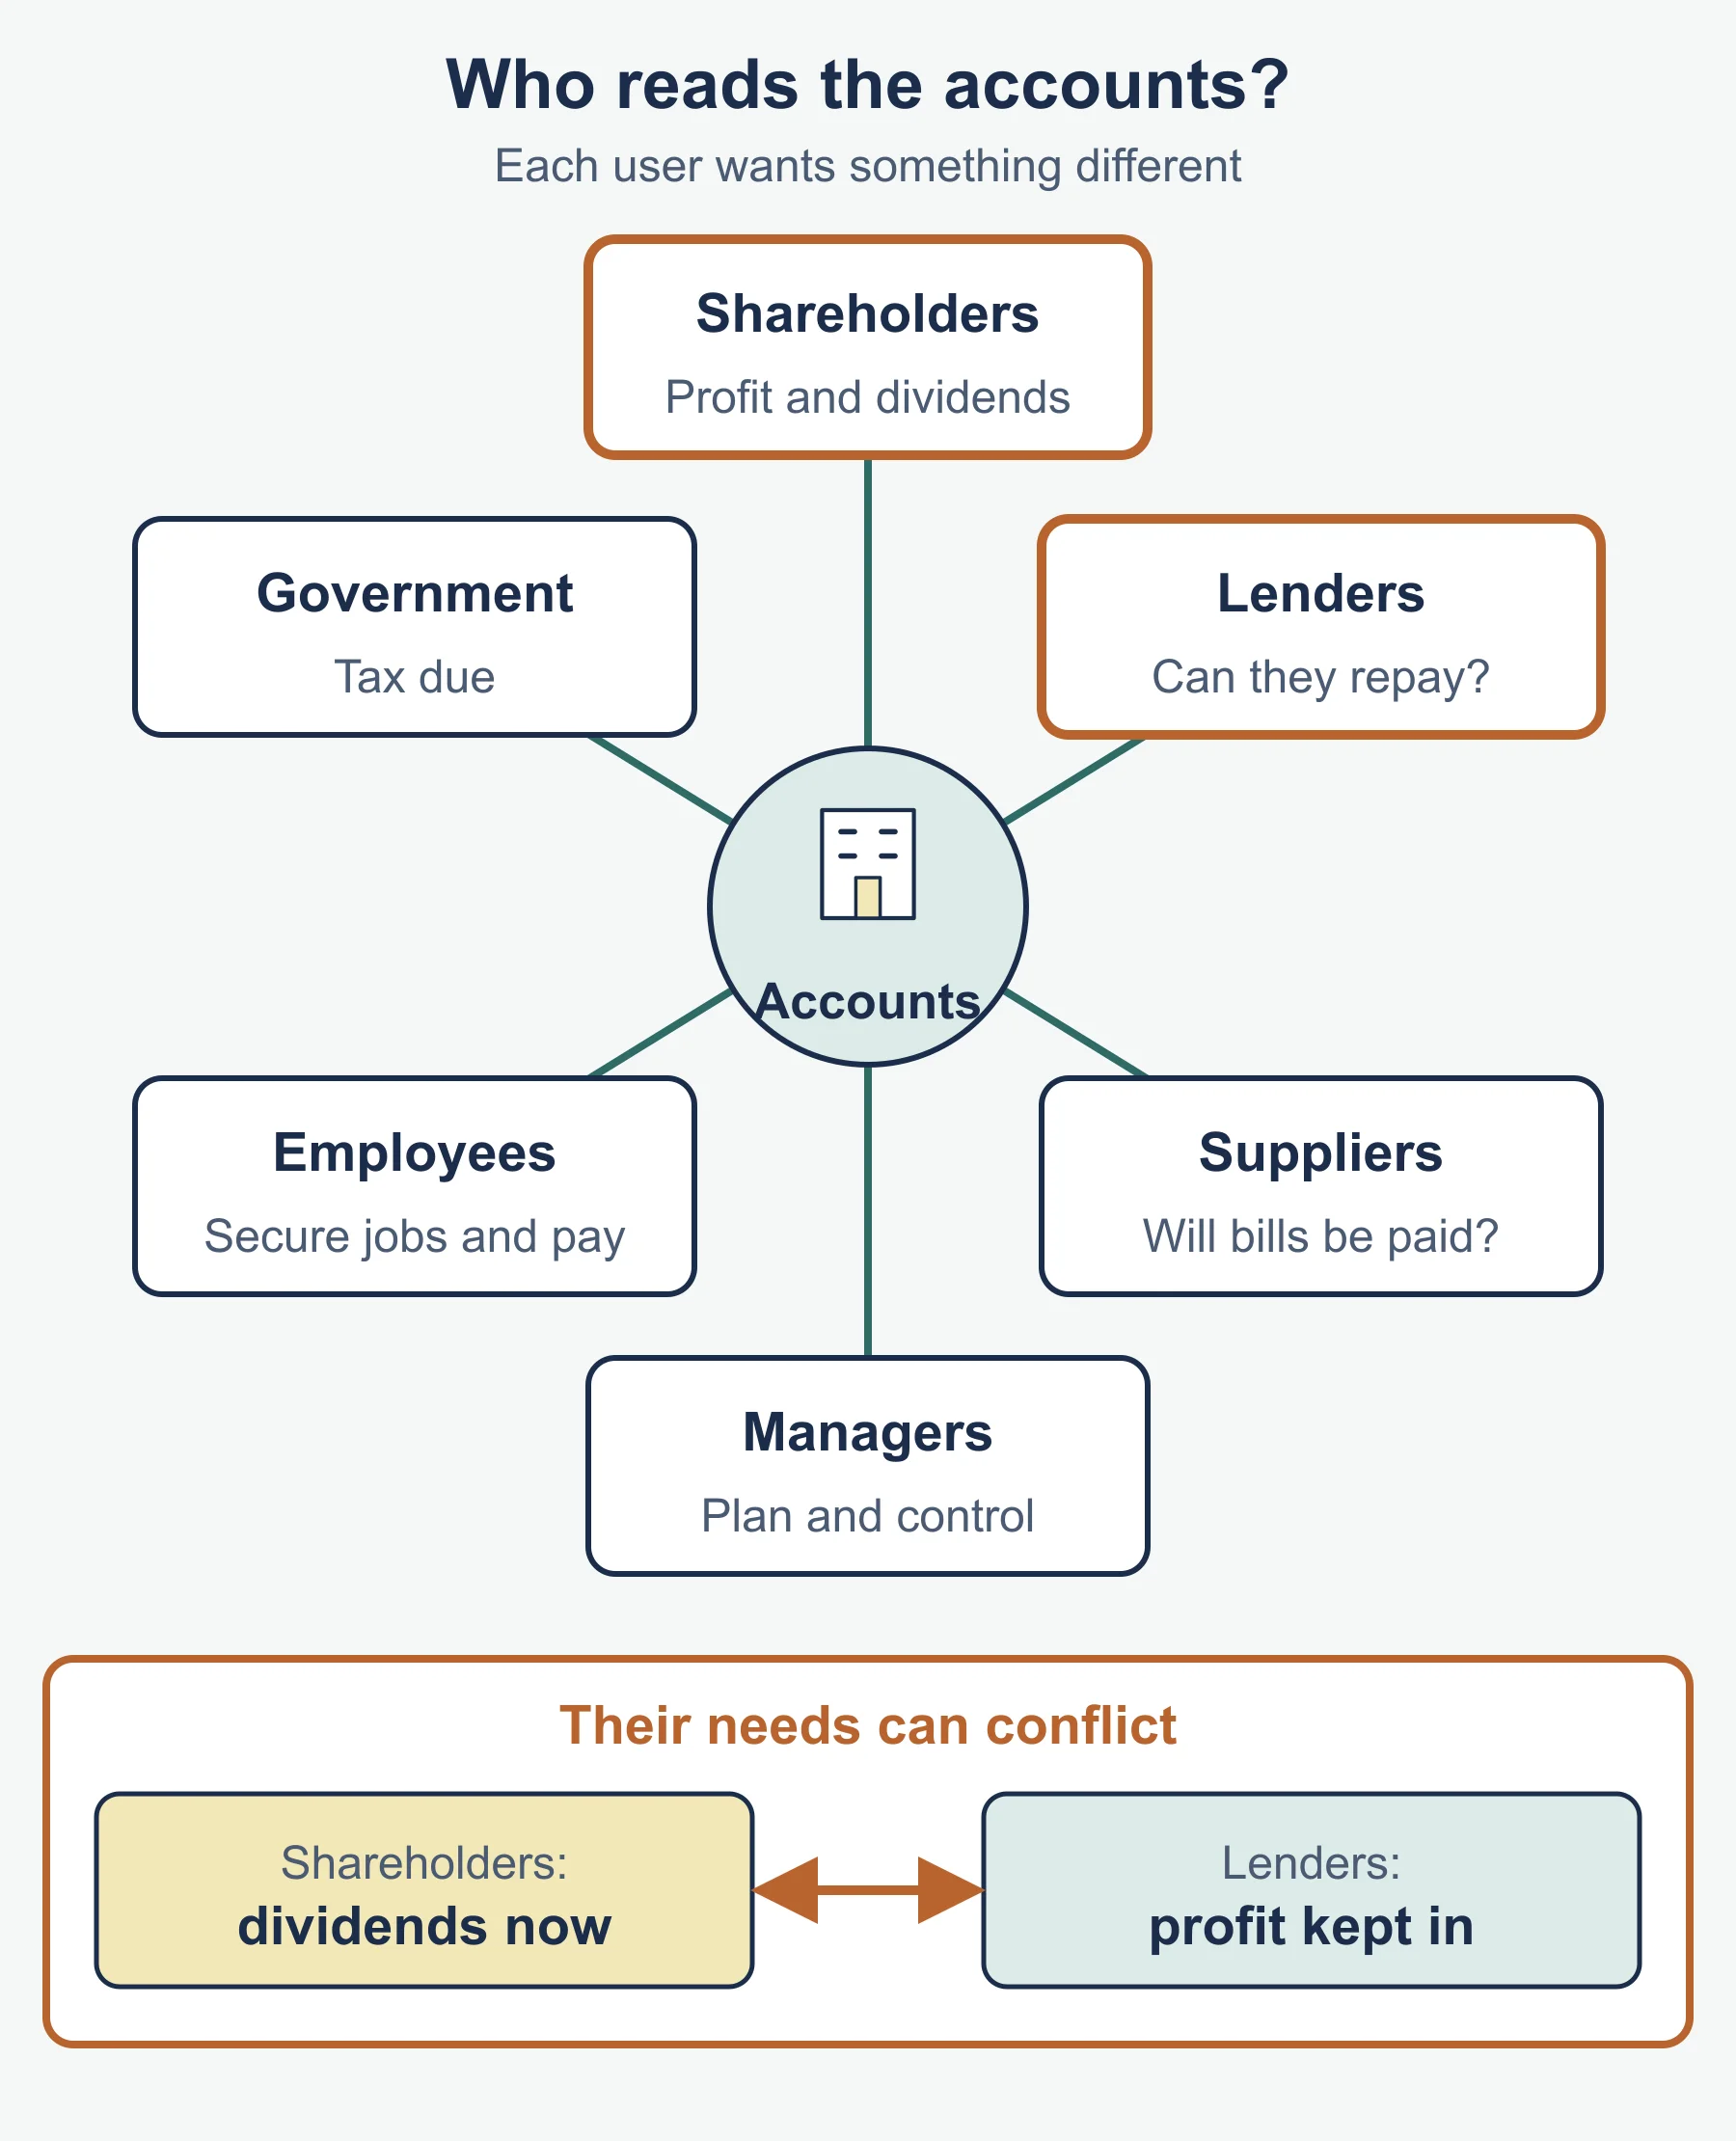
| User | Internal or external | Typical use |
|---|---|---|
| Owners (sole traders, partners, shareholders) | Internal | Judge return, decide whether to reinvest, take profit out or invest elsewhere |
| Managers | Internal | Check performance, set targets, spot problems |
| Employees | Internal | Judge job security and ability to pay wages or bonuses |
| Suppliers | External | Decide whether to sell on credit |
| Government | External | Work out tax due |
| Lenders/banks | External | Decide whether to lend and whether repayments can be met |
How decisions follow from ratios:
- Lend to a business: look at liquidity (can it pay short term?) and ROCE or profit (can it pay interest?).
- Invest in a business: look at profitability and its trend, and compare the return with other uses of the money.
- Supply on credit: look at liquidity.
Limitations of accounts and ratio analysis
- Historical: past figures, not a forecast.
- A snapshot on one date for the statement of financial position.
- One ratio is not enough: compare over time and with similar businesses.
- Non-financial factors (quality, morale, reputation) are left out.
- Different timing choices can change figures.
- Ratios show that something changed, not why.
Must-know distinctions
- Profit and profitability: an amount against a measure in proportion.
- Gross profit margin and profit margin: the first ignores expenses, the second includes them.
- Profit margin and ROCE: one divides by revenue, the other by capital employed.
- Profitability and liquidity: long-run earning power against short-run ability to pay bills.
- Current ratio and acid test: the acid test removes inventory.
Writing about ratios: a pattern that earns credit
- Calculate: show the formula line and the working, then the answer with its unit.
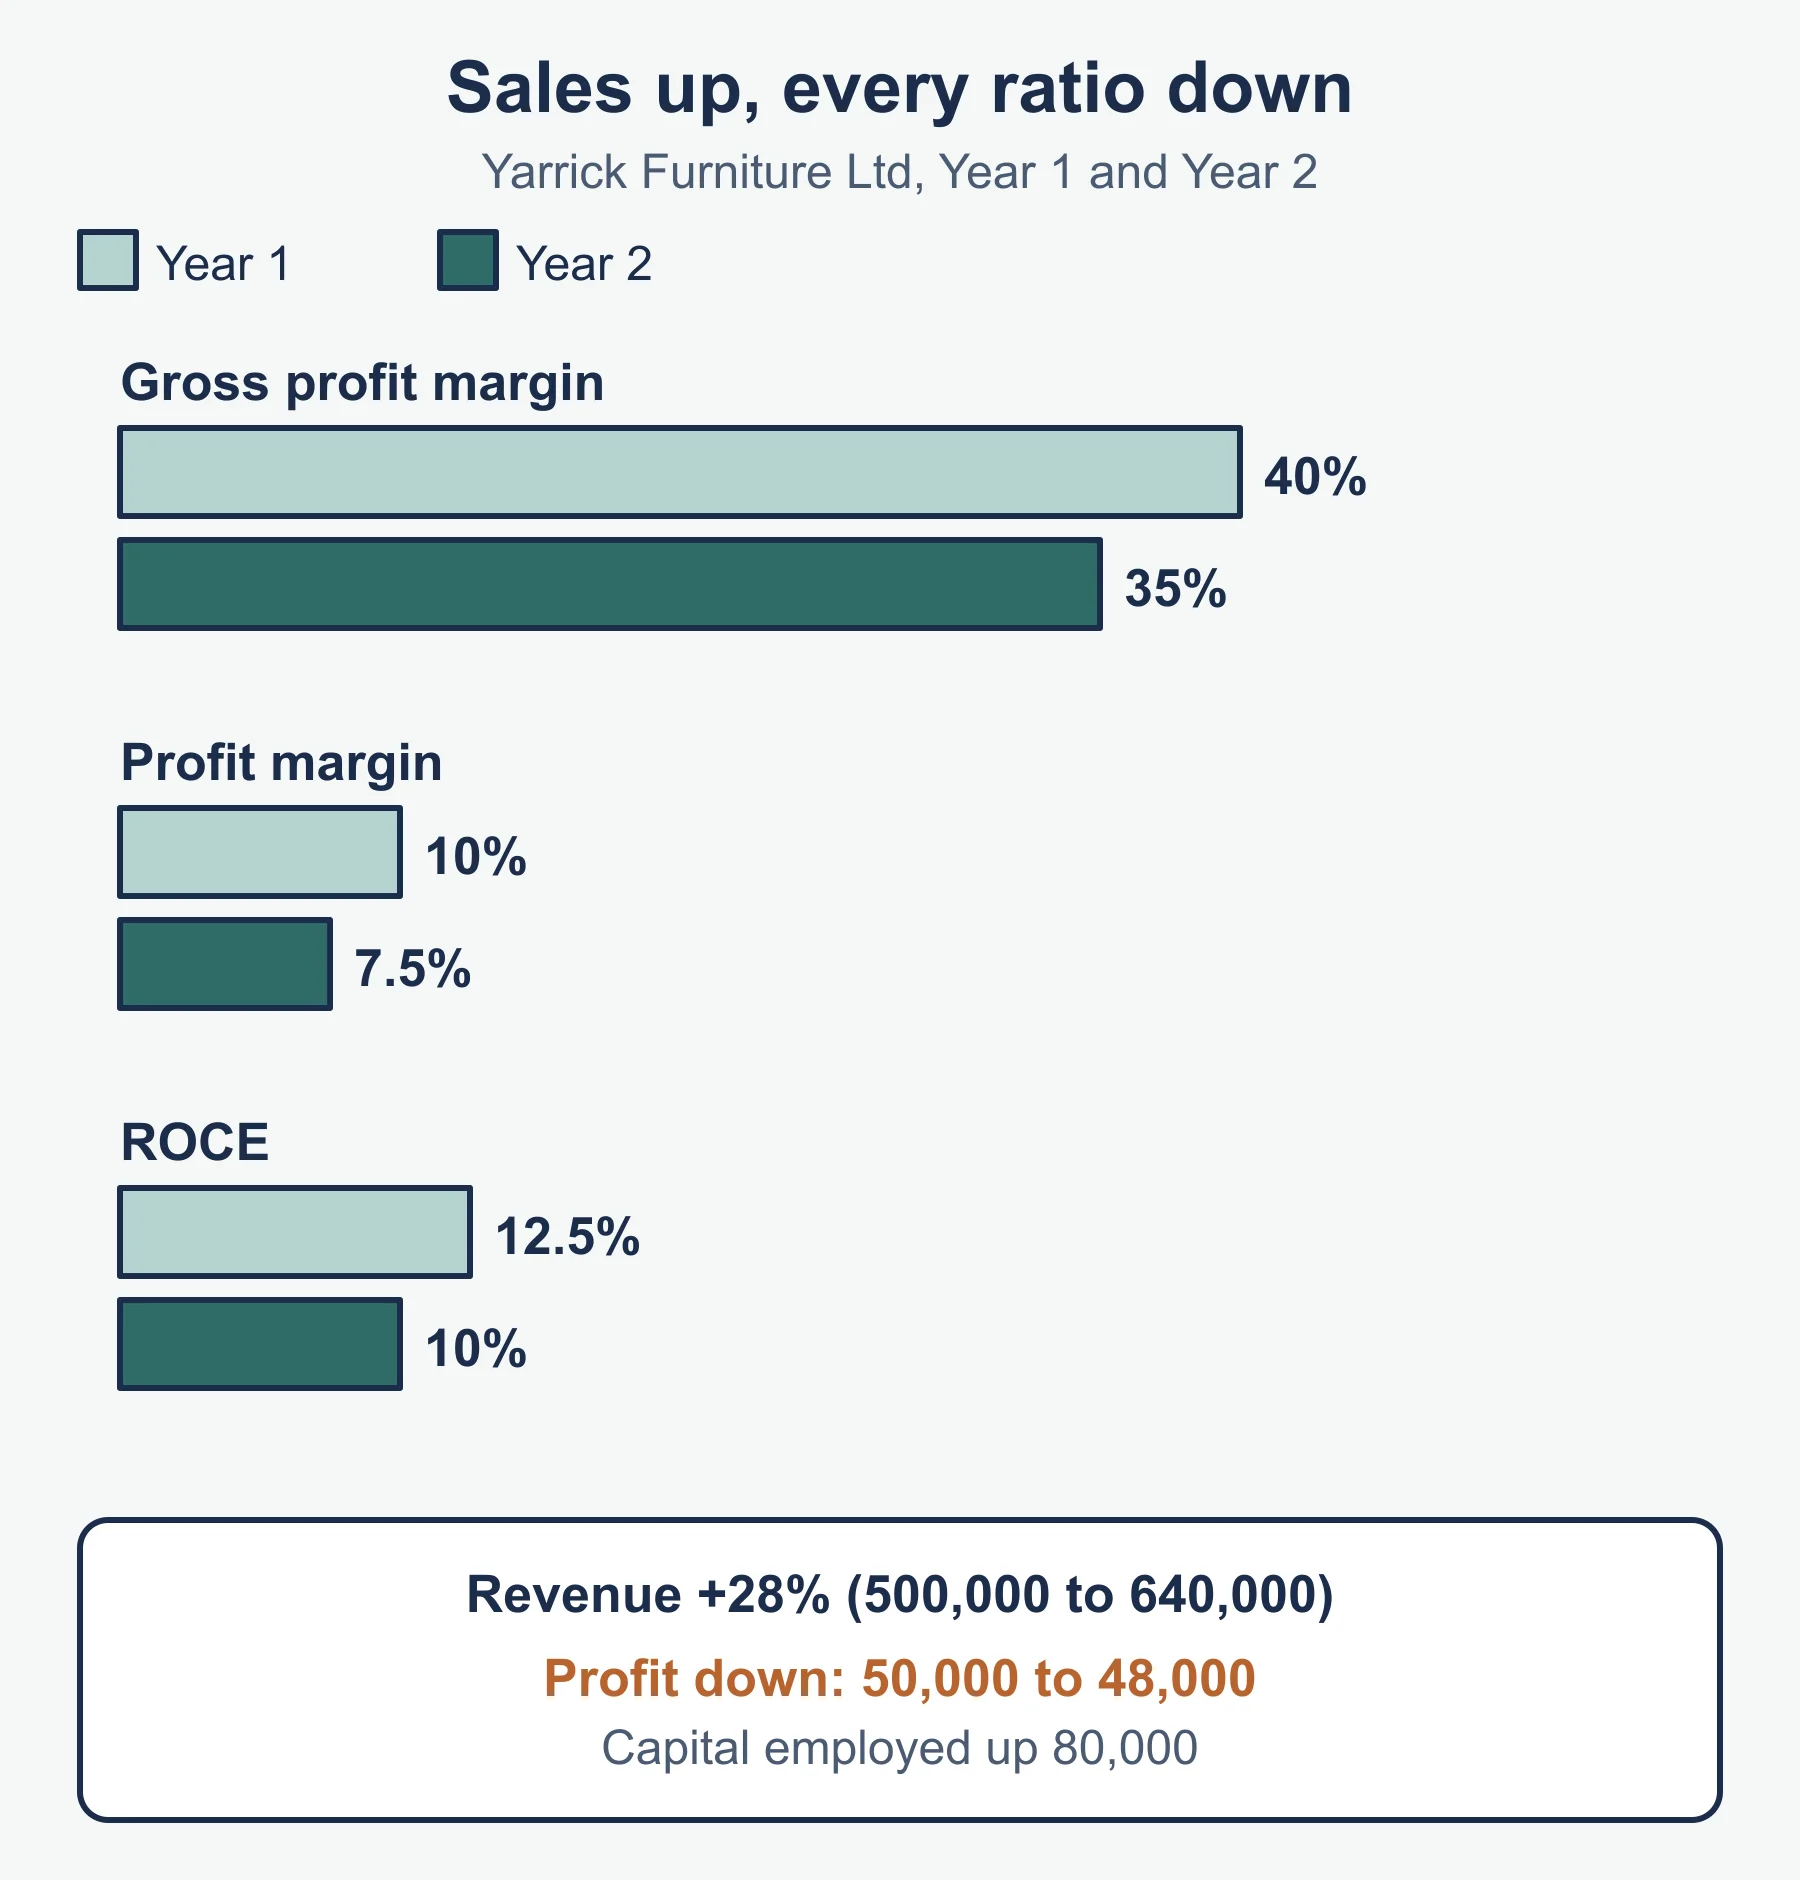
- State what changed: for example “ROCE fell from 12.5% to 10%”.
- Explain why it matters: what the change means for profit, cash or risk in this business.
- Give a likely cause: tie it to the case, such as higher costs or more stock.
- Reach a view: for a decision question, say what the user should do and why, and note one point against.
Command words in this topic
| Command word | What it asks for here |
|---|---|
| Define | A precise meaning of profitability or liquidity |
| State, Identify | A short answer: a user, a ratio, a limitation |
| Calculate | Work out a figure from the data given |
| Explain | A reason, with a link to the business |
| Outline | The main points only, briefly |
| Justify, Consider | A decision supported with evidence from the figures, weighing both sides |
Decision reminder
A supplier is asked to sell goods on credit to a customer whose acid test fell from 0.9:1 to 0.4:1 in a year. The fall is the key evidence: the customer has fewer liquid assets for each 1 owed. The supplier might still supply but ask for shorter payment terms, set a credit limit or ask for part-payment first. It would also weigh the value of the customer’s orders against the risk of not being paid.
An investor is told that a business’s ROCE rose from 8% to 11% while its current ratio fell. Higher ROCE is a good sign for return, but the weaker current ratio raises the risk of cash problems. A balanced view looks at both before deciding.
Quick self-test
- Define profitability.
- Revenue is 250,000 and cost of sales is 160,000. Calculate the gross profit margin.
- Profit is 27,000 on revenue of 300,000. Calculate the profit margin.
- Profit is 45,000 and capital employed is 300,000. Calculate ROCE.
- Current assets are 84,000 and current liabilities are 56,000. Calculate the current ratio.
- In question 5, inventory is 30,000. Calculate the acid test ratio to two decimal places.
- Total assets are 520,000 and current liabilities are 130,000. Calculate capital employed.
- Revenue is 400,000 and the gross profit margin is 30%. Calculate gross profit and cost of sales.
- Identify two external users of accounts and one thing each might check.
- Revenue is 550,000 and the gross profit margin is 32%. Calculate gross profit.
- State two limitations of ratio analysis.
Answers
- How well a business turns its sales or capital into profit, shown by comparing profit with revenue or capital employed.
- Gross profit = 250,000 − 160,000 = 90,000. Margin = 90,000 / 250,000 × 100 = 36%.
- 27,000 / 300,000 × 100 = 9%.
- 45,000 / 300,000 × 100 = 15%.
- 84,000 / 56,000 = 1.5:1.
- (84,000 − 30,000) / 56,000 = 54,000 / 56,000 = 0.96:1.
- 520,000 − 130,000 = 390,000.
- Gross profit = 30% of 400,000 = 120,000. Cost of sales = 400,000 − 120,000 = 280,000.
- For example, a supplier checks liquidity to see whether it will be paid. A bank checks ROCE or profit to see whether interest can be met. The government checks profit to work out tax.
- 32% of 550,000 = 176,000.
- Any two: figures are historical, the statement of financial position is a snapshot, ratios ignore non-financial factors, one ratio alone is not enough, ratios do not explain causes.
Where marks are usually lost
- Dividing by the wrong figure: revenue for ROCE, or capital employed for a margin.
- Leaving out the percentage sign on margins and ROCE, or writing a liquidity ratio as a percentage.
- Forgetting to remove inventory in the acid test.
- Calculating the right answer but not saying what it means for the business.
- Saying “profit went up so profitability improved” without checking the ratio.
- Naming a user but not the figure they would use.
- Giving a limitation in general terms, with no link to the case.
- Reaching a recommendation without weighing at least one point against it.
Frequently asked questions
How do you calculate the gross profit margin and profit margin? Gross profit margin is gross profit divided by revenue, times 100. Profit margin is profit divided by revenue, times 100, where profit is gross profit less expenses.
What is the difference between profitability and liquidity? Profitability is long-run earning power: how well a business turns sales or capital into profit. Liquidity is short-run ability to pay bills: a business’s capacity to meet short-term debts when payment is due.
What does an acid test ratio below 1:1 mean? It means the business’s liquid assets, excluding inventory, do not cover its short-term bills, which is a warning sign. Compare it with earlier years and similar businesses, as there is no single right figure for every business.
Does a rise in profit mean profitability has improved? Not necessarily. Profit is an amount, while profitability is a measure in proportion, so check the ratio: profit can rise while the profit margin falls.
Official syllabus
Aligned to section 5.5 of the Cambridge IGCSE Business 0264 syllabus for examination in 2027, 2028 and 2029, published by Cambridge University Press & Assessment (Cambridge International Education).
Get free revision emails (optional)
Occasional emails with practice questions, worked explanations and links to free resources for the qualification and subjects you choose. No spam, and you can unsubscribe from any email. The free tools on this site never need an email.
Related resources
-
Study guides
IGCSE Business: Business finance (Cambridge 0264)
Study guide to Cambridge IGCSE Business 0264 section 5.1: why businesses need finance, working capital, sources of finance and choosing between them.
Business · Cambridge · IGCSE
Read guide -
Practice questions
IGCSE Business: Business finance (Cambridge 0264) – Practice Questions
Original practice questions with worked answers for Cambridge IGCSE Business 0264 section 5.1: needs for finance, working capital and sources of finance.
Business · Cambridge · IGCSE
Try questions -
Revision notes
IGCSE Business: Business finance (Cambridge 0264) – Revision Notes
Revision notes for Cambridge IGCSE Business 0264 section 5.1: finance needs, working capital, sources of finance, choosing a source, and a self-test.
Business · Cambridge · IGCSE
Revise topic
Related articles
-
teaching
A Level tuition in Dubai: Cambridge or Pearson Edexcel International A Level?
Schools in Dubai and Abu Dhabi teach either Cambridge International AS & A Level or Pearson Edexcel International A Level. How the two are structured, why it matters for tuition, and how online classes from Lahore work.
9 October 2026
-
curriculum guides
Choosing subjects at IGCSE and A Level
How subject choices at 14 and 16 affect university options later, and how to keep pathways open without overloading a timetable.
28 July 2026
Studying this with a teacher
Working through Business IGCSE?
This page is free and stays free. If you would rather be taught it, Marlbridge runs Business classes one-to-one and in small groups of up to 15, online in your own time zone. The first trial class is free. WhatsApp replies within an hour (8am–11pm Pakistan time, every day); email the same day.
Cambridge Business teachers at Marlbridge

