
Revision Notes
O Level Business: Costs, scale of production and break-even analysis (Cambridge 7115) – Revision Notes
Condensed revision notes on cost types, economies and diseconomies of scale, break-even charts and margin of safety for Cambridge O Level Business 7115.
- Subject
- Business
- Level
- O LEVELS
- Topic
- Operations management
- Author
- Marlbridge Academic Team
- Updated
- Reviewed by
- Salman Ahmad (what this means)
Aligned to Cambridge O Level Business (7115), For examination in 2026. Official specification .
Syllabus page (what it covers and how it is assessed): Cambridge O Level Business.
Syllabus points this page covers
7115
- 4.2 Costs, scale of production and break-even analysis
Found an error? Report a correction.
Need help with this topic? Request a free trial class for O Level Business (7115).
These revision notes condense section 4.2 of the Cambridge O Level Business Studies 7115 syllabus for examination in 2026: costs, scale of production and break-even analysis. For full explanations and longer worked examples, read the study guide. When you are ready to test yourself, use the practice questions. More operations questions are in the operations management practice set. Course pages: Cambridge O Level Business hub and the printable checklist. Not sure what to revise first? Take a free 10-minute diagnostic.
All money below is in dollars and every business is invented.
4.2.1 Costs: definitions and formulas
| Term | Meaning | Example |
|---|---|---|
| Fixed cost | Does not change with output (in the normal range) | Rent, insurance, manager’s salary |
| Variable cost | Changes directly with output | Materials, packaging, piece-rate pay |
| Total cost | Fixed costs + total variable costs | |
| Average cost | Total cost / output (cost per unit) | |
| Contribution | Revenue - variable costs (or price - variable cost per unit) |
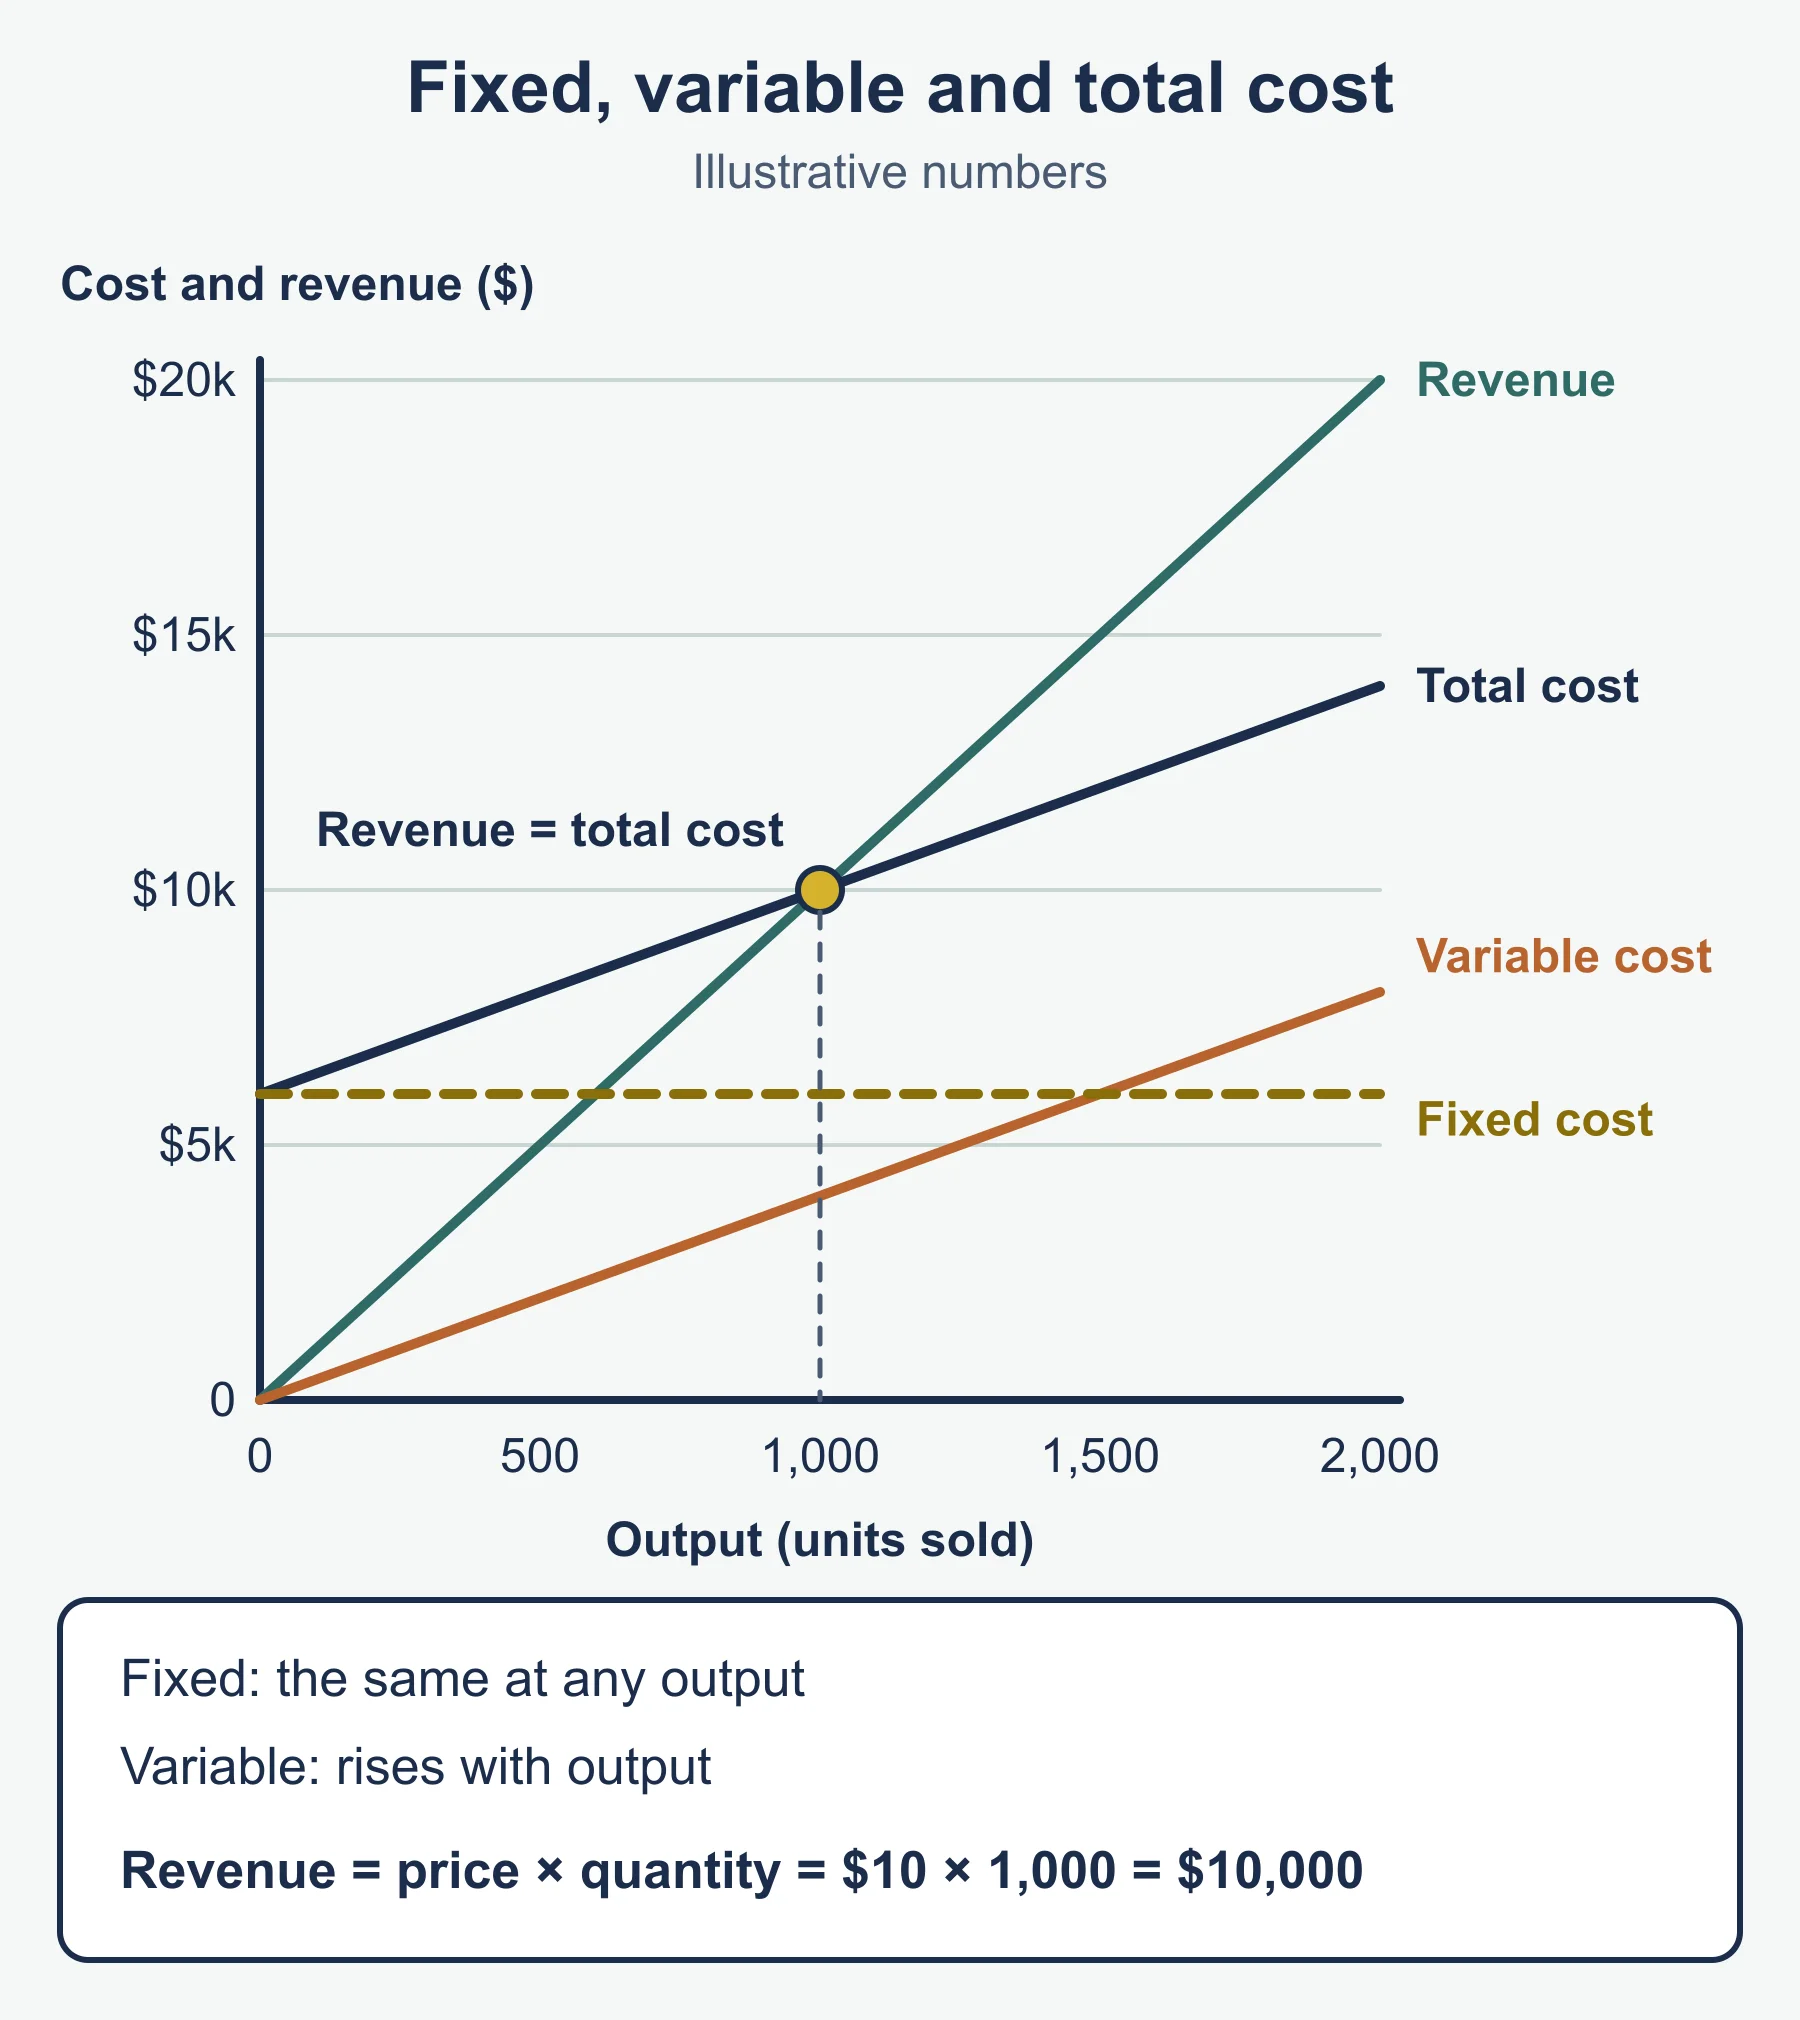
Formulas: total variable cost = variable cost per unit x output. Total cost = fixed costs + total variable cost. Average cost = total cost / output.
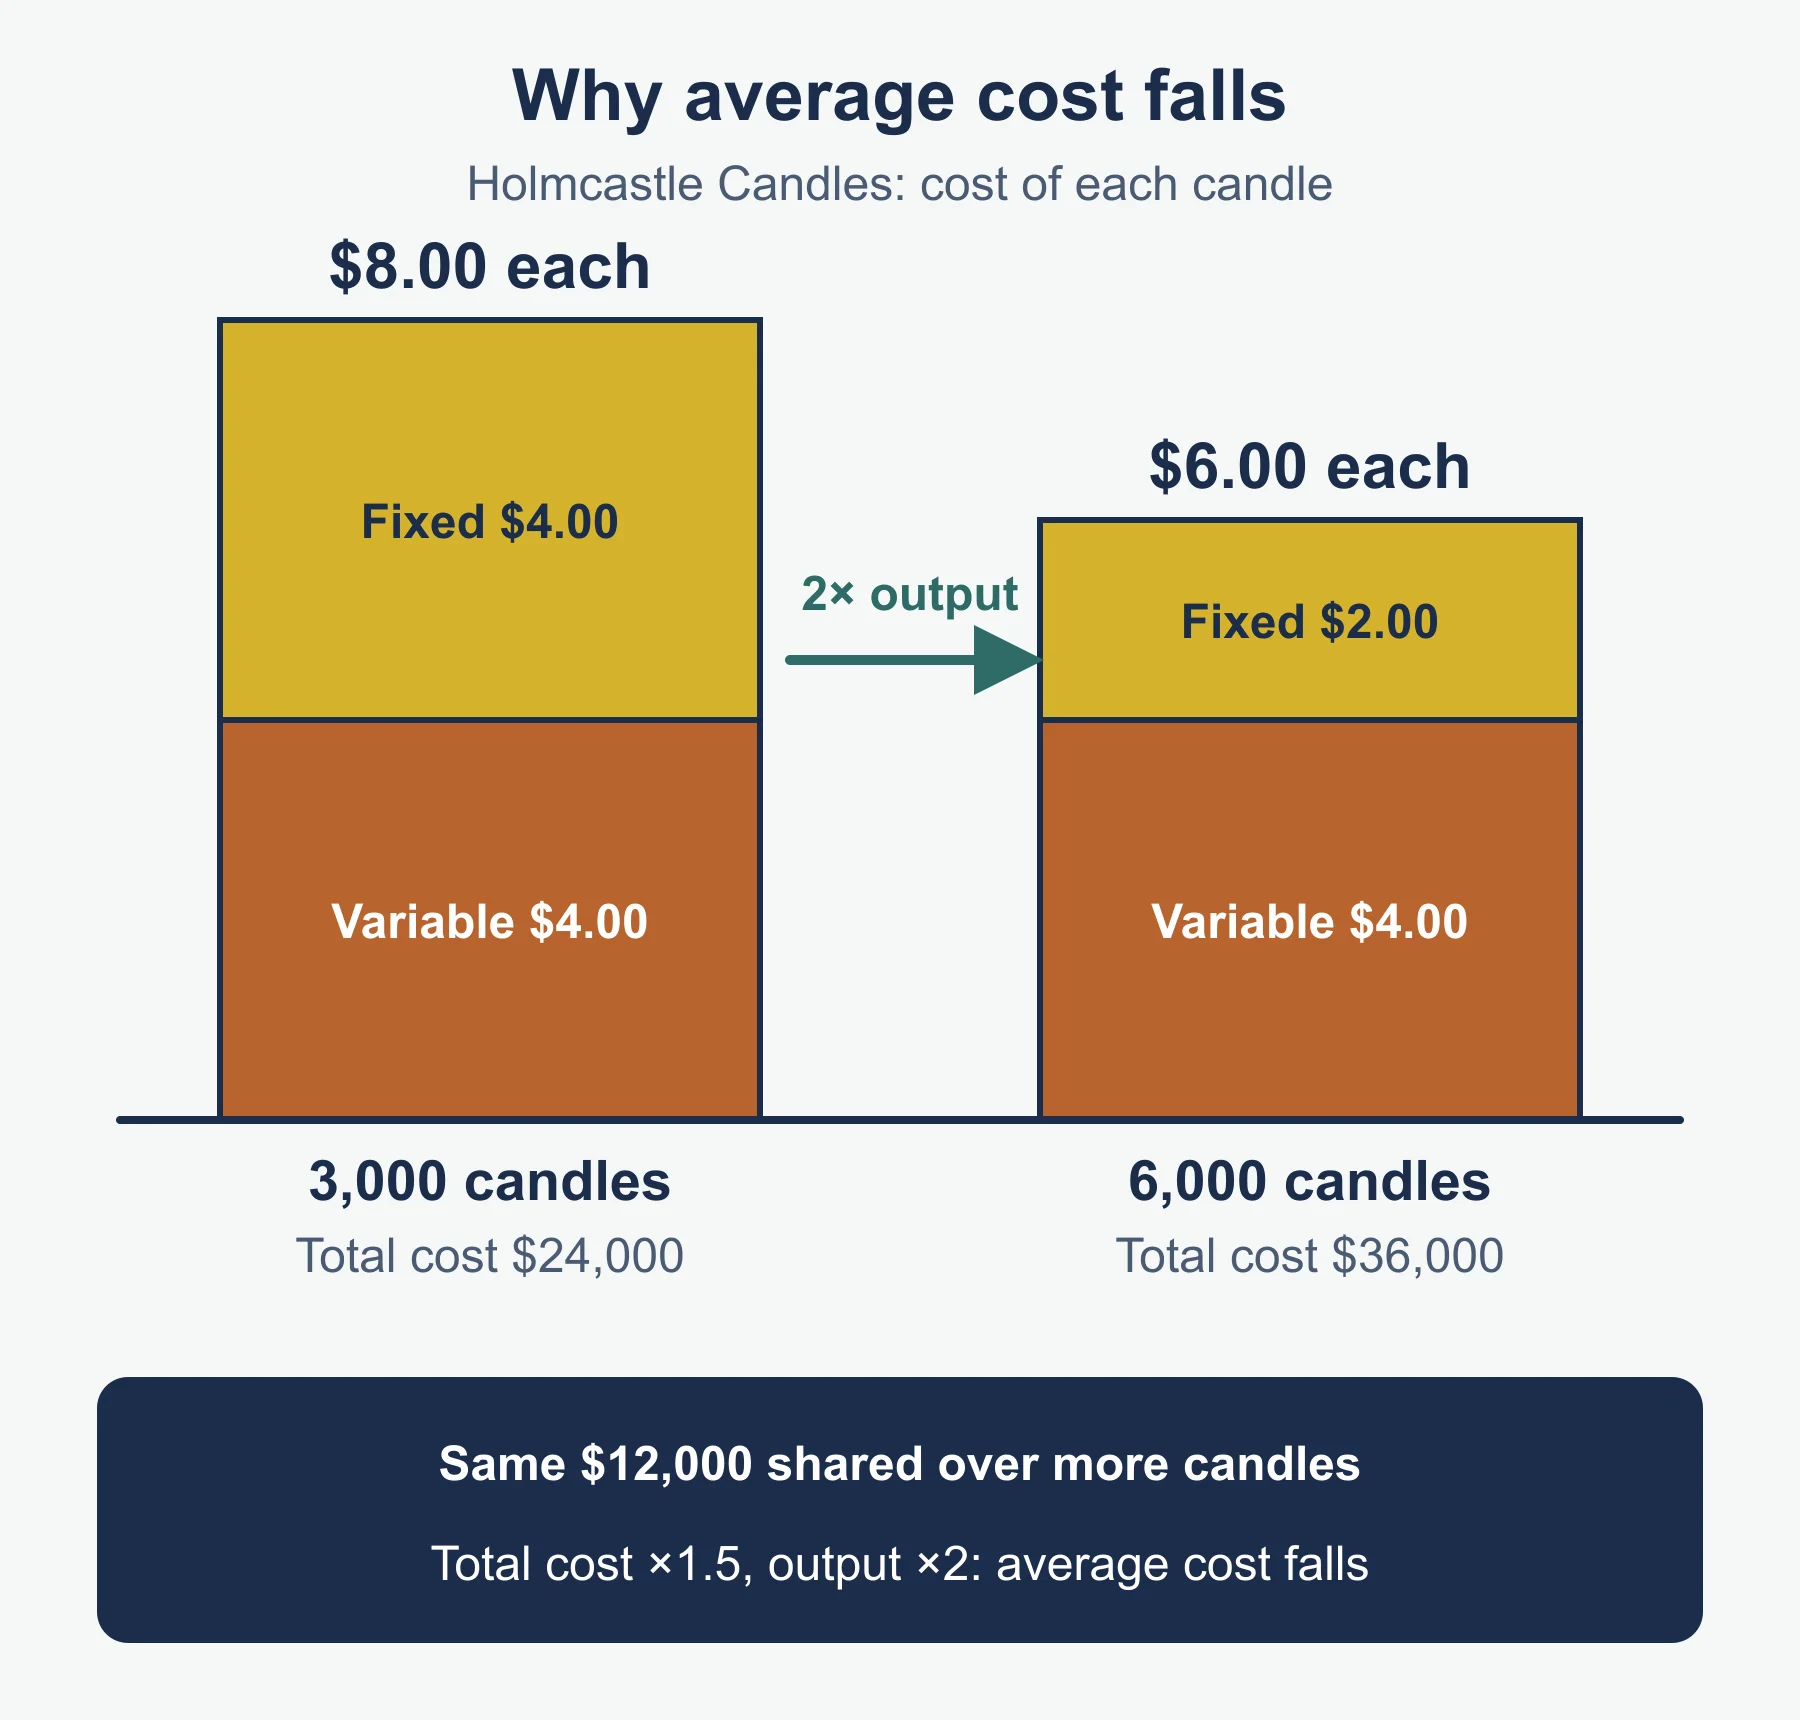
Must-know distinction: fixed costs per unit fall as output rises, but total fixed costs stay the same. Average cost falls because the fixed costs are spread more thinly.
Small reminder. Pinnowe Bags has fixed costs of 27 000 a month and variable cost of 12 per bag. At 1 500 bags: total cost = 27 000 + 18 000 = 45 000; average cost = 45 000 / 1 500 = 30. At 3 000 bags: total cost = 27 000 + 36 000 = 63 000; average cost = 21. Average cost fell by 9 because the fixed costs are shared by twice as many bags.
Stop or continue: method in steps
- Work out revenue and variable costs for the product.
- Contribution = revenue - variable costs.
- If contribution is positive and the fixed costs would still be paid, the product helps cover them, so keep it (for now).
- If contribution is negative, the product loses money on every sale, so consider stopping.
- Add a judgement: can the fixed costs be avoided, are there better uses of the resources, is the product needed for the range?
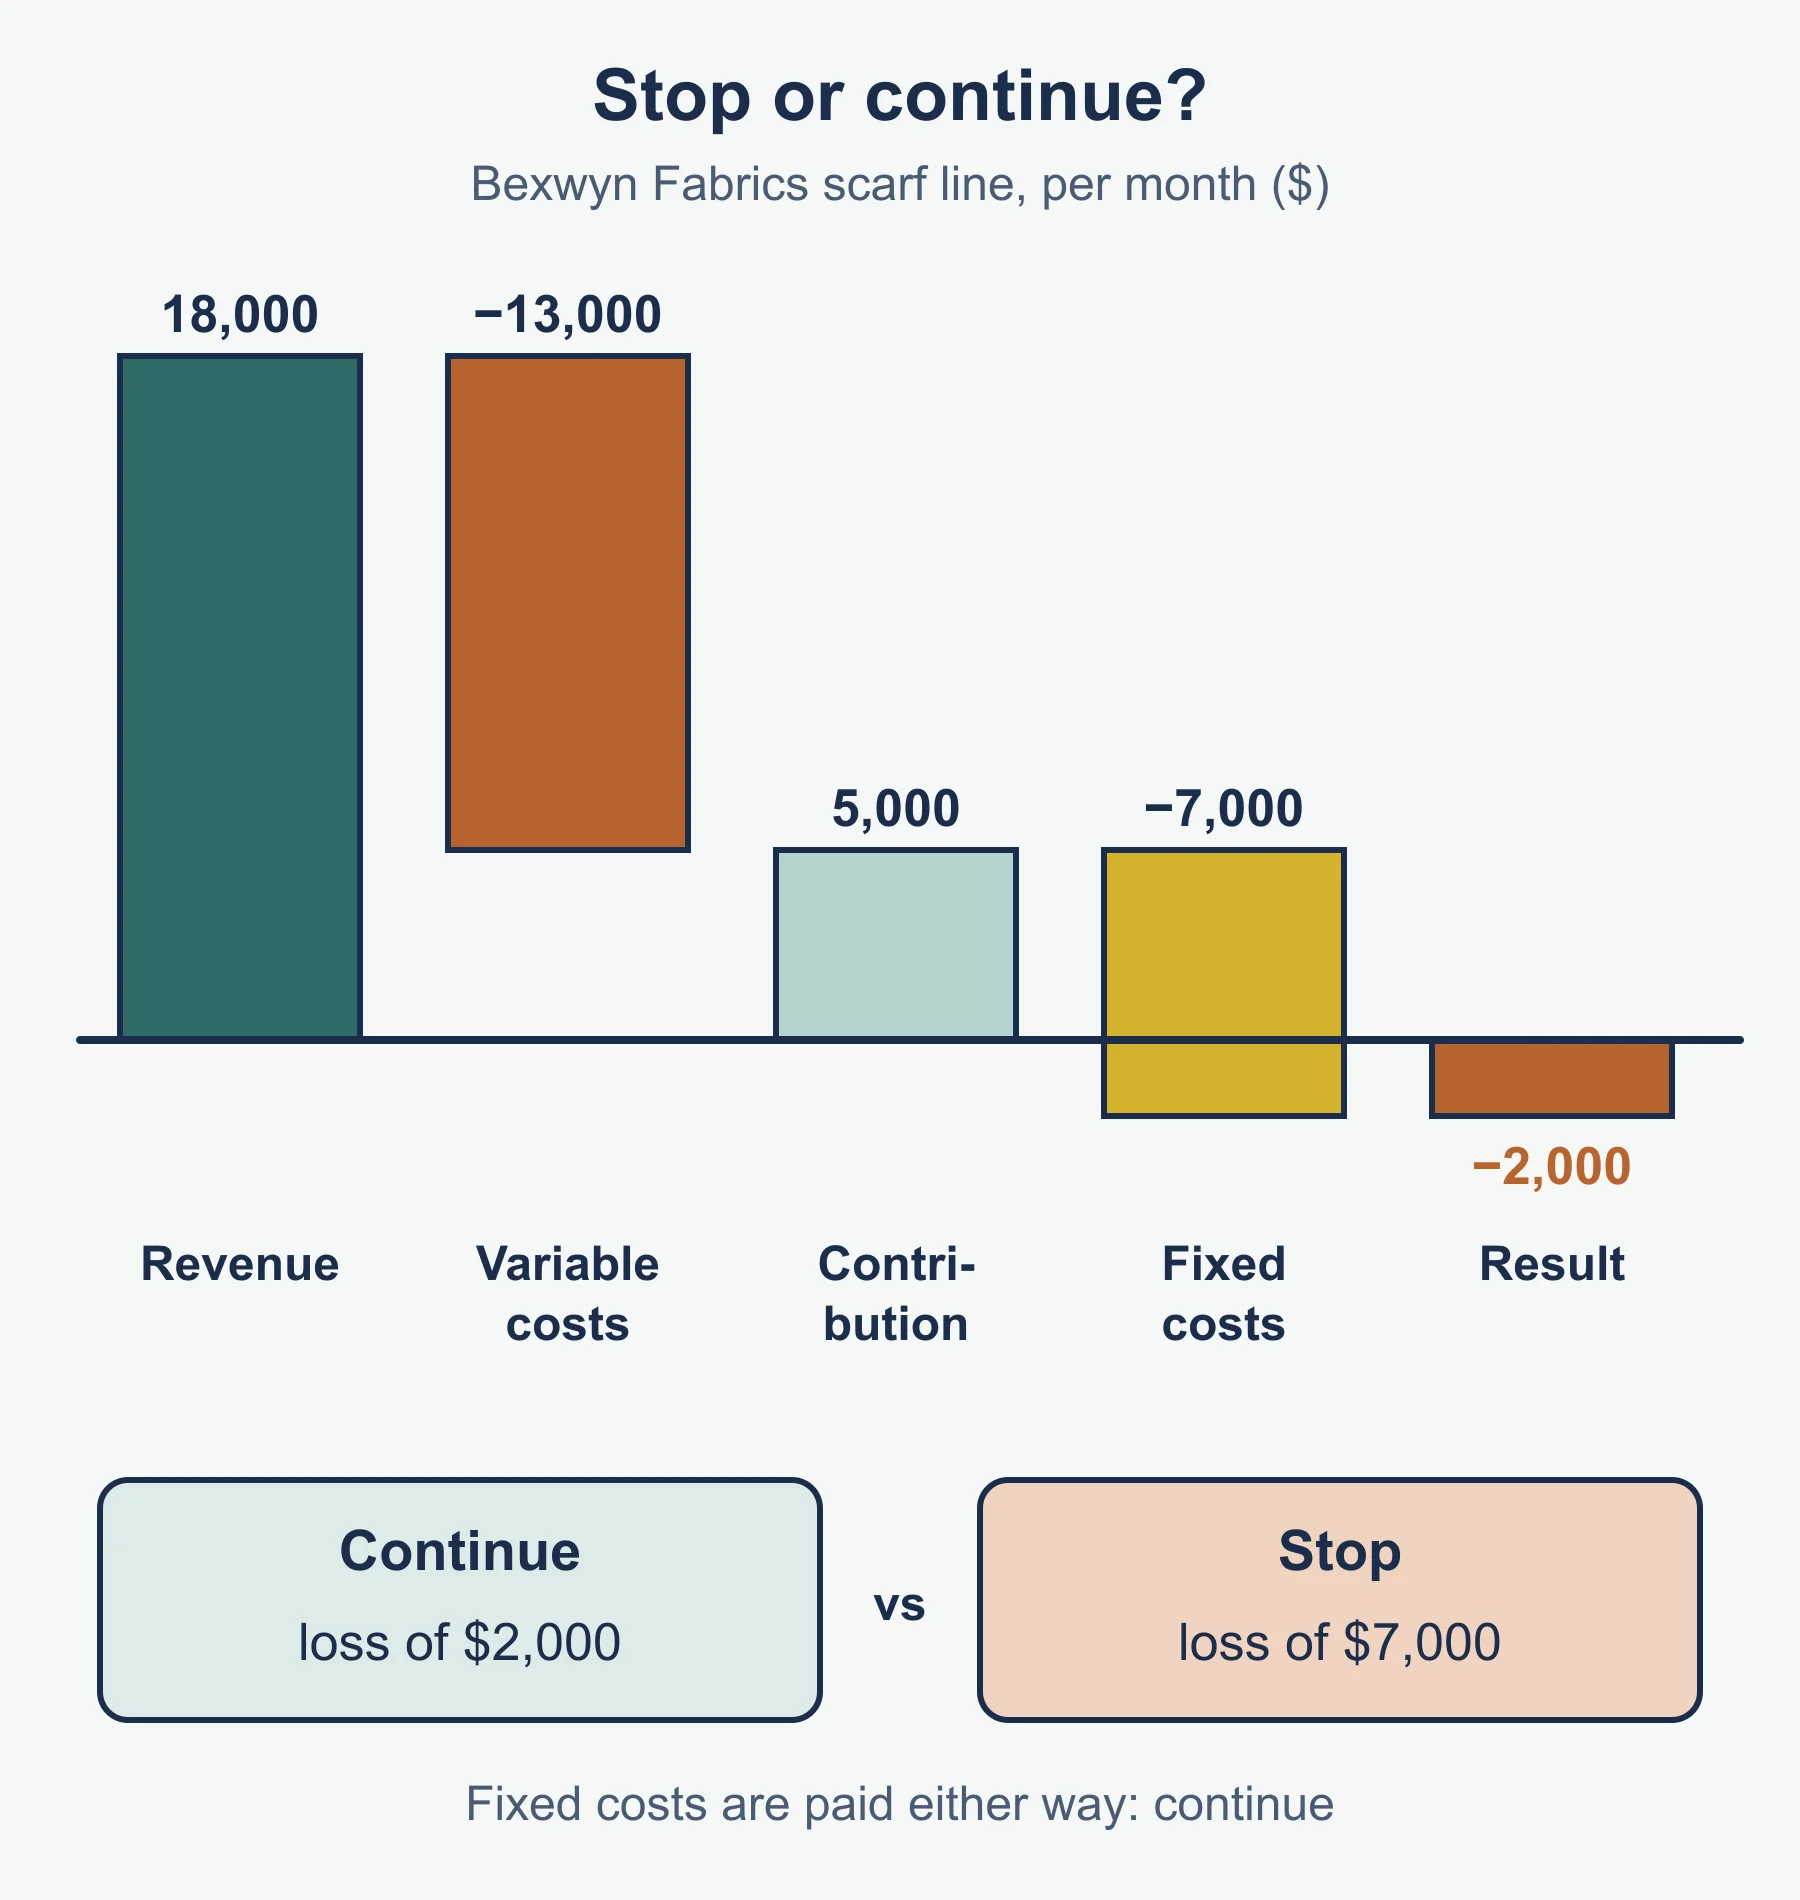
Reminder. A product earns 4 800 in revenue, with 3 900 of variable costs and 1 500 of fixed costs charged to it. Contribution is 900, but the product shows a loss of 600 once the fixed costs are included. If the 1 500 would be paid anyway, stopping increases the loss to 1 500, so continue.
4.2.2 Scale of production
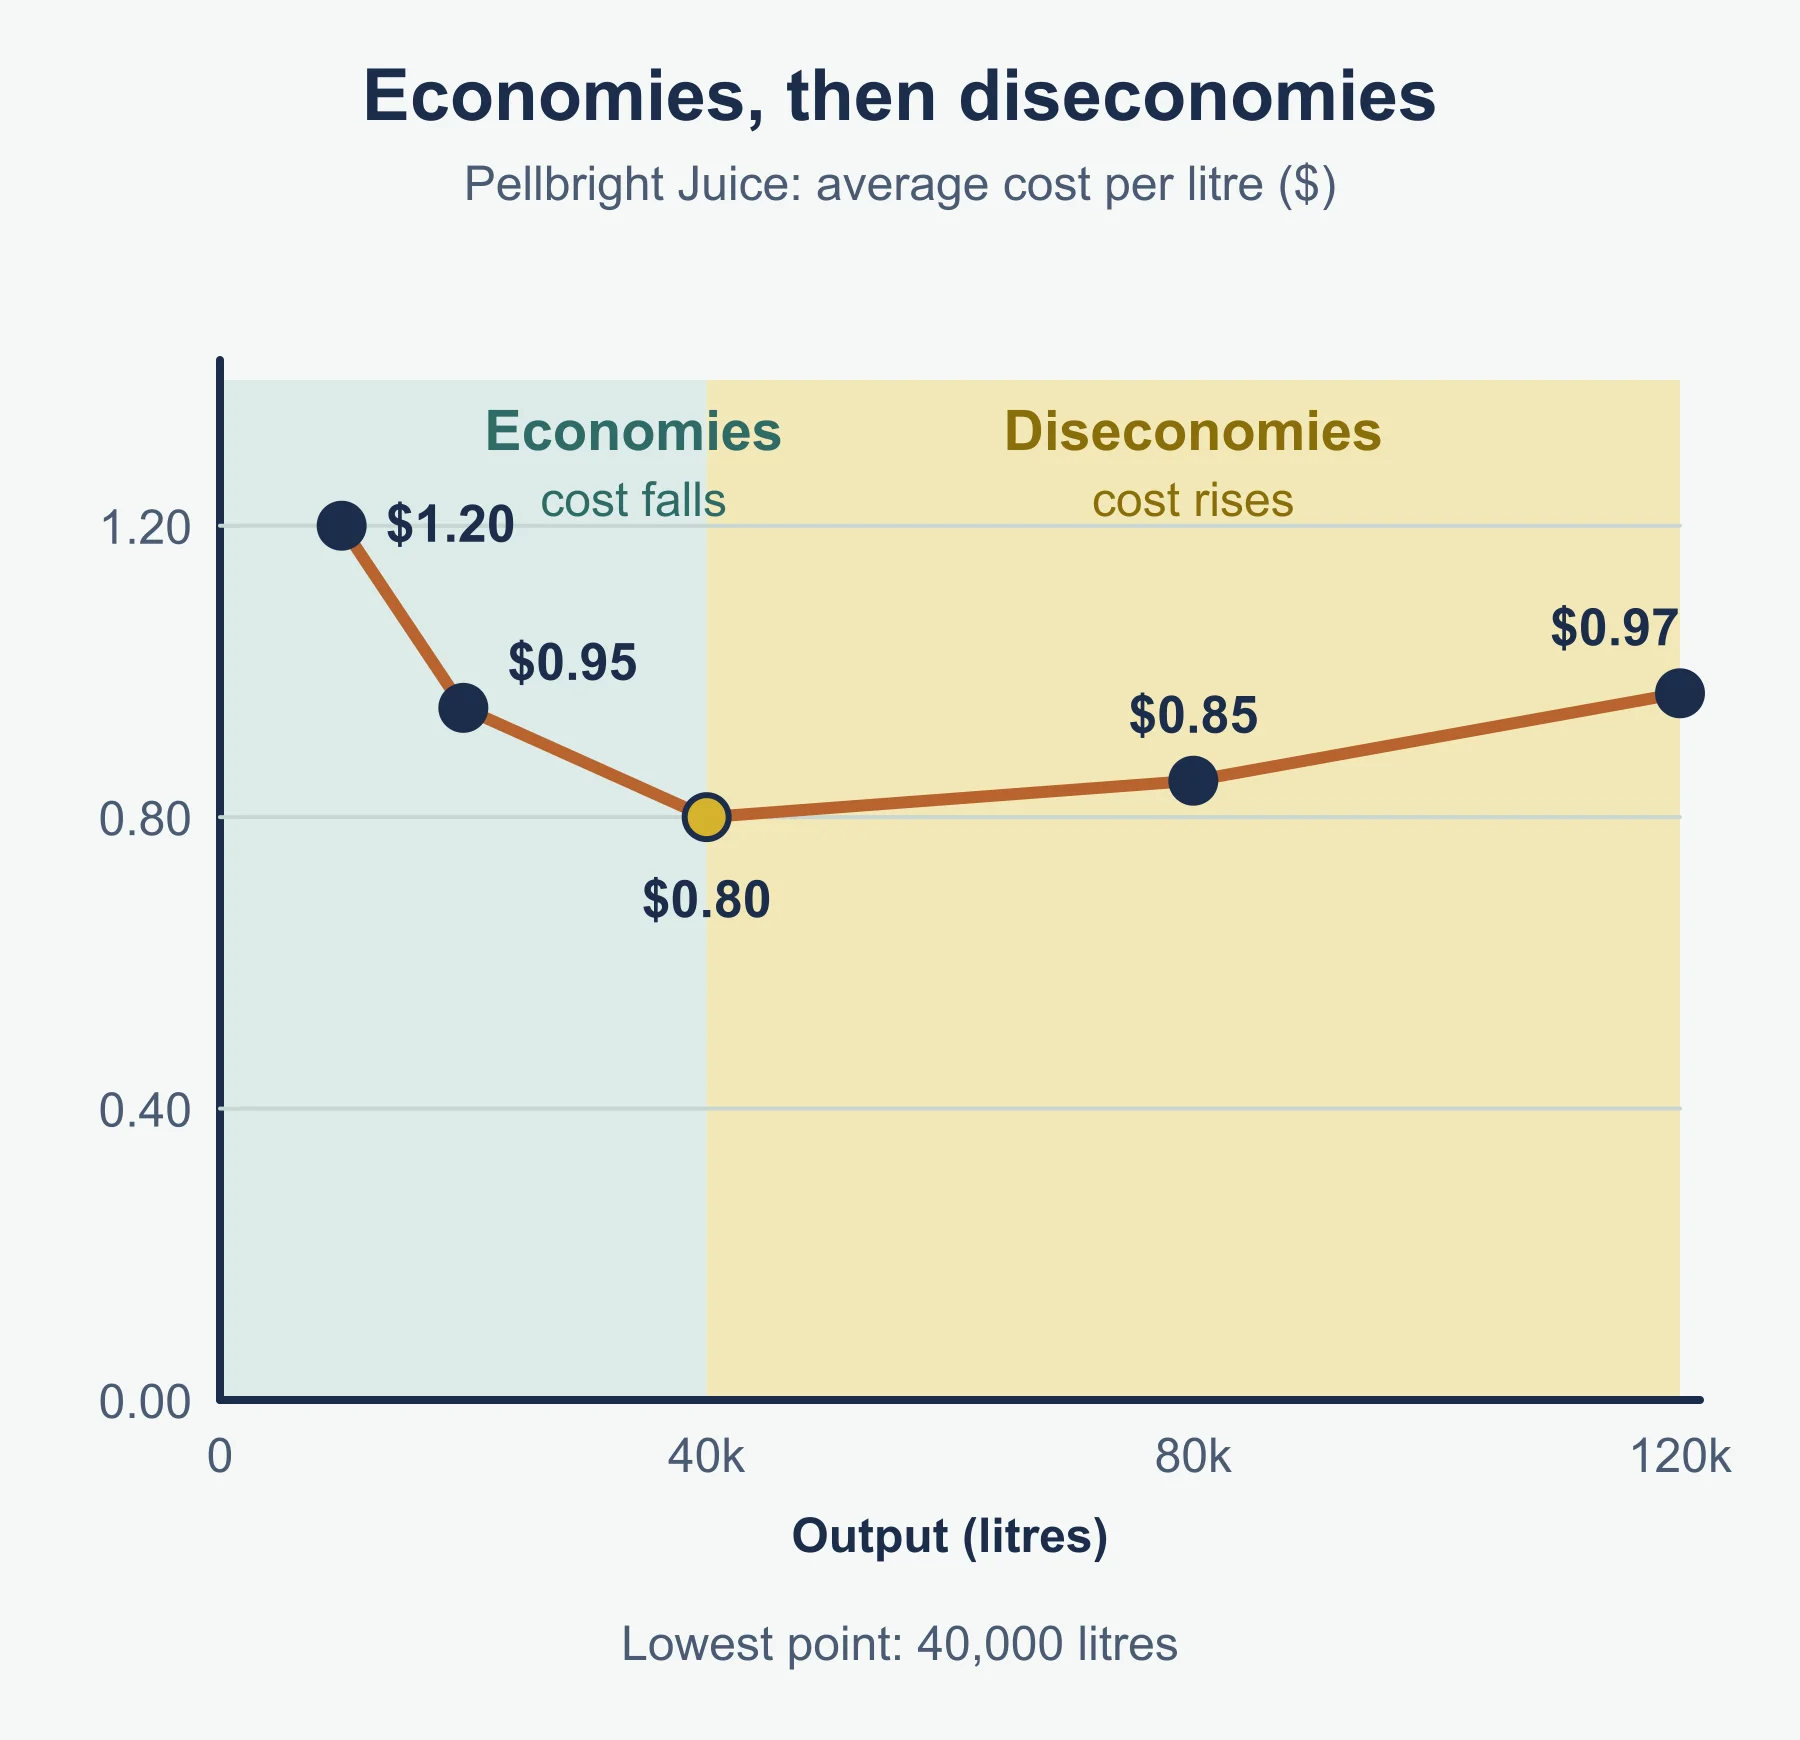
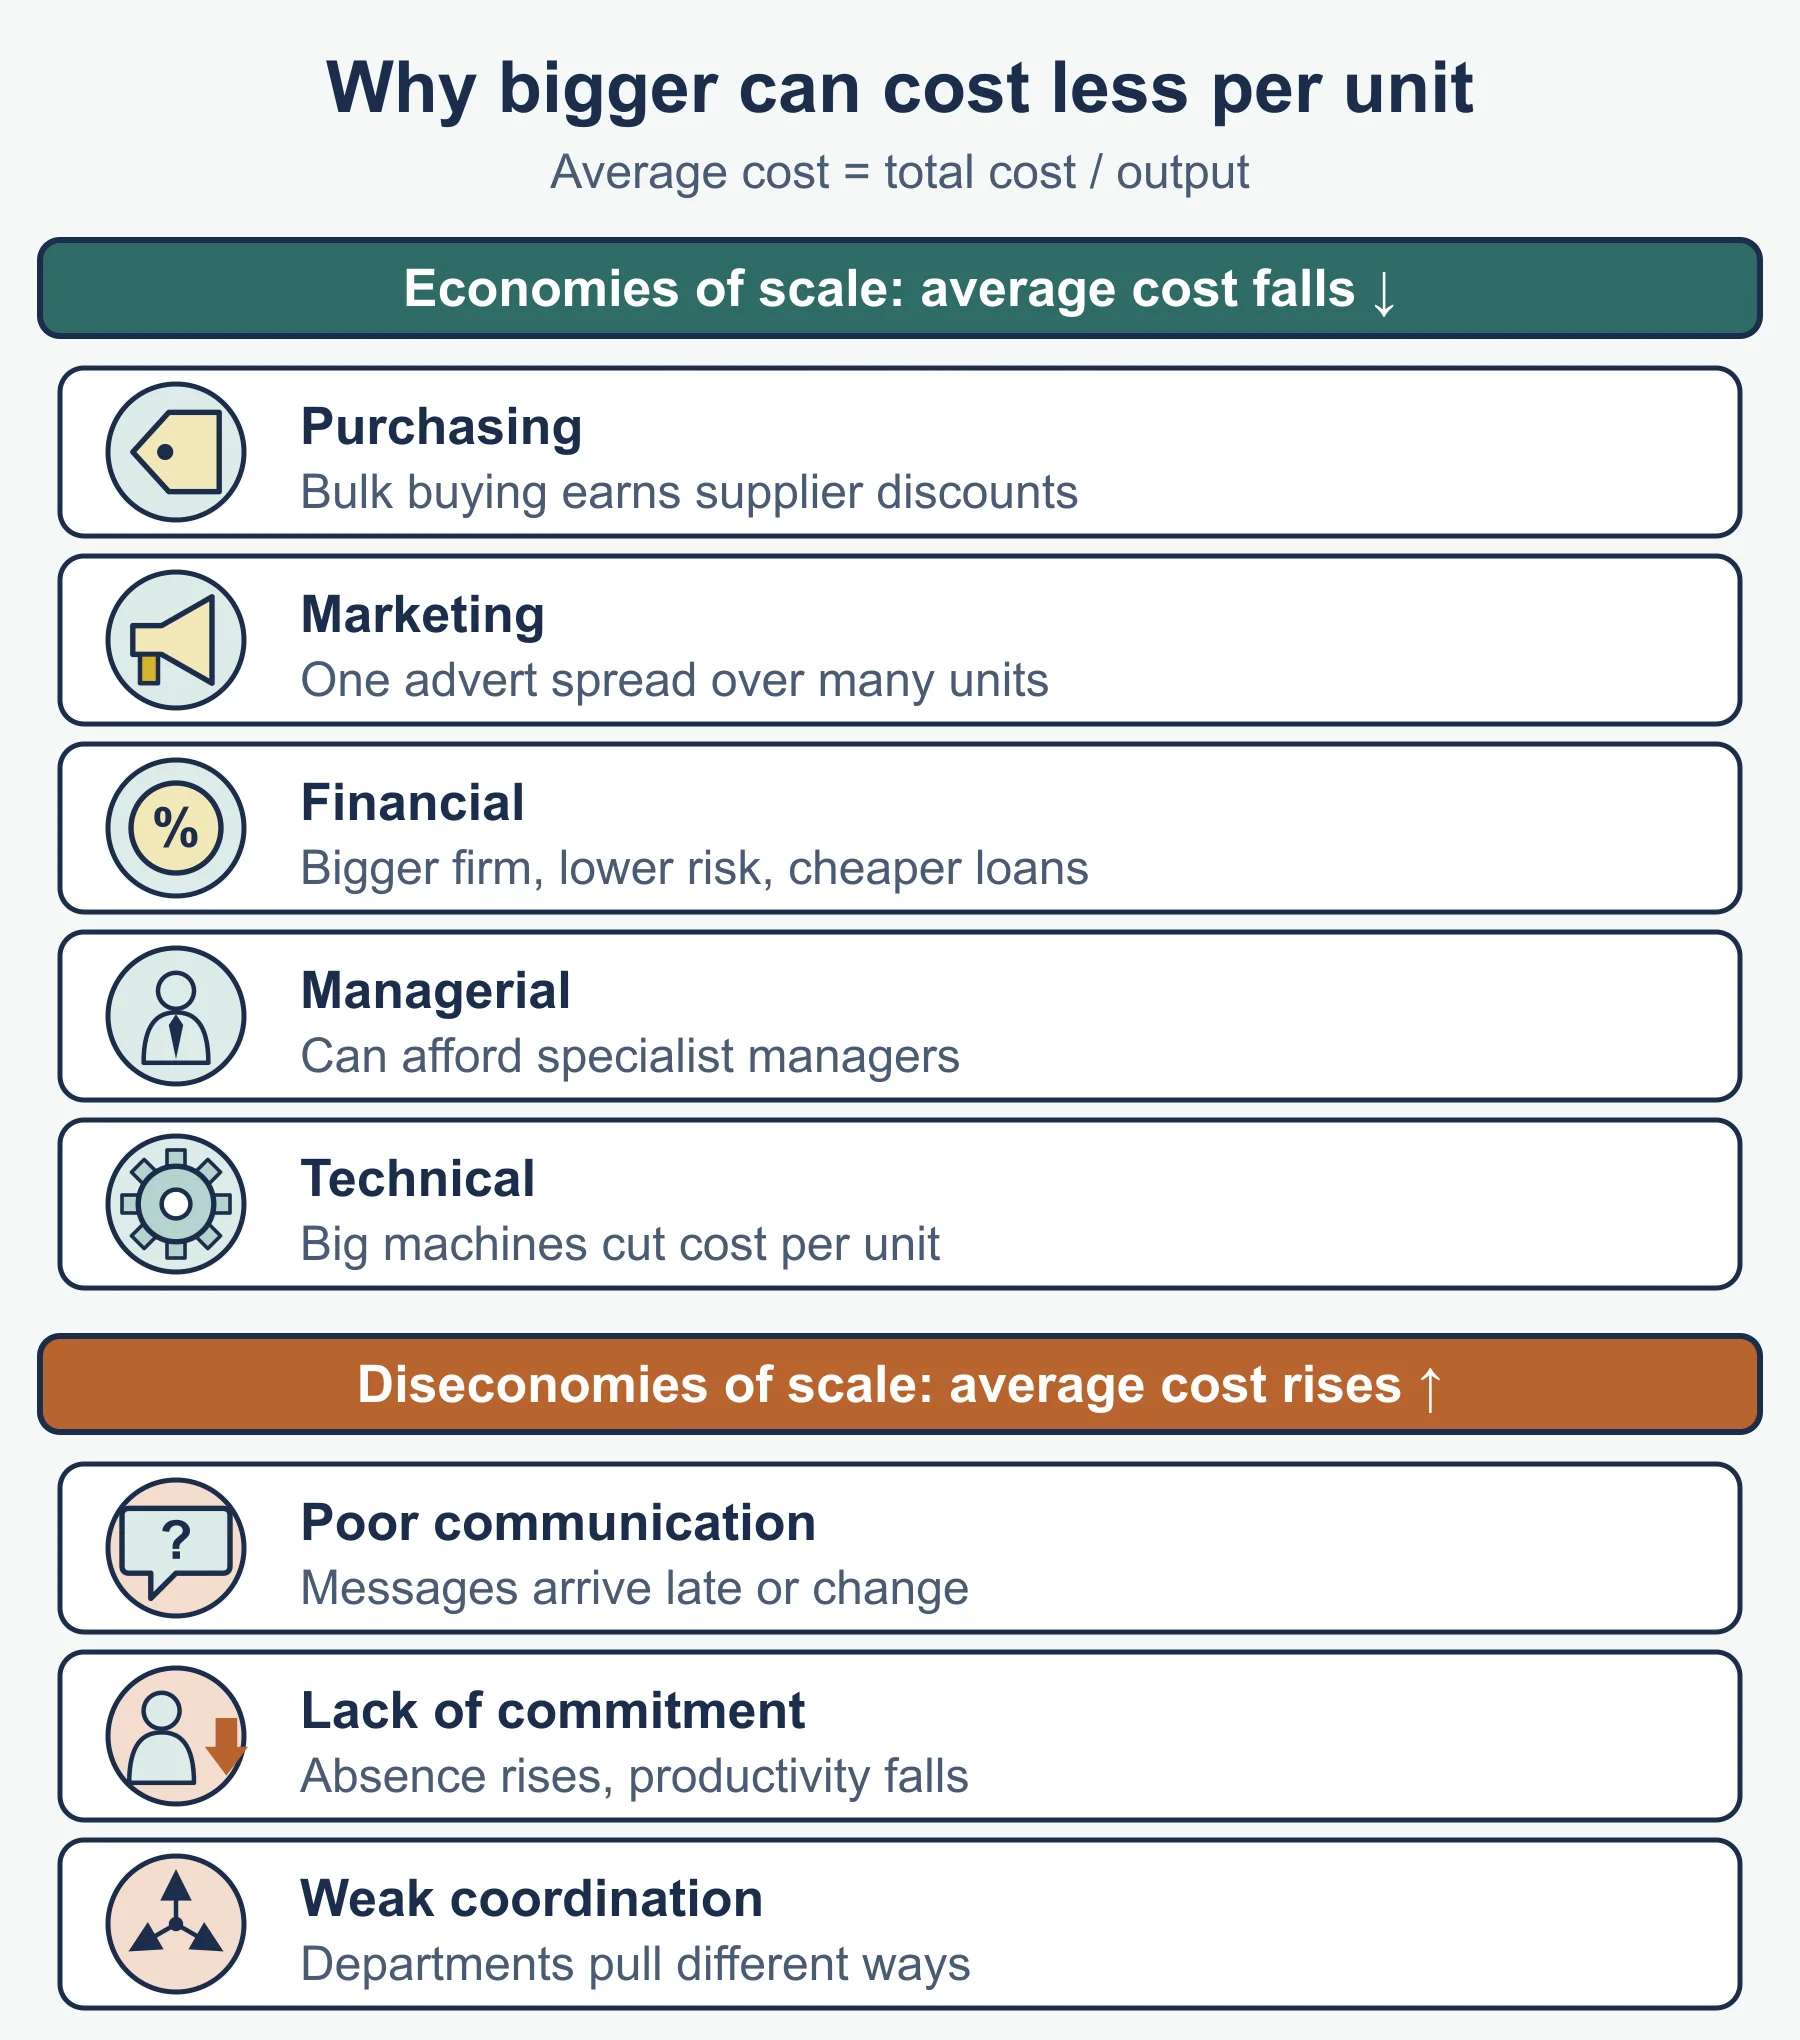
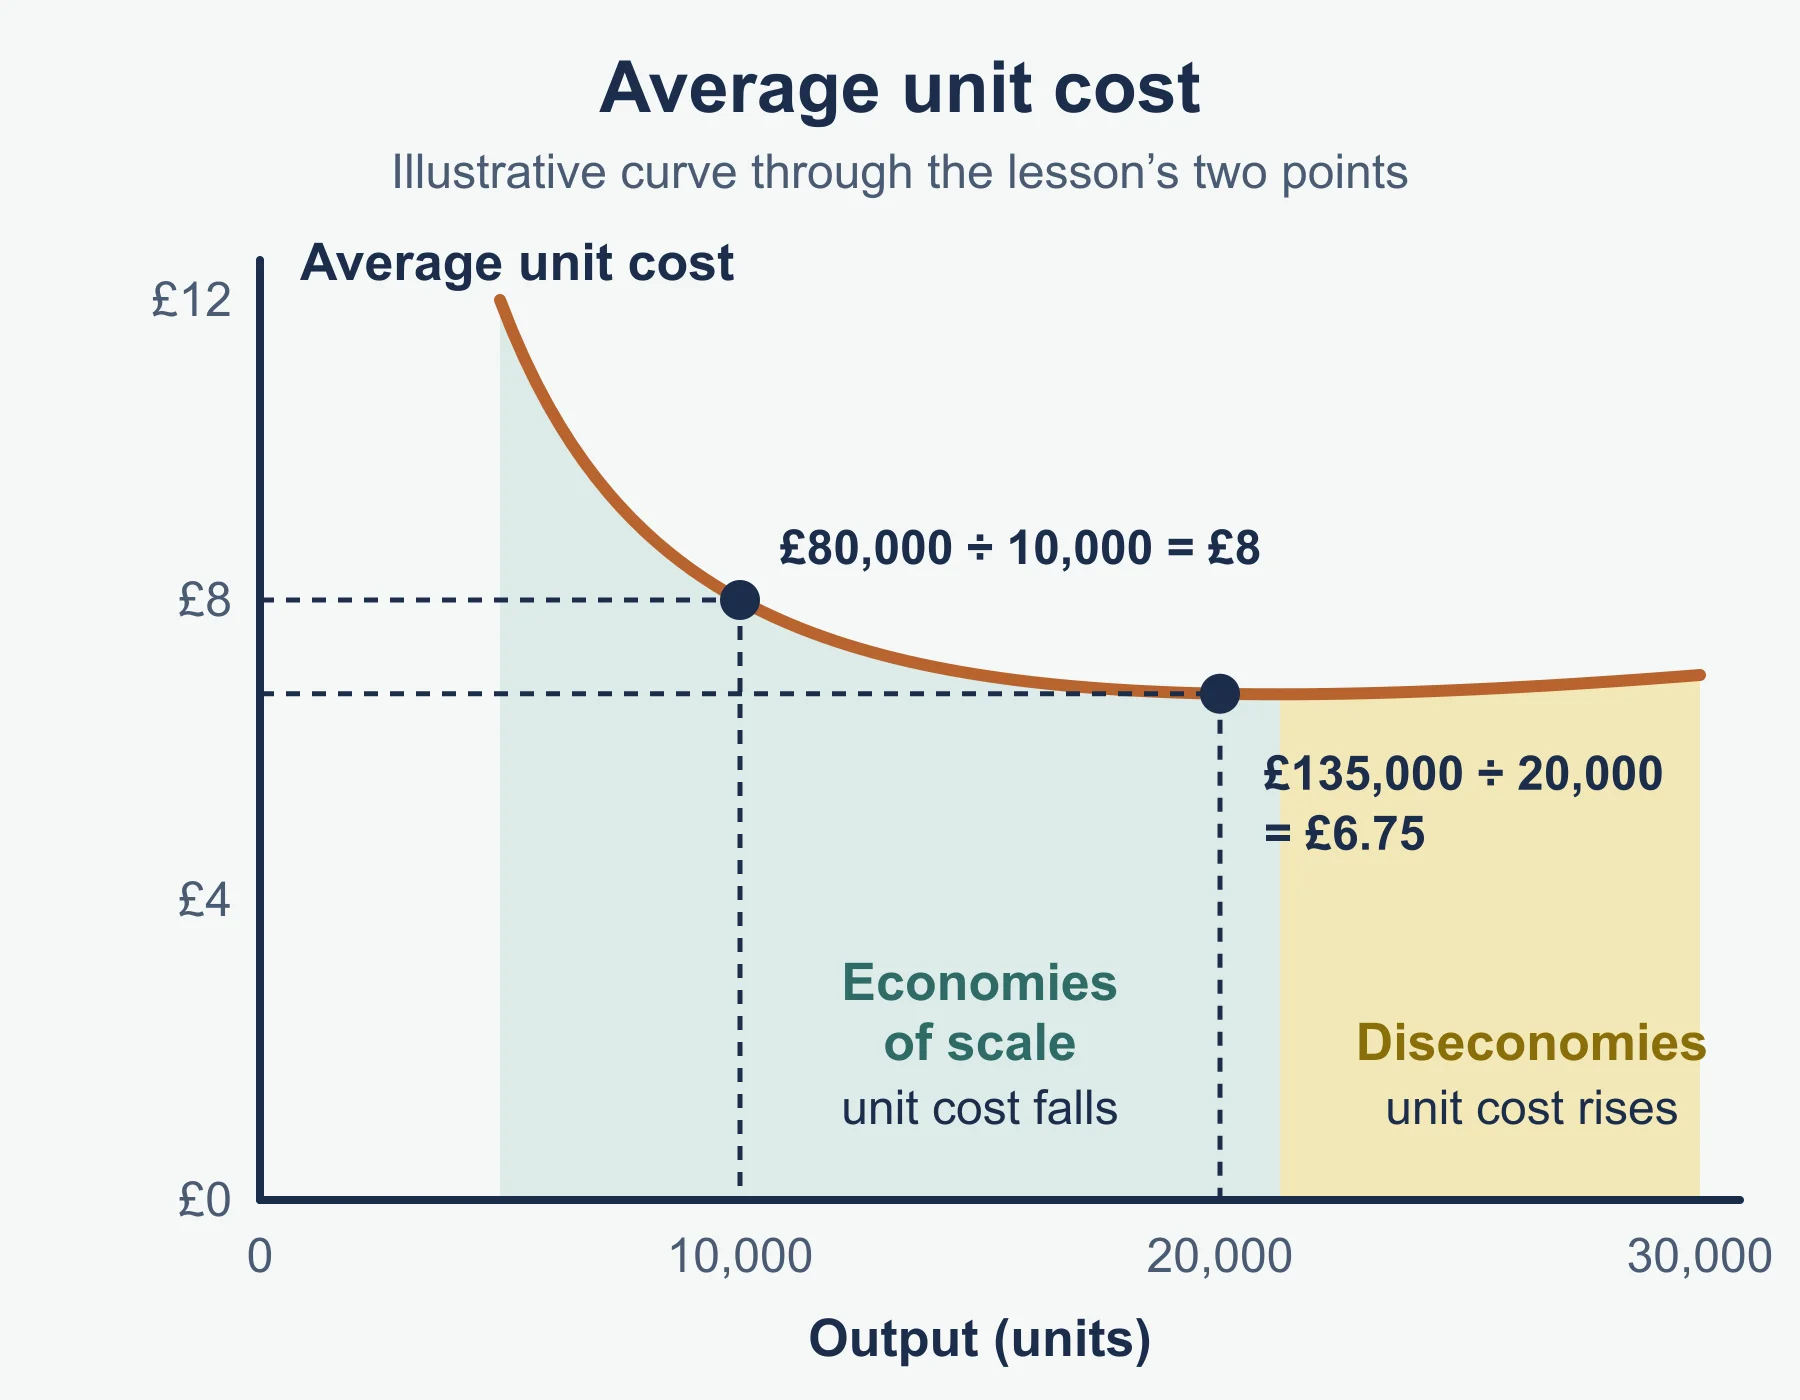
Economies of scale: the fall in cost per unit that comes when the business operates on a larger scale. Diseconomies of scale: average cost rises when a business becomes too large.
| Economy | Memory hook | Cause |
|---|---|---|
| Purchasing | Bulk | Supplier discounts for large orders |
| Marketing | Spread | Advertising cost shared over more units |
| Financial | Borrowing | Lower interest rates for larger, lower-risk firms |
| Managerial | Specialists | Specialist managers do the job better |
| Technical | Machines | Large equipment or production lines cut unit cost at high output |
| Diseconomy | Cause | Effect on cost |
|---|---|---|
| Poor communication | Many layers, slow or distorted messages | Delays and mistakes |
| Lack of commitment from employees | Workers feel remote from decisions | Lower productivity, higher absence |
| Weak coordination | Departments or sites do not work together | Duplication and wasted effort |
Must-know distinctions
- Say “average cost” or “cost per unit”, never just “costs”, for economies of scale.
- Economies of scale come from growing the scale of production. They are not the same as a one-off price cut.
- The usual shape of the average cost curve: falls, flat at the lowest point, then rises.
4.2.3 Break-even analysis
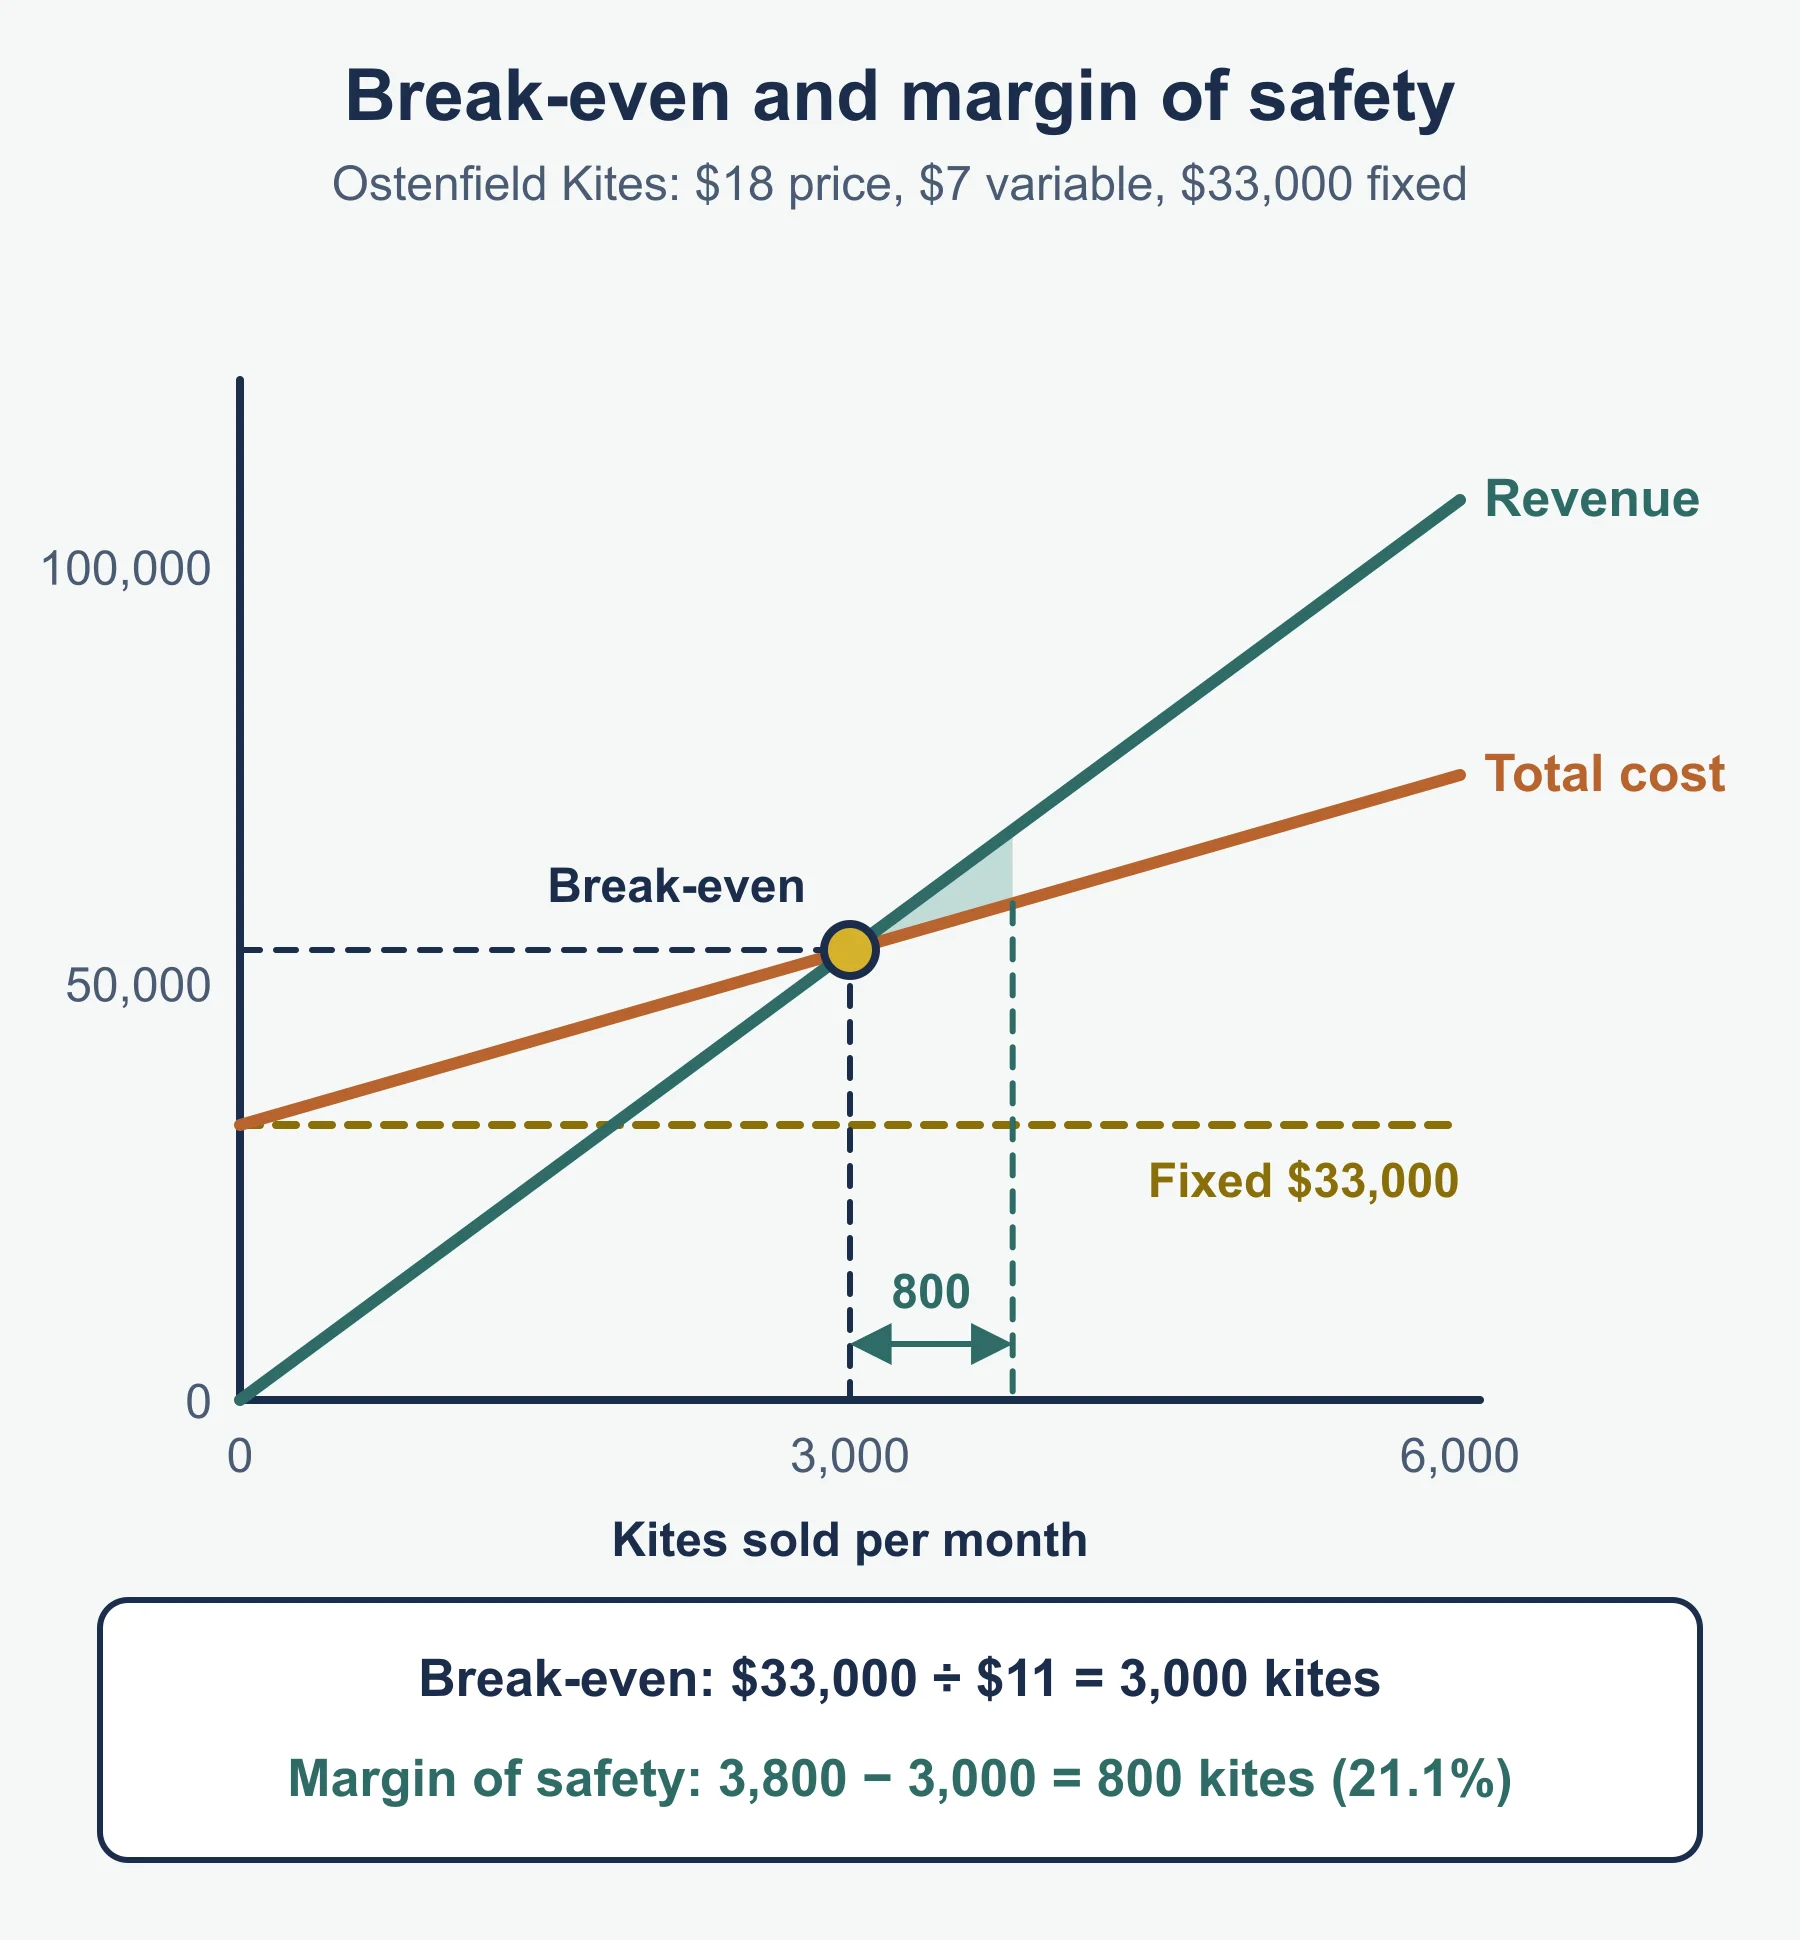
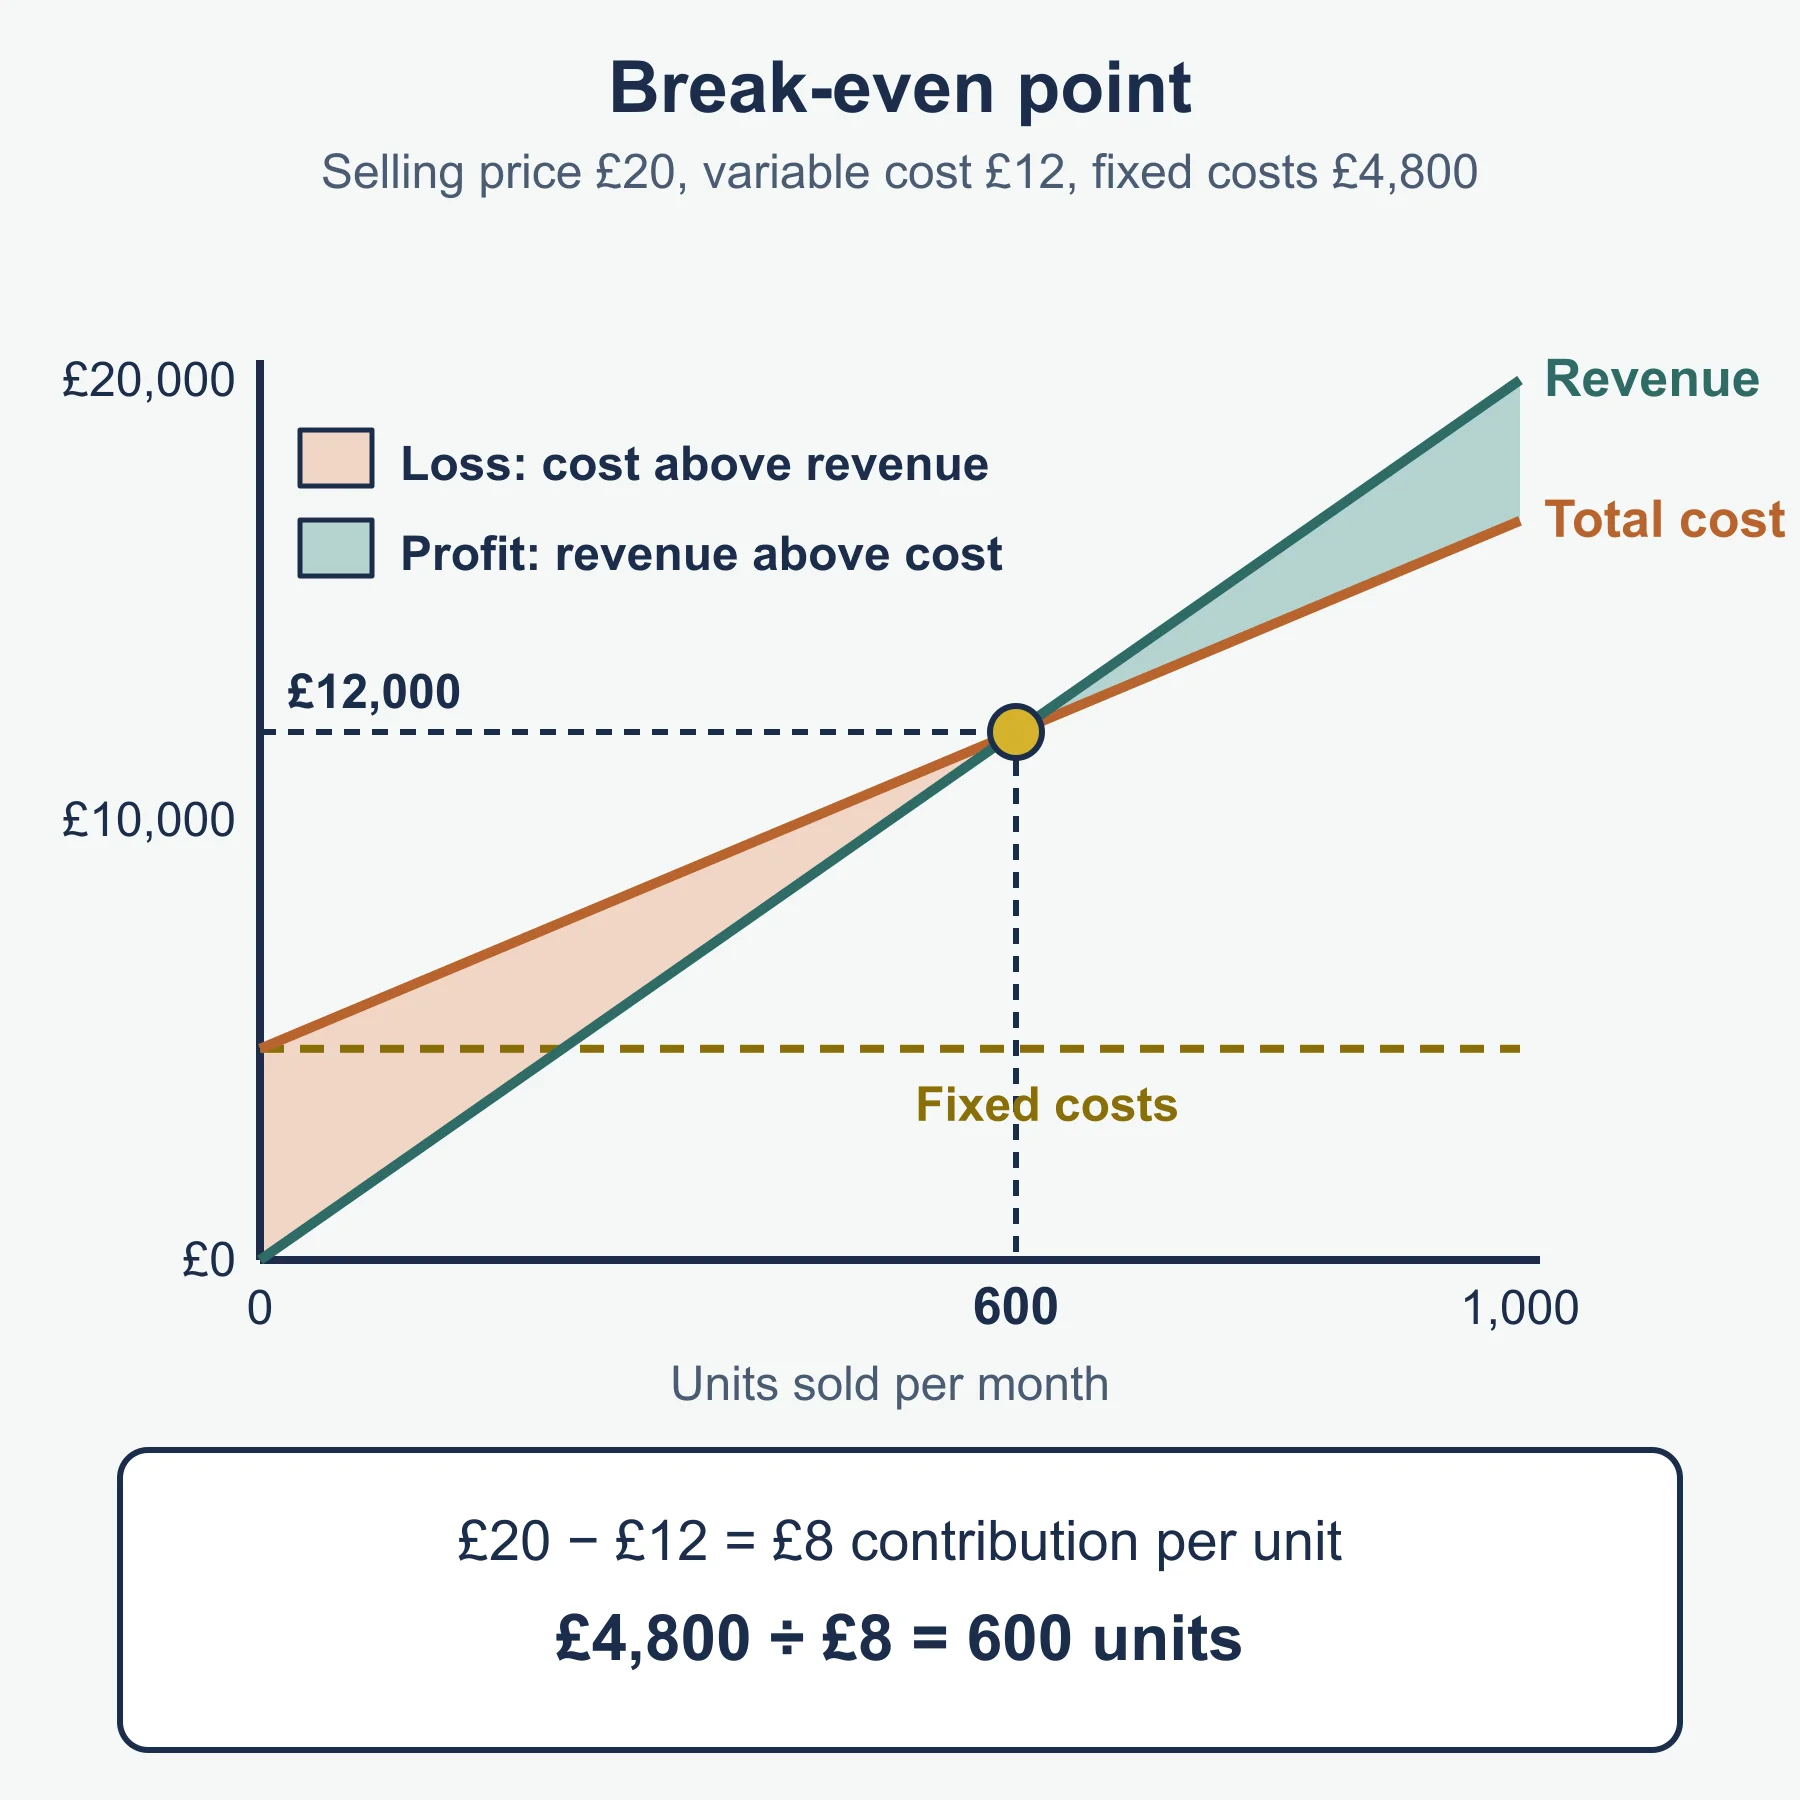
Break-even: the level of output where total revenue equals total cost, so there is no profit and no loss.
| Item | Standard form |
|---|---|
| Contribution per unit | price per unit less variable cost per unit |
| Break-even (units of output) | fixed costs / contribution per unit |
| Margin of safety (units) | expected or actual output - break-even output |
| Margin of safety (%) | margin of safety / expected or actual output x 100 |
| Profit at an output | contribution per unit x output - fixed costs |
The syllabus does not print these formulas, so they are the standard forms. Use them.
Reminder. Pinnowe Bags sells at 30. Contribution = 30 - 12 = 18. Break-even = 27 000 / 18 = 1 500 bags. Expected sales are 2 100 bags, so the margin of safety = 600 bags (600 / 2 100 x 100 = 28.6%). Profit at 2 100 = 18 x 2 100 - 27 000 = 10 800.
Drawing a break-even chart in steps
- Axes: output across, money (costs and revenue) up.
- Fixed costs: a horizontal line at the fixed cost figure.
- Total costs: start at the fixed cost figure on the vertical axis (zero output). Work out total cost at a second, high output and join the points.
- Revenue: start at the origin. Work out revenue at the same high output and join the points.
- Mark break-even where revenue crosses total costs, and read the output straight down.
- Label each line and both axes, and add a title.
Reading a chart
- Break-even output: read down from the crossing point.
- Margin of safety: the horizontal gap between actual output and break-even output.
- Profit: the vertical gap between revenue and total costs, to the right of break-even.
- Loss: the vertical gap between total costs and revenue, to the left of break-even.
- Fixed costs: where the total cost line meets the vertical axis.
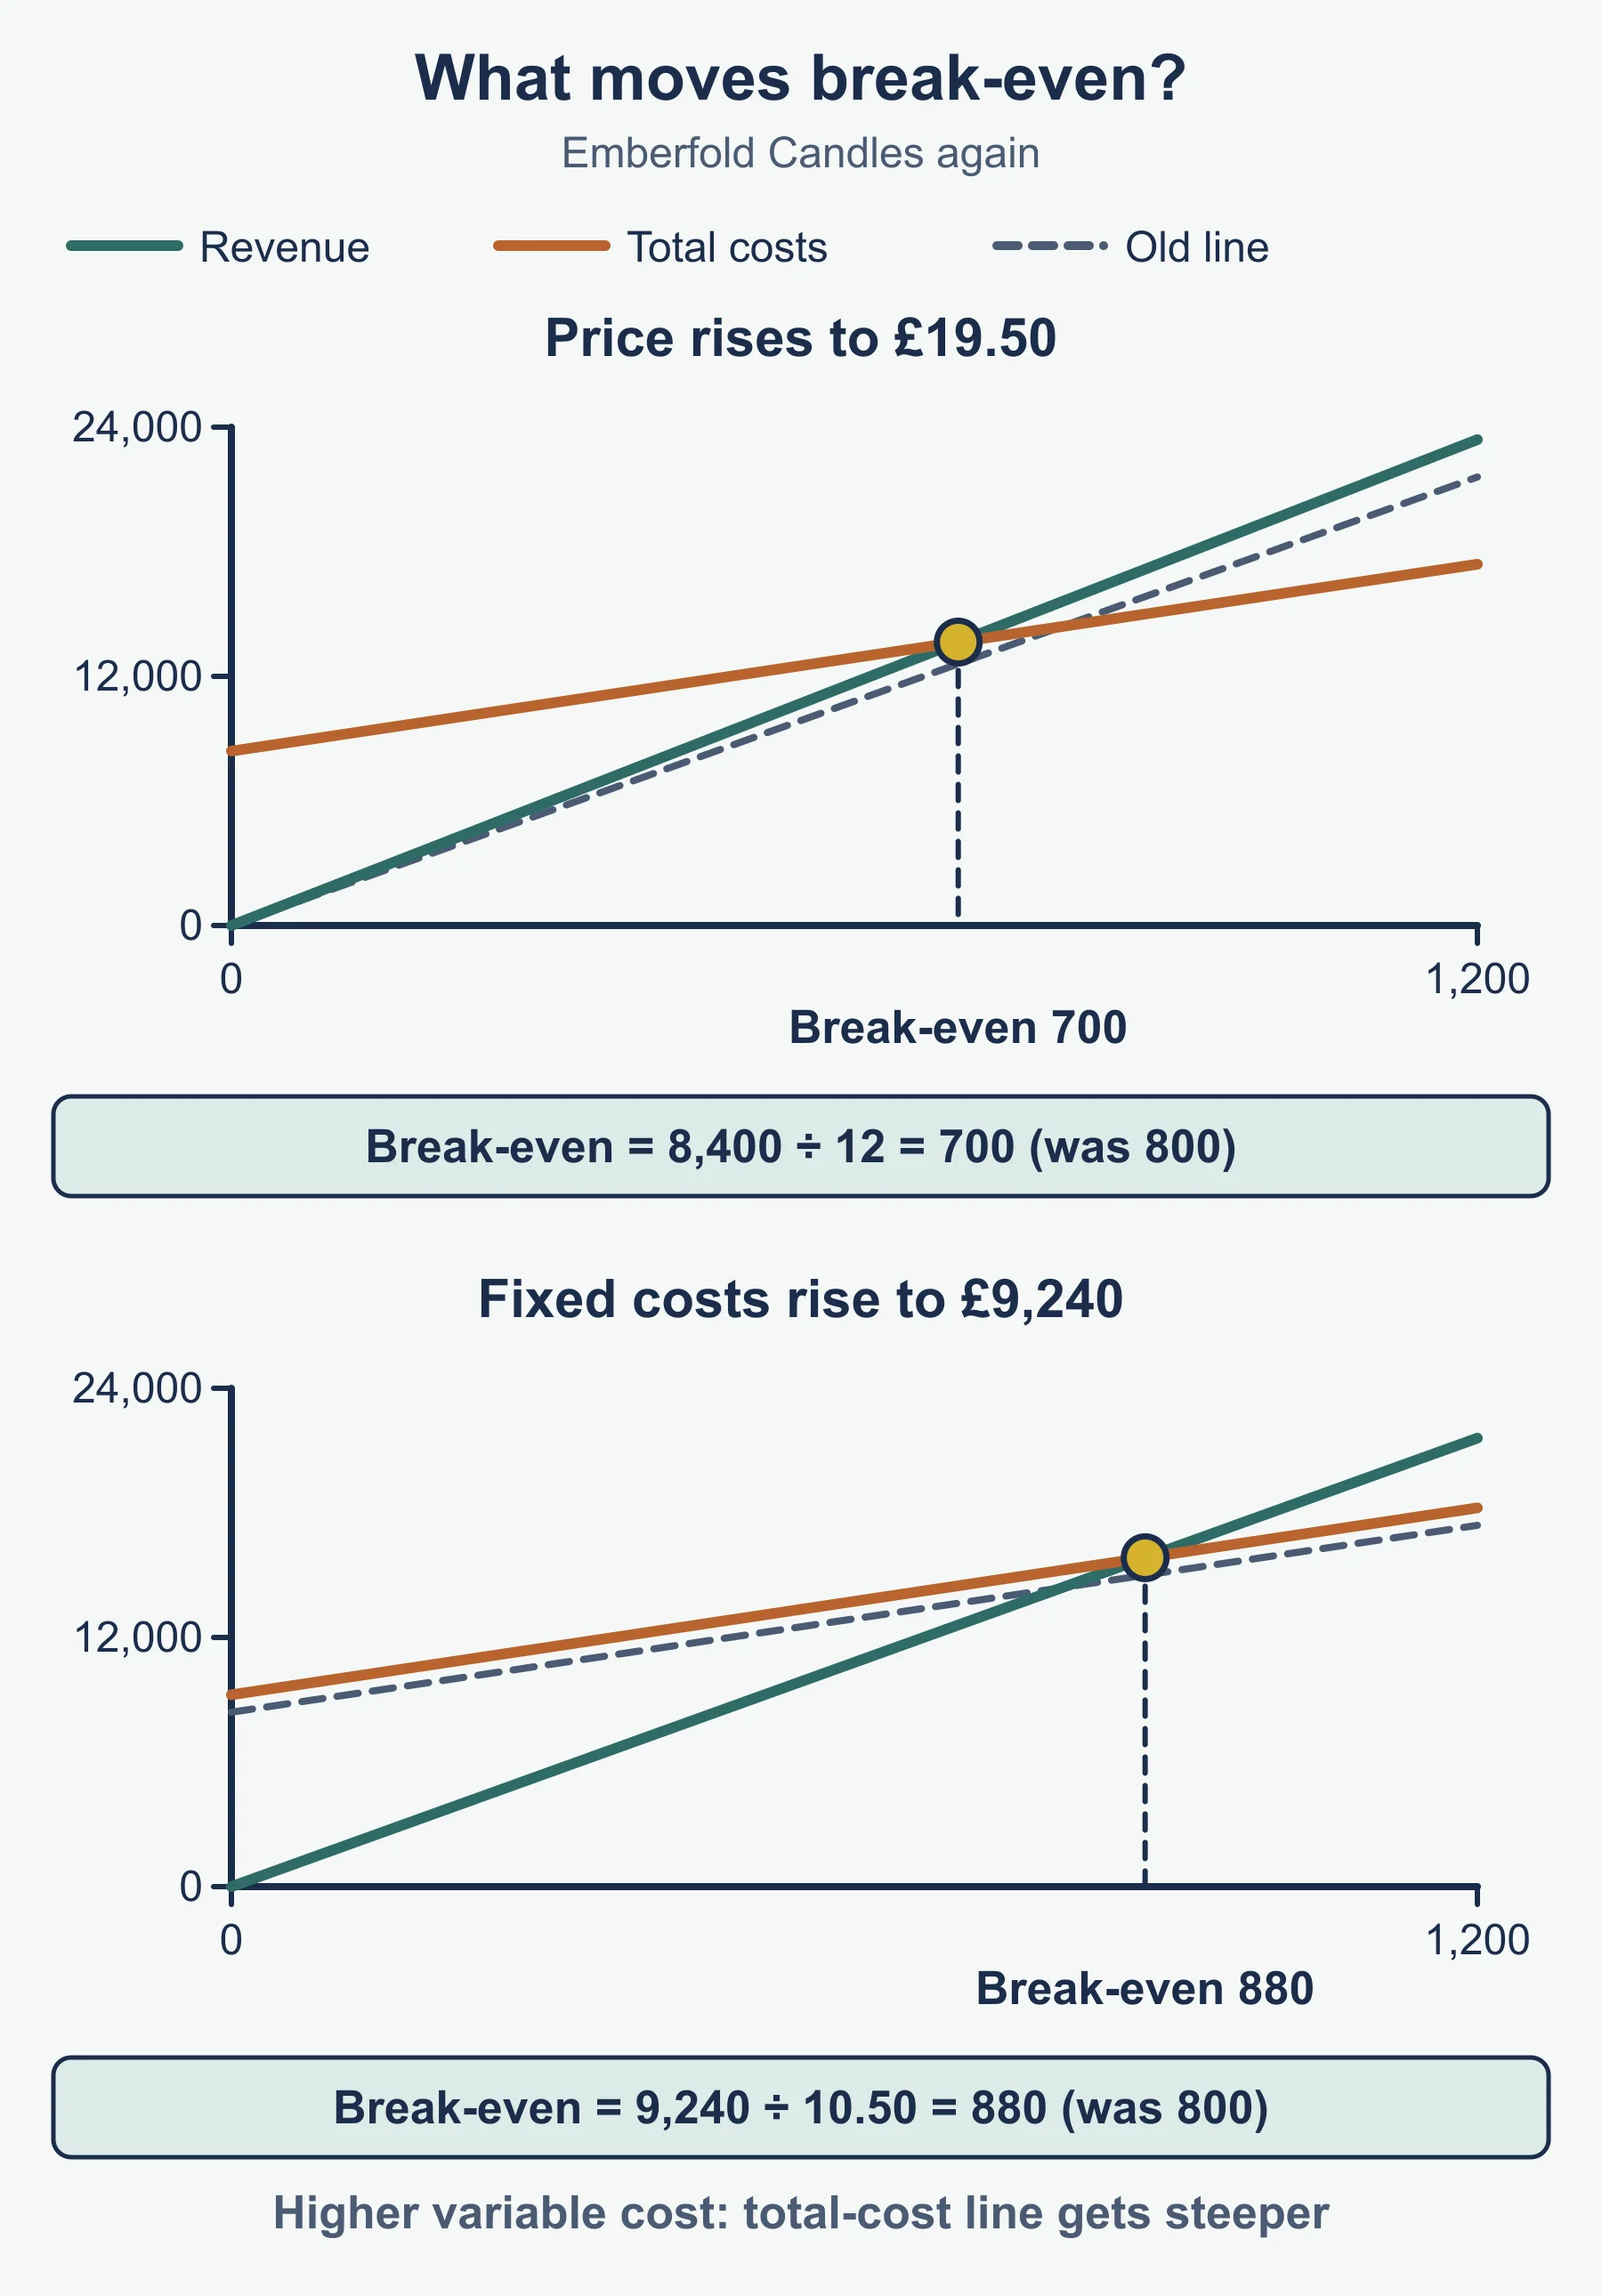
What moves break-even?
| Change | Line that moves | Effect on break-even output |
|---|---|---|
| Higher fixed costs | Total cost line moves up by the same amount | Rises (moves right) |
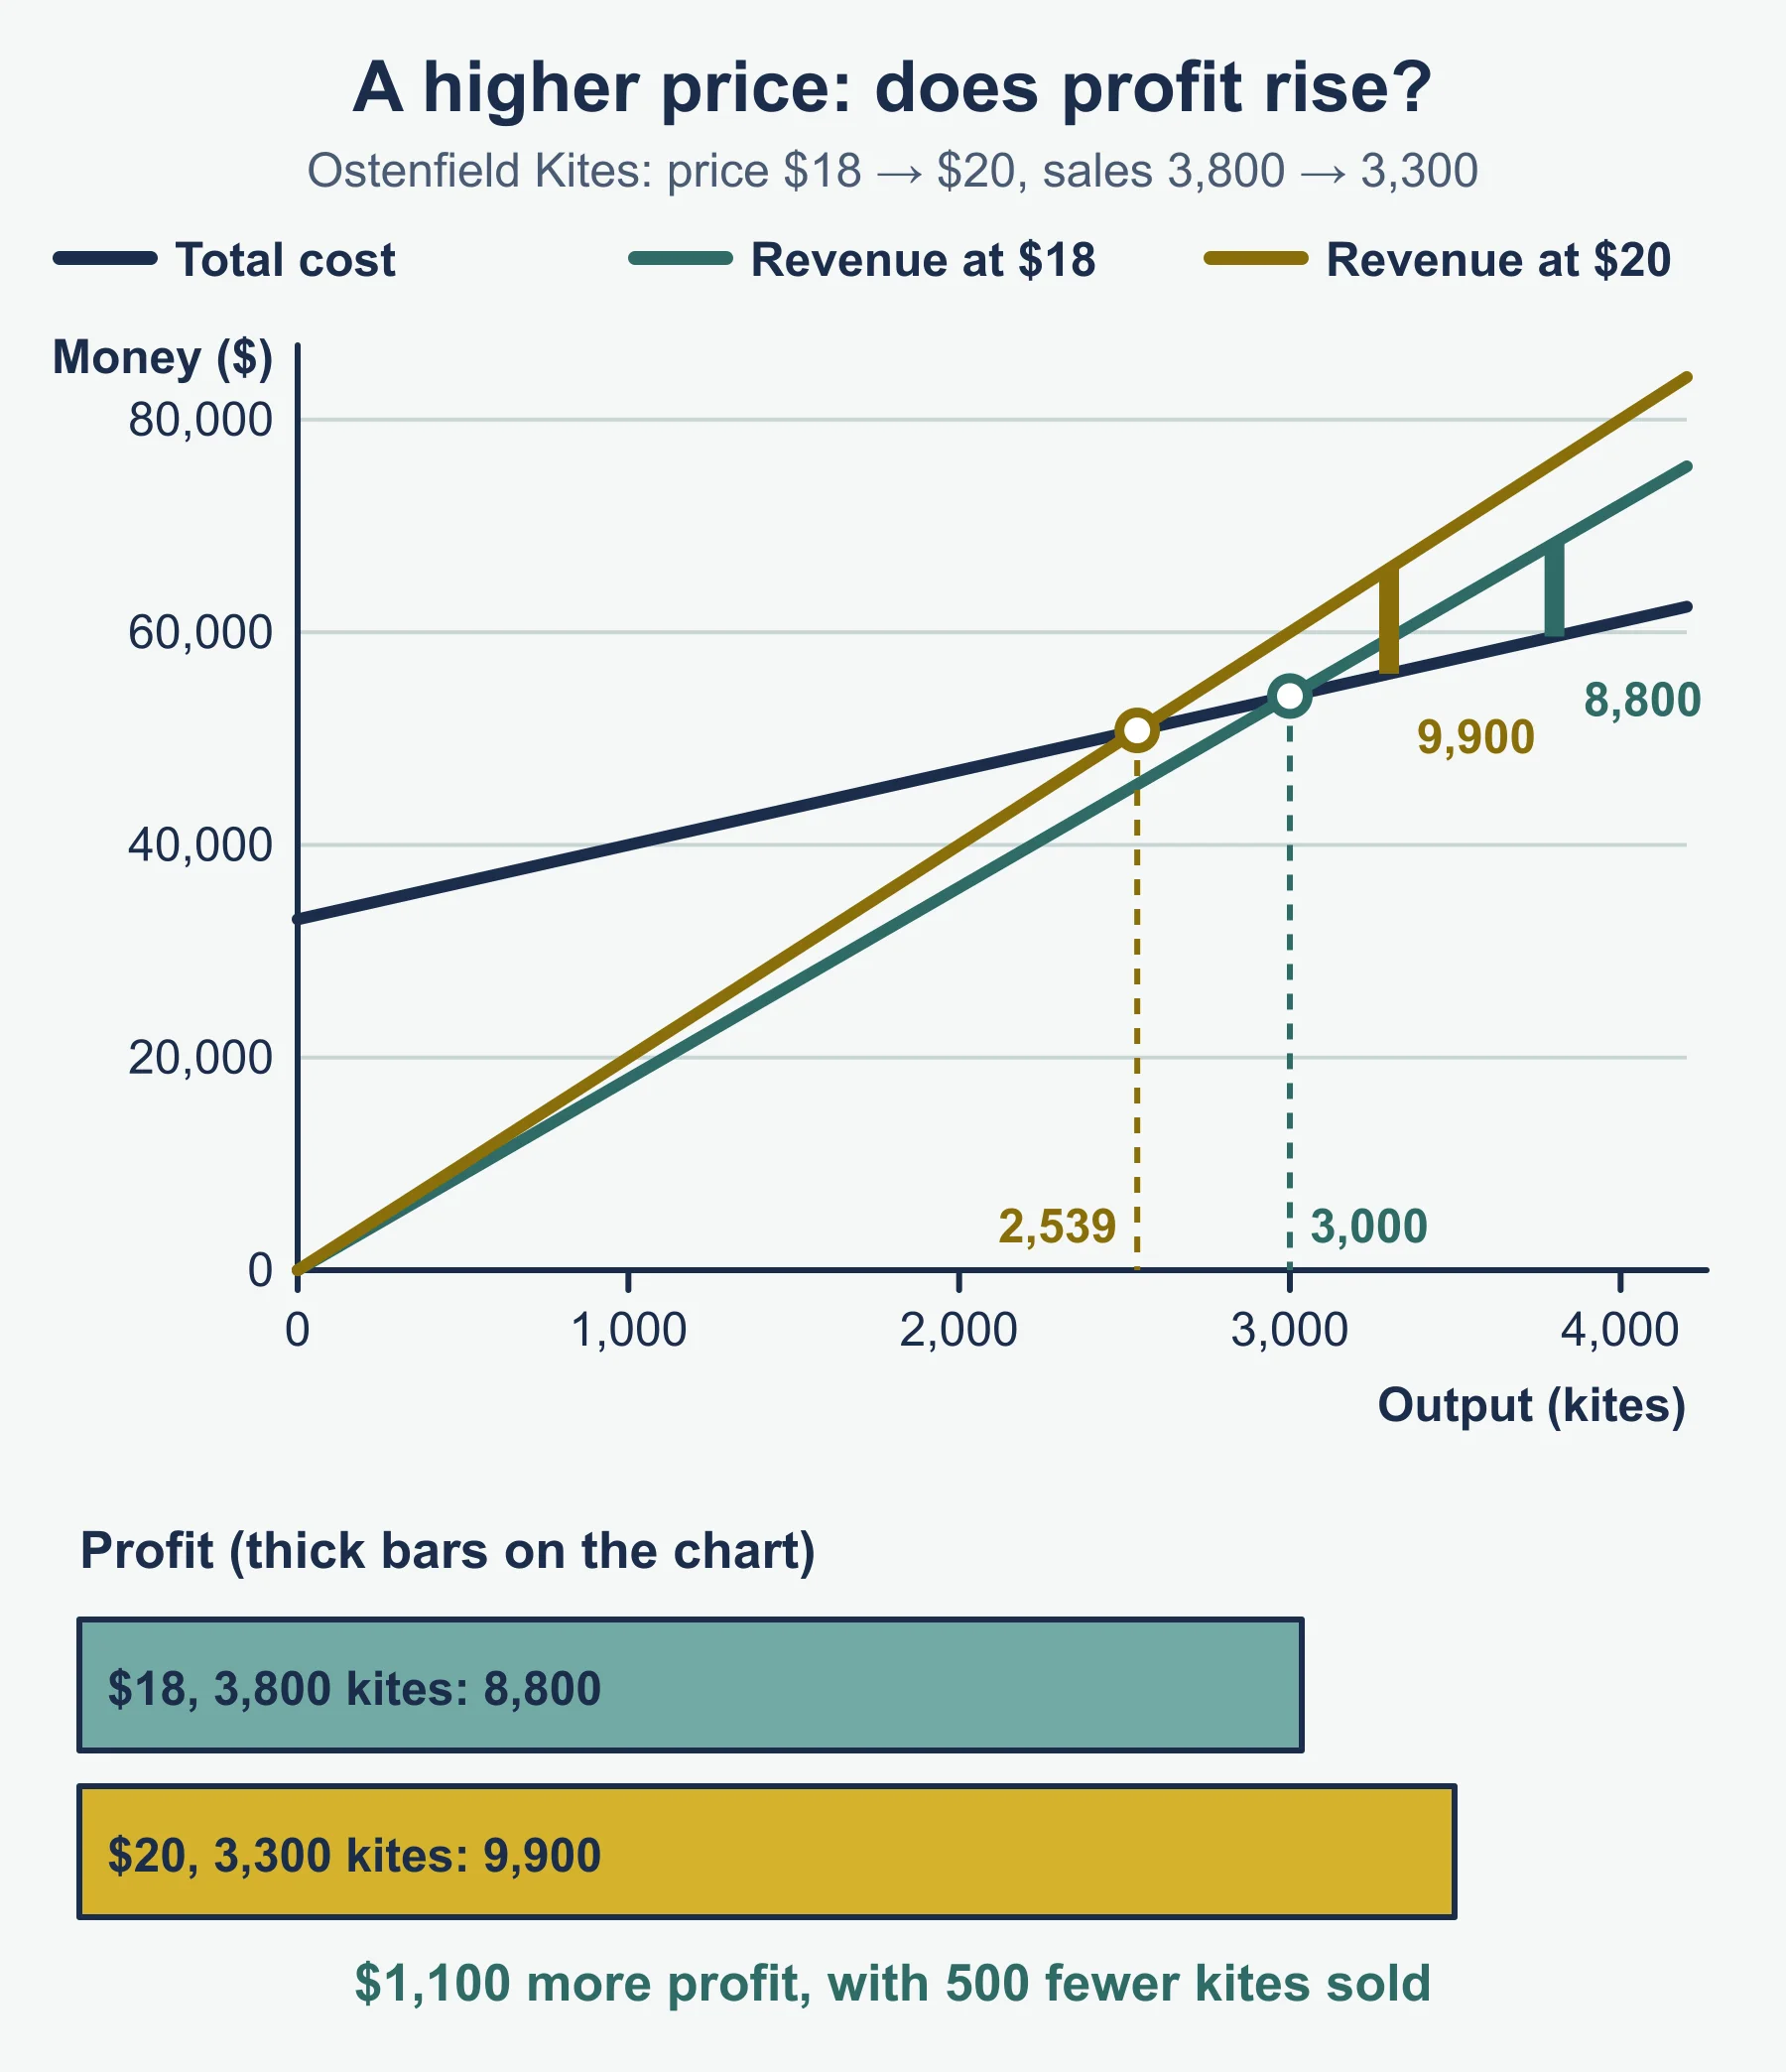
| Higher price | Revenue line steeper | Falls (moves left) |
| Higher variable cost per unit | Total cost line steeper | Rises (moves right) |
| Lower fixed costs | Total cost line moves down | Falls (moves left) |
Limitations of break-even analysis
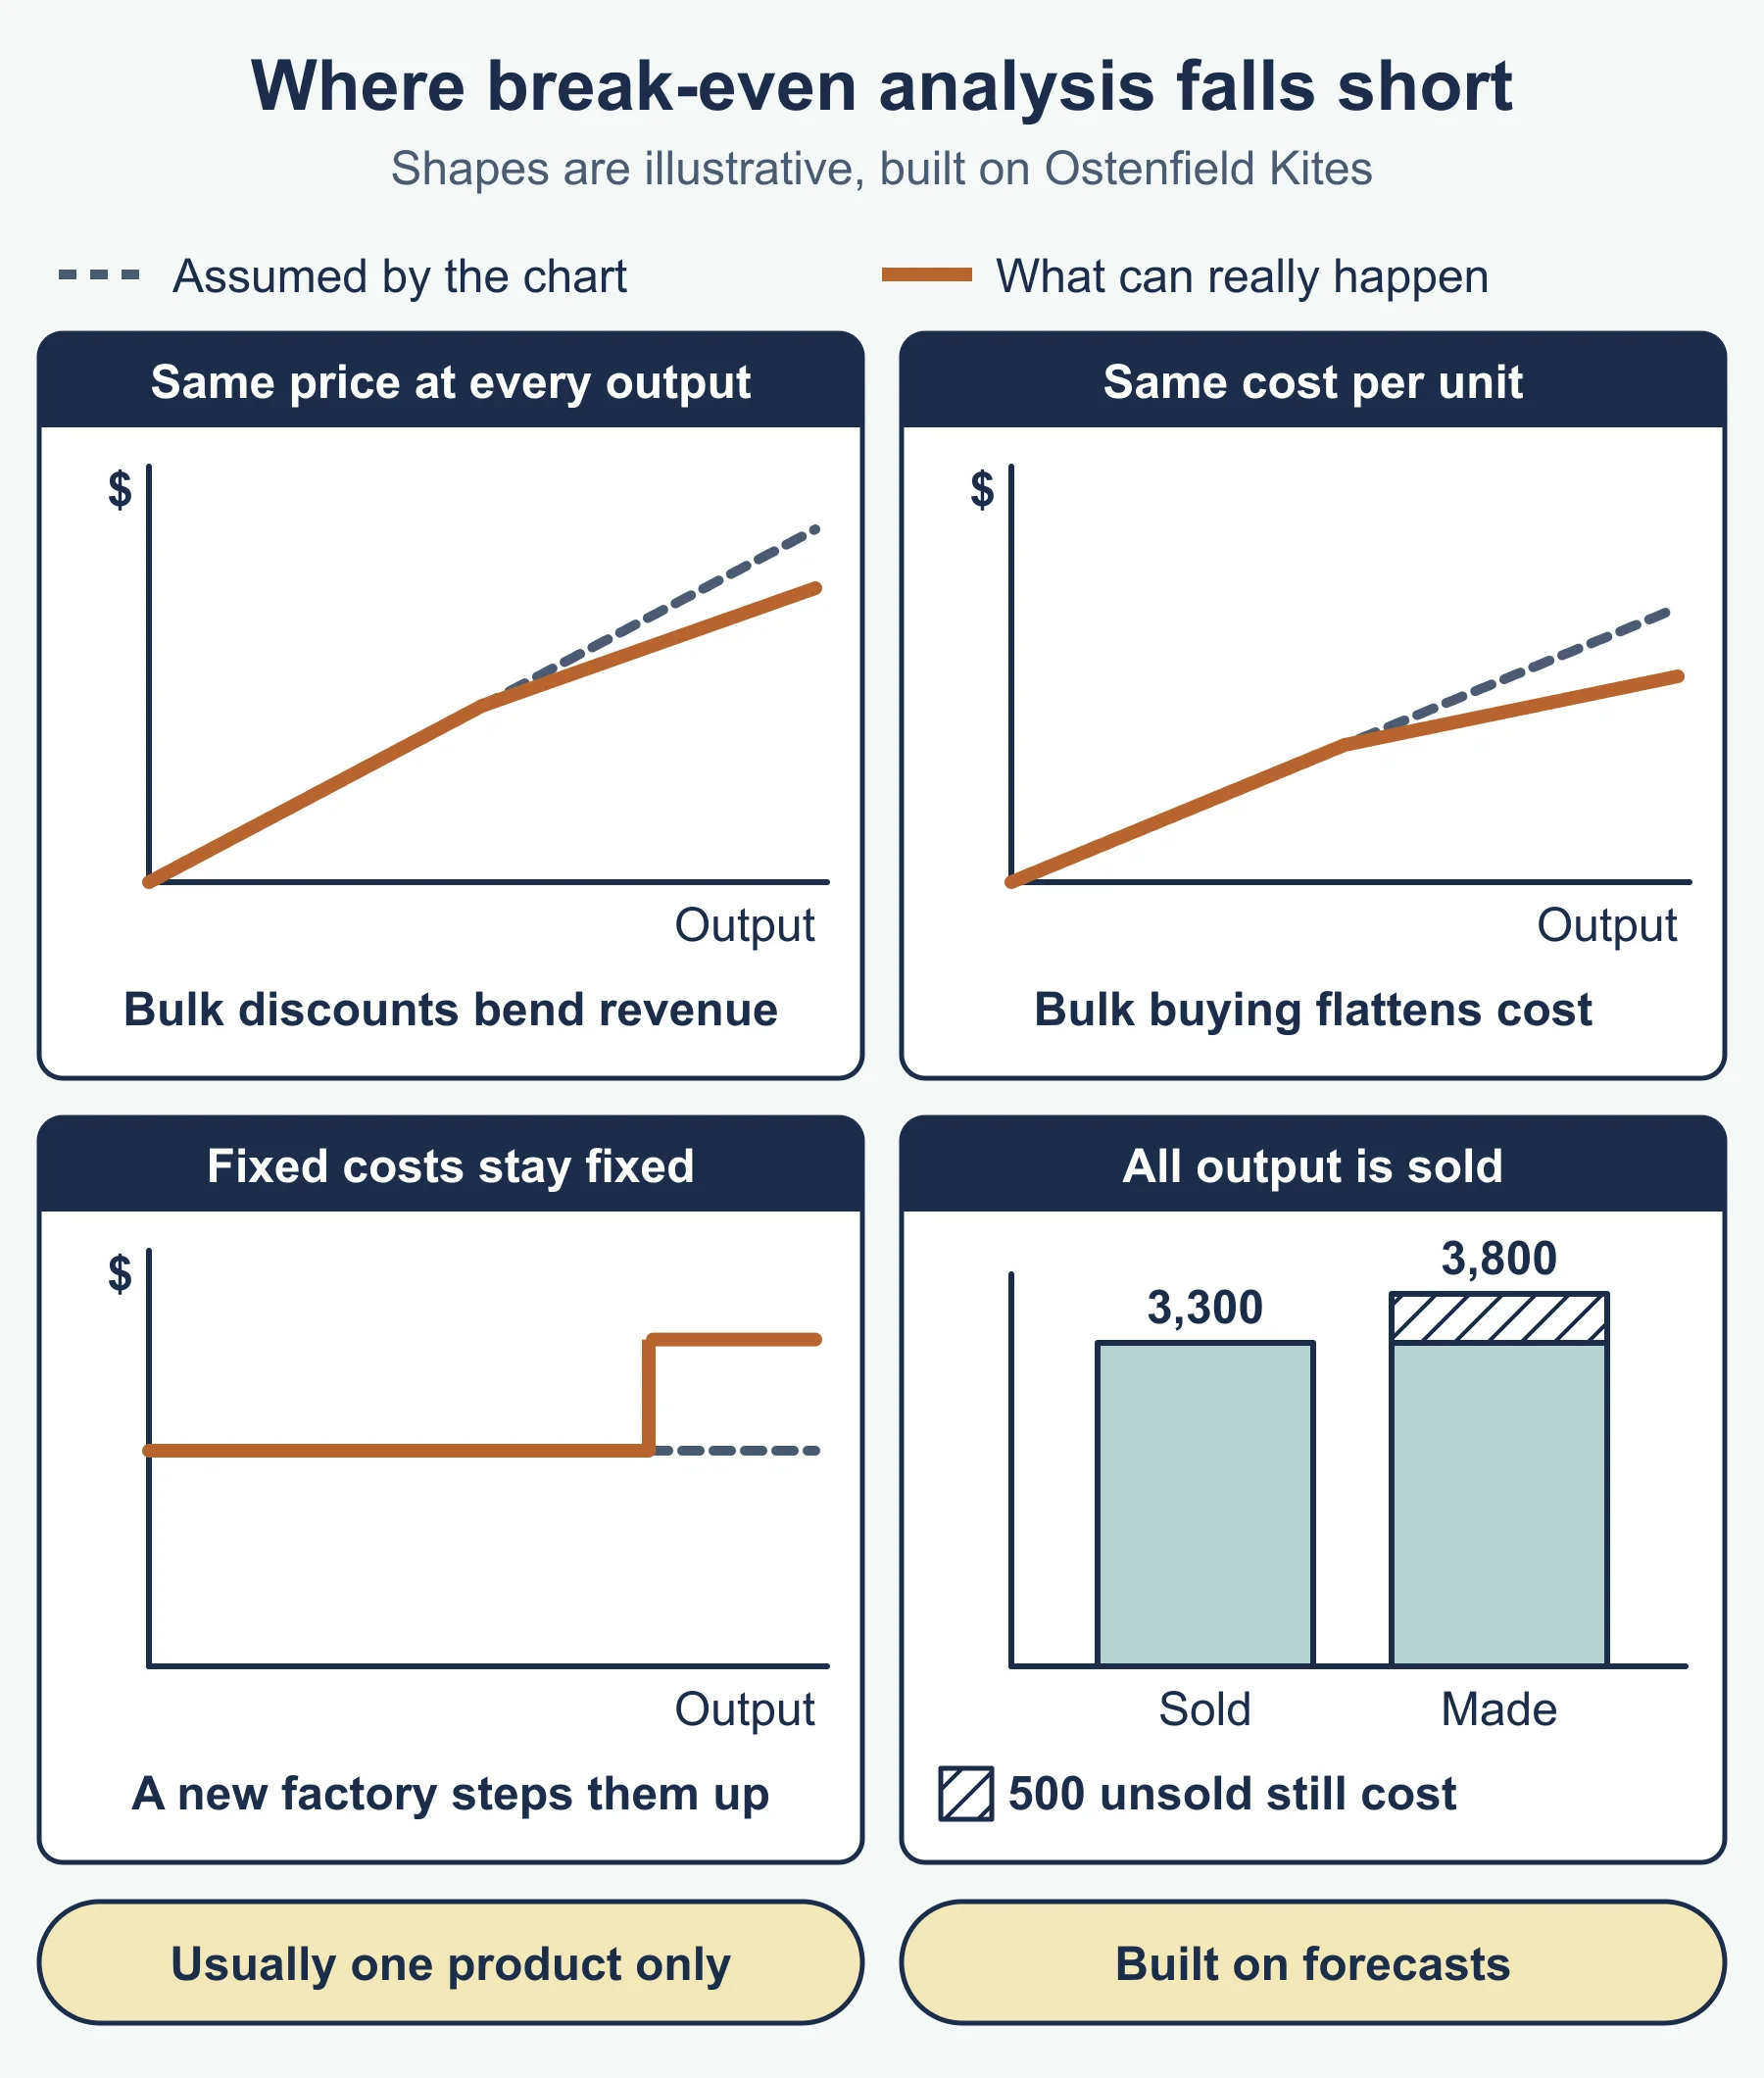
- It assumes all output is sold.
- It assumes a constant selling price, so discounts are ignored.
- It assumes variable cost per unit is constant, though bulk buying can change it.
- Fixed costs are assumed to stay fixed at all outputs.
- It normally covers a single product.
- Forecasts may be inaccurate and the picture is out of date quickly.
Quick self-test
- Define variable costs.
- A firm has fixed costs of 40 000 and variable costs of 30 per unit. It sells at 50. Calculate break-even output.
- Its expected output is 2 800 units. Calculate the margin of safety in units.
- Total cost for 5 000 units is 55 000. Calculate average cost.
- Name the economy of scale where a bank gives a larger firm a lower interest rate.
- Identify two causes of diseconomies of scale.
- Fixed costs are 18 000, price is 14 and variable cost per unit is 8. Calculate break-even output.
- What happens to break-even output if rent rises, other things equal?
- State one limitation of break-even analysis.
- A product has revenue of 9 000, variable costs of 7 500 and fixed costs of 2 000 that will be paid anyway. Should the product continue? Support your answer with figures.
Answers
- Costs that change directly with the level of output, such as materials.
- Contribution = 50 - 30 = 20; 40 000 / 20 = 2 000 units.
- 2 800 - 2 000 = 800 units.
- 55 000 / 5 000 = 11 per unit.
- Financial economy of scale.
- Any two from: poor communication, lack of commitment from employees, weak coordination.
- Contribution = 14 - 8 = 6; 18 000 / 6 = 3 000 units.
- It rises. Rent is a fixed cost, so the total cost line moves up and break-even moves right.
- Any one, such as: assumes all output is sold; assumes a constant price; assumes constant variable cost per unit.
- Contribution = 9 000 - 7 500 = 1 500, which is positive, and the fixed costs of 2 000 are paid anyway. Stopping would turn a loss of 500 into a loss of 2 000, so continue.
Writing it up in the exam
For a calculation, write the formula, substitute the figures, then give the answer with its unit. For a written question, make a point, say how it changes cost or profit, and link it to the business in the stem. For a decision question, give a reason on each side and finish with a clear choice. Break-even results rest on forecasts, so say what would change your decision.
Where marks are usually lost
- Dividing fixed costs by the price rather than the contribution per unit.
- Writing “costs” instead of “average cost” for economies of scale.
- Giving a type of economy or diseconomy by name without saying how it changes cost per unit.
- Starting the fixed cost line or total cost line at the origin on a chart.
- Reading margin of safety from the wrong axis, or giving it without units.
- Stopping a product because it makes a loss, without checking contribution or whether the fixed costs would remain.
- Copying the case study’s facts without applying them to the question asked.
- Listing limitations of break-even without explaining why each one matters.
Frequently asked questions
How do you calculate break-even output for O Level Business 7115? Break-even output = fixed costs ÷ contribution per unit, where contribution per unit = selling price − variable cost per unit. The syllabus does not print these formulas, so they are the standard forms.
Do economies of scale mean total costs fall? No. Economies of scale mean average cost, or cost per unit, falls as the scale of production rises. Writing “costs fall” instead of “average cost falls” loses marks.
Where does the fixed cost line start on a break-even chart? The fixed cost line is horizontal and starts above zero on the vertical axis, and the total cost line starts at the same point. Only the total revenue line starts at the origin.
What moves the break-even point? Higher fixed costs lift the fixed cost and total cost lines, so break-even moves to a higher output. A higher selling price makes the revenue line steeper, so break-even falls.
Official syllabus
Source: Cambridge O Level Business Studies 7115 syllabus for examination in 2026, published by Cambridge International, section 4.2.
Get free revision emails (optional)
Occasional emails with practice questions, worked explanations and links to free resources for the qualification and subjects you choose. No spam, and you can unsubscribe from any email. The free tools on this site never need an email.
Related resources
-
Practice questions
O Level Business: Operations management — Practice Questions (Cambridge 7115)
Original practice questions with worked answers on flow and batch production, location, labour productivity and break-even for Cambridge O Level Business 7115.
Business · Cambridge · O Level
Try questions -
Study guides
O Level Business: Production of goods and services (Cambridge 7115)
Study guide to production, productivity, inventories, lean production, job, batch and flow methods and technology, for Cambridge O Level Business 7115.
Business · Cambridge · O Level
Read guide -
Practice questions
O Level Business: Production of goods and services (Cambridge 7115) – Practice Questions
Original short-answer, calculation and case-study questions with worked answers on production, lean methods and technology for Cambridge O Level Business.
Business · Cambridge · O Level
Try questions
Related articles
-
teaching
A Level tuition in Dubai: Cambridge or Pearson Edexcel International A Level?
Schools in Dubai and Abu Dhabi teach either Cambridge International AS & A Level or Pearson Edexcel International A Level. How the two are structured, why it matters for tuition, and how online classes from Lahore work.
9 October 2026
-
curriculum guides
Choosing subjects at IGCSE and A Level
How subject choices at 14 and 16 affect university options later, and how to keep pathways open without overloading a timetable.
28 July 2026
Studying this with a teacher
Working through Business O LEVELS?
This page is free and stays free. If you would rather be taught it, Marlbridge runs Business classes one-to-one and in small groups of up to 15, online in your own time zone. The first trial class is free. WhatsApp replies within an hour (8am–11pm Pakistan time, every day); email the same day.
Cambridge Business teachers at Marlbridge

