Revision Notes
Crude and Standardised Rates: O Level Statistics 4040 and IGCSE 0479 Revision Notes
Condensed revision notes on crude, age-specific and standardised rates with a self-test, for Cambridge O Level Statistics 4040 and IGCSE Statistics 0479.
- Subject
- Statistics
- Level
- O LEVELS, IGCSE
- Topic
- Crude and standardised rates, and their appropriate use
- Author
- Marlbridge Academic Team
- Updated
- Reviewed by
- Muhammad Ghazali Siddiqui (what this means)
Aligned to Cambridge O Level IGCSE Statistics (4040, 0479), 2025-2027. Official specification (O Level) ; Official specification (IGCSE) .
Syllabus page (what it covers and how it is assessed): Cambridge O Level Statistics; Cambridge IGCSE Statistics.
Syllabus points this page covers
4040
- 7 Crude and standardised rates, and their appropriate use (whole topic)
0479
- 9 Crude and standardised rates (whole topic)
Found an error? Report a correction.
Want a teacher for this? Marlbridge teaches Statistics online. Request a free trial class.
These revision notes cover topic 7, crude and standardised rates and their appropriate use, of the Cambridge O Level Statistics 4040 syllabus for examination in 2025, 2026 and 2027. The same content appears as topic 9 of the Cambridge IGCSE Statistics 0479 syllabus for 2027, where it is listed as five learning outcomes. Neither syllabus text splits this topic into tiers. For full explanations read the study guide first, then test yourself with the practice questions.
Use the 4040 course hub and the printable checklist to tick off outcomes. If you are unsure where you stand, try the free 10-minute diagnostics. Related topic: index numbers also use weights.
What the syllabus lists
The 4040 text for topic 7 is short: crude and standardised rates and their appropriate use, including application to death rates, fertility rates and accident rates. The 0479 text spells out the same skills as five outcomes. Use this table as a checklist.
| Outcome | What you must be able to do | Section below |
|---|---|---|
| Crude rate | Work out a crude rate for births, deaths or accidents in a population, using the rate definition in the question | 1 |
| Reason | Understand why a standardised rate is found | 3 |
| Standardised rate | Calculate a standardised rate given a standard population; it is a weighted average of the rates in subgroups | 2 and 4 |
| Conclusions | Form conclusions about one population, or several, from crude and standardised rates | 5 |
| Total events | Use crude rates to find the number of events in a population or in a subgroup | 6 |
The 0479 text adds that rates will be defined in the question, for example as births per thousand of the population. So read the definition given and use it.
1. Crude rates
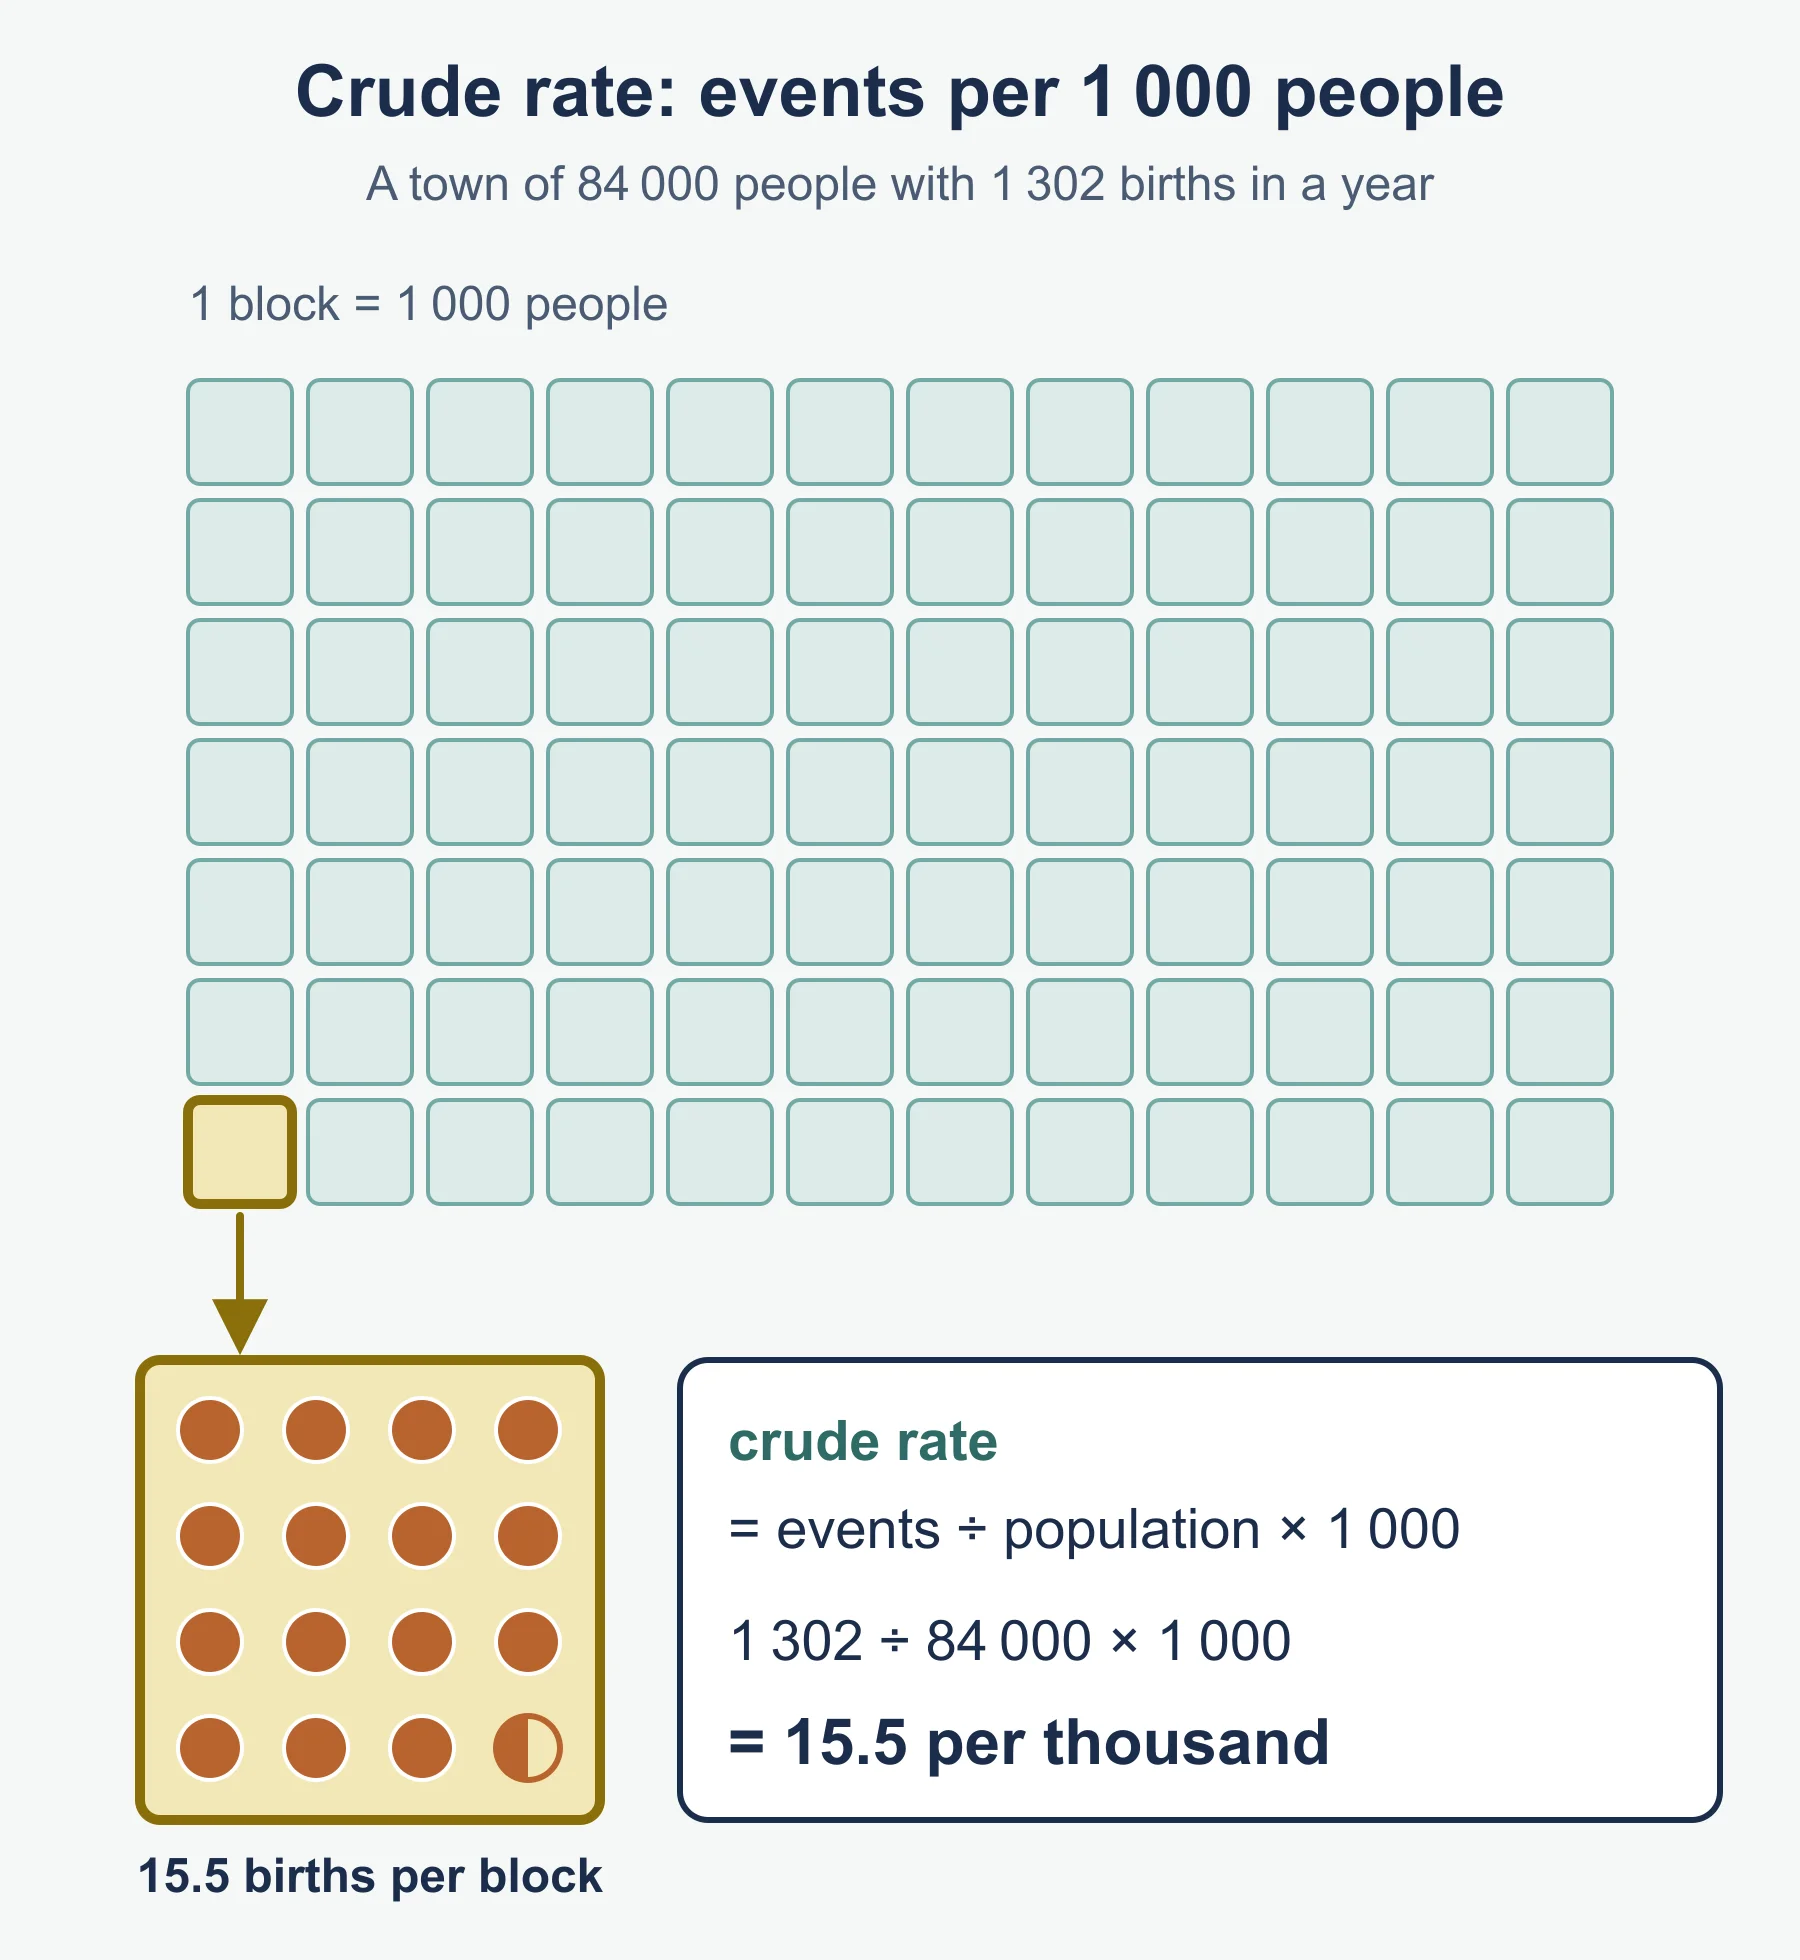
A crude rate compares the number of events with the size of the whole group at risk, scaled to a convenient base.
| Quantity | Formula | Per |
|---|---|---|
| Crude birth rate | births ÷ total population × 1000 | 1000 people |
| Crude death rate | deaths ÷ total population × 1000 | 1000 people |
| Fertility rate (usual form) | births ÷ number of women in the stated age range × 1000 | 1000 women |
| Accident rate | accidents ÷ number of workers (or drivers, or journeys) × 1000 | 1000 of the stated group |
Check the denominator each time. A fertility rate is normally based on women in a stated age range, not the whole population, but the question will define it. The age range 15 to 49 below is only an illustration.
Worked reminders:
- An island has 52 000 people and 936 births in a year. Crude birth rate = 936 ÷ 52 000 × 1000 = 18.0 per thousand.
- A region has 11 500 women aged 15 to 49 and 690 births to women in that range. Fertility rate = 690 ÷ 11 500 × 1000 = 60.0 per thousand women.
- A bus depot employs 640 drivers and records 24 accidents. Accident rate = 24 ÷ 640 × 1000 = 37.5 per thousand drivers.
2. Age-specific (subgroup) rates
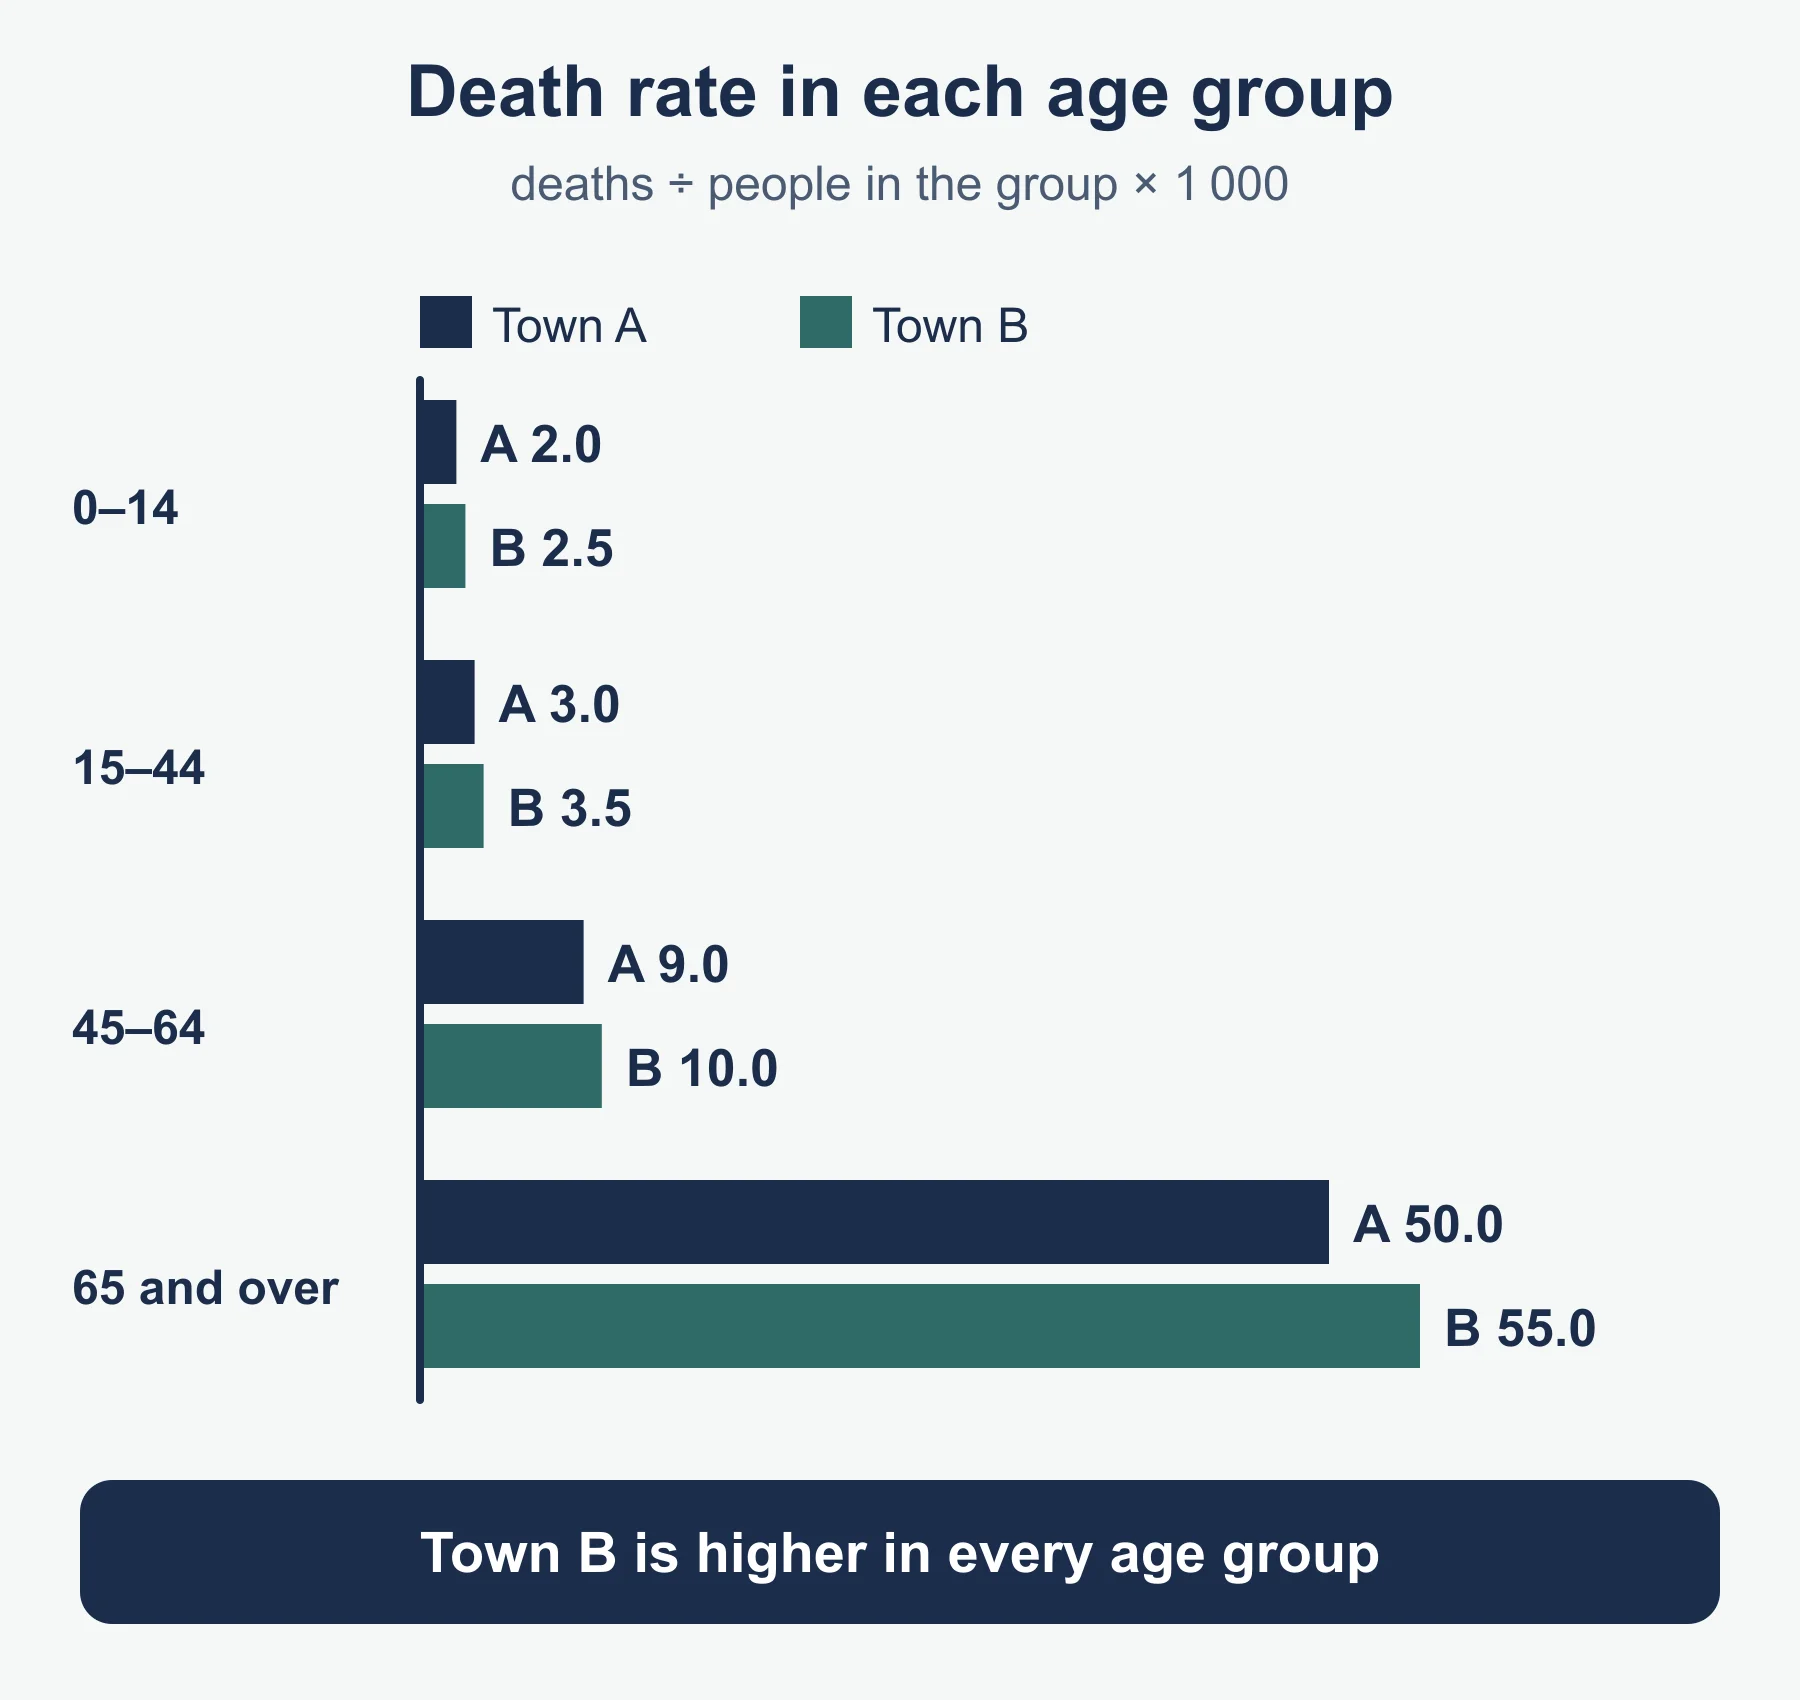
A rate for one subgroup uses only that subgroup’s events and size:
age-specific rate = events in the group ÷ people in the group × 1000
The subgroup does not have to be an age band. It could be sex, occupation or years of driving experience. The idea is the same: the rate inside each group is the building block for standardising.
3. Why standardise
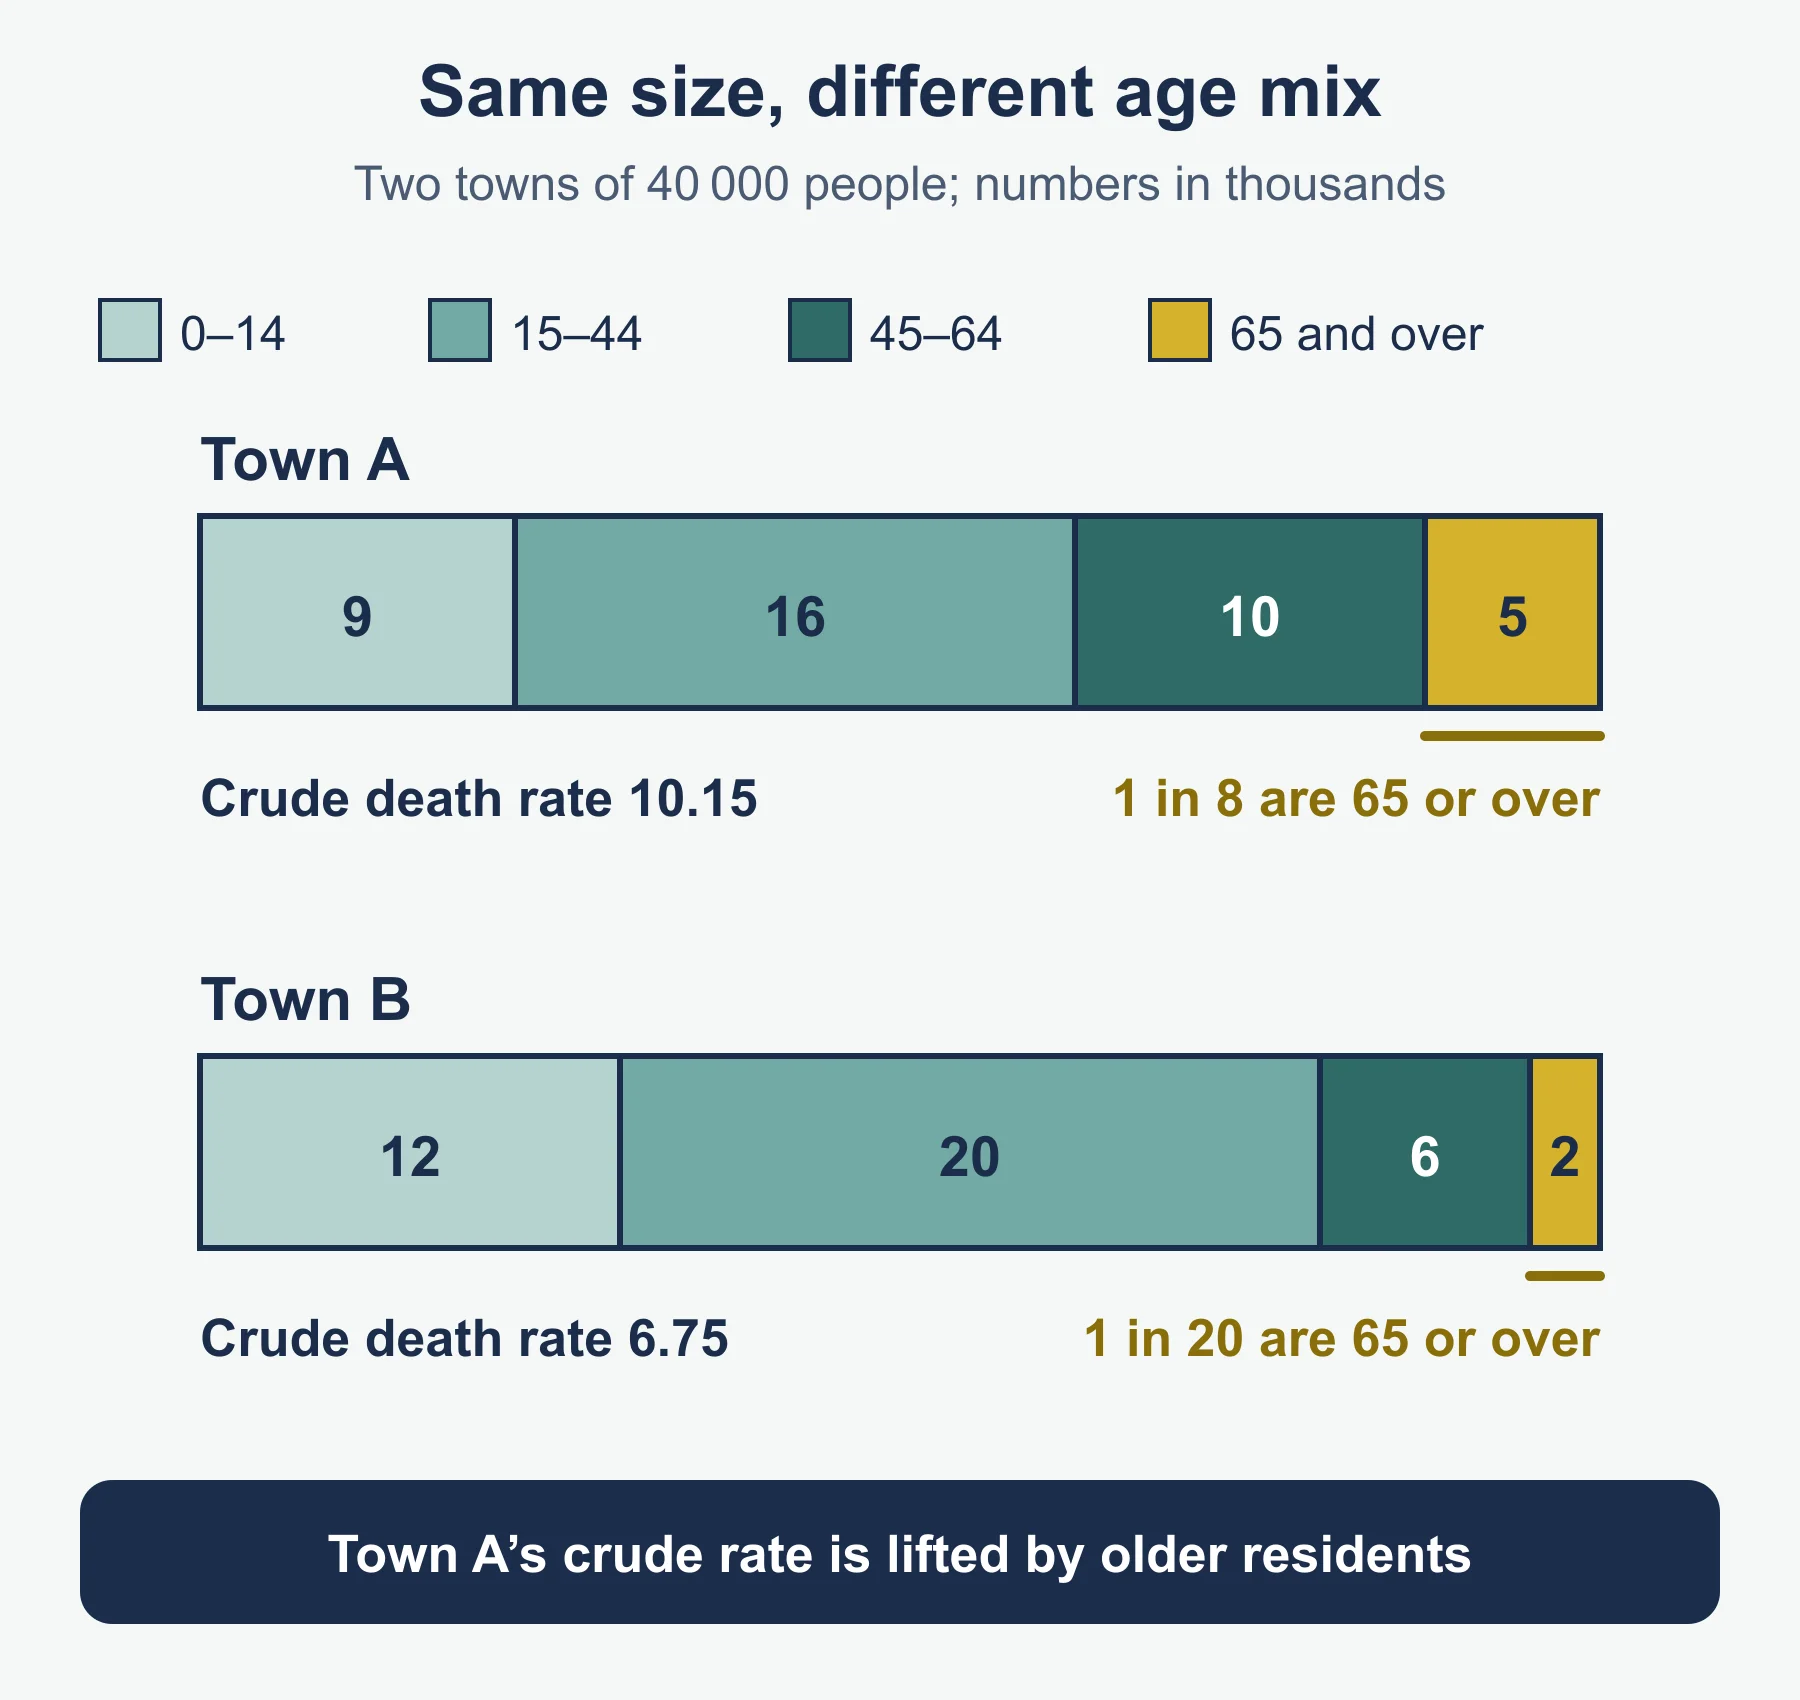
A crude rate mixes two things: how risky life is in each group, and how many people are in each group. Death rates are much higher for older people, so a population with many older people tends to show a high crude death rate even when each age group is doing well.
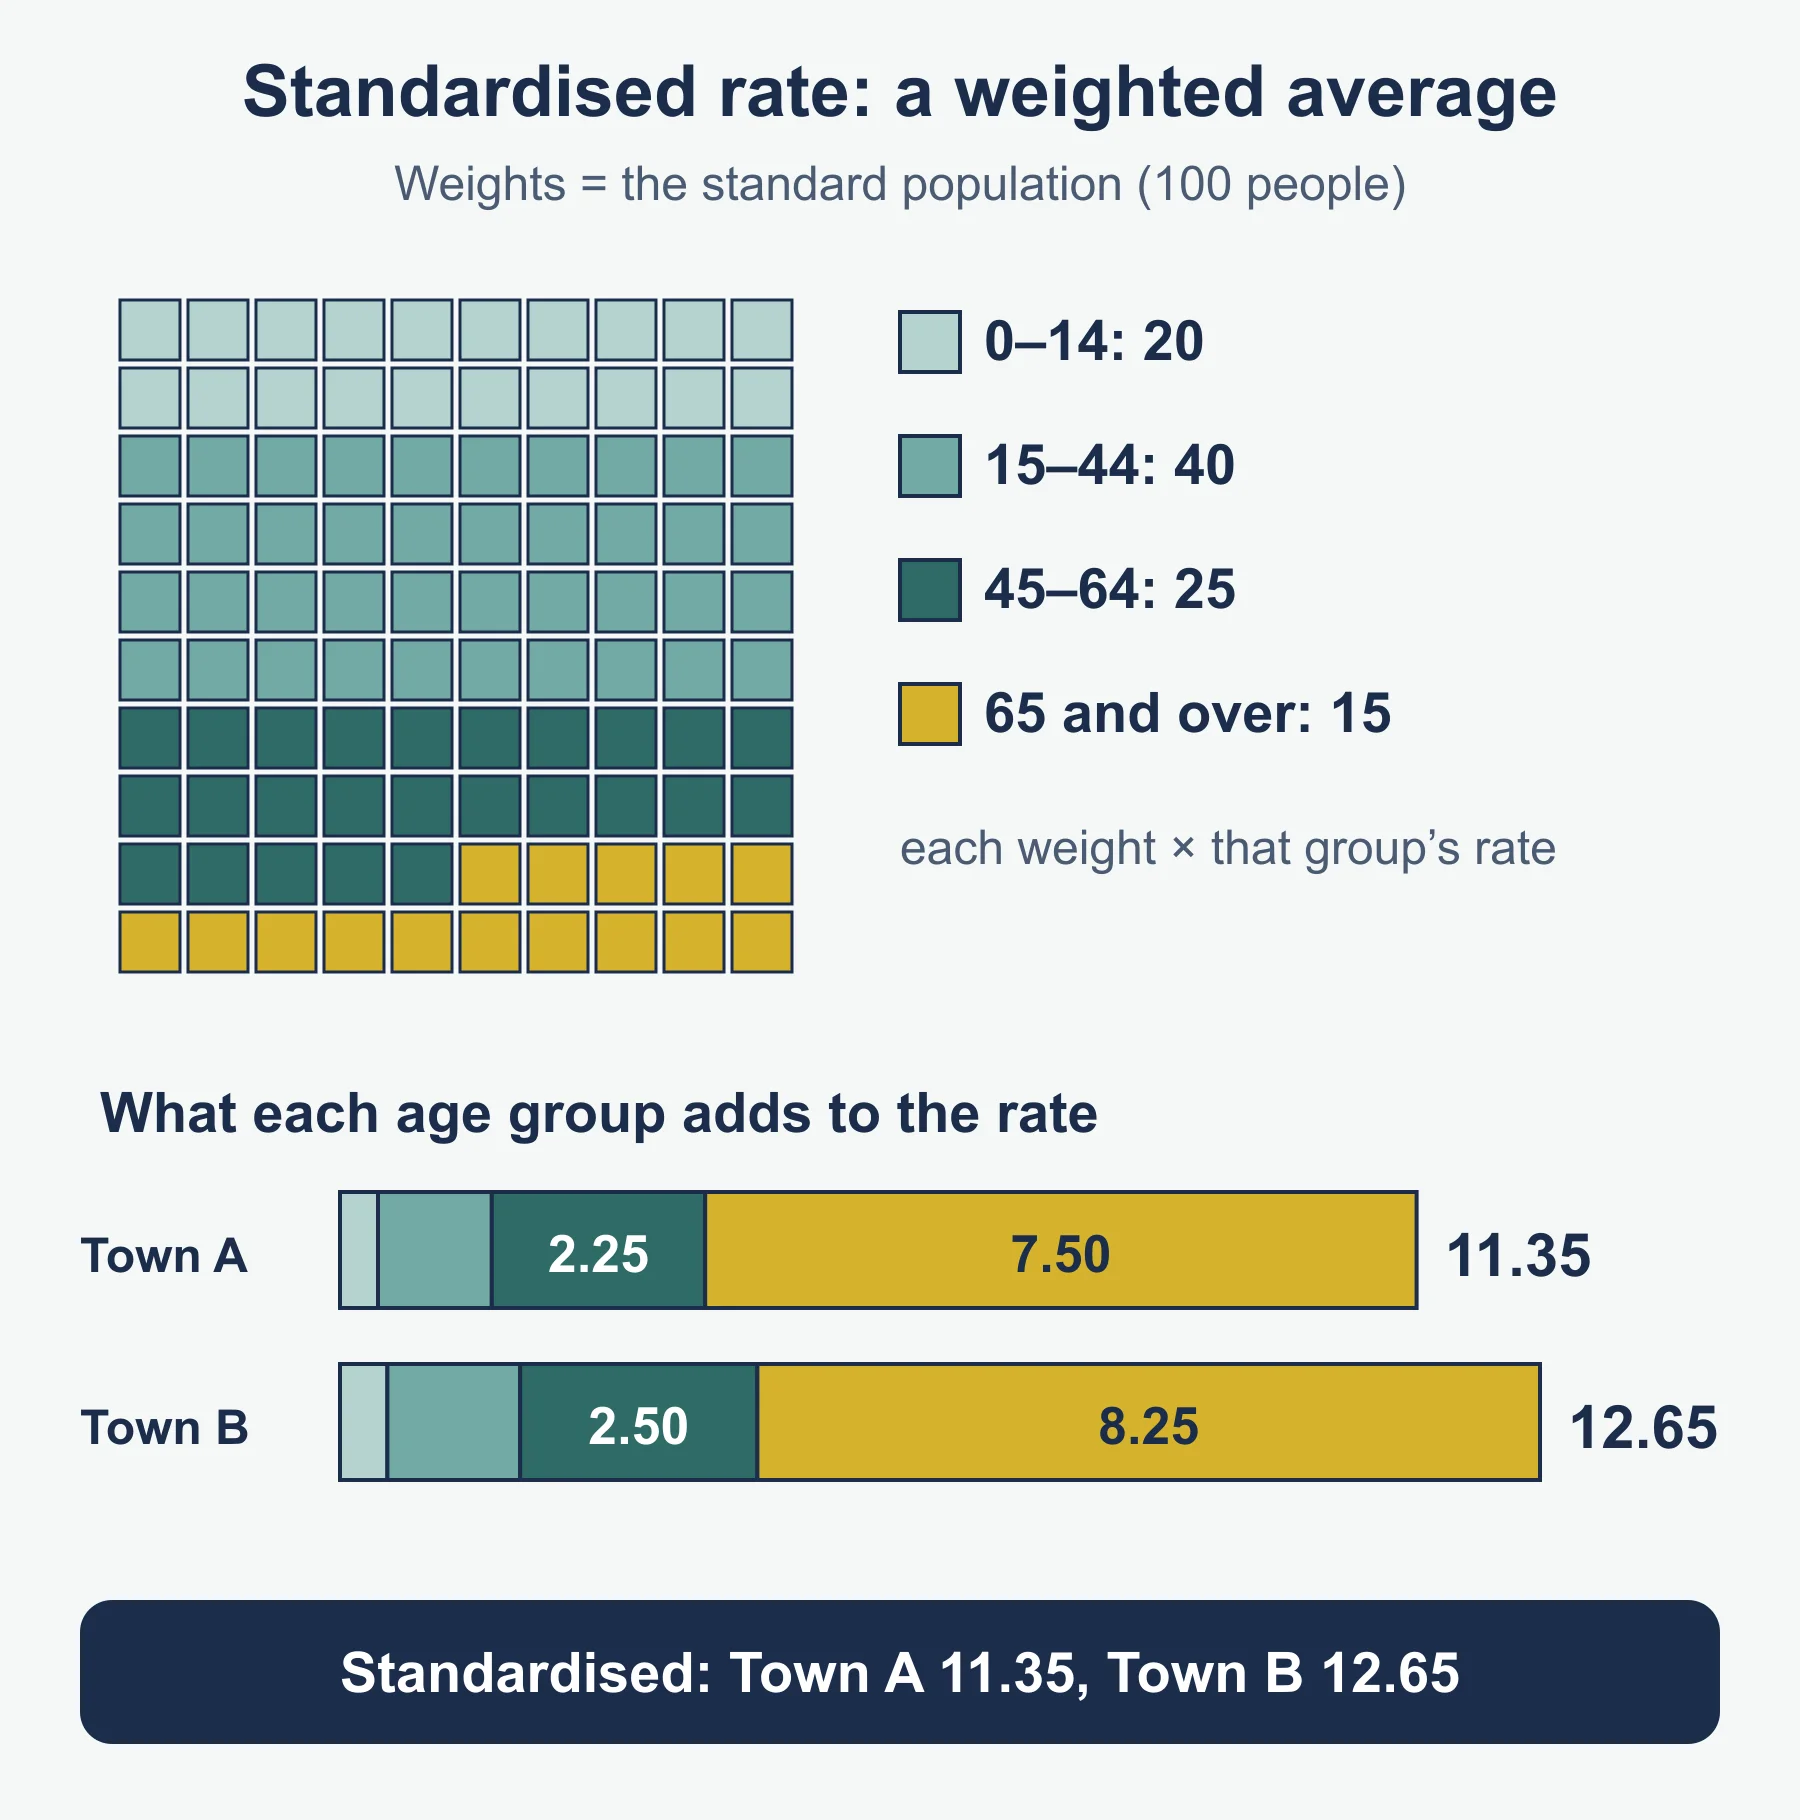
A standardised rate removes the effect of the population’s make-up. It answers: what would the rate be if this population had the same group sizes as a chosen standard population? Two populations measured against the same standard can be compared fairly.
Key points to learn:
- The reason in one sentence: populations differ in age structure, and the event rate depends on age, so crude rates may not compare like with like.
- The standard population is supplied. You do not choose it.
- Standardising does not change the age-specific rates. It changes the weights.
4. Calculating a standardised rate
A standardised rate is a weighted average of the subgroup rates, with the standard population as the weights.
standardised rate = Σ (standard population of group × group’s rate) ÷ Σ (standard population)
Method in steps
- Work out the rate for each subgroup of the population you are standardising (events ÷ people × 1000).
- Multiply each rate by the standard population for that group.
- Add the products.
- Divide by the total of the standard population (100 if the standard is given as percentages).
- State the unit, for example per thousand.
The standard population may be given as counts or percentages. Both work. Repeat all five steps for each population you are comparing.
Worked reminder: two districts
The standard population is 30 000 aged under 20, 50 000 aged 20 to 59 and 20 000 aged 60 and over (100 000 in total).
| Group | Hill pop. | Hill deaths | Hill rate | Vale pop. | Vale deaths | Vale rate |
|---|---|---|---|---|---|---|
| Under 20 | 12 000 | 18 | 1.5 | 16 000 | 32 | 2.0 |
| 20 to 59 | 20 000 | 40 | 2.0 | 20 000 | 50 | 2.5 |
| 60 and over | 8 000 | 200 | 25.0 | 4 000 | 120 | 30.0 |
| Total | 40 000 | 258 | 40 000 | 202 |
Crude death rates (per thousand):
- Hill: 258 ÷ 40 000 × 1000 = 6.45
- Vale: 202 ÷ 40 000 × 1000 = 5.05
Standardised death rates (per thousand):
- Hill: (30 000 × 1.5 + 50 000 × 2.0 + 20 000 × 25.0) ÷ 100 000 = (45 000 + 100 000 + 500 000) ÷ 100 000 = 6.45
- Vale: (30 000 × 2.0 + 50 000 × 2.5 + 20 000 × 30.0) ÷ 100 000 = (60 000 + 125 000 + 600 000) ÷ 100 000 = 7.85
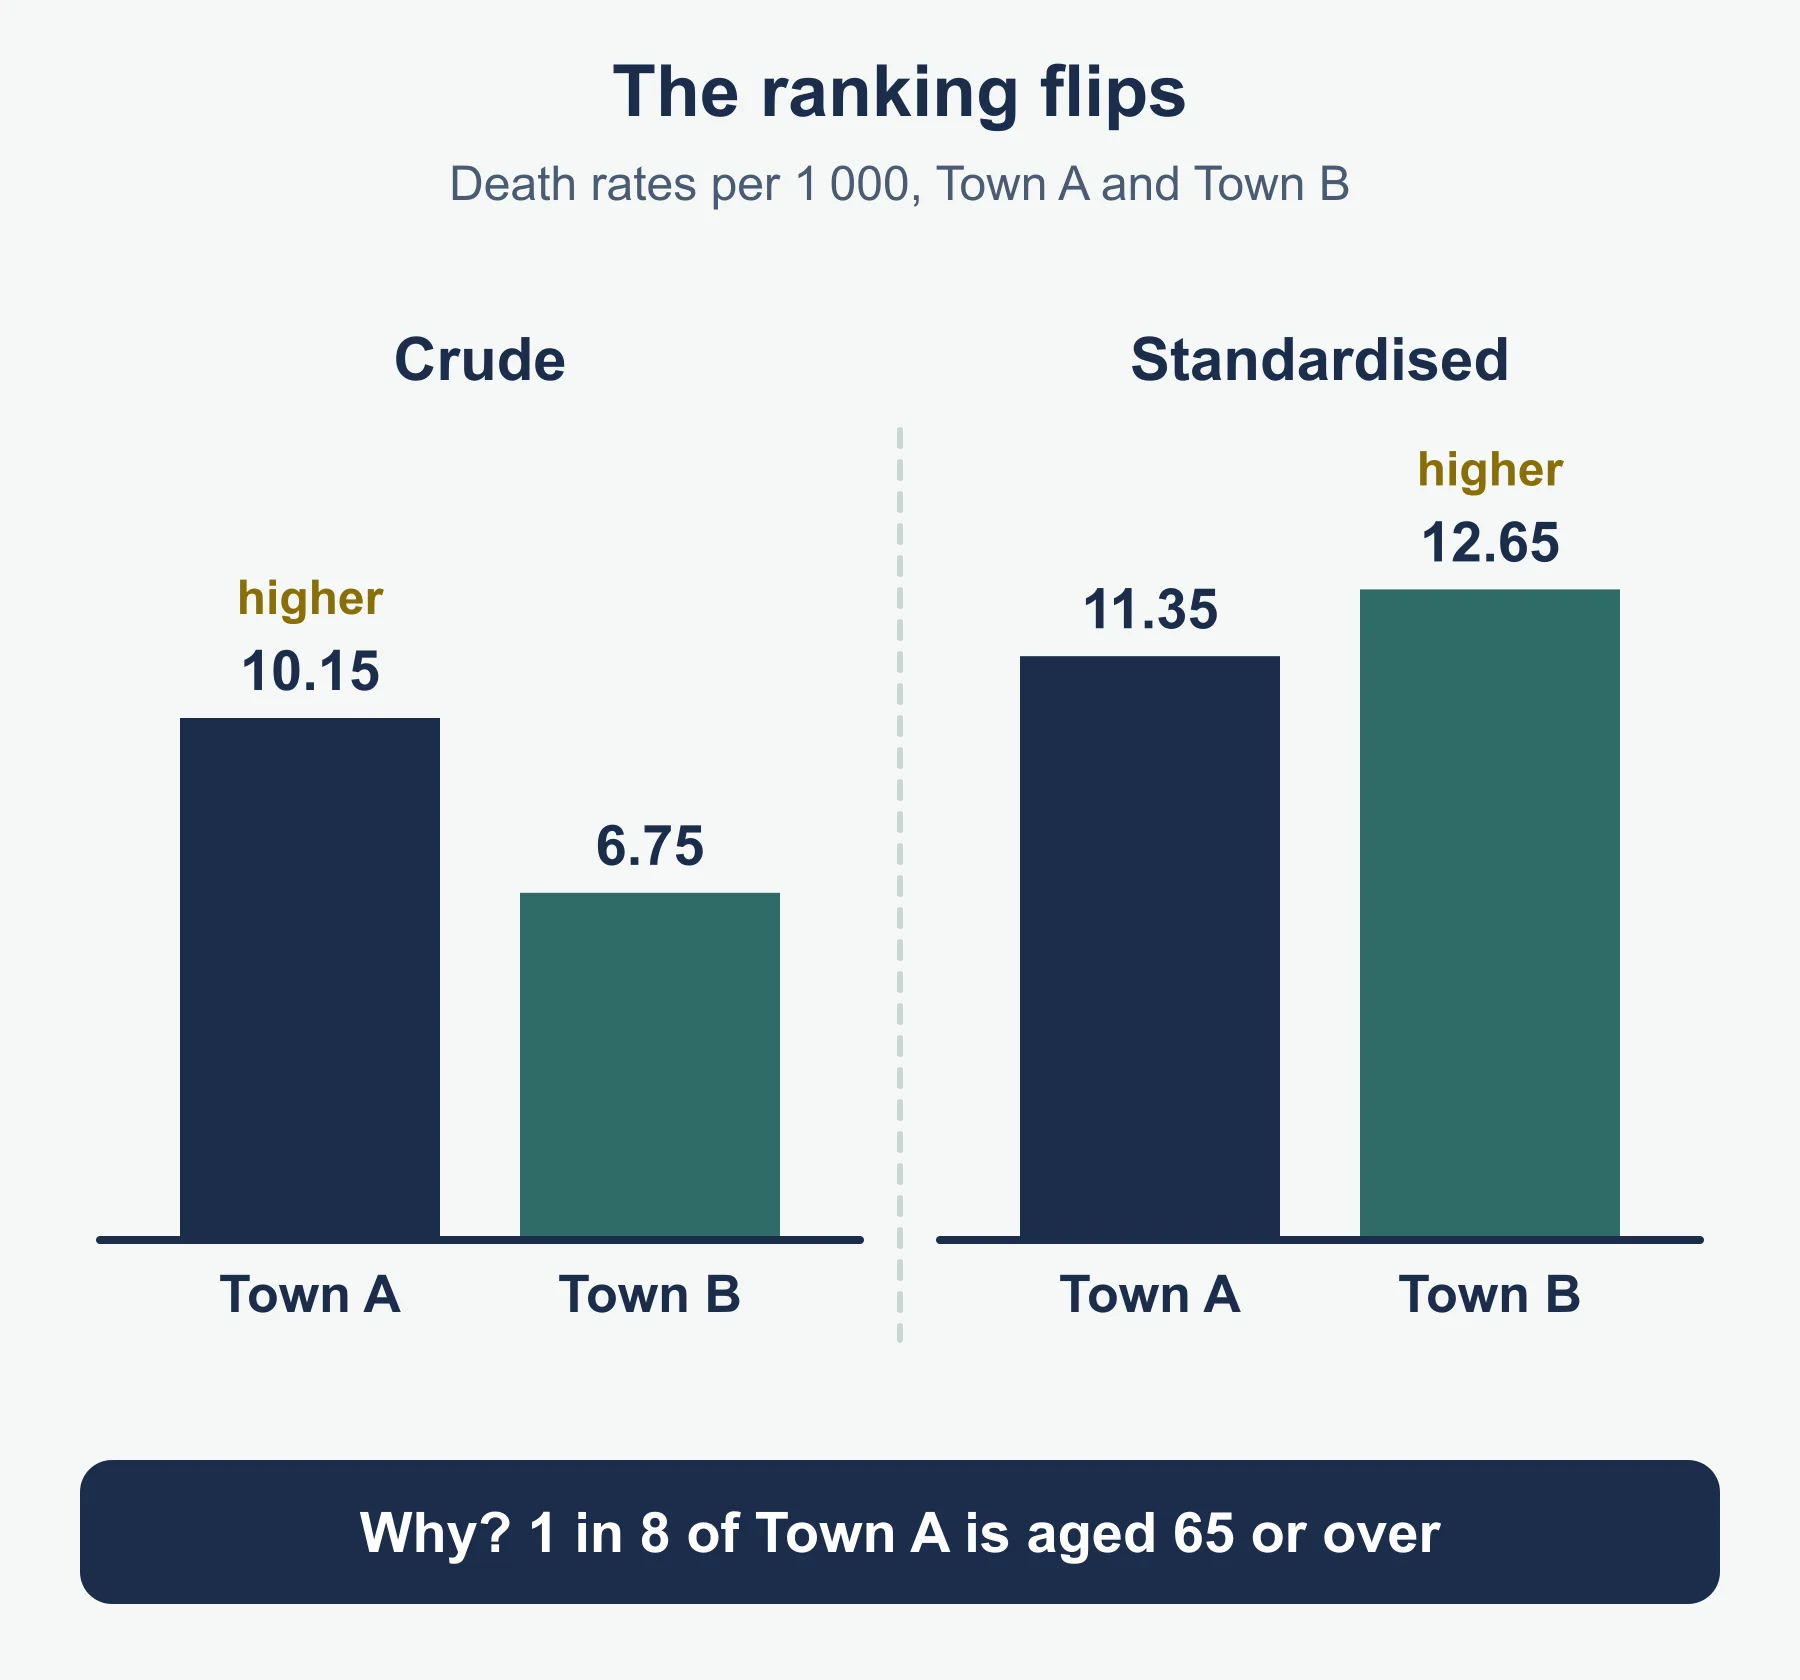
Two things to notice. First, Hill’s standardised rate equals its crude rate. That is because Hill has exactly the standard population’s make-up (30%, 50% and 20% in the three groups), so standardising changes nothing for it. Second, the order reverses: Vale has the lower crude rate but the higher standardised rate.
5. Forming conclusions
Use this order when a question asks you to compare populations.
- Quote the crude rates and say which population is higher.
- Quote the standardised rates and say which is higher.
- If the two comparisons agree, say so: the standardising has not changed the conclusion.
- If they disagree, explain why, by naming the difference in make-up. For Hill and Vale: Vale has only 10% of its people aged 60 and over (4 000 of 40 000), against 20% in Hill. That younger structure lowers Vale’s crude rate.
- Give a conclusion in context: after allowing for age structure, Vale has the higher death rate, and its rate is higher in every age group.
Other points that earn credit:
- A standardised rate is a measure for comparison. It is not the actual rate in the population, and it depends on which standard population was used.
- Comparing the age-specific rates group by group can support the conclusion. Here Vale is higher in all three groups.
- Do not claim that a population “has more deaths” because its rate is higher. Rates and totals answer different questions.
6. From a rate back to the number of events
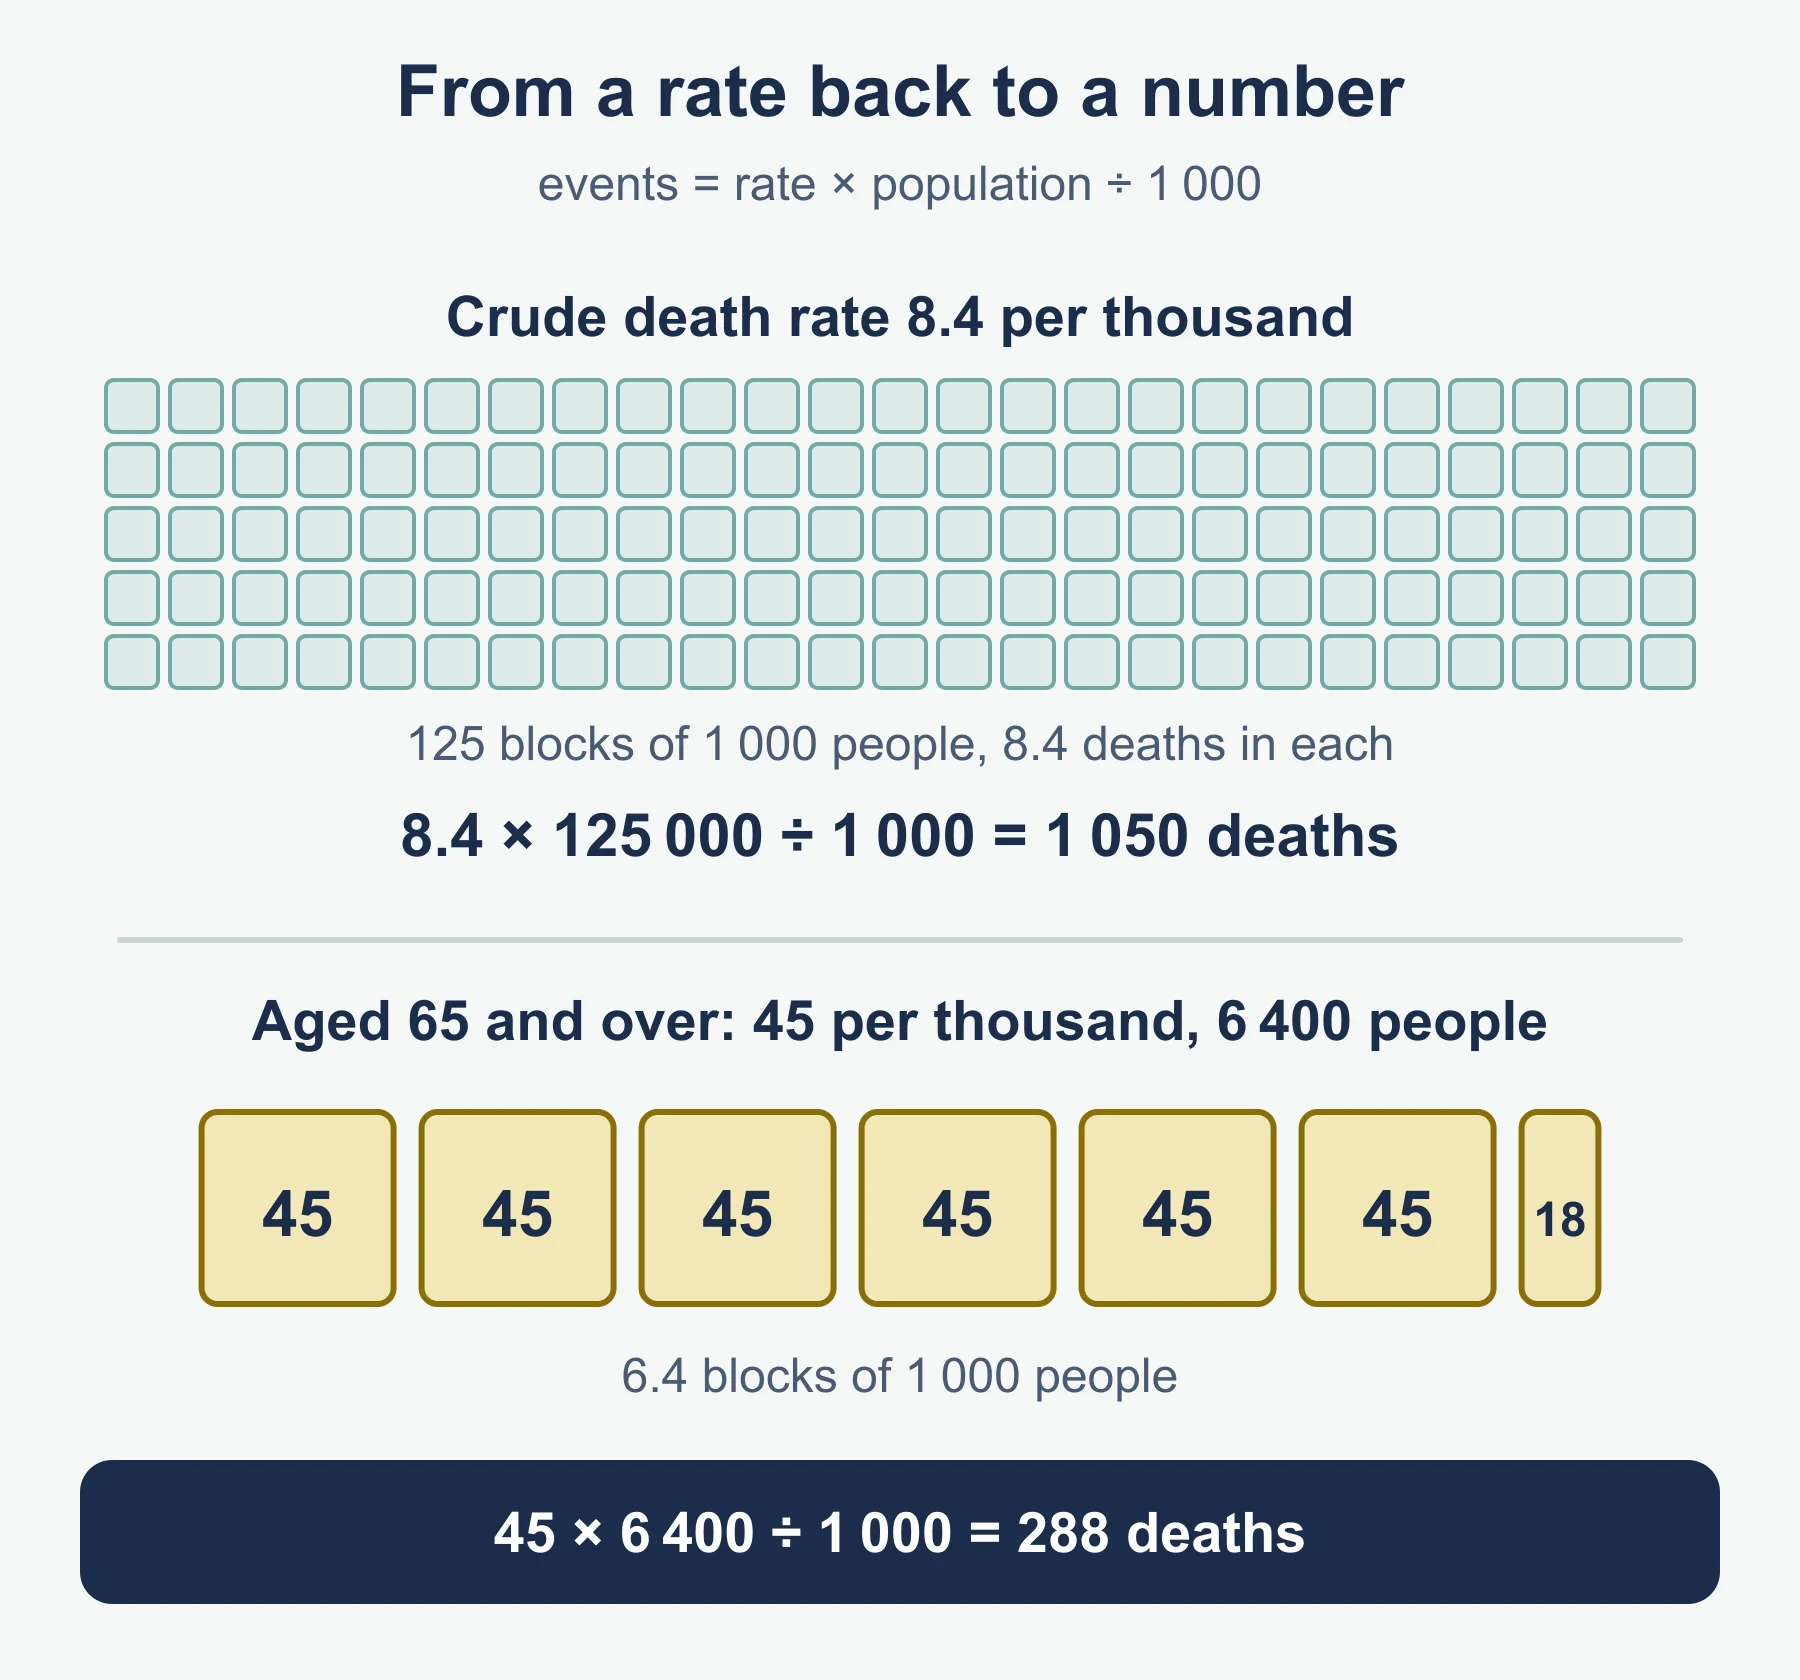
Rearrange the crude rate formula:
number of events = rate × population ÷ 1000
This works for the whole population (using the crude rate) or for a subgroup (using the rate for that subgroup and the subgroup’s size).
- Crude birth rate 14.2 per thousand, population 310 000: births = 14.2 × 310 000 ÷ 1000 = 4 402.
- Death rate 3.5 per thousand for a group of 48 000 people: deaths = 3.5 × 48 000 ÷ 1000 = 168.
Must-know distinctions
| Idea | Crude rate | Standardised rate |
|---|---|---|
| Uses | the population’s own total events and total size | the population’s group rates and a standard population’s group sizes |
| Affected by age structure? | Yes | No, the structure is fixed by the standard |
| Tells you | the overall level of events in that population | how populations compare on an equal footing |
| Needs a standard population? | No | Yes, given in the question |
Quick self-test
Give rates per thousand unless told otherwise.
- A country has 460 000 people and 4 140 deaths in a year. Find the crude death rate.
- A region has 26 000 women aged 15 to 49 and 1 560 births to women in that range. Find the fertility rate per thousand women.
- A firm has 900 workers and 33 accidents. Find the accident rate per thousand workers, to 1 decimal place.
- A city has a crude birth rate of 12.5 per thousand and 240 000 people. How many births?
- Among residents of 65 or more, the death rate is 38 per thousand, and this group has 9 500 people. How many deaths are expected?
- State why a crude death rate can give a misleading comparison between two towns.
- A standard population is 40% under 50 and 60% aged 50 and over. A town has death rates of 4 and 10 per thousand in these groups. Find its standardised death rate.
- A standard population has 7 000 children and 3 000 adults. A town’s accident rates are 5 per thousand for children and 12 per thousand for adults. Find the standardised accident rate.
- Town X has crude and standardised death rates of 11.2 and 8.4. Town Y has 9.8 and 9.1. Which town has the older population, and which has the higher death rate once age is allowed for?
- A district of 75 000 people has a crude death rate of 9.6 per thousand. How many deaths?
- In question 7, what would you get by taking the plain mean of 4 and 10, and why is it wrong?
Answers
- 4 140 ÷ 460 000 × 1000 = 9.0
- 1 560 ÷ 26 000 × 1000 = 60.0 per thousand women
- 33 ÷ 900 × 1000 = 36.7
- 12.5 × 240 000 ÷ 1000 = 3 000 births
- 38 × 9 500 ÷ 1000 = 361 deaths
- Death rates depend on age, and two towns can have different proportions of older people. The crude rate reflects that make-up as well as the risk of dying in each age group.
- (40 × 4 + 60 × 10) ÷ 100 = (160 + 600) ÷ 100 = 7.6
- (7 000 × 5 + 3 000 × 12) ÷ 10 000 = (35 000 + 36 000) ÷ 10 000 = 7.1
- Town X has the older population, because its crude rate is much higher than its standardised rate. Town Y has the higher standardised rate (9.1 against 8.4), so Y has the higher death rate once age is allowed for.
- 9.6 × 75 000 ÷ 1000 = 720 deaths
- (4 + 10) ÷ 2 = 7.0. It treats both groups as equally common. The standard population has more people in the 50 and over group, so the correct weighted answer, 7.6, is higher.
Where marks are usually lost
- Dividing by the whole population when the rate is for one subgroup, or the reverse.
- Taking a plain mean of the group rates instead of a weighted mean.
- Weighting by the town’s own population sizes instead of the standard population.
- Leaving out the division by the total standard population (or by 100 for percentages).
- Forgetting the unit. Say “per thousand” and, for fertility, “per thousand women”.
- Giving a conclusion without naming the cause of any disagreement between crude and standardised rates, such as a larger share of older people.
- Writing that a higher rate means a larger number of events. Check population size before claiming that.
Frequently asked questions
What is a crude birth rate? A crude birth rate is the number of births divided by the total population, multiplied by 1000, so it is a rate per thousand people. In the 0479 syllabus, rates will be defined in the question, so use the definition given.
How is a fertility rate different from a crude birth rate? A fertility rate is normally based on the number of women in a stated age range, not the whole population, so its unit is per thousand women. The question will define the age range.
Why is a plain mean of group rates wrong for a standardised rate? A plain mean treats every group as equally common. A standardised rate is a weighted average that uses the standard population’s group sizes as the weights.
Does a higher death rate mean more deaths? Not necessarily. Rates and totals answer different questions, so check the population size before claiming that a population with a higher rate has more events.
Where are crude and standardised rates in the Cambridge syllabuses? They are topic 7 of Cambridge O Level Statistics 4040 for examination in 2025, 2026 and 2027, and topic 9 of Cambridge IGCSE Statistics 0479 for 2027.
Official syllabus
Cambridge O Level Statistics 4040, syllabus for examination in 2025, 2026 and 2027, topic 7: Crude and standardised rates, and their appropriate use (Cambridge University Press & Assessment). Cambridge IGCSE Statistics 0479, syllabus for 2027, topic 9: Crude and standardised rates.
Get free revision emails (optional)
Occasional emails with practice questions, worked explanations and links to free resources for the qualification and subjects you choose. No spam, and you can unsubscribe from any email. The free tools on this site never need an email.
Related resources
-
Study guides
Index Numbers: O Level Statistics 4040 and IGCSE 0479 Study Guide
Price relatives and weighted aggregate index numbers with base-year weights, interpretation and limitations: Cambridge O Level Statistics 4040 and IGCSE 0479.
Statistics · Cambridge · O Level, IGCSE
Read guide -
Practice questions
Index Numbers: O Level Statistics 4040 and IGCSE 0479 Practice Questions
Practice questions with worked answers on price relatives and weighted aggregate index numbers: O Level Statistics 4040 Topic 8 and IGCSE 0479 Topic 10.
Statistics · Cambridge · O Level, IGCSE
Try questions -
Revision notes
Index Numbers: O Level Statistics 4040 and IGCSE 0479 – Revision Notes
Revision notes on price relatives, weighted aggregate index numbers, interpretation and limitations for Cambridge O Level Statistics 4040 and IGCSE 0479.
Statistics · Cambridge · O Level, IGCSE
Revise topic
Related articles
-
teaching
A Level tuition in Dubai: Cambridge or Pearson Edexcel International A Level?
Schools in Dubai and Abu Dhabi teach either Cambridge International AS & A Level or Pearson Edexcel International A Level. How the two are structured, why it matters for tuition, and how online classes from Lahore work.
9 October 2026
-
curriculum guides
Choosing subjects at IGCSE and A Level
How subject choices at 14 and 16 affect university options later, and how to keep pathways open without overloading a timetable.
28 July 2026
Studying this with a teacher
Working through Statistics O LEVELS, IGCSE?
This page is free and stays free. If you would rather be taught it, Marlbridge runs Statistics classes one-to-one and in small groups of up to 15, online in your own time zone. The first trial class is free. WhatsApp replies within an hour (8am–11pm Pakistan time, every day); email the same day.
Cambridge Statistics teachers at Marlbridge