Revision Notes
Index Numbers: O Level Statistics 4040 and IGCSE 0479 – Revision Notes
Revision notes on price relatives, weighted aggregate index numbers, interpretation and limitations for Cambridge O Level Statistics 4040 and IGCSE 0479.
- Subject
- Statistics
- Level
- O LEVELS, IGCSE
- Topic
- Index numbers
- Author
- Marlbridge Academic Team
- Updated
- Reviewed by
- Muhammad Ghazali Siddiqui (what this means)
Aligned to Cambridge O Level IGCSE Statistics (4040, 0479), 2025-2027. Official specification (O Level) ; Official specification (IGCSE) .
Syllabus page (what it covers and how it is assessed): Cambridge O Level Statistics; Cambridge IGCSE Statistics.
Syllabus points this page covers
4040
- 8 Index numbers (whole topic)
0479
- 10 Index numbers (whole topic)
Found an error? Report a correction.
Want a teacher for this? Marlbridge teaches Statistics online. Request a free trial class.
These revision notes condense index numbers: Topic 8 of the Cambridge O Level Statistics 4040 syllabus for examination in 2025, 2026 and 2027, and the matching content in Topic 10 of Cambridge IGCSE Statistics 0479. The 4040 text lists price relatives, weighted aggregate index numbers, and their use and limitations. The 0479 learning outcomes spell the same content out in more detail, so these notes follow them. For full explanations, start with the index numbers study guide. When you are ready to test yourself, use the index numbers practice questions.
Useful links: the O Level Statistics 4040 hub, the IGCSE Statistics 0479 hub, the printable checklist and the free 10-minute diagnostics.
What you must be able to do
| Outcome | One-line summary |
|---|---|
| Calculate a price relative | Price now divided by base-year price, times 100 |
| Understand what a price relative means | 100 means no change; the gap from 100 is the percentage change |
| Calculate a weighted aggregate index number | Sum of (weight x price relative) divided by sum of weights |
| Find weights when they are not given | Base-year price x base-year quantity (base-year expenditure) |
| Interpret and use an index number | Average weighted price change since the base year |
| Know the limitations | Weights age as consumption changes; the index is an average of a fixed basket |
1. Key terms
- Base year: the year used for comparison. Every price relative for the base year is 100.
- Given year (current year): the year you are measuring.
- Price relative: the price of one item in the given year, as a number where the base-year price is 100.
- Weight: a number showing how much importance an item has in the index.
- Weighted aggregate index number: one figure that summarises the price change of several items, using weights.
2. Formulas
| Quantity | Formula |
|---|---|
| Price relative | (price in given year / price in base year) x 100 |
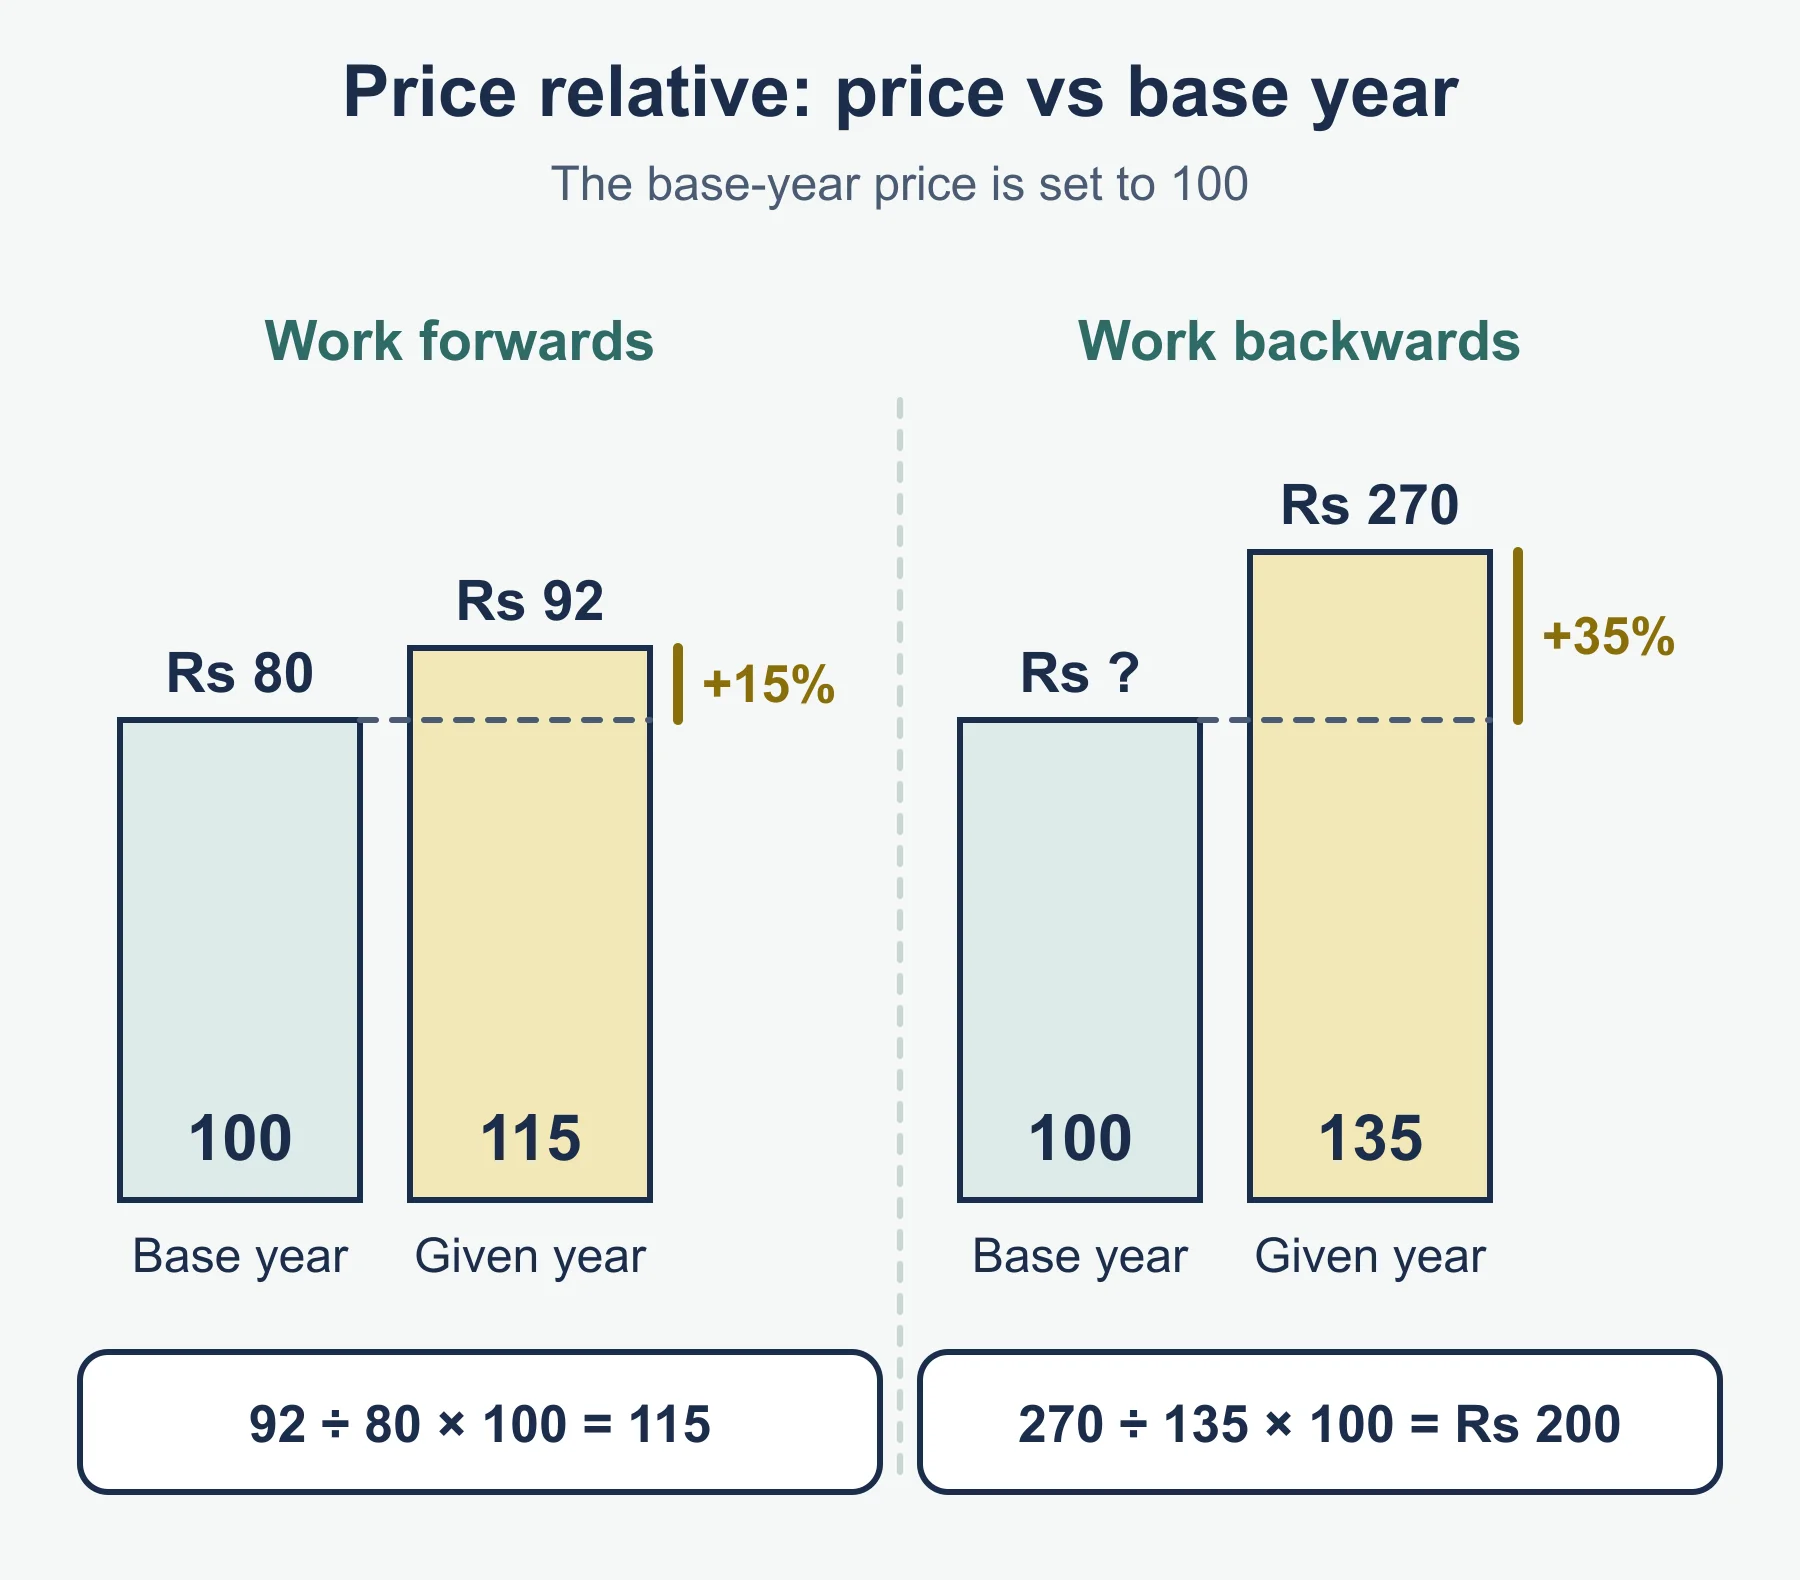
| Base-year price from a relative | (given-year price / price relative) x 100 |
| Given-year price from a relative | (price relative / 100) x base-year price |
| Weight from base-year expenditure | base-year price x base-year quantity |
| Weighted aggregate index | Sum of (weight x price relative) / sum of weights |
| Percentage change in the index | (new index - old index) / old index x 100 |
The weighted aggregate formula is a weighted mean. If you can calculate a mean from a frequency table, you can calculate this: the weights play the part of frequencies and the price relatives play the part of the values.
3. Method in steps
Price relative
- Identify the base year and the given year.
- Divide the given-year price by the base-year price.
- Multiply by 100.
- Check the direction. A price that rose must give a figure above 100.
Weighted aggregate index with weights given
- Write each price relative next to its weight.
- Multiply each weight by its price relative and add the products.
- Add the weights.
- Divide the first total by the second.
Weighted aggregate index with weights to be calculated
- Work out each price relative.
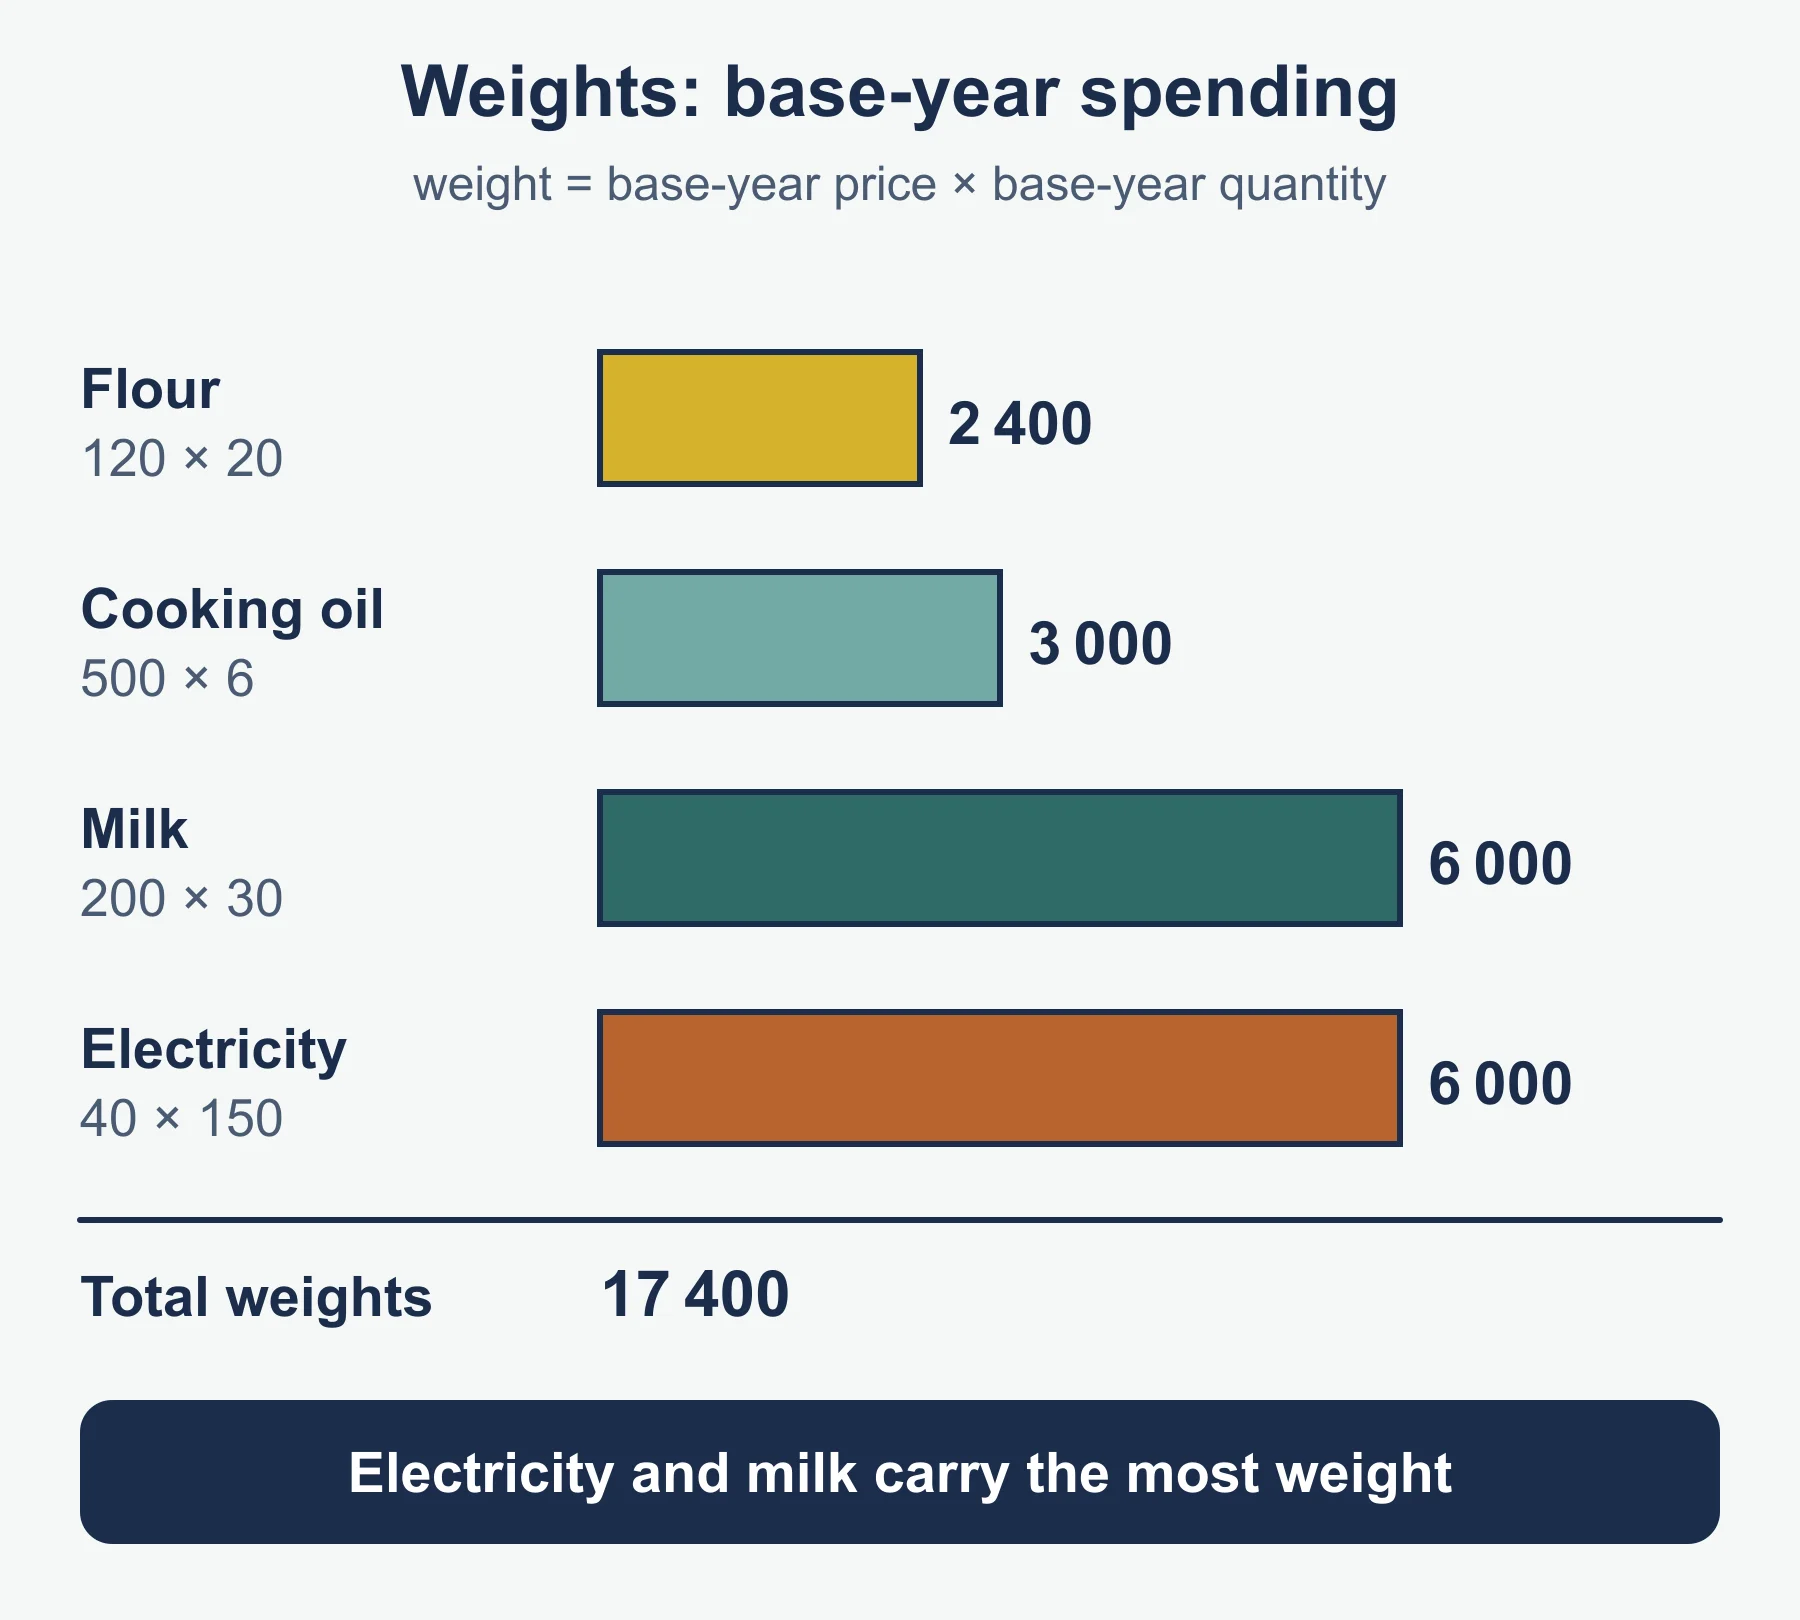
- Work out each weight as base-year price x base-year quantity.
- Carry on as above.
4. Worked reminder (weights calculated)
A small farm tracks four inputs. The base year is 2022. Prices are in rupees.
| Input | Price 2022 | Price 2025 | Quantity bought in 2022 |
|---|---|---|---|
| Seed (kg) | 90 | 117 | 50 |
| Fertiliser (bag) | 1 800 | 2 070 | 10 |
| Diesel (litre) | 150 | 177 | 80 |
| Pesticide (bottle) | 600 | 720 | 5 |
Price relatives (2022 = 100):
- Seed: 117 / 90 x 100 = 130
- Fertiliser: 2 070 / 1 800 x 100 = 115
- Diesel: 177 / 150 x 100 = 118
- Pesticide: 720 / 600 x 100 = 120
Weights (base-year expenditure):
- Seed: 90 x 50 = 4 500
- Fertiliser: 1 800 x 10 = 18 000
- Diesel: 150 x 80 = 12 000
- Pesticide: 600 x 5 = 3 000
- Sum of weights = 37 500
Index: (4 500 x 130 + 18 000 x 115 + 12 000 x 118 + 3 000 x 120) / 37 500 = (585 000 + 2 070 000 + 1 416 000 + 360 000) / 37 500 = 4 431 000 / 37 500 = 118.16, so 118.2 to 1 decimal place.
Meaning: on average, weighted by 2022 spending, the farm’s input costs in 2025 were about 18.2% higher than in 2022. Seed has the largest price relative, but its weight is small, so fertiliser and diesel pull the index more.
Quick check: the plain average of the four relatives is 120.75. That is higher than 118.16 because the heaviest-weighted items (fertiliser and diesel) have lower relatives than seed and pesticide. A weighted answer that lands between the lowest and highest relatives (115 and 130) is plausible. One outside that range is wrong.
5. Reading price relatives and indices
- Above 100: prices have risen. A relative of 108 means 8% higher than in the base year.
- Below 100: prices have fallen. A relative of 85 means 15% lower.
- Exactly 100: no change.
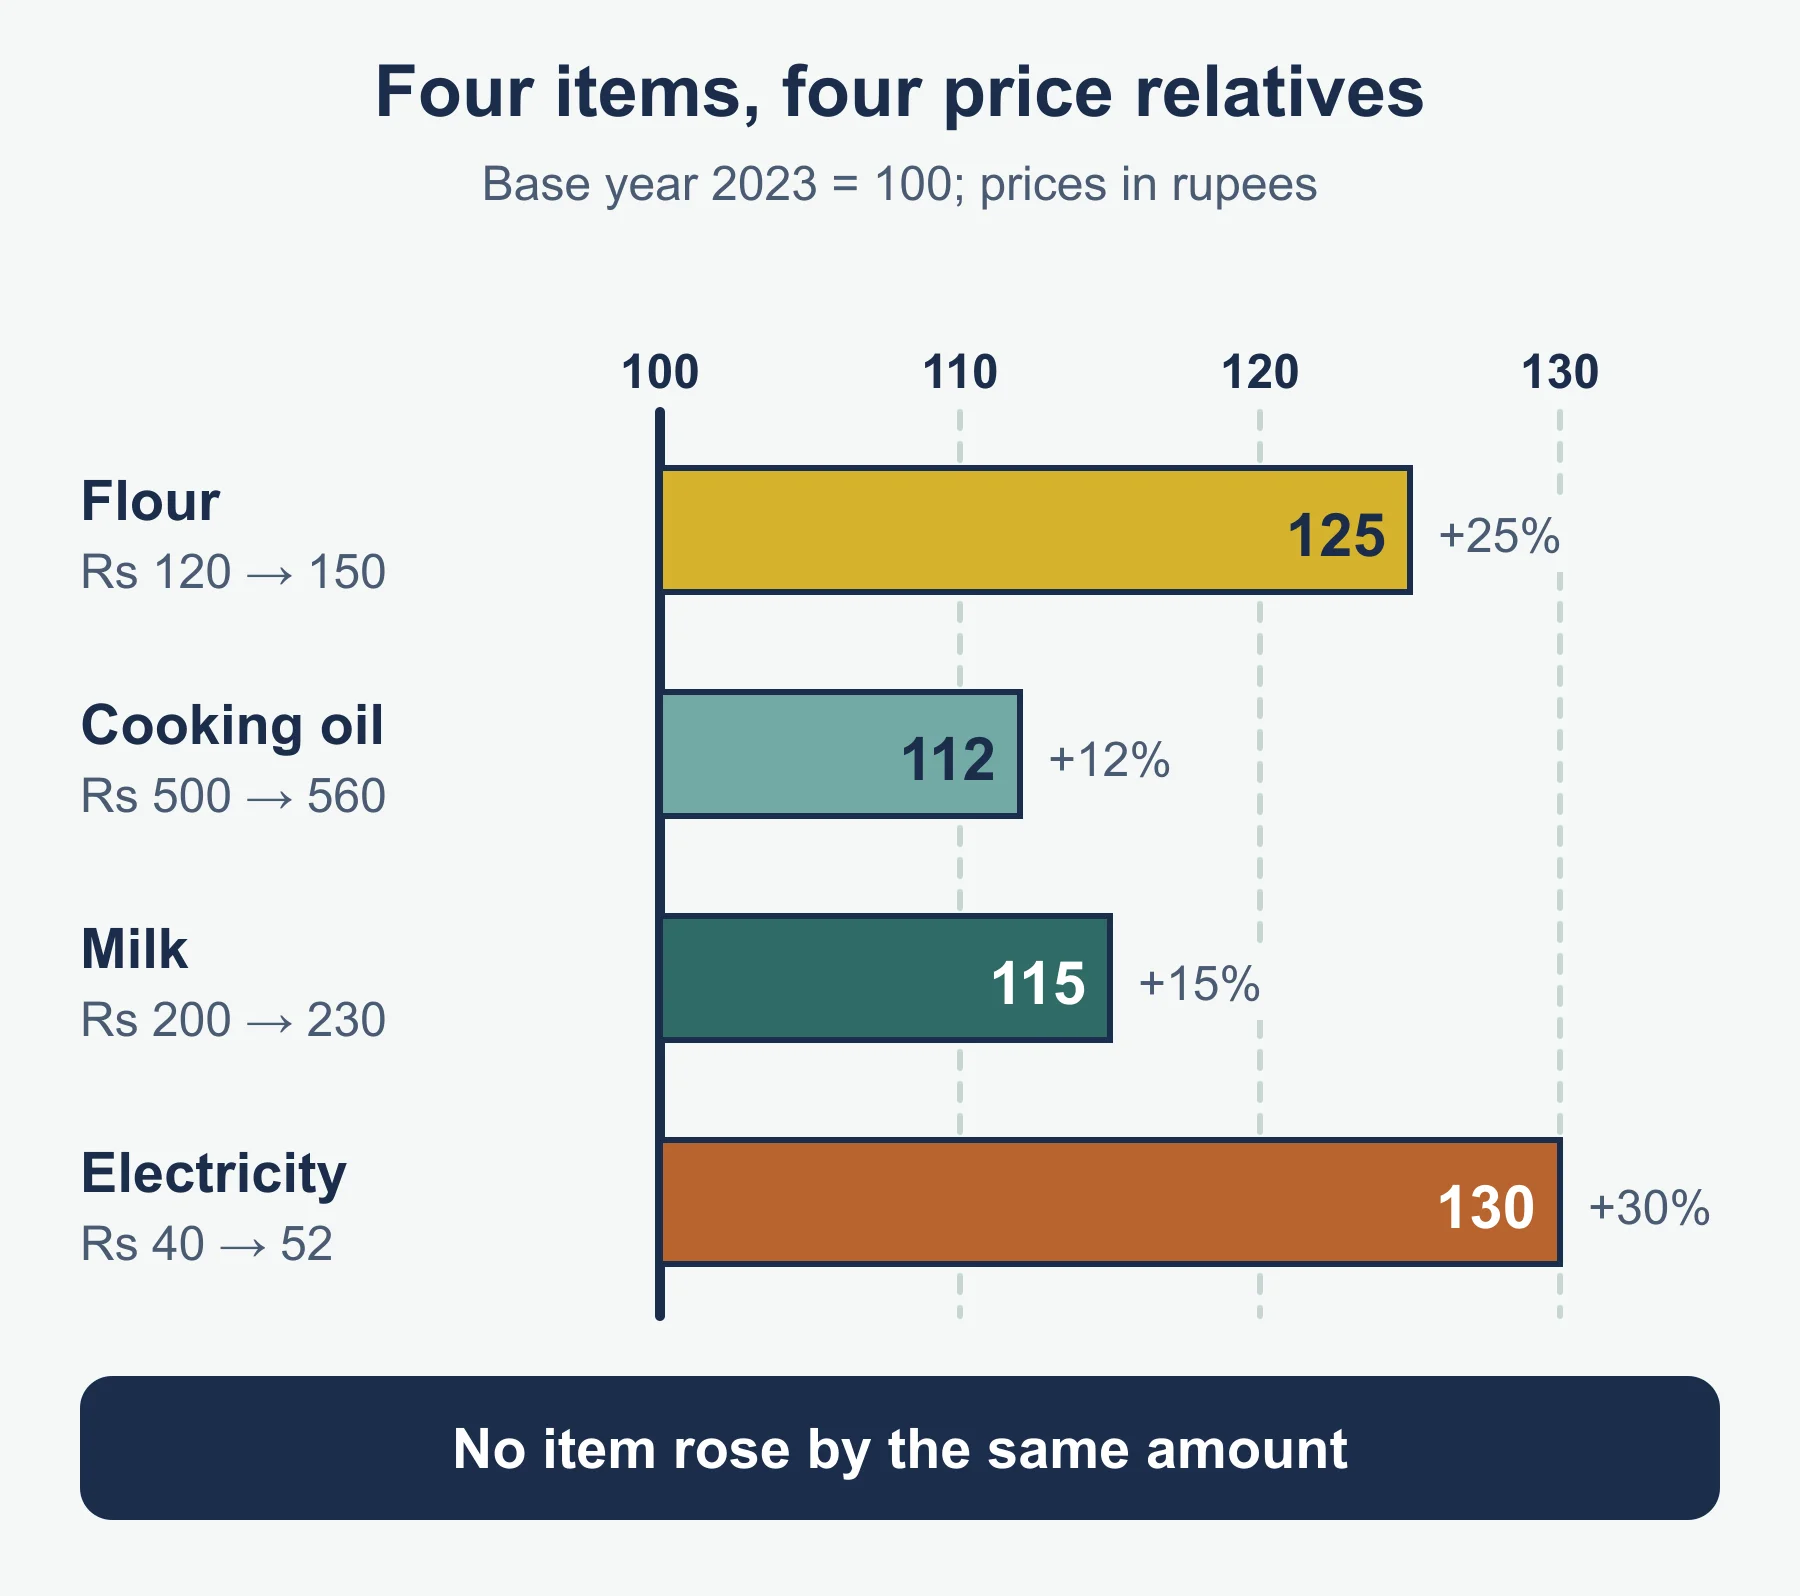
- An index describes the average change. It does not mean every item changed by that amount.
- Comparing two later years: use the percentage change formula, not the difference in index points. Index points of 108 and 118.8 differ by 10.8 points, but the rise between them is 10.8 / 108 x 100 = 10%.
6. Limitations (always link them to the data)
- Weights go out of date. They come from base-year spending. If people change what they buy, the weights no longer match real spending. This is the effect of changes in consumption that the 0479 outcomes name.
- Substitution. When an item becomes dear, buyers often switch to a cheaper one. A fixed-weight index keeps counting the old quantity, so it can overstate the true rise in costs.
- Limited basket. New items, and items left out, are not in the index.
- An average hides differences. A household or business with a different spending pattern may face a much bigger or smaller change than the index shows.
A good limitation answer names a specific item. Compare “the weights may be out of date” with “the farm now buys less diesel, so diesel’s weight of 12 000 is too high”.
7. Must-know distinctions
| Often confused | Difference |
|---|---|
| Price relative and index number | A price relative is for one item. A weighted aggregate index combines several items. |
| Weight and quantity | A weight is usually base-year expenditure (price x quantity), not the quantity alone. |
| Dividing by the number of items and dividing by the sum of weights | A weighted average divides by the sum of weights. |
| 118.2 and 118.2% rise | An index of 118.2 means a rise of 18.2%. |
| Index points and percentage points | The percentage change between two later years needs a division by the earlier index. |
Quick self-test
- The price of a kilogram of rice was Rs 160 in the base year and is Rs 184 now. Find the price relative.
- A fabric cost Rs 480 per metre in the base year and costs Rs 408 now. Find the price relative and say what it shows.
- The price relative for a school bag is 125 and it now costs Rs 750. Find its base-year price.
- What does a price relative of 108 tell you?
- A transport index uses three items. Their weights are 40, 35 and 25 and their price relatives are 112, 105 and 130. Calculate the weighted aggregate index to 1 decimal place.
- A tuition centre records three items. Base-year prices are Rs 20, Rs 45 and Rs 10 per unit, and base-year quantities are 30, 12 and 60. Current prices are Rs 23, Rs 54 and Rs 11. Calculate the weighted aggregate index to 1 decimal place.
- Interpret your answer to question 6 in a sentence.
- An index was 108 last year and is 118.8 this year. Find the percentage increase.
- In question 6, a student takes the plain average of the three price relatives and gets 115. Explain why this is not the weighted index.
- Give one limitation of the index in question 6 if the centre now buys far fewer units of the second item.
Answers
- 184 / 160 x 100 = 115.
- 408 / 480 x 100 = 85. The price has fallen by 15% since the base year.
- 750 / 125 x 100 = Rs 600.
- The price is 8% higher than in the base year.
- (40 x 112 + 35 x 105 + 25 x 130) / 100 = (4 480 + 3 675 + 3 250) / 100 = 11 405 / 100 = 114.05, so 114.1 to 1 decimal place.
- Relatives: 23 / 20 x 100 = 115; 54 / 45 x 100 = 120; 11 / 10 x 100 = 110. Weights: 20 x 30 = 600; 45 x 12 = 540; 10 x 60 = 600; sum 1 740. Index = (600 x 115 + 540 x 120 + 600 x 110) / 1 740 = (69 000 + 64 800 + 66 000) / 1 740 = 199 800 / 1 740 = 114.83, so 114.8.
- On average, weighted by base-year spending, the centre’s costs are about 14.8% higher than in the base year.
- (118.8 - 108) / 108 x 100 = 10%.
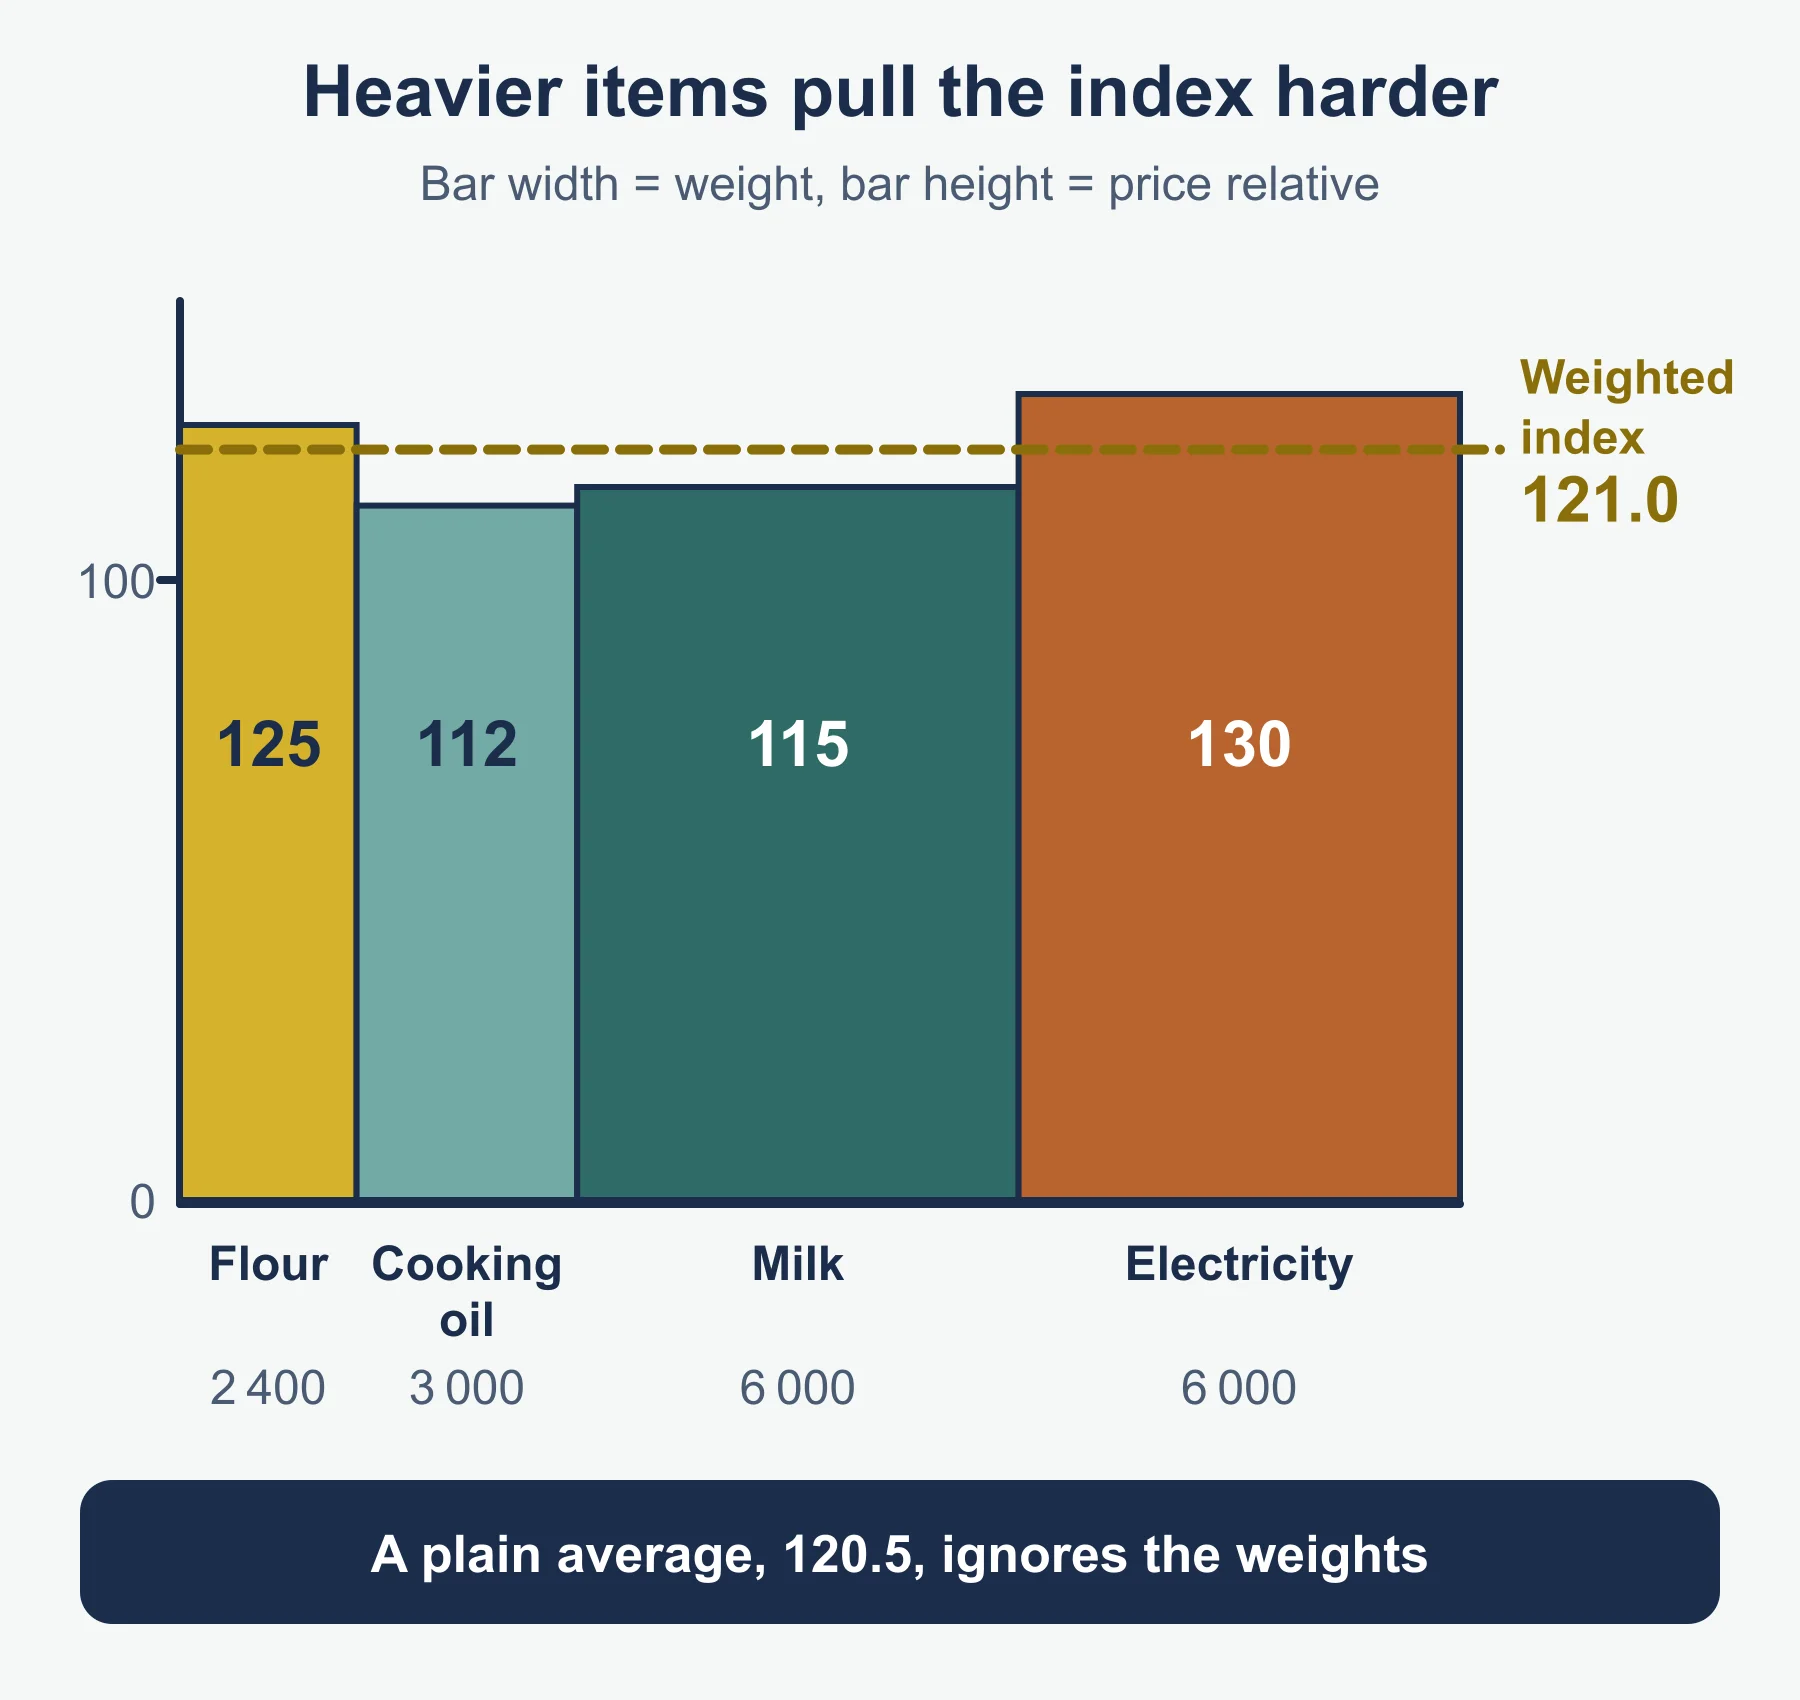
- A plain average gives every item the same importance. The weights are 600, 540 and 600, so the second item counts for less than the other two, and the weighted index (114.8) is slightly below 115.
- The weight of the second item (540) is now too large, so the index puts too much importance on a price the centre hardly pays.
Where marks are usually lost
- Writing the division the wrong way up, so a price rise gives a relative below 100.
- Using plain quantities as weights when the question points to base-year expenditure.
- Dividing the weighted total by the number of items rather than by the sum of the weights.
- Reading an index of 118.2 as a 118.2% rise rather than 18.2%.
- Taking the difference in index points as the percentage change between two later years.
- Forgetting to multiply by 100, and giving 1.15 where 115 is needed.
- Giving limitations in general terms with no link to the items in the question.
- Rounding too early: keep the full weighted total until the final division.
Next steps
- Work through the index numbers study guide if any step above is unclear.
- Test yourself with the index numbers practice questions.
- Another weighted average to compare: crude and standardised rates.
- Later in the syllabus: time series and moving averages.
- Check your readiness with the free 10-minute diagnostics.
Frequently asked questions
How do you find the percentage change between two index numbers? Divide the difference by the earlier index and multiply by 100. An index rising from 108 to 118.8 is a rise of 10.8 points but a 10% increase, so the difference in points is not the percentage change.
How do you find a base-year price from a price relative? Divide the given-year price by the price relative and multiply by 100. For example, a price relative of 125 and a current price of Rs 750 give a base-year price of Rs 600.
Why is a weighted aggregate index like a mean from a frequency table? It is a weighted mean: the weights play the part of the frequencies and the price relatives play the part of the values. You divide by the sum of the weights, not the number of items.
How can you check a weighted index answer is plausible? A correct weighted index lies between the lowest and highest price relatives. An answer outside that range is wrong.
Which topics cover index numbers in Cambridge O Level Statistics 4040 and IGCSE Statistics 0479? Index numbers are Topic 8 of the 4040 syllabus for examination in 2025, 2026 and 2027, and Topic 10 of the 0479 syllabus, covering price relatives, weighted aggregate index numbers and their limitations.
Official syllabus
Cambridge O Level Statistics 4040, syllabus for examination in 2025, 2026 and 2027, Topic 8 (Cambridge University Press and Assessment), and Cambridge IGCSE Statistics 0479, Topic 10 learning outcomes on index numbers.
Get free revision emails (optional)
Occasional emails with practice questions, worked explanations and links to free resources for the qualification and subjects you choose. No spam, and you can unsubscribe from any email. The free tools on this site never need an email.
Related resources
-
Study guides
Time Series, Moving Averages and Seasonal Variation: O Level Statistics 4040 and IGCSE 0479 Study Guide
Time series graphs, centred moving averages, trend lines, seasonal components and predictions: Cambridge O Level Statistics 4040 and IGCSE 0479 study guide.
Statistics · Cambridge · O Level, IGCSE
Read guide -
Practice questions
Time Series and Moving Averages: O Level Statistics 4040 and IGCSE 0479 Practice Questions
Practice questions with worked answers on moving averages, trend lines and seasonal components: O Level Statistics 4040 Topic 10 and IGCSE 0479 Topic 12.
Statistics · Cambridge · O Level, IGCSE
Try questions -
Revision notes
Time Series and Moving Averages: O Level Statistics 4040 and IGCSE 0479 Revision Notes
Condensed notes on trend, moving averages with centring, mean seasonal variation and prediction for Cambridge O Level Statistics 4040 and IGCSE 0479.
Statistics · Cambridge · O Level, IGCSE
Revise topic
Related articles
-
teaching
A Level tuition in Dubai: Cambridge or Pearson Edexcel International A Level?
Schools in Dubai and Abu Dhabi teach either Cambridge International AS & A Level or Pearson Edexcel International A Level. How the two are structured, why it matters for tuition, and how online classes from Lahore work.
9 October 2026
-
curriculum guides
Choosing subjects at IGCSE and A Level
How subject choices at 14 and 16 affect university options later, and how to keep pathways open without overloading a timetable.
28 July 2026
Studying this with a teacher
Working through Statistics O LEVELS, IGCSE?
This page is free and stays free. If you would rather be taught it, Marlbridge runs Statistics classes one-to-one and in small groups of up to 15, online in your own time zone. The first trial class is free. WhatsApp replies within an hour (8am–11pm Pakistan time, every day); email the same day.
Cambridge Statistics teachers at Marlbridge