
Study Guides
OCR A Level Business: Accounting and financial considerations (H431)
Whole-topic study guide to accounting and financial considerations for OCR A Level Business H431: costs, break-even, budgets, accounts and ratios.
- Subject
- Business
- Level
- A LEVELS
- Topic
- Accounting and financial considerations
- Author
- Marlbridge Academic Team
- Updated
- Reviewed by
- Salman Ahmad (what this means)
Aligned to OCR A Level Business (H431), Version 2.1 (January 2026), for first assessment in 2017; final assessment summer 2027. Official specification .
Syllabus page (what it covers and how it is assessed): OCR A Level Business.
Syllabus points this page covers
H431
- 6 Accounting and financial considerations (whole topic)
Found an error? Report a correction.
Need help with this topic? Request a free trial class for A Level Business (H431).
This guide covers the whole of topic 6, Accounting and financial considerations, in the OCR A Level Business H431 specification (Version 2.1, January 2026; final assessment summer 2027). Companions: revision notes and the practice questions. See also measures of performance and forecasting. OCR A Level Business hub, checklist and the free 10-minute diagnostics.
Map of the topic
Sections: accounting and finance in the business environment (objectives, sources of finance, accounting concepts); management accounting (costs, break-even, investment appraisal, budgets and variances, cash-flow, working capital); financial accounting (income statements, statement of financial position, ratios); the external environment; the finance strategy.
Accounting and finance objectives
An accounting and finance objective is a measurable target for the finance function, such as a profit level, a cash-flow target, a return on capital employed (ROCE) or a gearing limit. Businesses use them to set budgets, judge managers and guide investment. Owners want return, lenders security, managers clear targets, so usefulness differs by stakeholder. To recommend objectives, link them to the business objective (survival, growth, profit) and justify them.
Sources of finance
| Source | Short-term | Long-term |
|---|---|---|
| Internal | Reducing inventory or collecting receivables faster | Retained profit; sale of non-current assets |
| External | Overdraft; trade credit; factoring | Share issue; bank loan; debentures; leasing; venture capital |
Factors affecting choice:
- Time: how long the money is needed; match long-lived assets with long-term finance.
- Legal structure: a sole trader cannot issue shares; a private limited company cannot sell shares to the public; a public limited company can.
- Quantitative factors: amount needed, interest rate, existing gearing, ability to repay.
- Qualitative factors: loss of control, attitude to risk, relationship with the lender.
- External influences: interest rates, economic conditions, availability of credit.
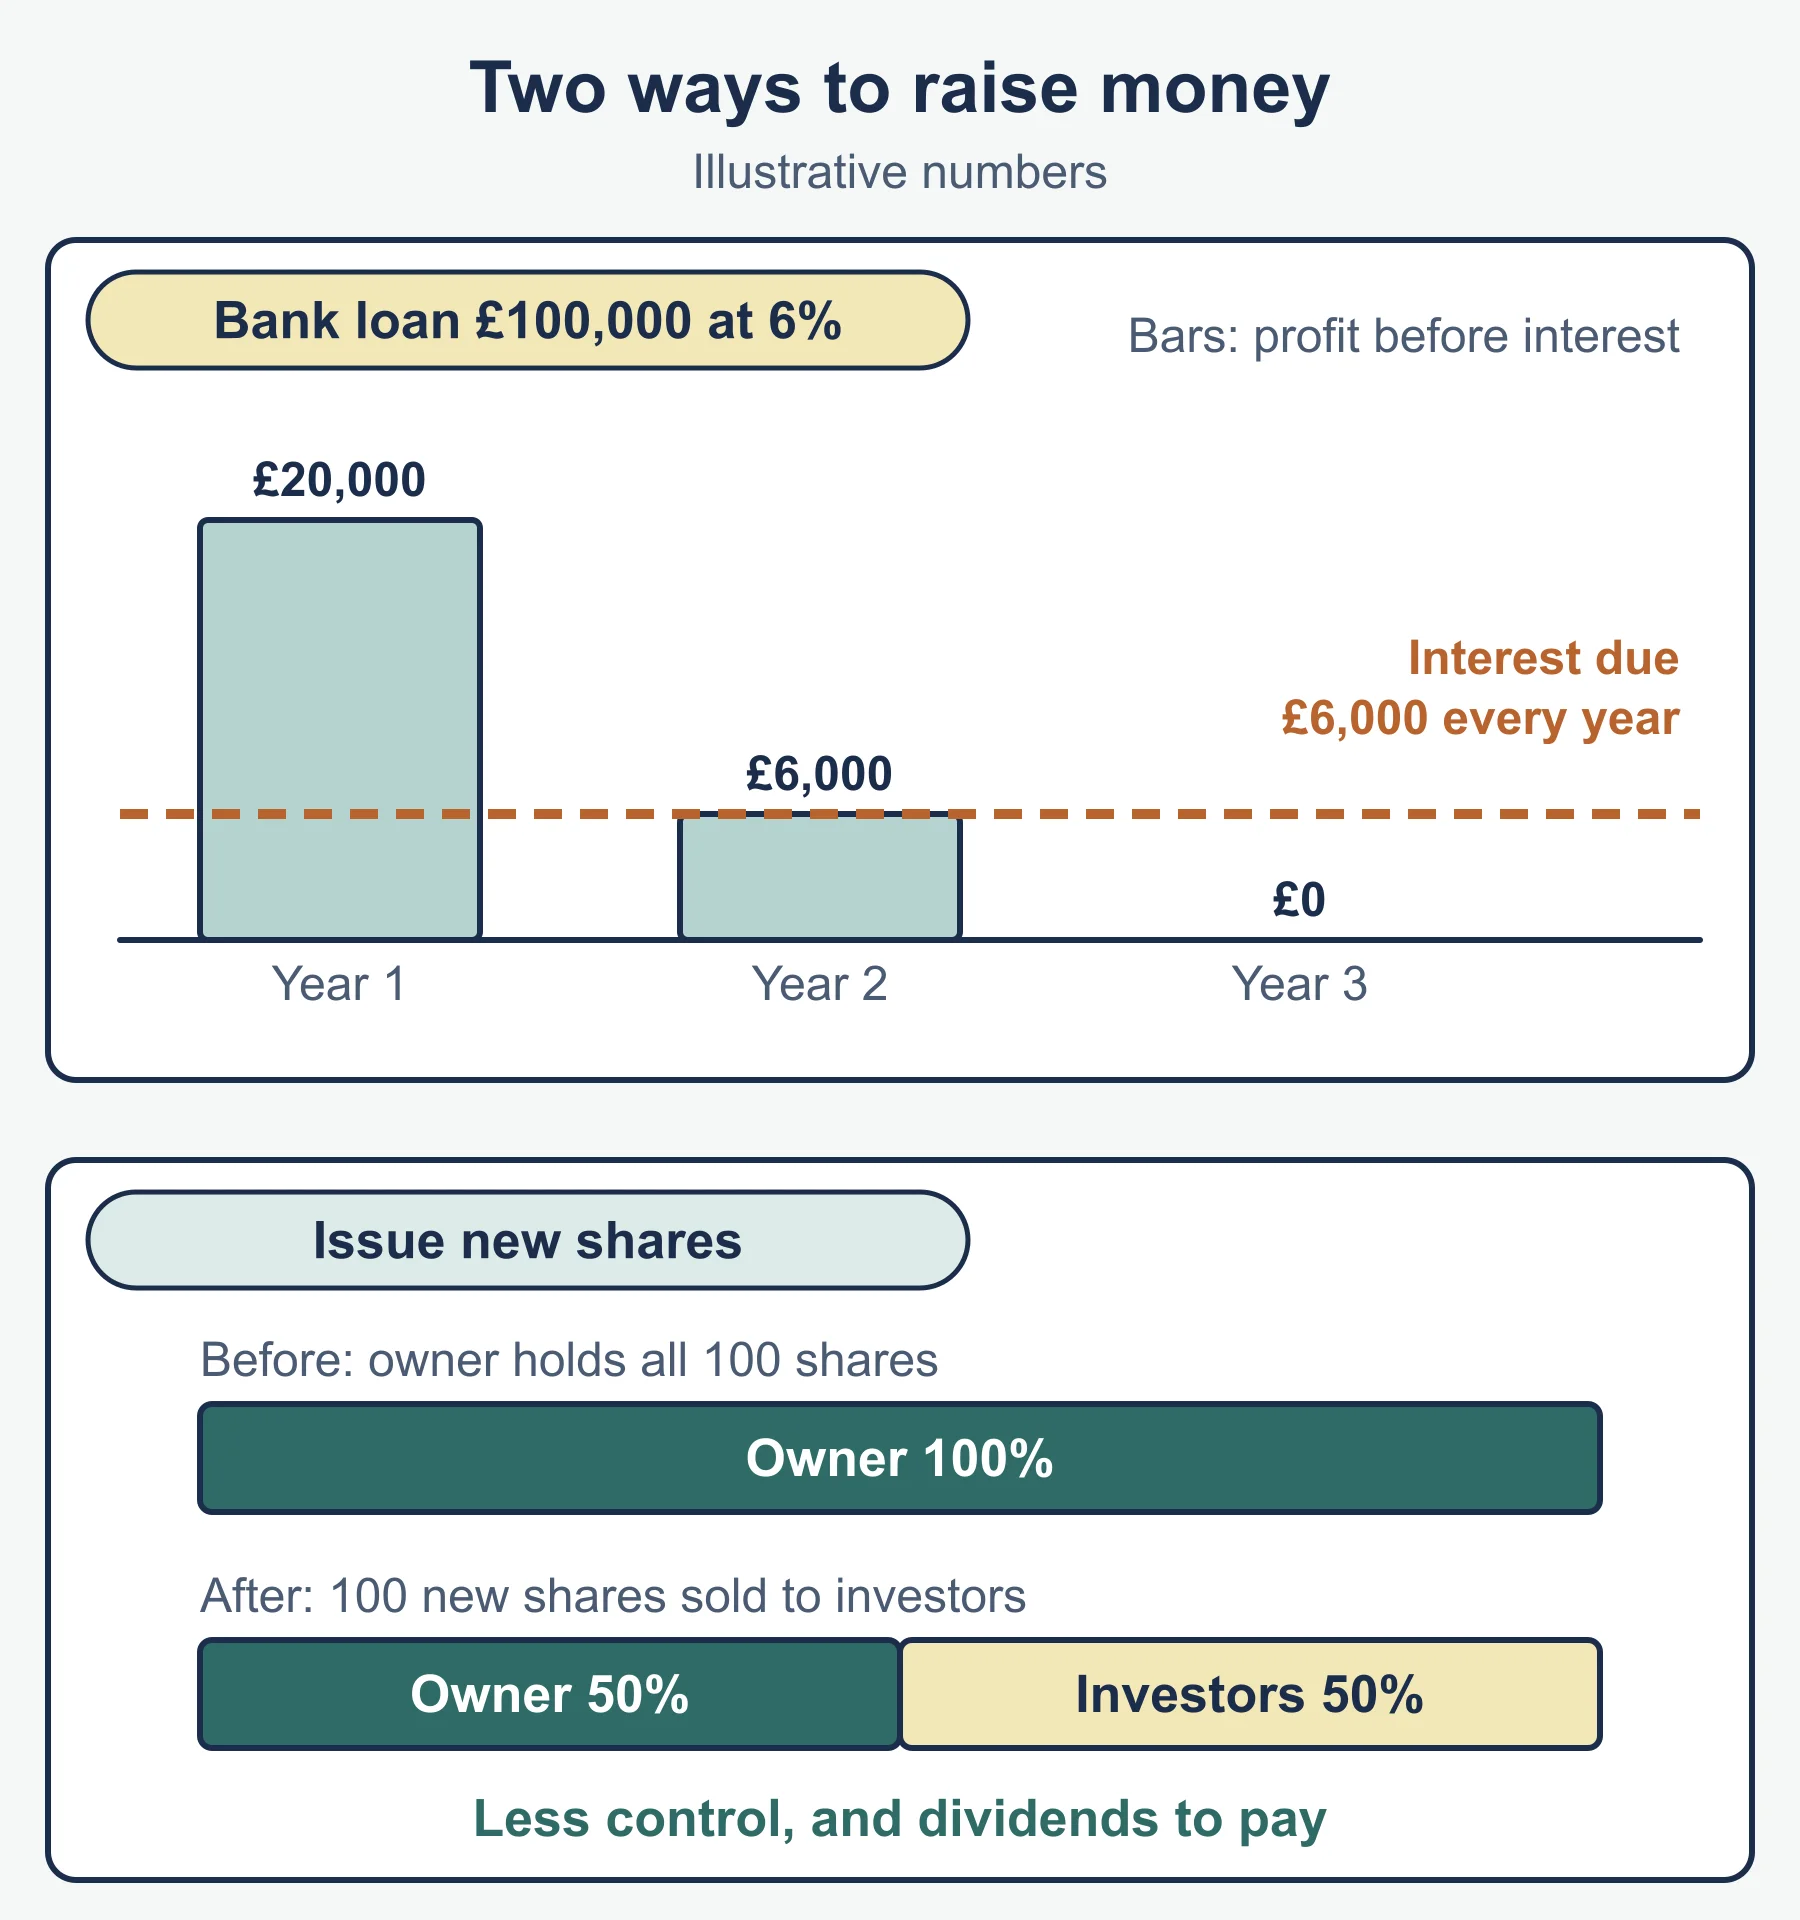
A share issue avoids interest but dilutes control. A loan keeps control but adds fixed interest and raises gearing.
Accounting concepts
- True and fair view: accounts present the business without material error or bias, so users can rely on them.
- GAAP (Generally Accepted Accounting Practice): agreed rules that make accounts comparable. Specific rules are not required.
| Convention | Meaning | Example |
|---|---|---|
| Consistency | Same methods each year | Keeping one depreciation method |
| Going concern | Assume the business continues | Assets valued for use, not break-up |
| Accruals (matching) | Match costs to the revenue they earn | December electricity bill in December |
| Materiality | Only significant items matter | Pens expensed, not shown as assets |
| Objectivity | Rely on verifiable evidence | Record cost from the invoice |
| Prudence (conservatism) | Do not overstate profit or assets | Provide for a likely bad debt |
| Realisation | Record revenue when the sale is made | Count an order on delivery |
Conventions aid comparability but involve judgement: prudence can understate value.
Costs, revenue and profit
Total cost is fixed cost plus variable cost, and average cost is total cost divided by output. Total revenue is price multiplied by quantity sold, and average revenue is total revenue divided by quantity (so it equals price). Profit is total revenue less total cost. Direct costs trace to a unit (materials); indirect costs support several units; overheads are indirect running costs (rent, admin).
Harrow Kiln Ceramics: fixed costs £24,000, variable cost £4 per mug, price £10, output 5,000.
- Total cost = 24,000 + 4 x 5,000 = £44,000; average cost = £8.80.
- Total revenue = £50,000; profit = £6,000.
Separating direct, indirect and overhead costs shows what each product must carry, which shapes price and profit; rising costs hit owners, staff and customers differently. A cost centre collects costs; a profit centre also earns revenue. This improves accountability, but managers may ignore the wider firm.
Costing methods:
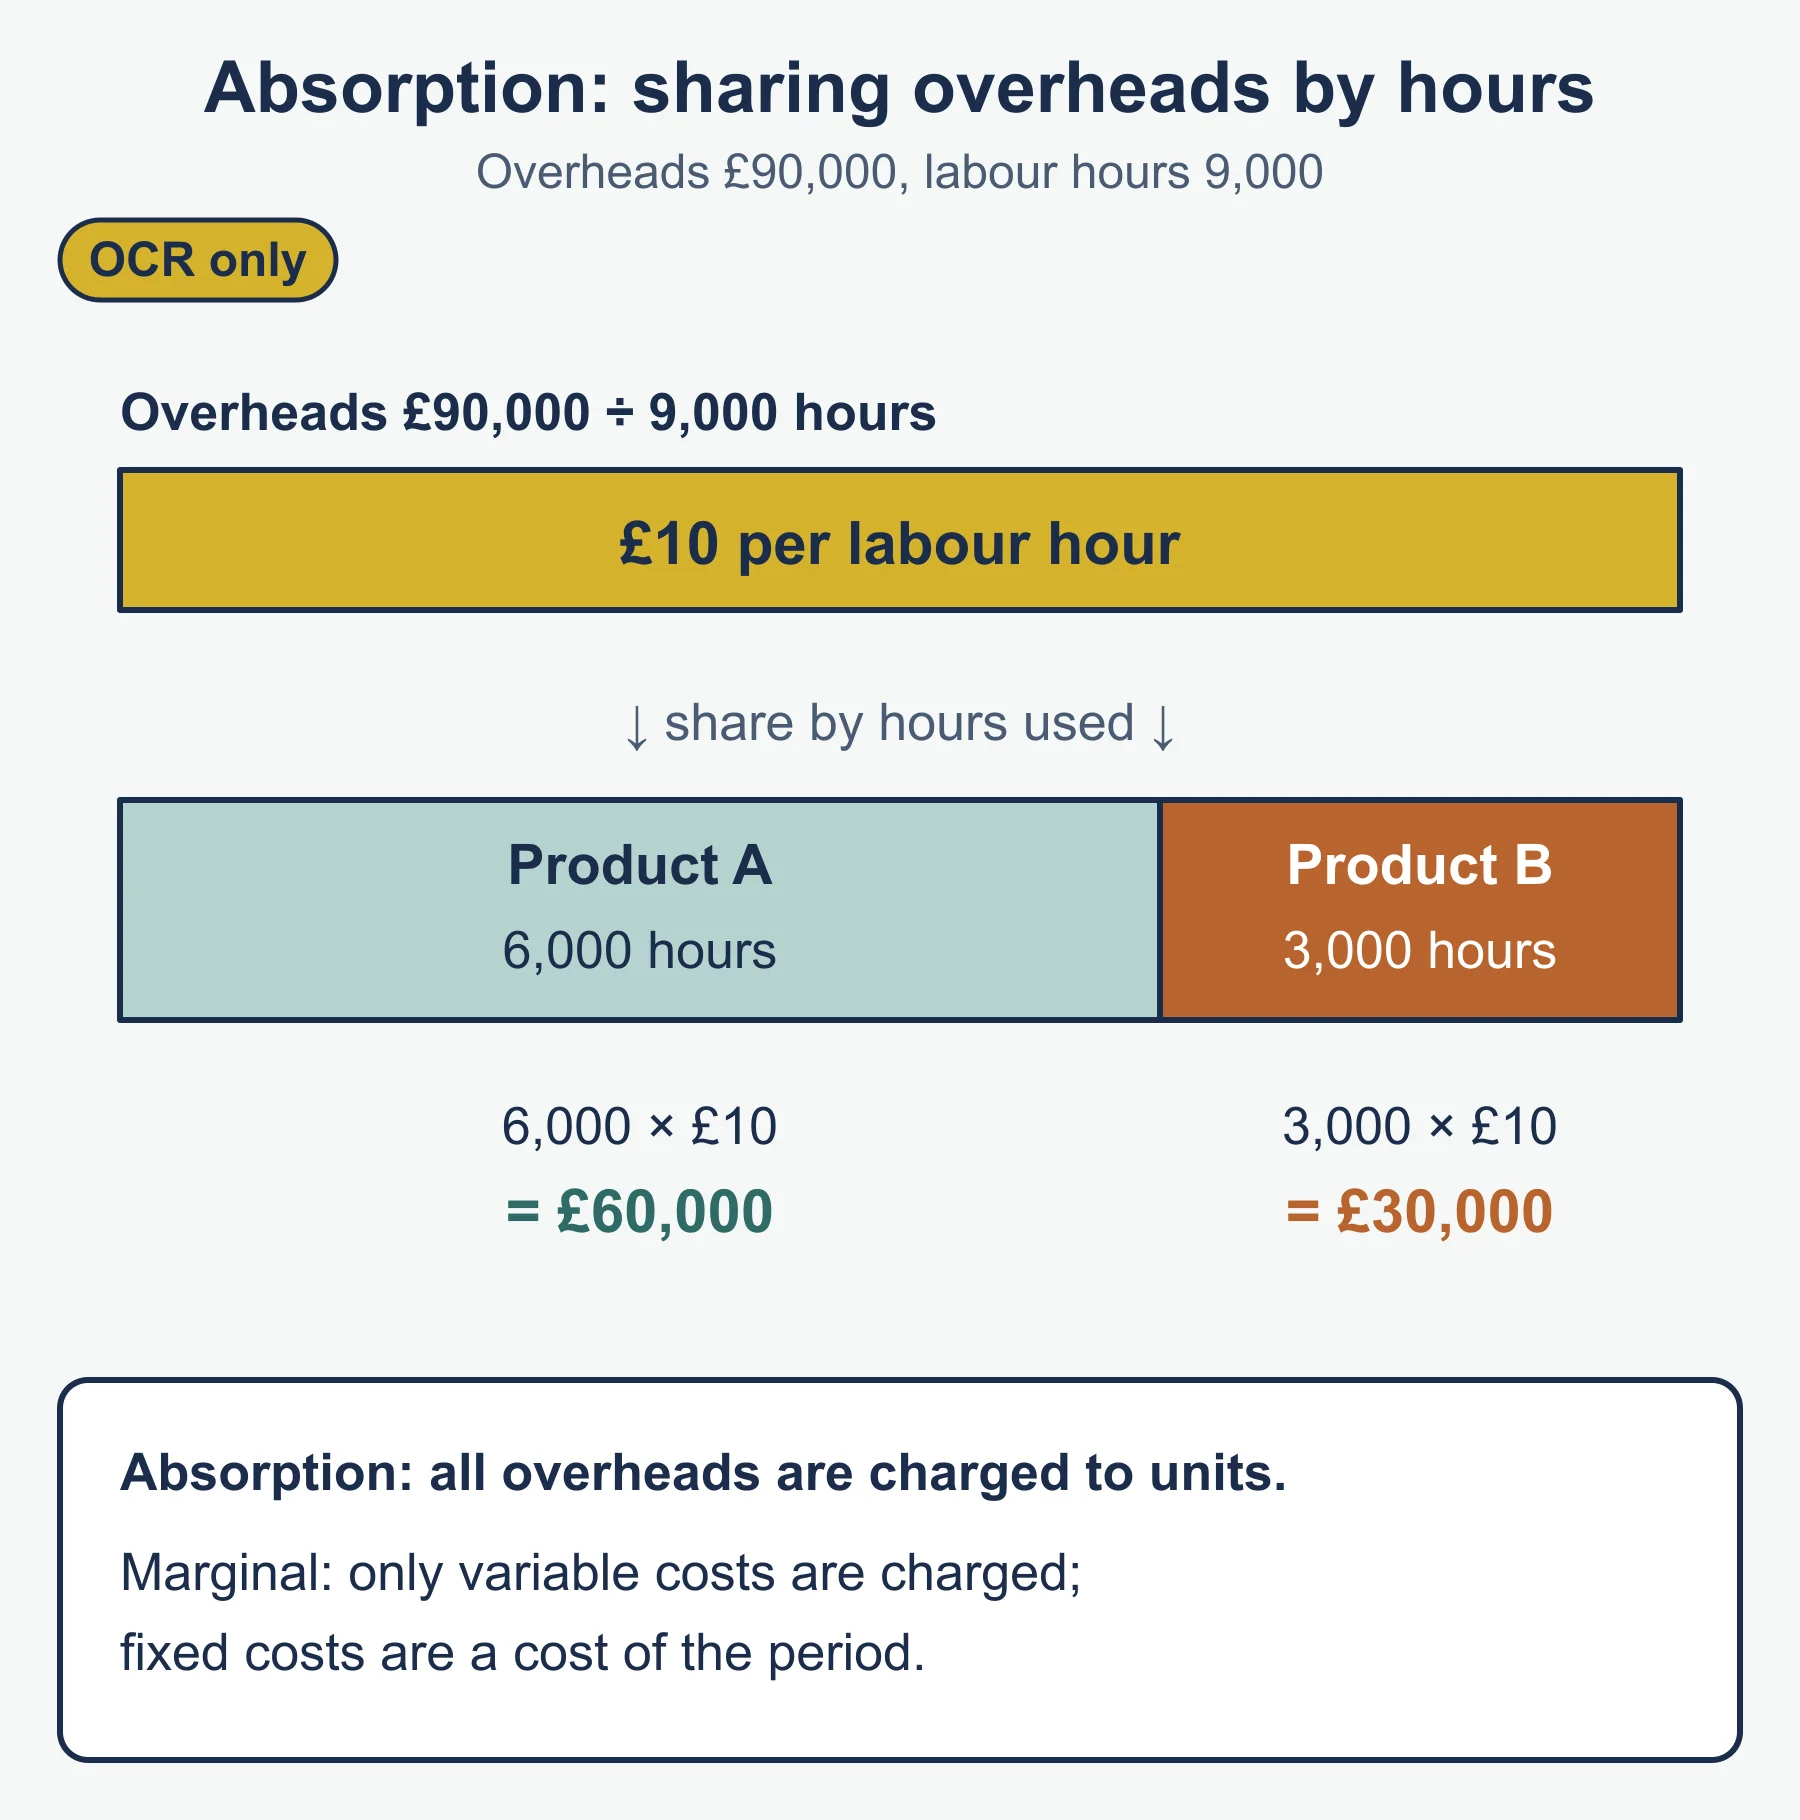
- Full costing assigns all costs to units. Absorption costing does this by adding overheads using a rate. Marginal costing assigns only variable costs to units and treats fixed costs as a period expense.
- Example: overheads £90,000 and 9,000 labour hours give £10 per hour. Product A uses 6,000 hours, so absorbs £60,000; B absorbs £30,000.
Absorption gives a full-cost price, but allocating by hours is arbitrary and can make a product look loss-making when it earns a contribution. Marginal costing suits short-term decisions. Judge profit by level, trend and size relative to revenue.
Break-even analysis
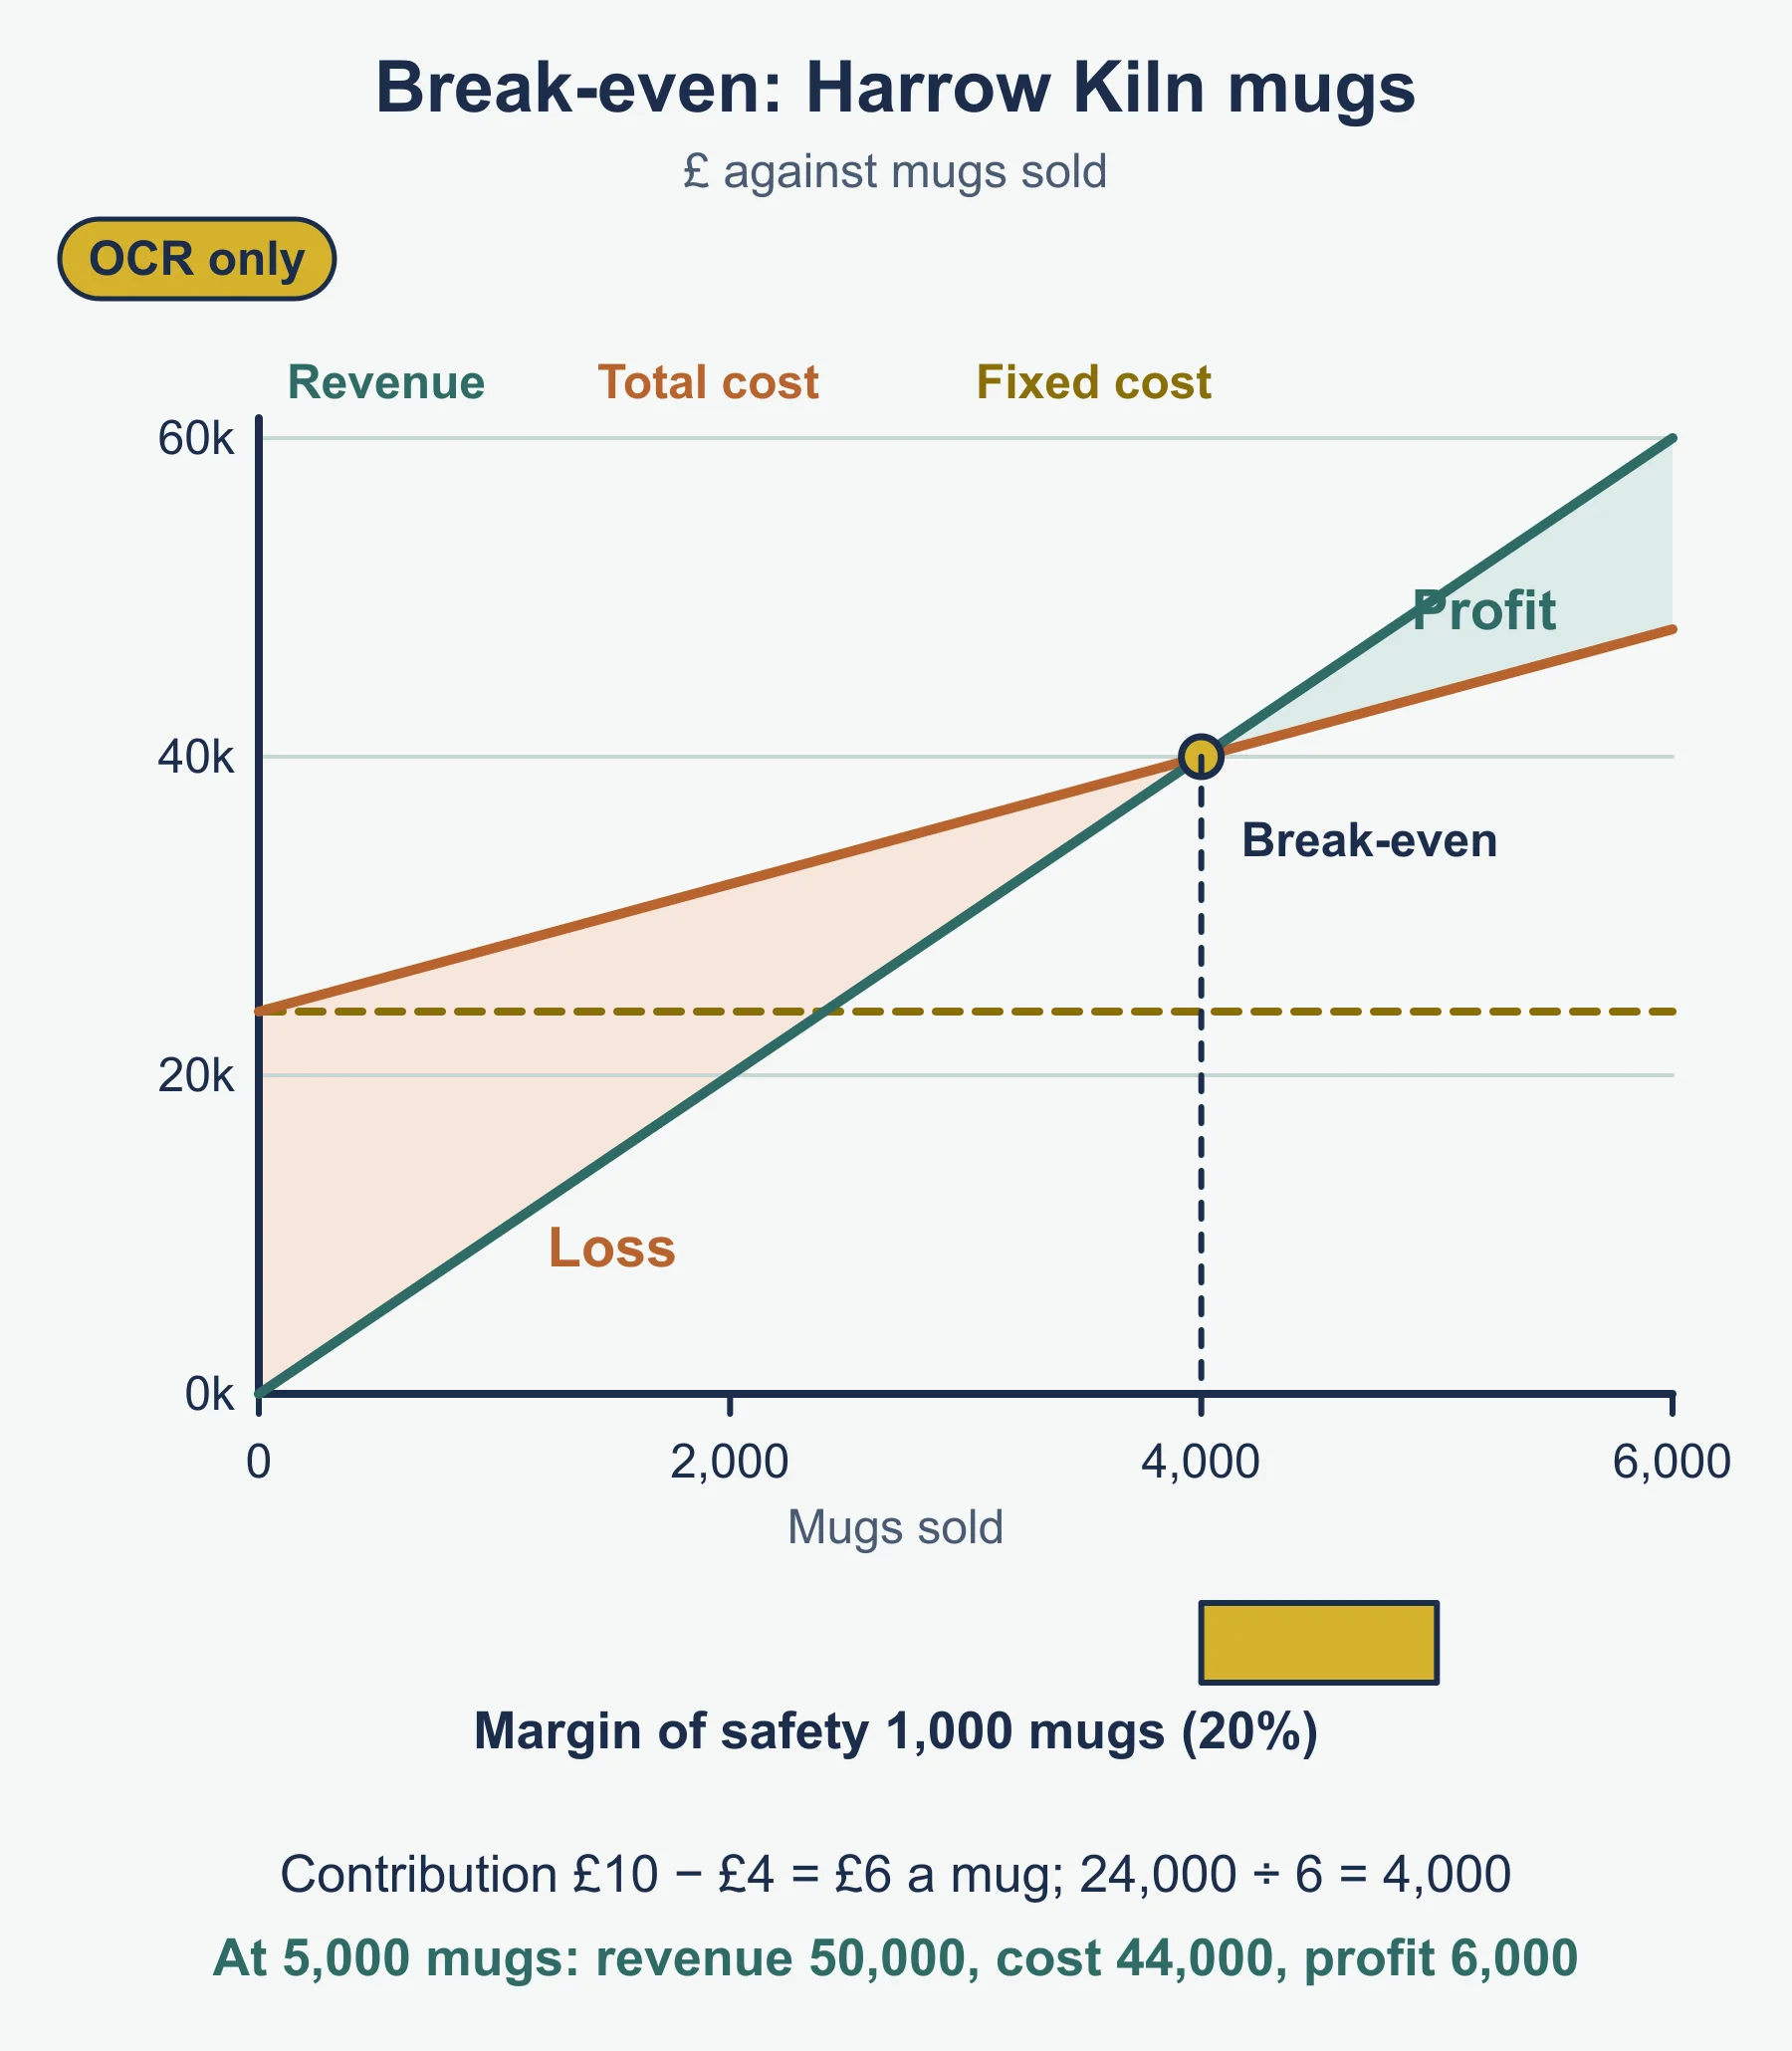
- Contribution per unit = price - variable cost. Harrow Kiln: £6.
- Break-even output = fixed costs / contribution per unit = 24,000 / 6 = 4,000 mugs.
- Margin of safety = actual output - break-even output = 1,000 mugs, or 20% of output.
- Target profit output = (fixed costs + target profit) / contribution. For £12,000: 36,000 / 6 = 6,000 mugs.
A stepped fixed cost jumps at certain outputs, for example one more supervisor for every 4,000 units.
Graph: a flat fixed-cost line at 24,000, a total cost line rising from it (44,000 at 5,000 mugs) and a revenue line from the origin (50,000). They cross at 4,000 mugs: loss to the left, profit to the right; the margin of safety is the gap to actual output.
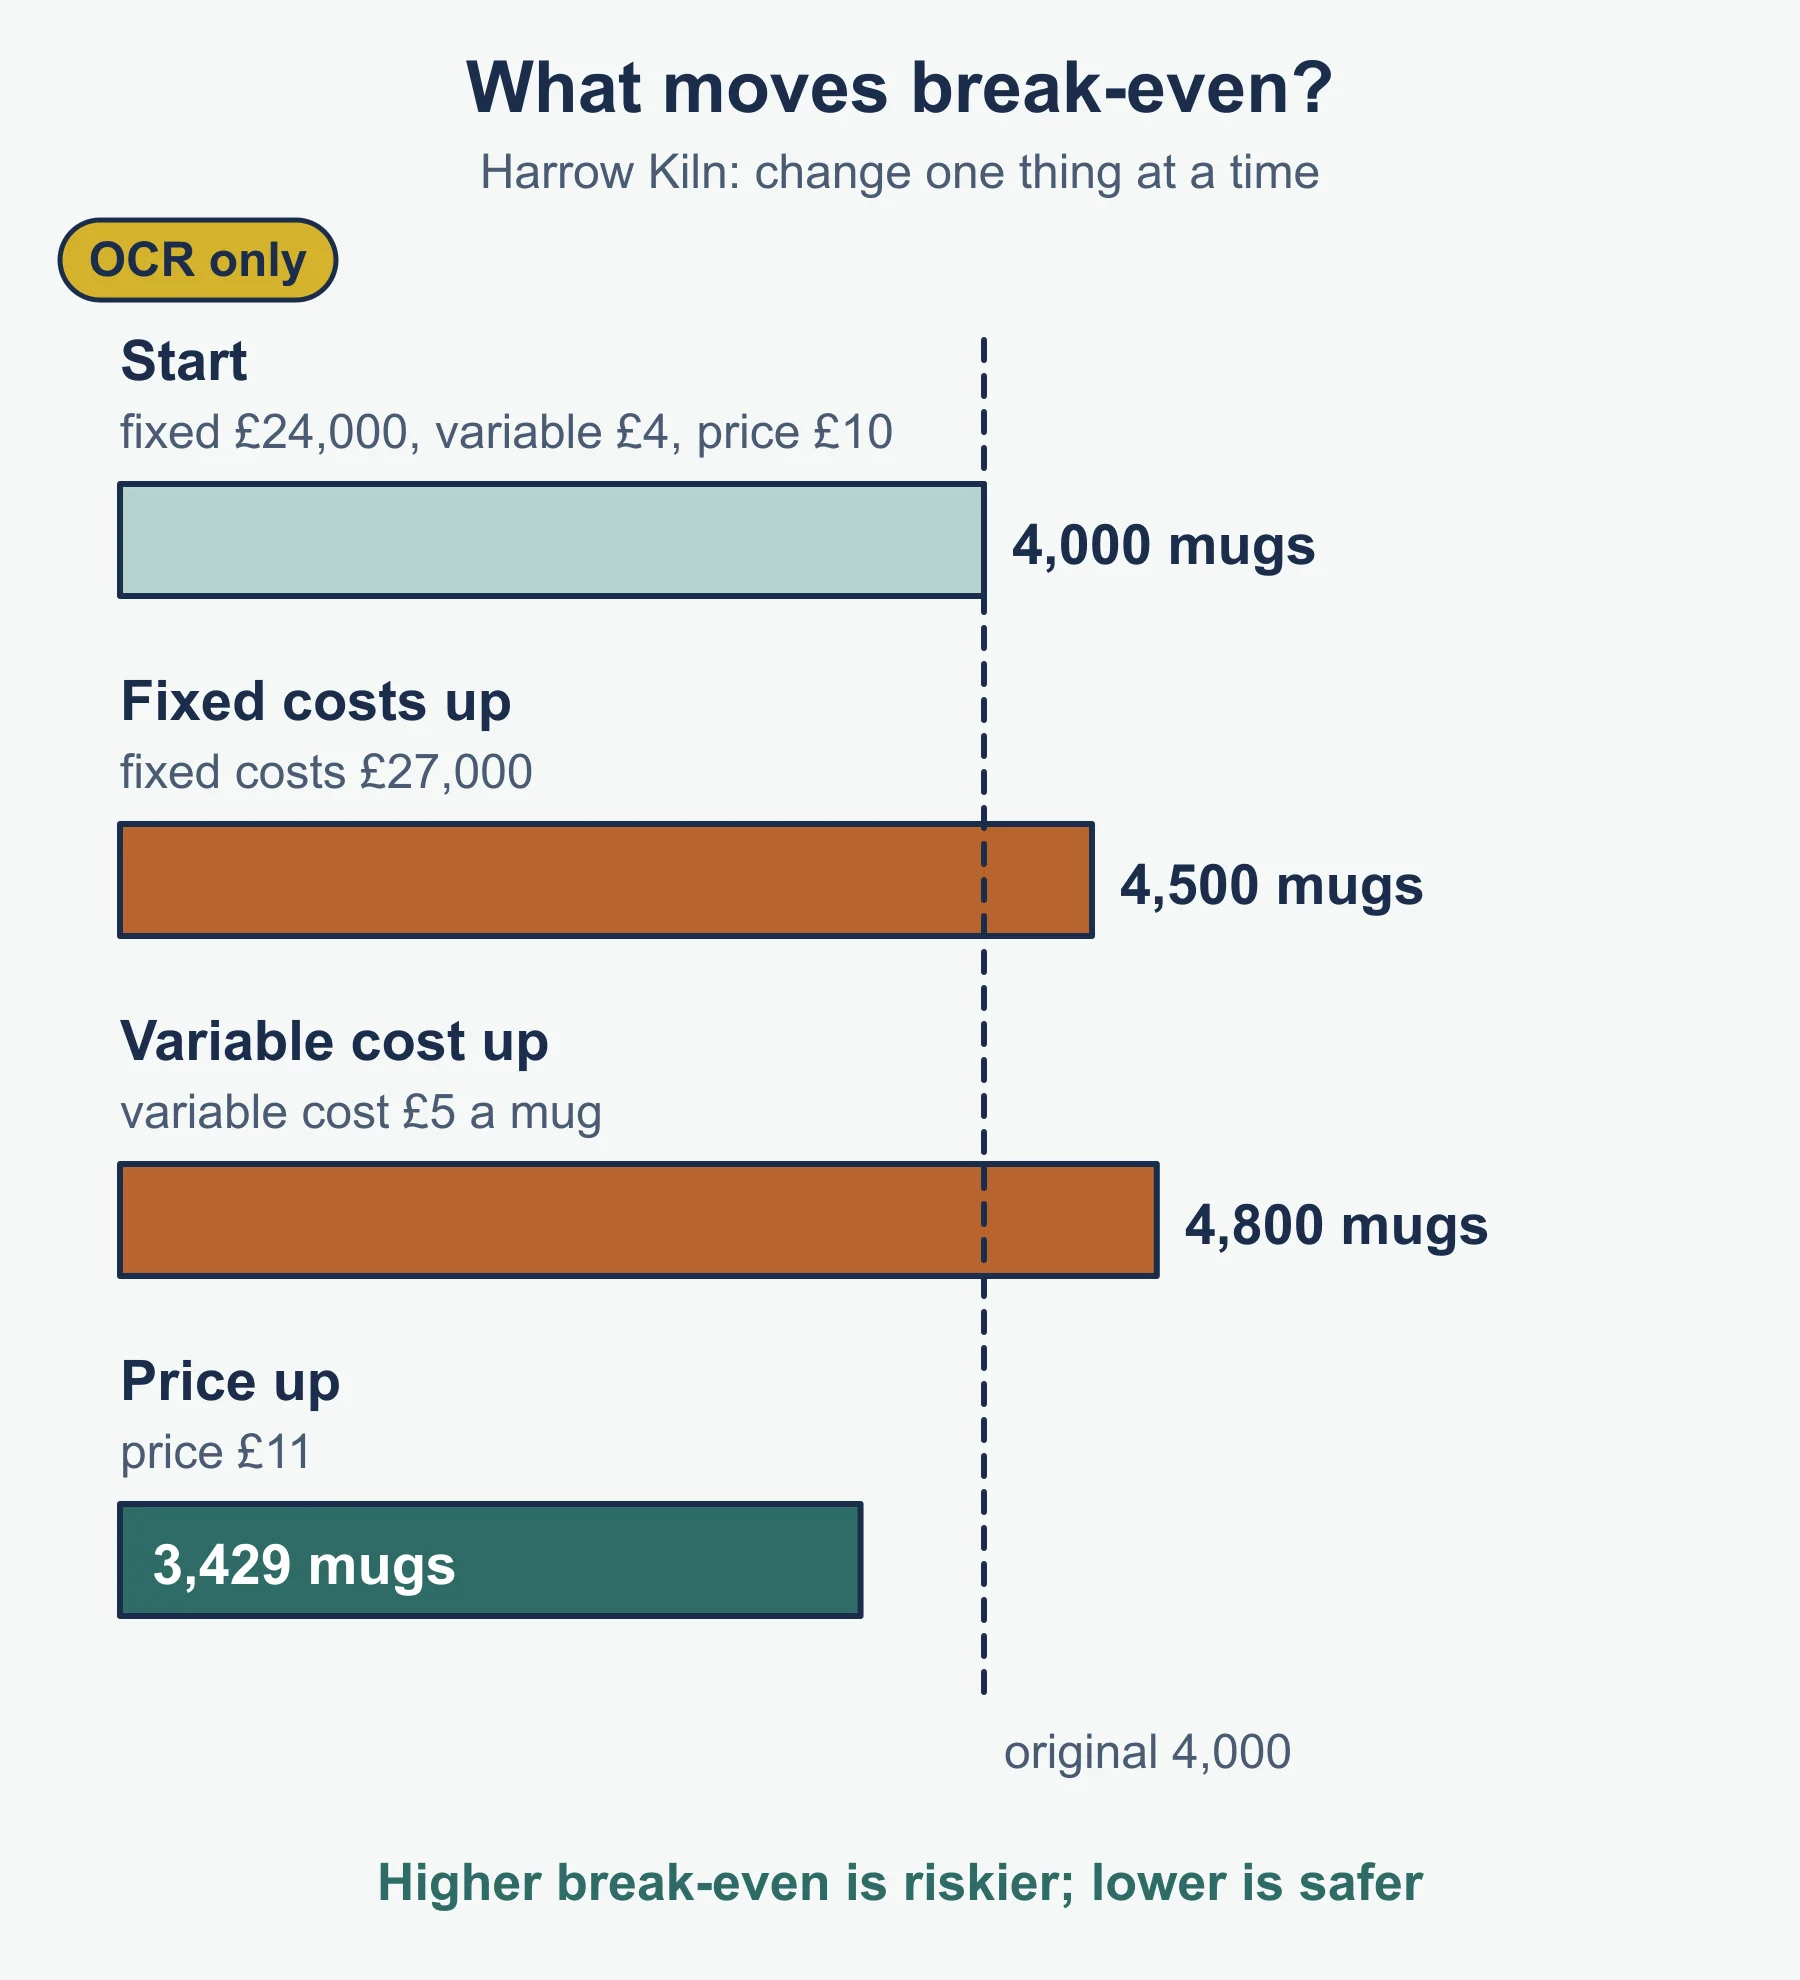
Effects of change: fixed costs up to £27,000 give break-even 4,500; variable cost up to £5 gives break-even 4,800; price up to £11 gives about 3,429.
To lower break-even: raise price (may cut demand), cut variable cost (may cut quality), cut fixed cost (may reduce capacity). Special order decision: 600 mugs at £7 give contribution 3 x 600 = £1,800, worth accepting if there is spare capacity, existing sales are not harmed and fixed costs do not rise. Lenders use it to judge risk, and staff may fear job cuts when break-even is high. Break-even assumes one price and constant variable cost, so it guides rather than forecasts.
Investment appraisal
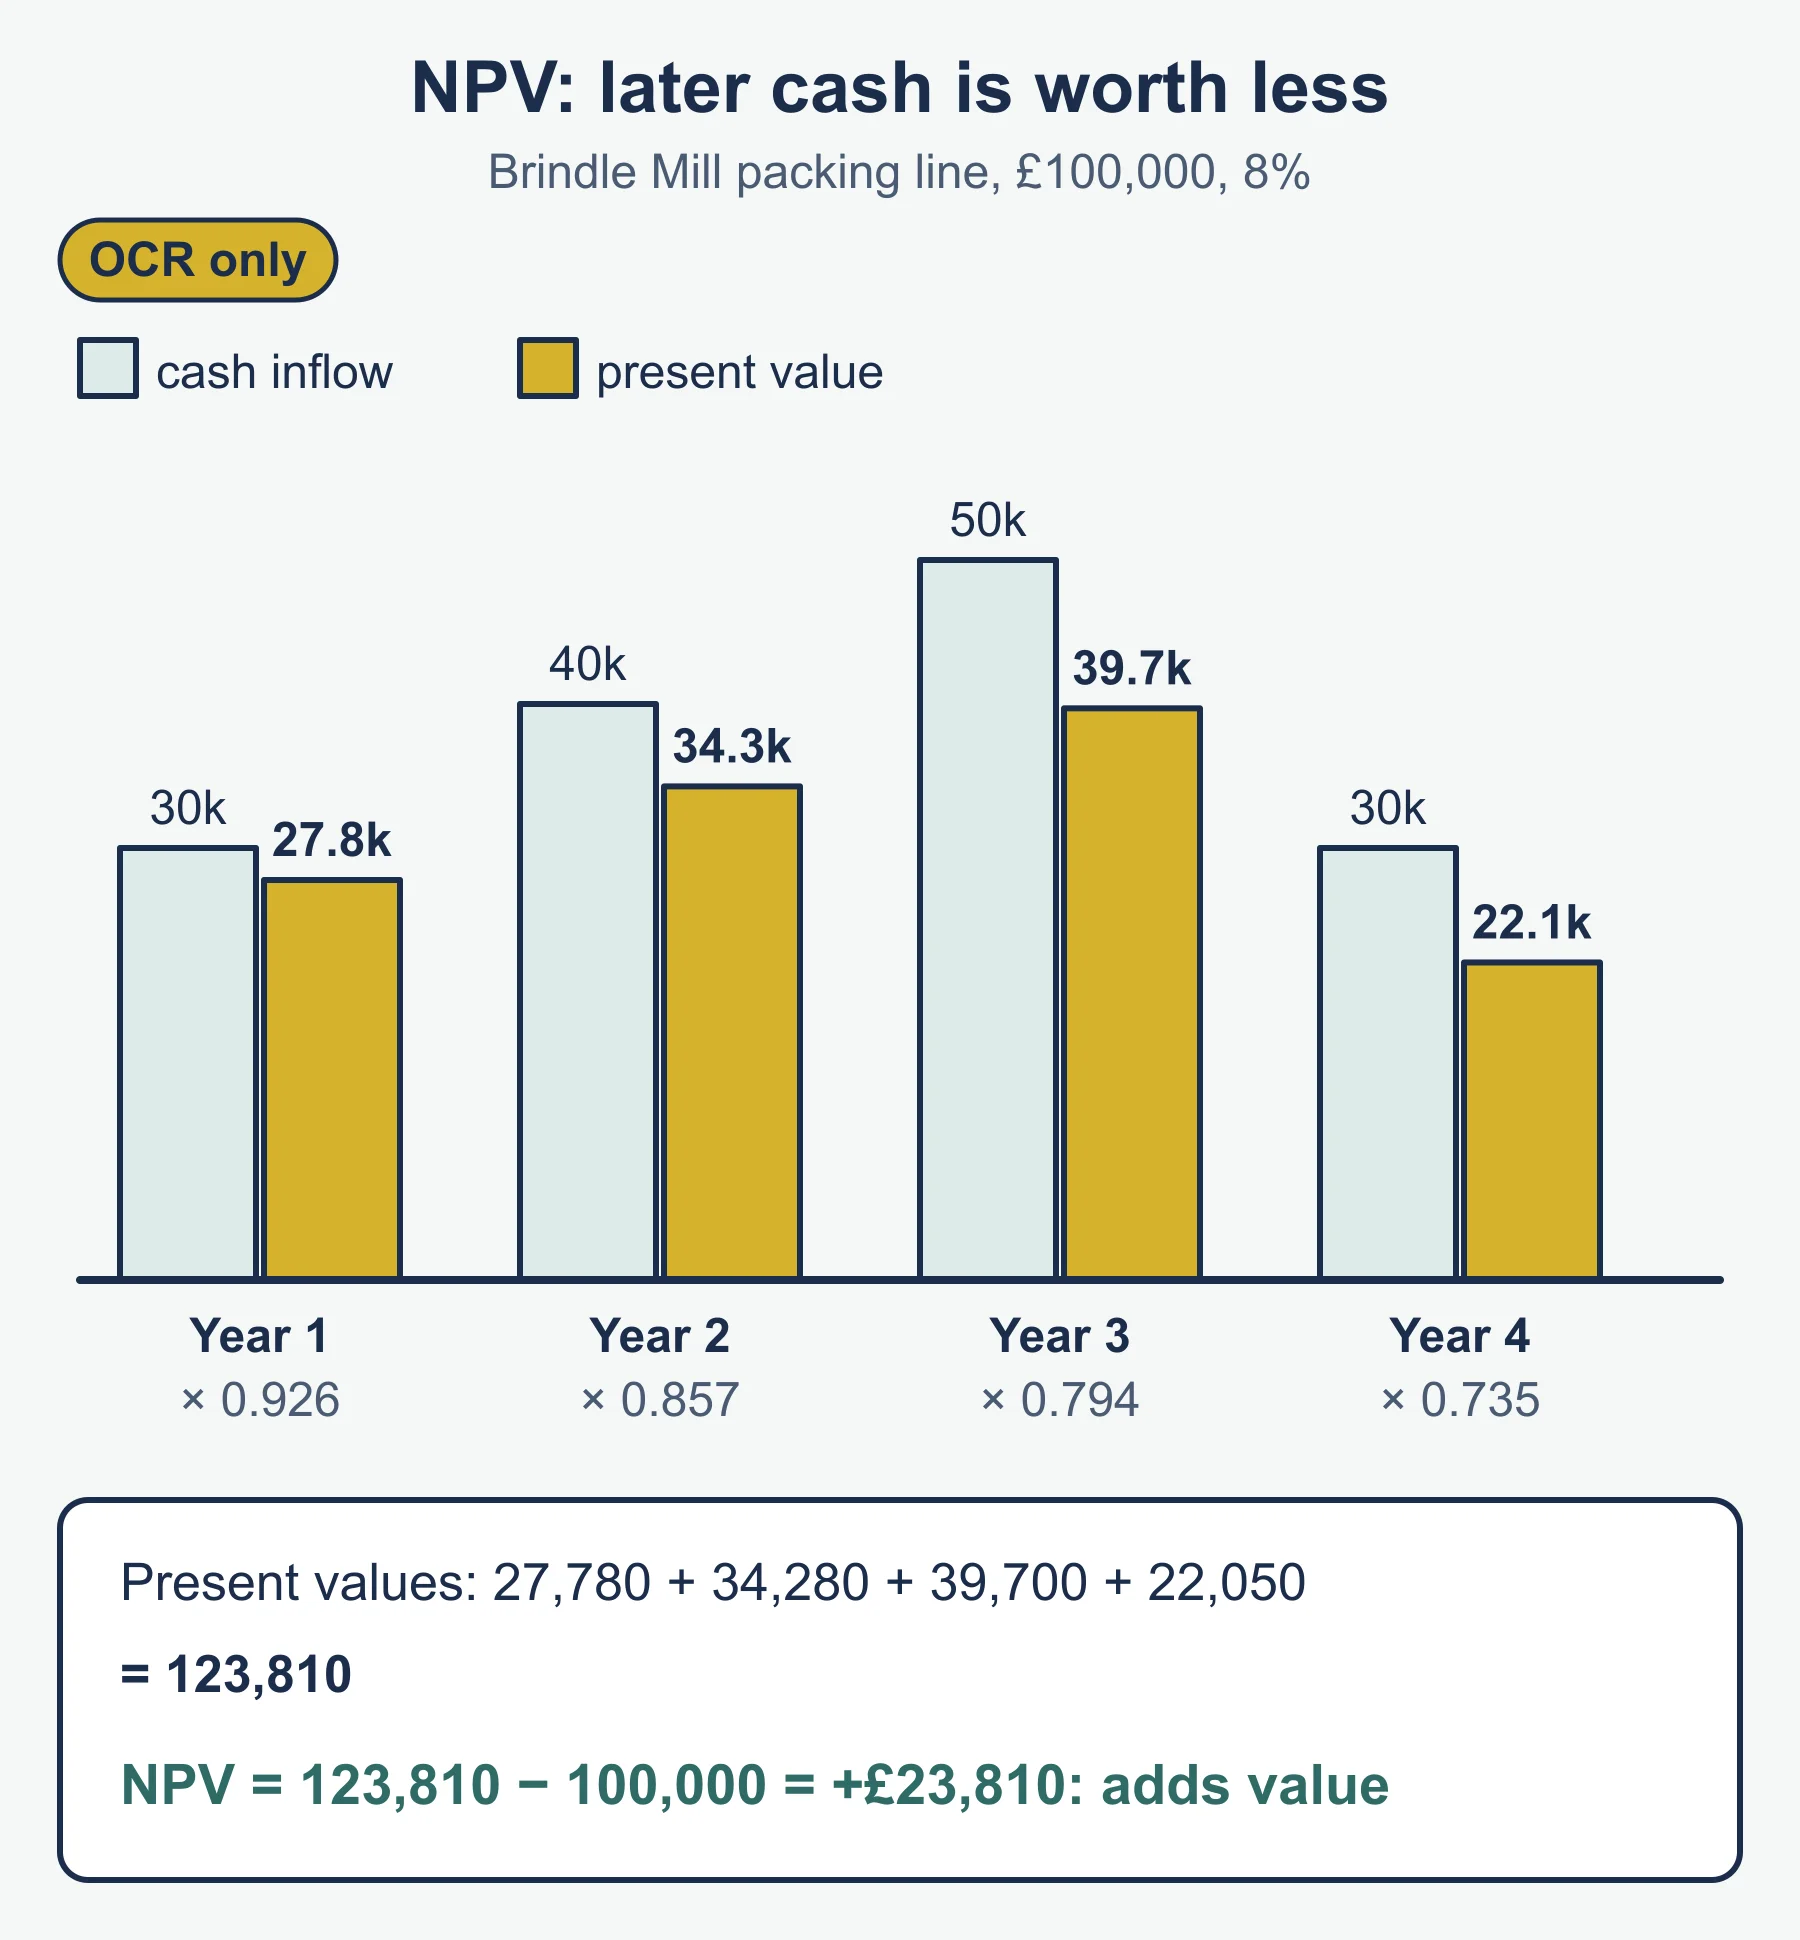
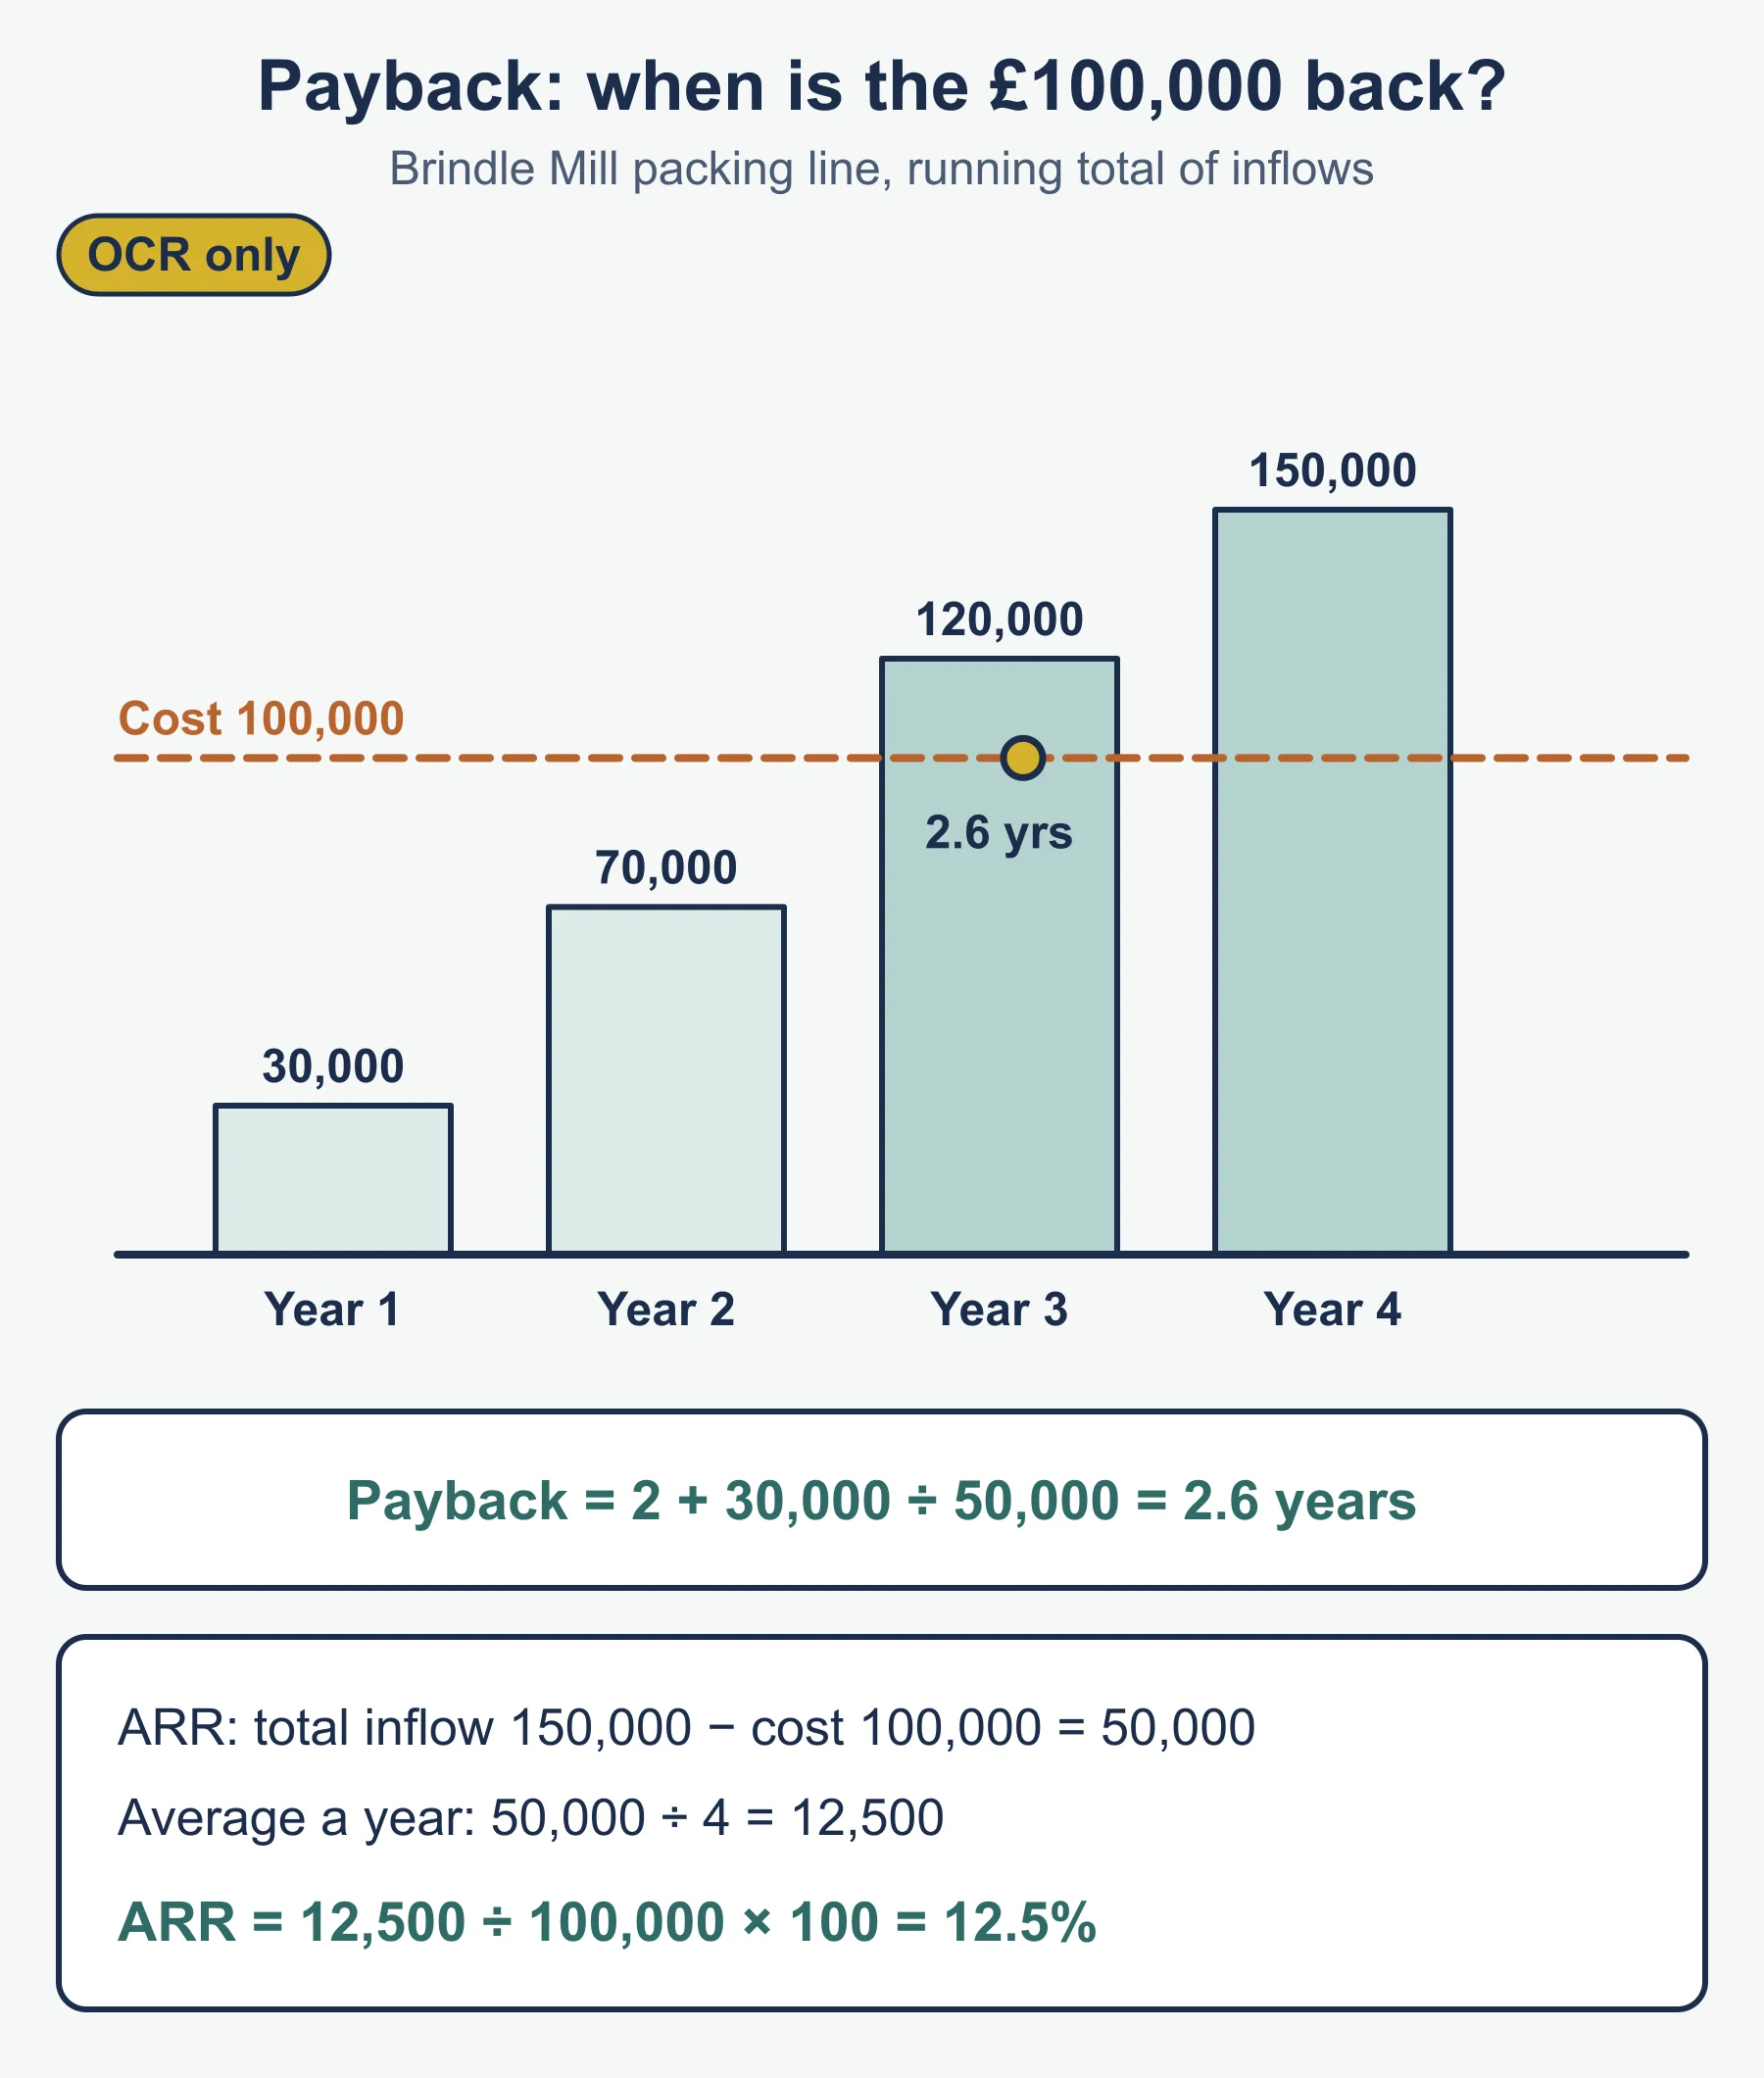
Investment appraisal judges whether a project is worth its cost. Brindle Mill: a packing line costs £100,000 with cash inflows of £30,000, £40,000, £50,000 and £30,000 over four years.
- Payback: cumulative inflows are 30,000, 70,000, 120,000. Payback = 2 + 30,000/50,000 = 2.6 years.
- ARR = (average annual profit / initial cost) x 100. Total inflow 150,000 less cost 100,000 gives 50,000; average 12,500; ARR = 12.5%.
- NPV at 8%: the year 1 to 4 factors are 0.926 (year 1), 0.857, 0.794 and 0.735 (year 4), giving present values 27,780 + 34,280 + 39,700 + 22,050 = 123,810. NPV = 123,810 - 100,000 = +£23,810, so the project adds value.
Payback ignores cash after the payback point and the value of waiting. ARR ignores when cash arrives. NPV does reflect waiting, though its answer is sensitive to the discount rate chosen. Balance the figures with qualitative aspects (staff, brand, risk, strategic fit), then recommend and justify.
Budgets and variances
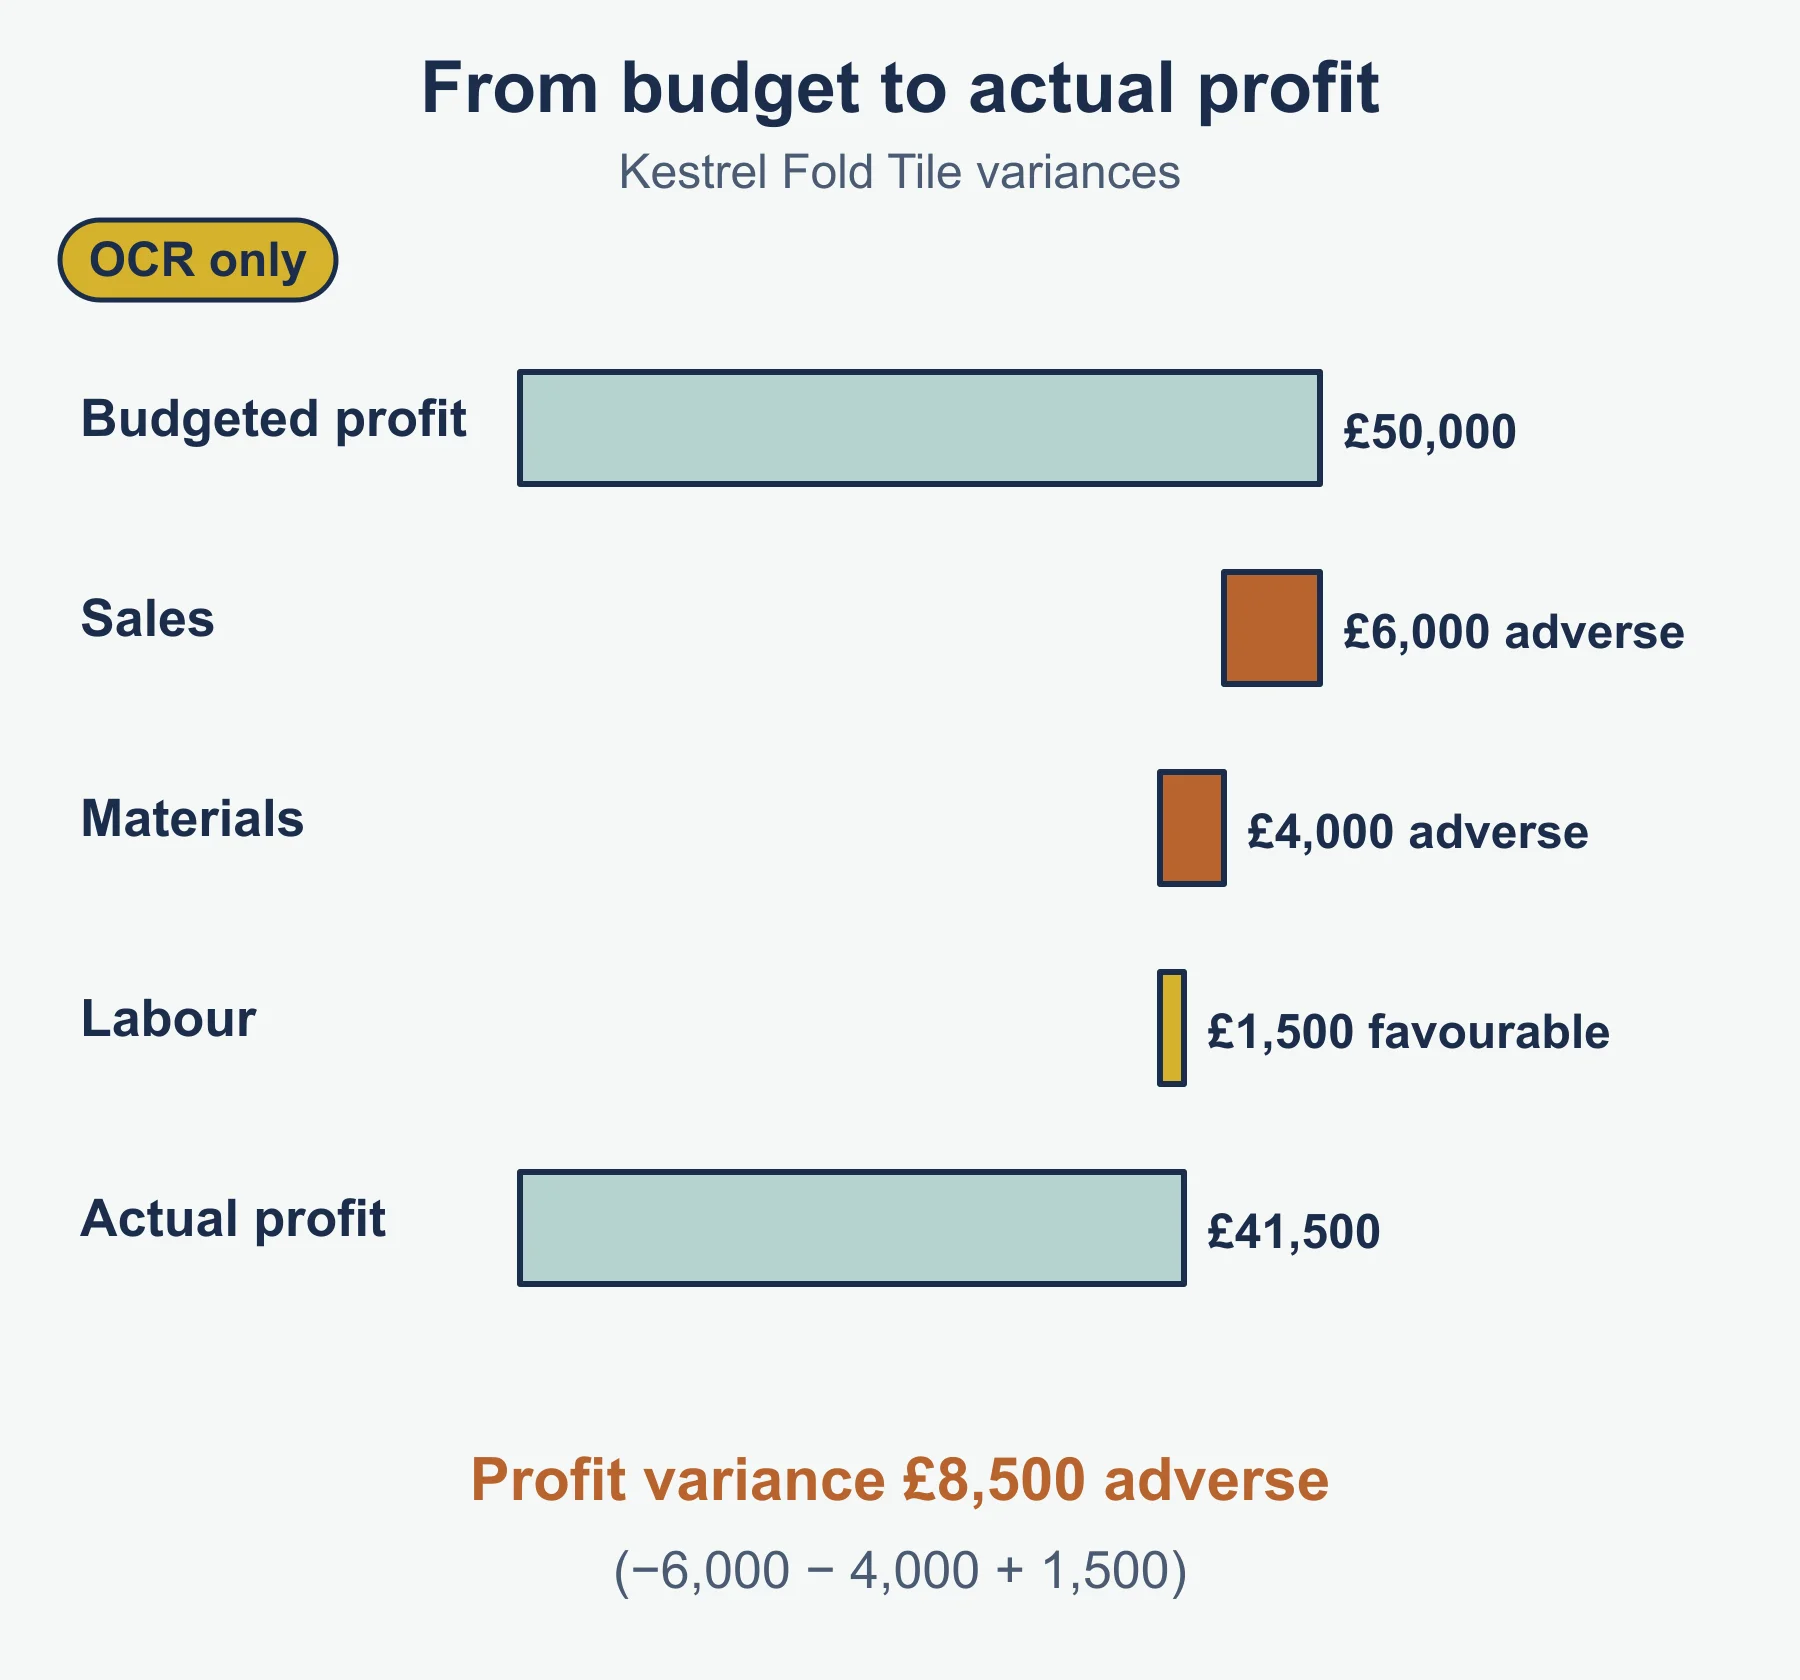
A budget is a plan expressed in money for a coming period. A variance is the gap between a budgeted figure and the actual one. A favourable variance raises profit; an adverse one lowers it.
Kestrel Fold Tile: budget sales £120,000, actual £114,000, which is £6,000 adverse. Materials budget £40,000, actual £44,000, £4,000 adverse. Labour budget £30,000, actual £28,500, £1,500 favourable. Budgeted profit £50,000, actual £41,500: the profit variance is £8,500 adverse.
Budgets give control and coordination; variances show where to act. They fail if unrealistic or if causes go uninvestigated.
Cash-flow and working capital
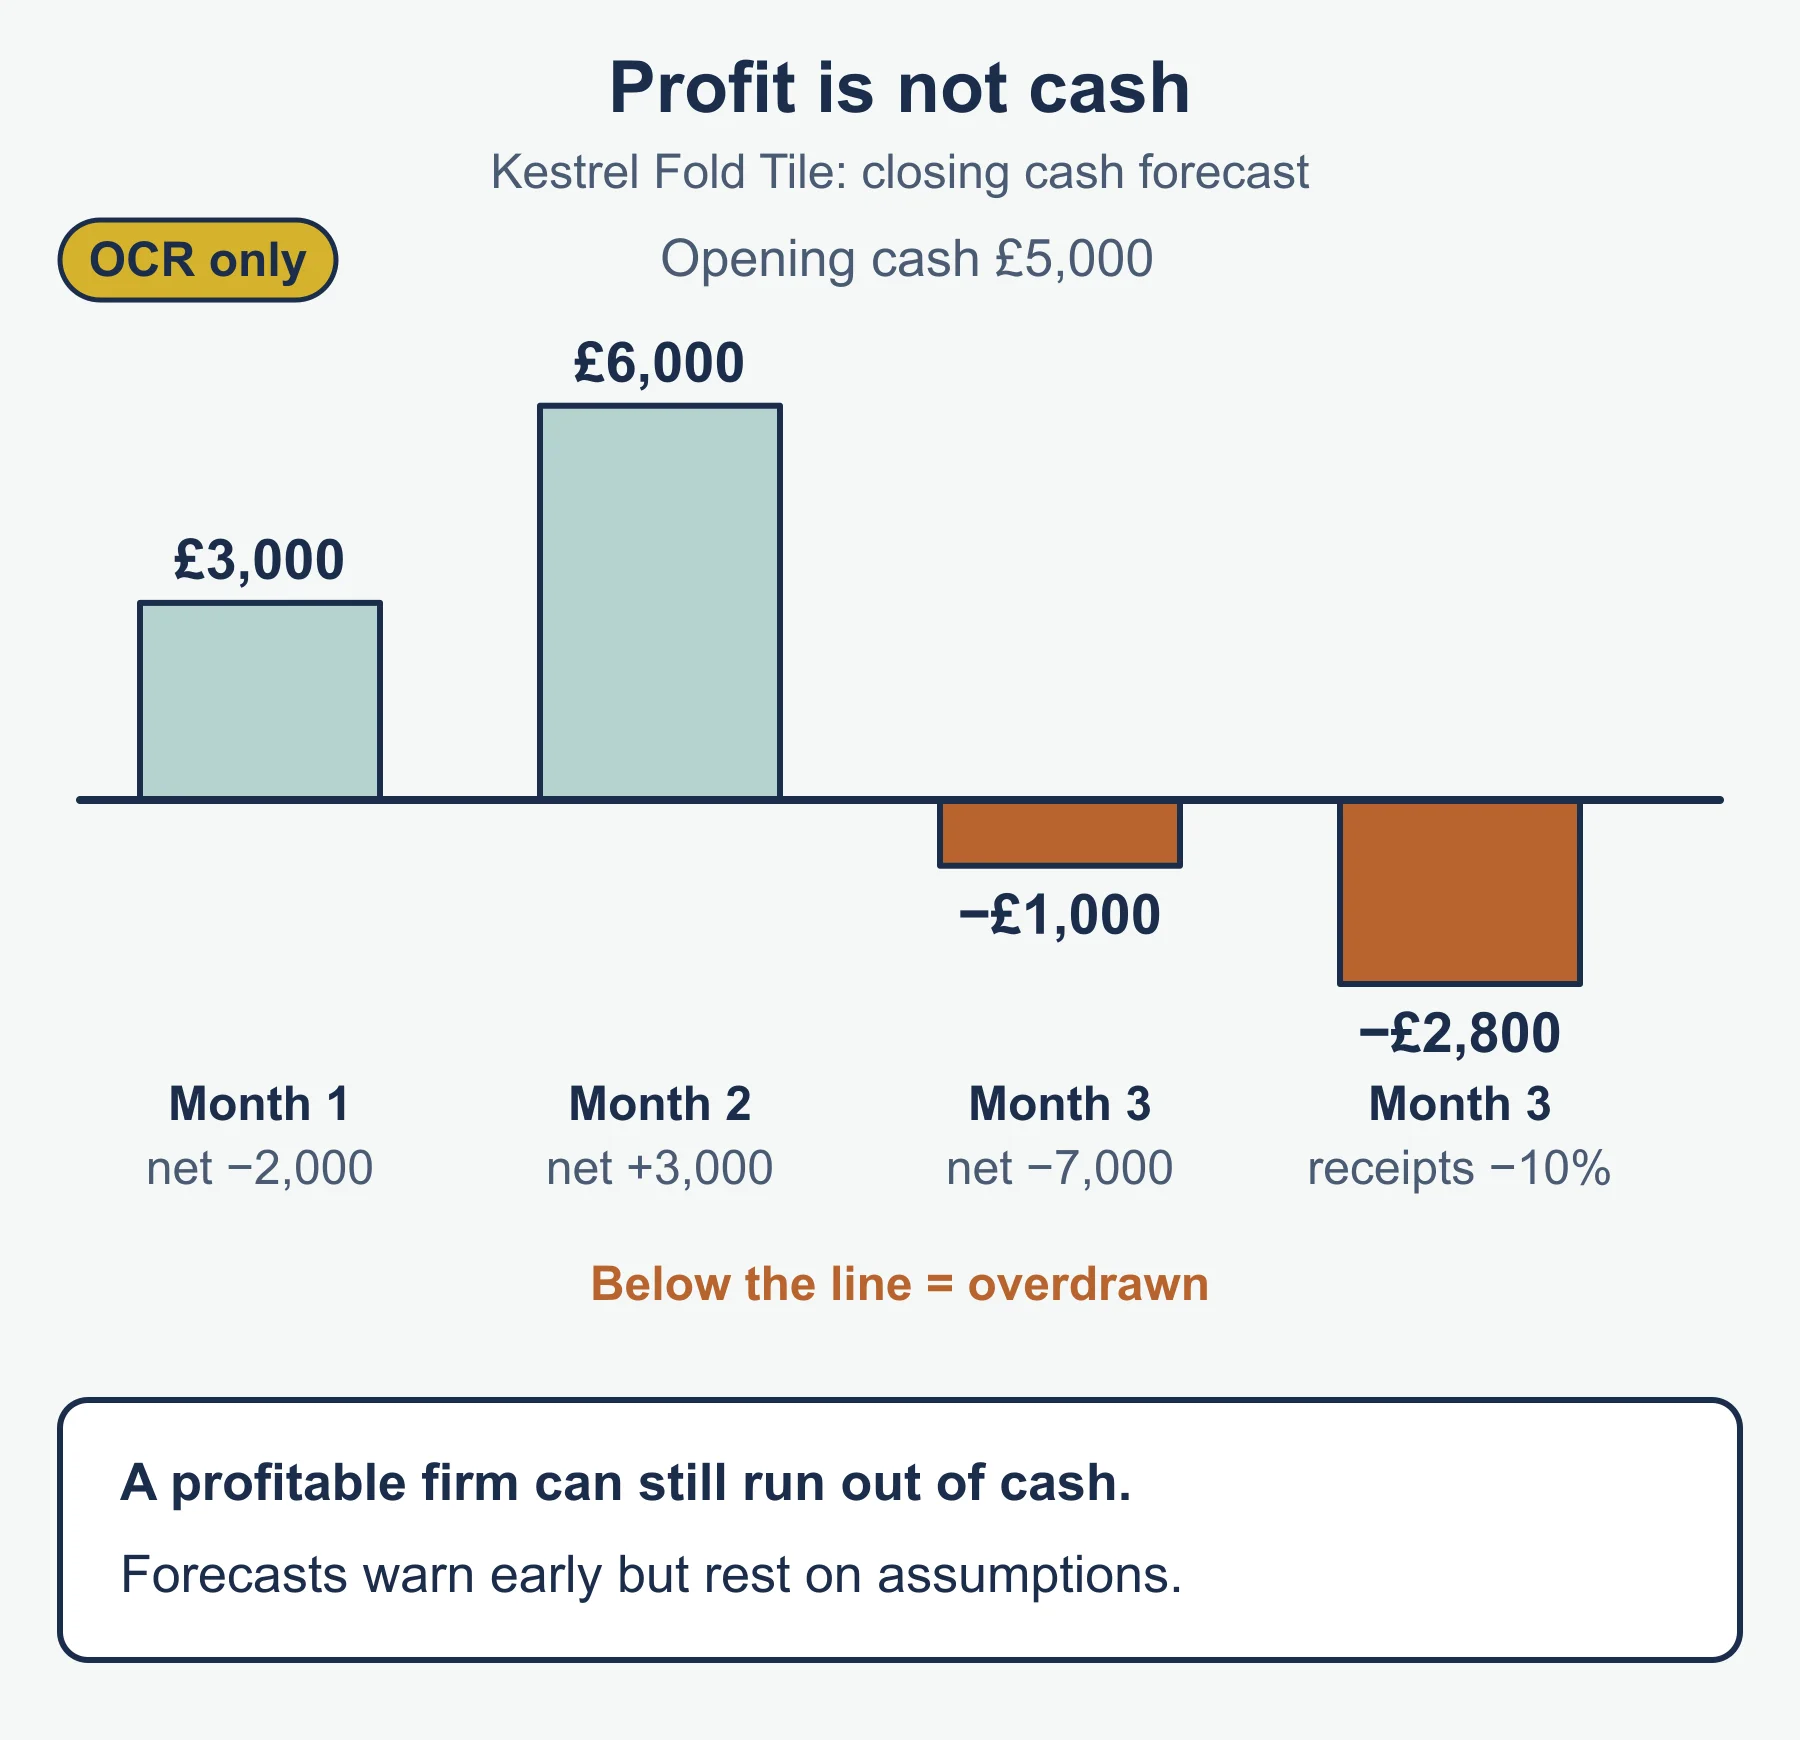
Cash-flow is money flowing in and out of the business over time. A cash-flow forecast predicts the future position, whereas a cash-flow statement reports the past. Profit is revenue less costs, including credit sales and non-cash items; cash-flow is money actually moving, so a profitable firm can run out of cash.
Kestrel Fold Tile forecast: opening cash £5,000; monthly receipts £20,000, £24,000, £18,000; payments £22,000, £21,000, £25,000. Net cash-flow is -£2,000, +£3,000 and -£7,000, so closing cash is £3,000, £6,000 and -£1,000. If month 3 receipts fall 10% (£1,800), closing cash becomes -£2,800. Forecasts give early warning and support loan applications, but rest on assumptions. Shortfall strategies (overdraft, delaying payments, faster collection, cutting inventory, sale and leaseback, trimming costs) each carry a cost or risk.
Working capital = current assets - current liabilities. The working capital cycle is the time from paying for inventory, through production and sale, to receiving cash from customers.
Income statements and profit
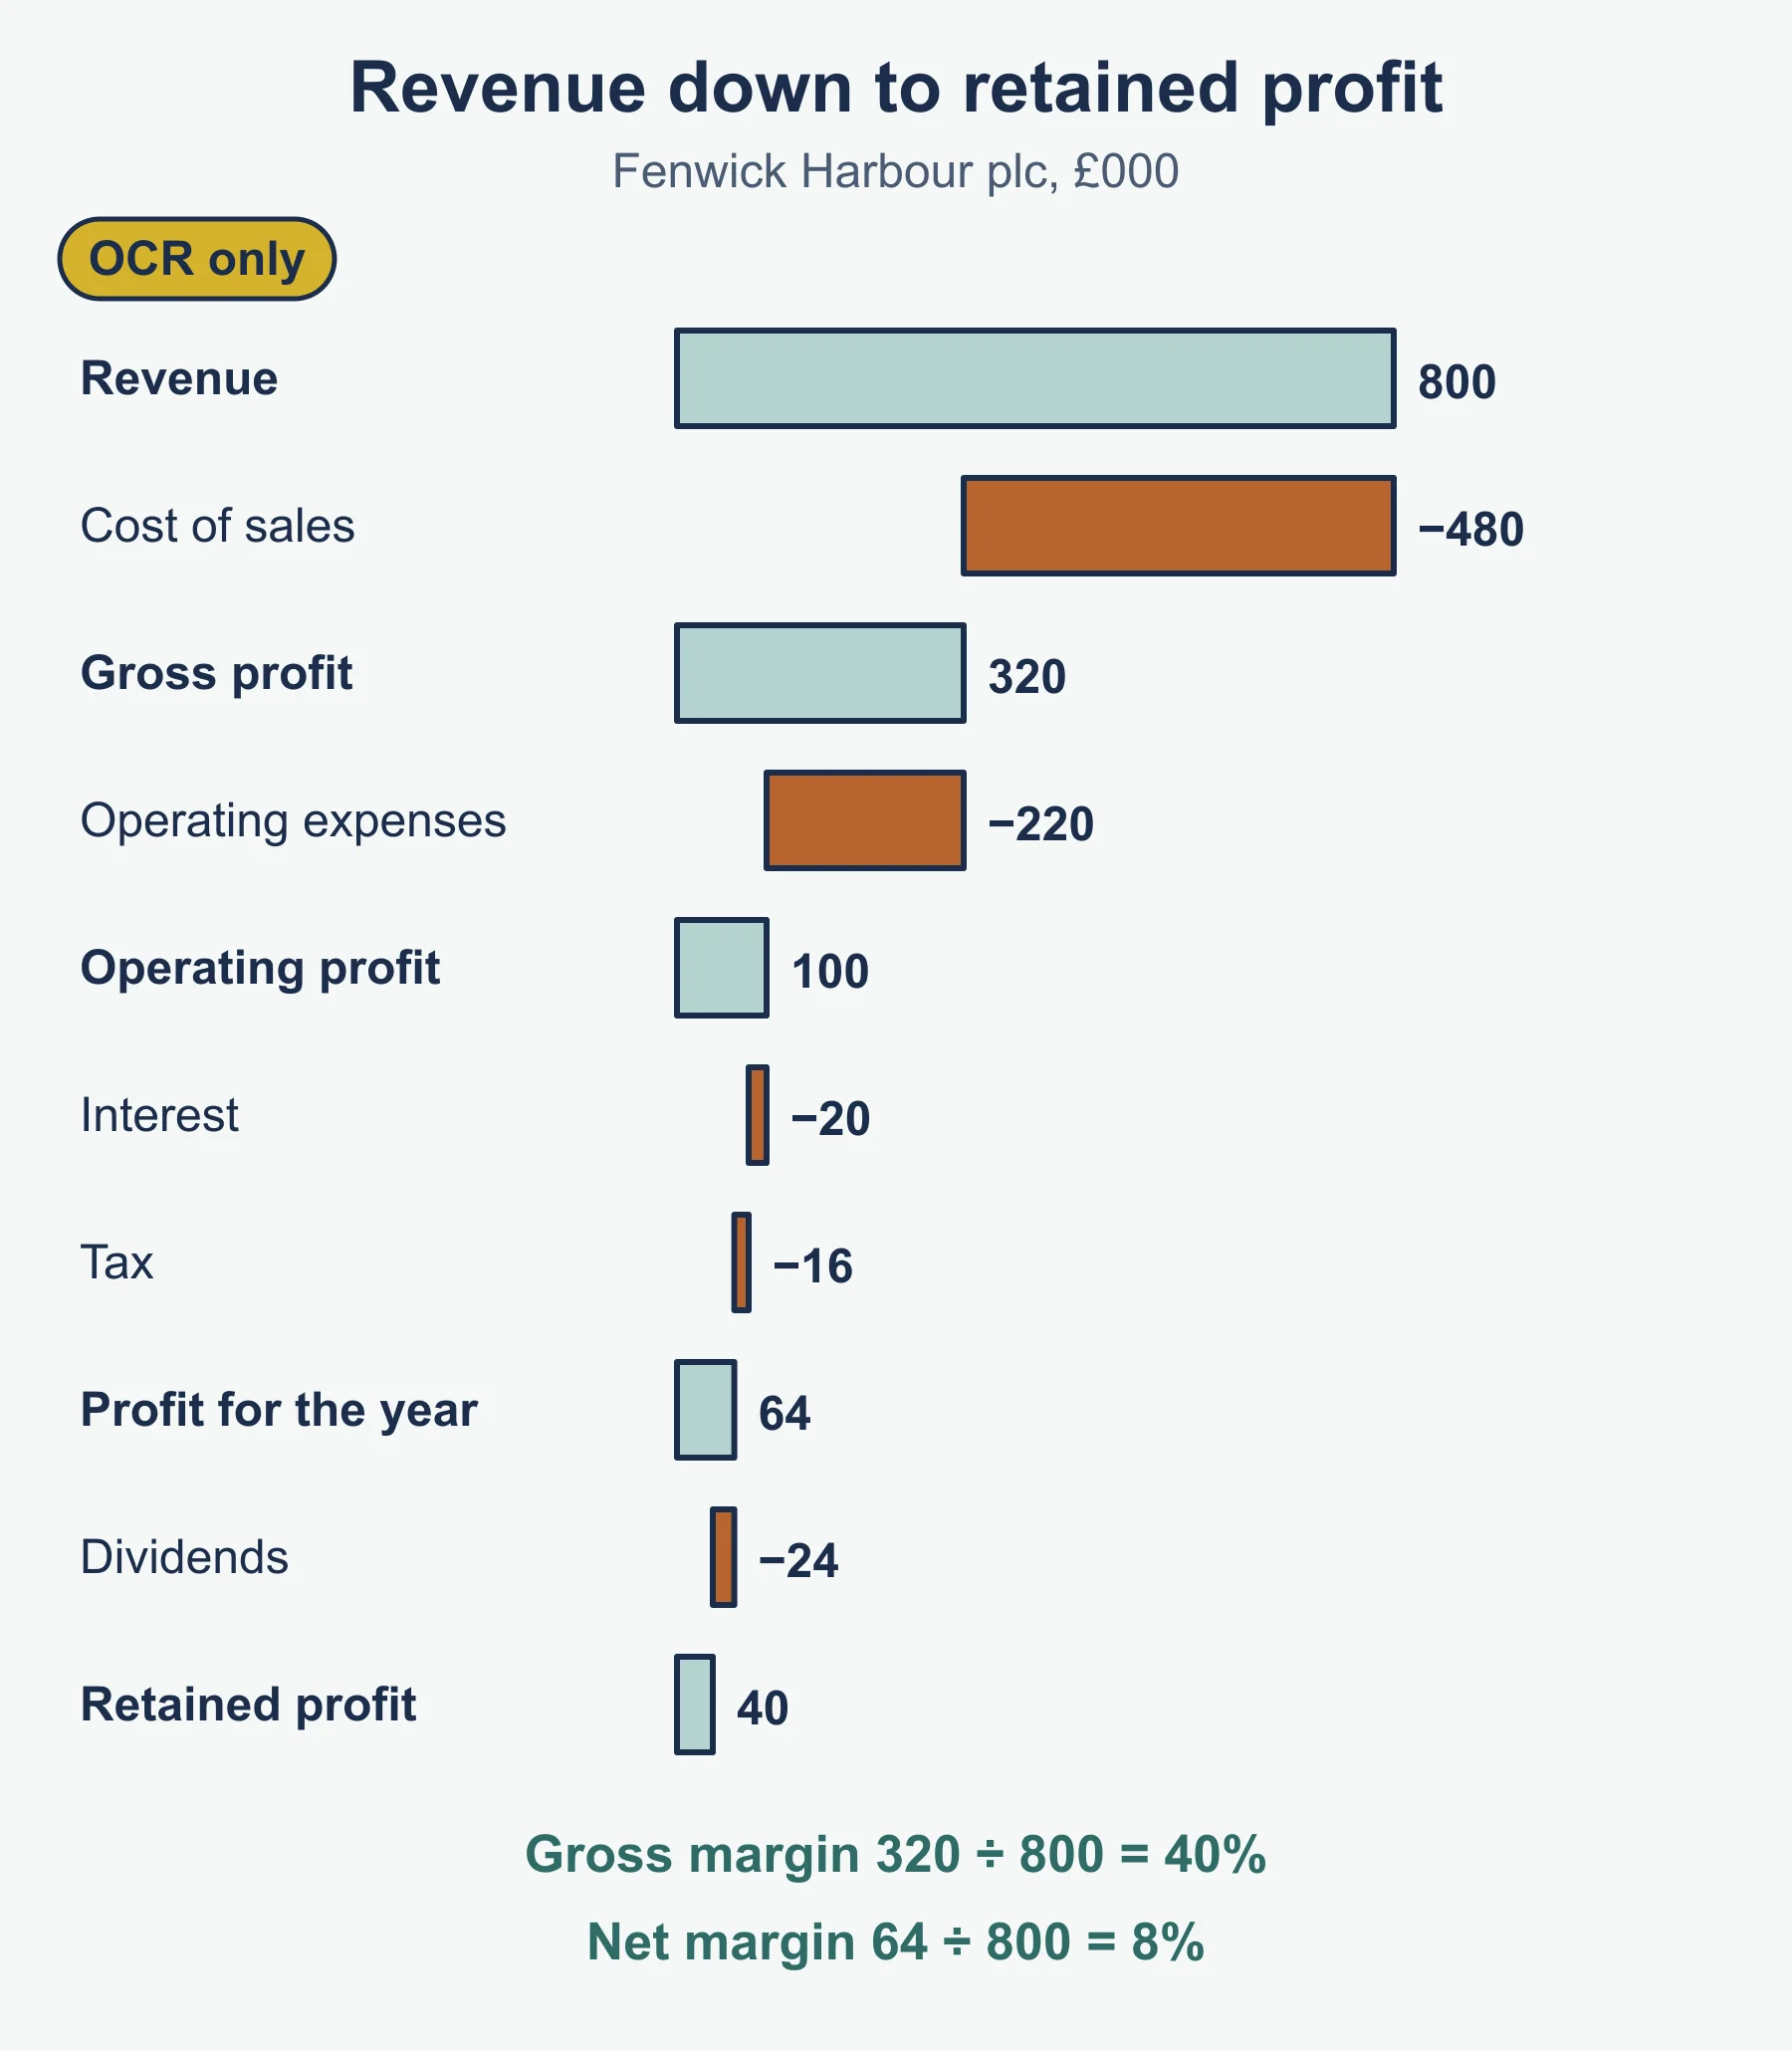
An income statement sets out revenue, costs and the resulting profit for one trading period. Fenwick Harbour plc: revenue £800,000, cost of sales £480,000, so gross profit £320,000. Operating expenses £220,000 leave operating profit £100,000. Interest of £20,000 gives profit before tax £80,000; tax £16,000 gives profit for the year (net profit) £64,000. Dividends of £24,000 leave retained profit £40,000.
Gross profit margin = gross profit / revenue = 40%. Net profit margin = profit for the year / revenue = 8%. Income statements are historic and omit cash.
Statement of financial position and depreciation
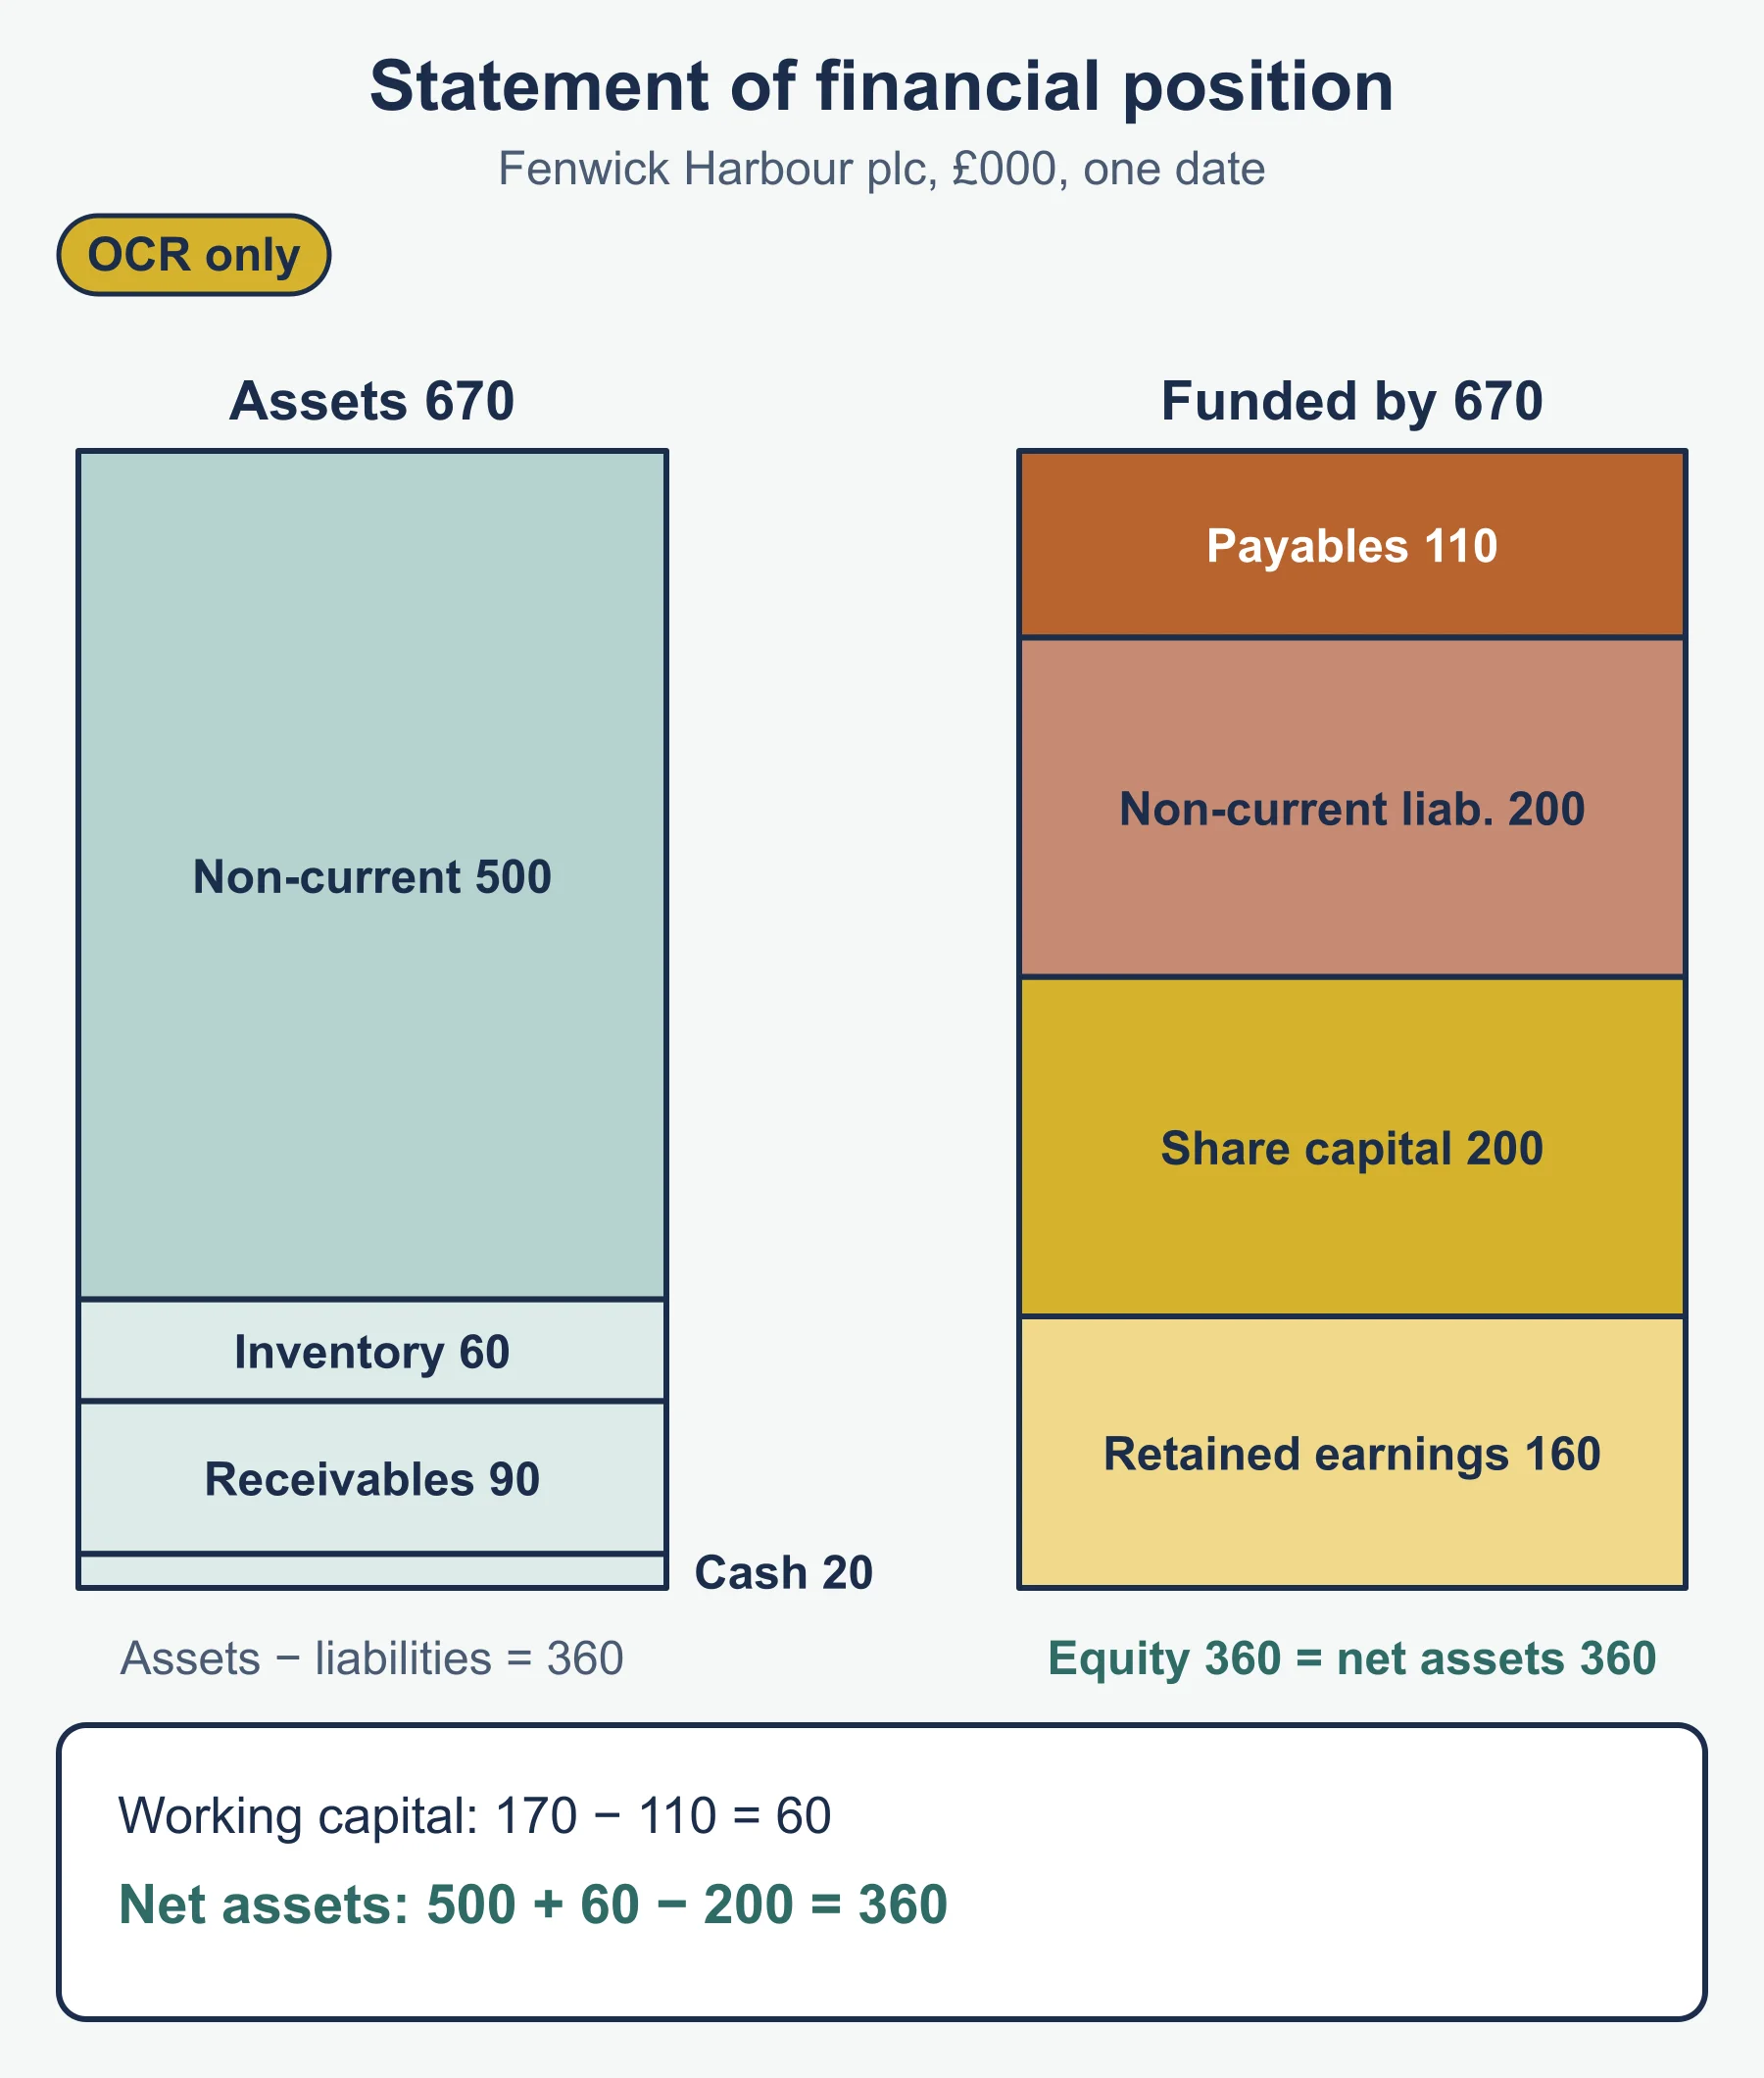
The statement of financial position lists assets, liabilities and equity on one date. Fenwick Harbour plc: non-current assets £500,000; inventory £60,000; receivables £90,000; cash £20,000; payables £110,000; non-current liabilities £200,000. Working capital = 170,000 - 110,000 = £60,000. Net assets = 500,000 + 60,000 - 200,000 = £360,000. Shareholders’ equity: share capital £200,000 plus retained earnings £160,000 = £360,000.
The statement shows financial strength on one date, not trading results. Valuing assets involves judgement. Non-current assets are shown at cost less depreciation, which may differ from market value. Investments may be at cost or market value. Patents and goodwill are intangible and hard to value; goodwill arises when a business is bought for more than its net assets. Receivables are reduced for bad debts. Inventories are usually at the lower of cost and net realisable value.
Depreciation shares the purchase cost of a non-current asset across the years it is expected to be used. Providing for it matches cost to years of use (accruals) and avoids overstating profit and assets.
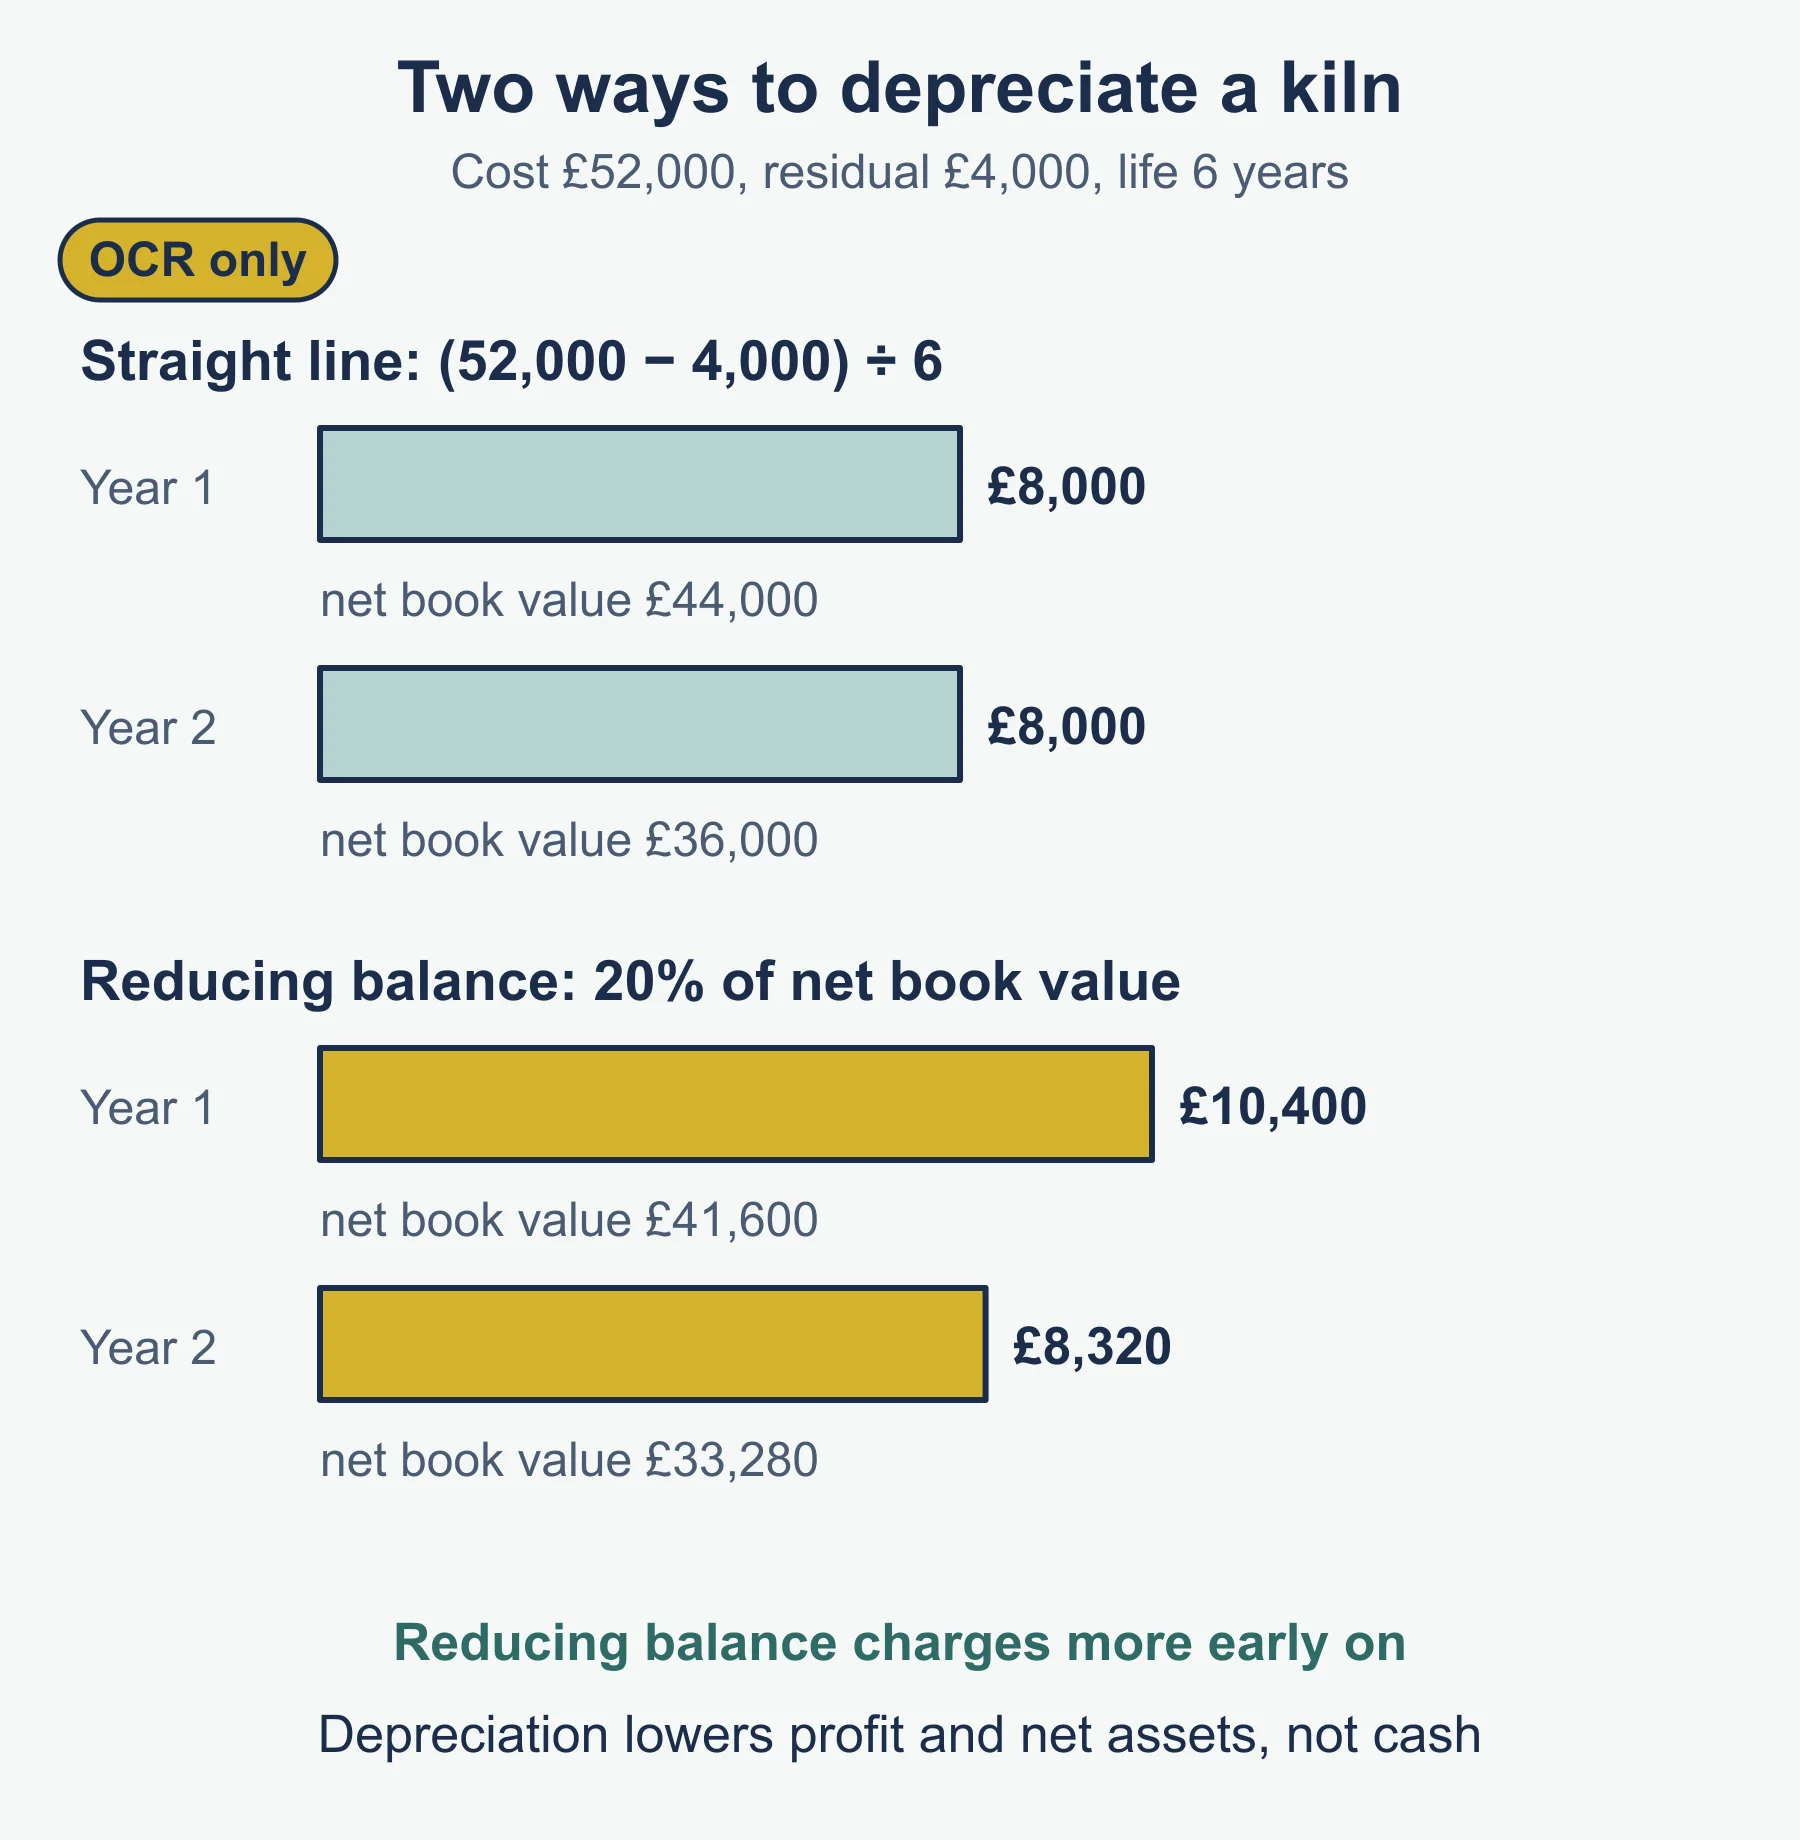
A kiln costing £52,000, residual value £4,000, life 6 years:
- Straight line: (52,000 - 4,000) / 6 = £8,000 a year.
- Reducing balance at 20%: year 1 £10,400 (net book value £41,600); year 2 £8,320 (£33,280).
Depreciation lowers reported profit and net assets, not cash.
Ratio analysis
Using Fenwick Harbour plc (capital employed = equity + non-current liabilities = £560,000):
| Ratio | Formula (standard form) | Result |
|---|---|---|
| Current ratio | current assets / current liabilities | 1.55 |
| Acid test | (current assets - inventory) / current liabilities | 1.00 |
| Gearing | non-current liabilities / capital employed x 100 | 35.7% |
| Interest cover | operating profit / interest | 5 times |
| Debtor turnover | receivables / revenue x 365 | 41 days |
| Creditor turnover | payables / cost of sales x 365 | 84 days |
| Non-current assets turnover | revenue / non-current assets | 1.6 |
| Stock turnover | cost of sales / inventory | 8 times |
| ROCE | operating profit / capital employed x 100 | 17.9% |
| Return on equity | profit for the year / equity x 100 | 17.8% |
Shareholder ratios (200,000 shares, price £4.80): earnings per share 32p; dividend per share 12p; dividend yield = dividend per share / share price x 100 = 2.5%; price/earnings = share price / earnings per share = 15.
Ratios mislead without comparison or context, since policies differ and figures are historic. Evaluate the financial position against previous years, competitors and targets. An acid test of 1.0 is adequate but not generous; paying creditors in 84 days while customers pay in 41 may strain suppliers.
External influences and the finance strategy
Evaluate how each influence changes finance decisions: social (ethical investors); legal (reporting duties); ethical (honest reporting, no window dressing); environmental (cost of green investment); economic (interest and exchange rates, demand cycles); political (tax and grant policy); technological (crowdfunding, automated accounting); international (exchange-rate risk, overseas funding).
A financial strategy brings together objectives, sources of finance, investment and budgeting. To recommend one, state the objective, funding mix (such as a loan for equipment), controls (budgets, cash forecasts, ratio targets) and risk, then justify against size, gearing and outlook.
Frequently asked questions
When is the final assessment of OCR A Level Business H431? The specification version this guide follows, Version 2.1 (January 2026), states a final assessment in summer 2027. Check the series your own exams fall in.
What is the difference between absorption and marginal costing? Absorption costing assigns all costs to units, adding overheads using a rate such as per labour hour. Marginal costing assigns only variable costs to units and treats fixed costs as a cost of the period, which suits short-term decisions.
What is the difference between straight-line and reducing balance depreciation? Straight-line depreciation charges the same amount each year: (cost − residual value) ÷ useful life. Reducing balance applies a fixed percentage to the net book value each year, so the charge falls over time.
What are the limitations of payback and ARR? Payback ignores cash received after the payback point and the time value of money. ARR ignores when the cash arrives. NPV reflects the value of waiting, but its result is sensitive to the discount rate chosen.
What is the difference between a cash-flow forecast and a cash-flow statement? A cash-flow forecast predicts the business’s future cash position, while a cash-flow statement reports what happened to cash in the past.
Official syllabus
OCR Level 3 Advanced GCE in Business (H431), Version 2.1 (January 2026), topic 6, Accounting and financial considerations. Published by OCR.
Get free revision emails (optional)
Occasional emails with practice questions, worked explanations and links to free resources for the qualification and subjects you choose. No spam, and you can unsubscribe from any email. The free tools on this site never need an email.
Related resources
-
Practice questions
OCR A Level Business: Accounting and financial considerations (H431) – Practice Questions
Original practice questions with worked answers on accounting and financial considerations for OCR A Level Business H431, from break-even to ratios.
Business · OCR · A Level
Try questions -
Revision notes
OCR A Level Business: Accounting and financial considerations (H431) – Revision Notes
Condensed revision notes on accounting and financial considerations for OCR A Level Business H431: formulas, definitions, method steps and a self-test.
Business · OCR · A Level
Revise topic -
Study guides
OCR A Level Business: Ansoff's matrix and Conflicts in business decision making (H431)
Study guide to Ansoff's matrix and to conflicts between decision making tools for OCR A Level Business, with two fully worked examples.
Business · OCR · A Level
Read guide
Related articles
-
teaching
A Level tuition in Dubai: Cambridge or Pearson Edexcel International A Level?
Schools in Dubai and Abu Dhabi teach either Cambridge International AS & A Level or Pearson Edexcel International A Level. How the two are structured, why it matters for tuition, and how online classes from Lahore work.
9 October 2026
-
curriculum guides
Choosing subjects at IGCSE and A Level
How subject choices at 14 and 16 affect university options later, and how to keep pathways open without overloading a timetable.
28 July 2026
Studying this with a teacher
Working through Business A LEVELS?
This page is free and stays free. If you would rather be taught it, Marlbridge runs Business classes one-to-one, online in your own time zone. One-to-one only for this course: Rs 6,000 per class in Pakistan, with other currencies on the fees page. The first trial class is free. WhatsApp replies within an hour (8am–11pm Pakistan time, every day); email the same day.
OCR Business teachers at Marlbridge
