
Study Guides
OCR A Level Business: Forecasting (H431)
Study guide to forecasting for OCR A Level Business (H431): qualitative methods, moving averages, correlation and seasonal and cyclical variation.
- Subject
- Business
- Level
- A LEVELS
- Topic
- Business objectives and strategic decisions
- Author
- Marlbridge Academic Team
- Updated
- Reviewed by
- Salman Ahmad (what this means)
Aligned to OCR A Level Business (H431), Version 2.1 (January 2026), for first assessment in 2017; final assessment summer 2027. Official specification .
Syllabus page (what it covers and how it is assessed): OCR A Level Business.
Syllabus points this page covers
H431
- 1.12 Forecasting
Found an error? Report a correction.
Need help with this topic? Request a free trial class for A Level Business (H431).
This guide teaches the Forecasting content point in the Business objectives and strategy area of study of the OCR A Level Business (H431) specification, Version 2.1 (January 2026), for first assessment in 2017 with final assessment in summer 2027. It covers the nature and purpose of forecasting, qualitative methods, quantitative methods (financial forecasts, seasonal and cyclical variation, correlation, extrapolation and moving averages), and how a business should respond. Pair it with the revision notes and the practice questions. For the wider area of study see the objectives and strategic decisions guide, the strategy revision notes and the strategy practice set. Course hub: OCR A Level Business. Printable list: checklist. Not sure where you stand? Try the free 10-minute diagnostics.
What the specification asks you to do
| Strand | You must be able to |
|---|---|
| Nature and purpose | Explain what forecasting is for; evaluate the advantages and disadvantages of forecasts to a business and its stakeholders |
| Two approaches | Distinguish qualitative from quantitative forecasting |
| Qualitative | Describe structured methods (Delphi technique, expert opinion) and unstructured methods (brainstorming, intuition); evaluate both types |
| Quantitative | Calculate and interpret financial forecasts of sales, costs, profit and cash flow |
| Variation | Explain seasonal and cyclical variations; calculate cyclical variation; analyse their impact on forecasting |
| Trends | Use correlations; extrapolate from numbers or graphs; use moving averages (odd number of years); evaluate time series analysis |
| Judgement | Recommend and justify responses to forecasts; evaluate the importance of accurate forecasting |
Nature and purpose of forecasting
A forecast is an informed estimate of what will happen to a variable in the future, such as sales, costs, profit, cash flow or demand. Its purpose is to reduce uncertainty so that managers can plan: how much to produce, how many staff to hire, how much finance to arrange, and whether a strategy is likely to reach its objectives.
Advantages of forecasts. They support planning and budgeting, give early warning of problems such as a cash shortfall, give lenders and investors evidence for a funding decision, and let actual results be compared with expectations.
Disadvantages. Every forecast rests on assumptions, and the future can differ from the past. Collecting data and building models costs time and money. A precise-looking forecast can create false confidence, so a business may over-order stock or over-hire.
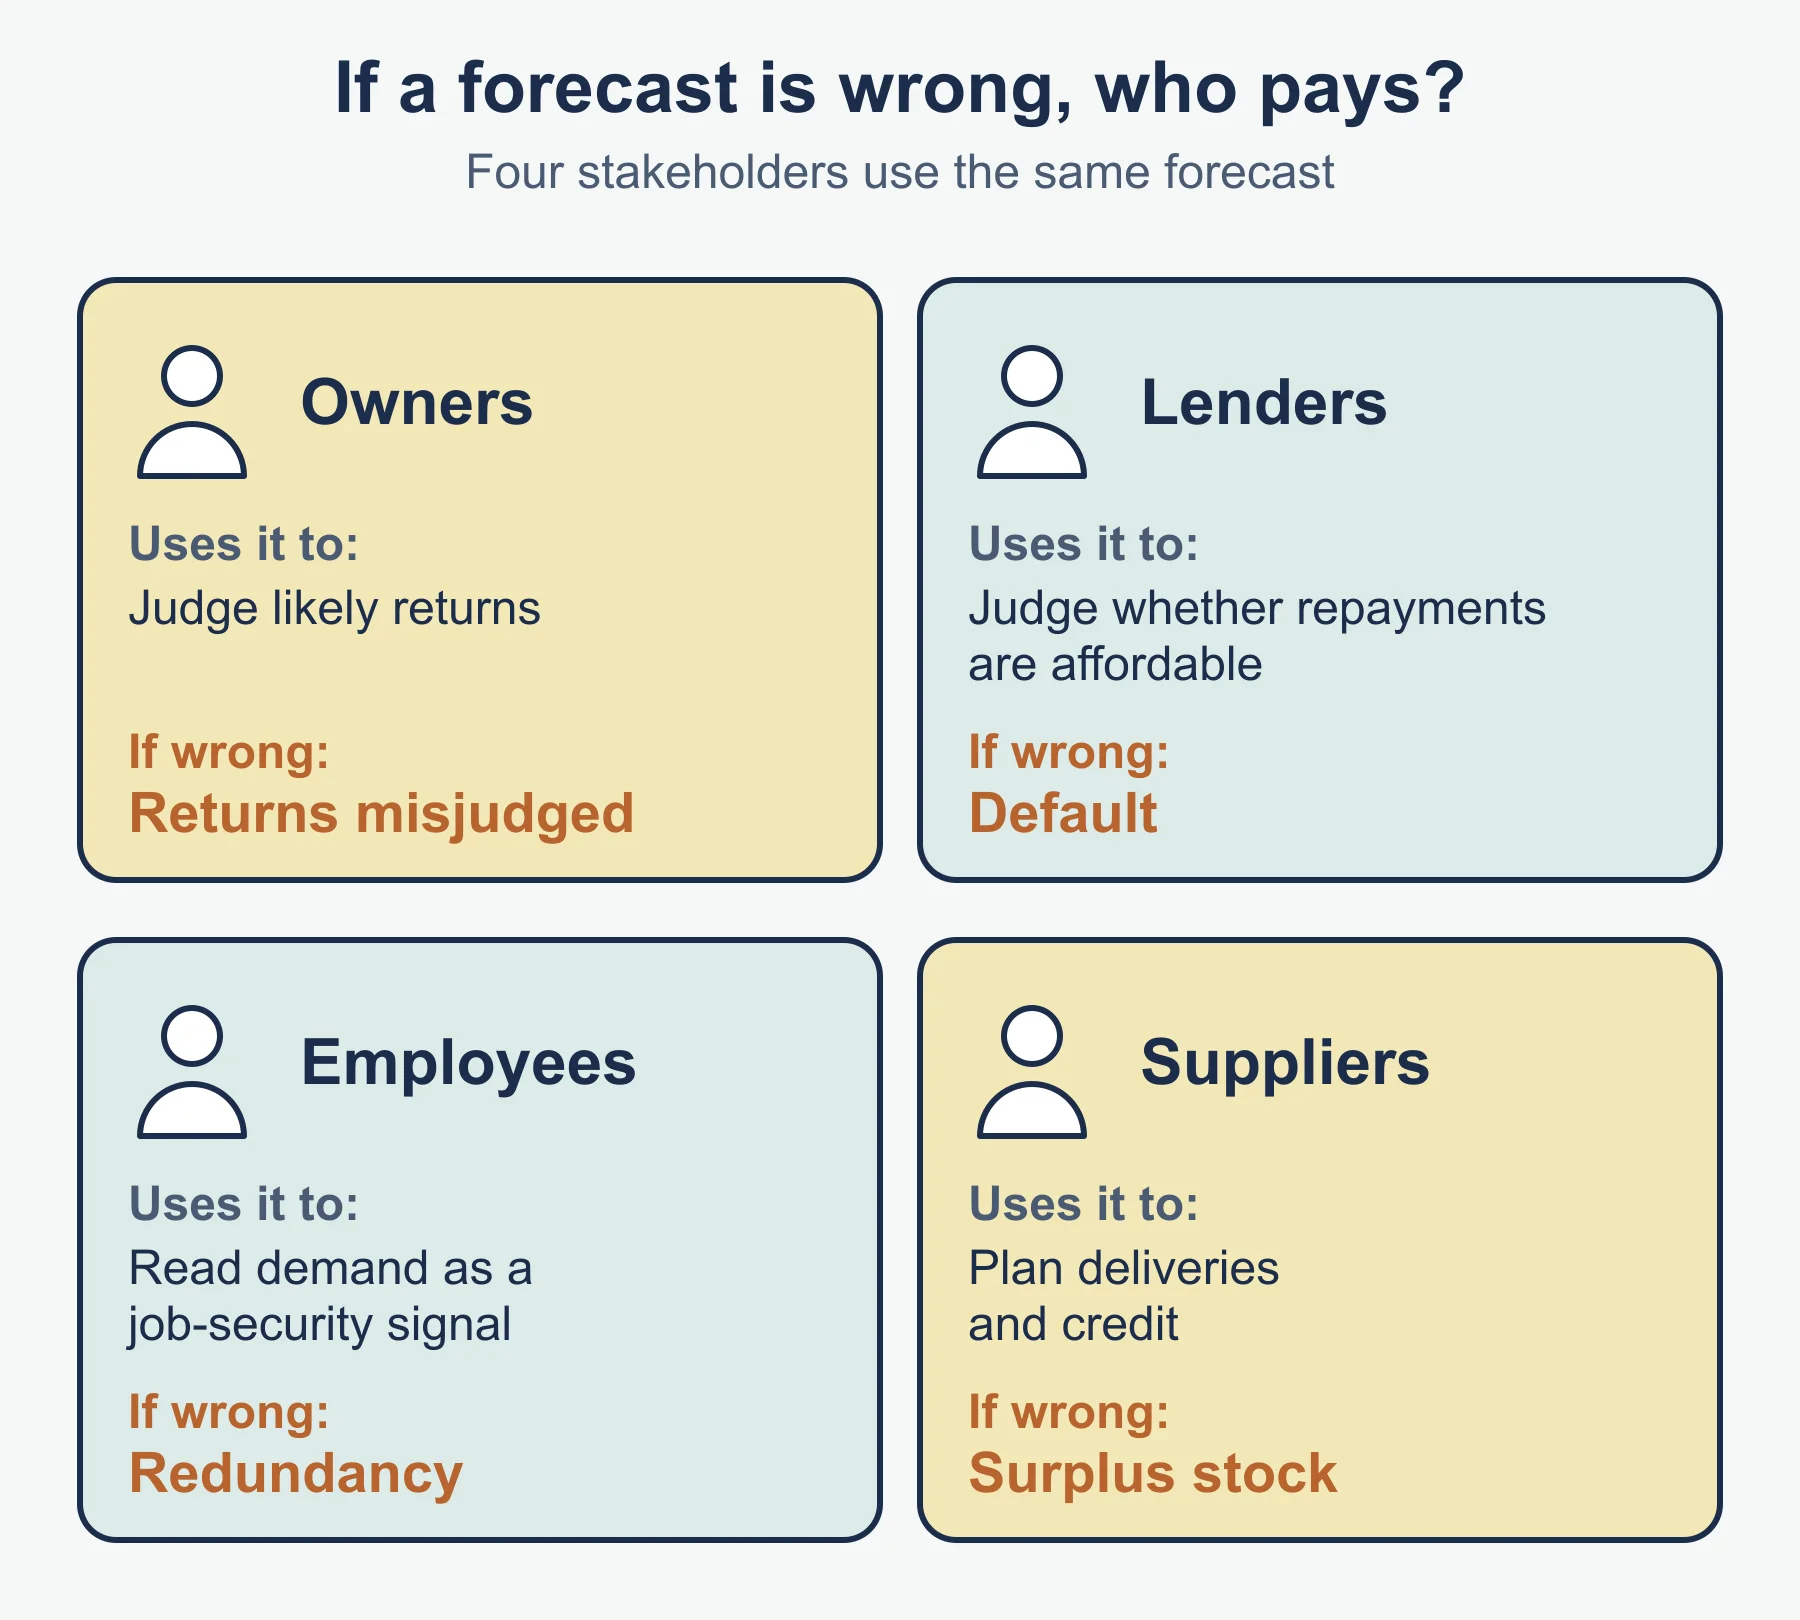
Stakeholders. Owners use forecasts to judge likely returns. Lenders use cash-flow forecasts to judge whether repayments are affordable. Employees read forecast demand as a signal of job security. Suppliers use forecasts to plan deliveries and credit. If forecasts are wrong, each group bears a cost: lenders face default, suppliers hold surplus stock, employees may face redundancy.
Qualitative and quantitative forecasting
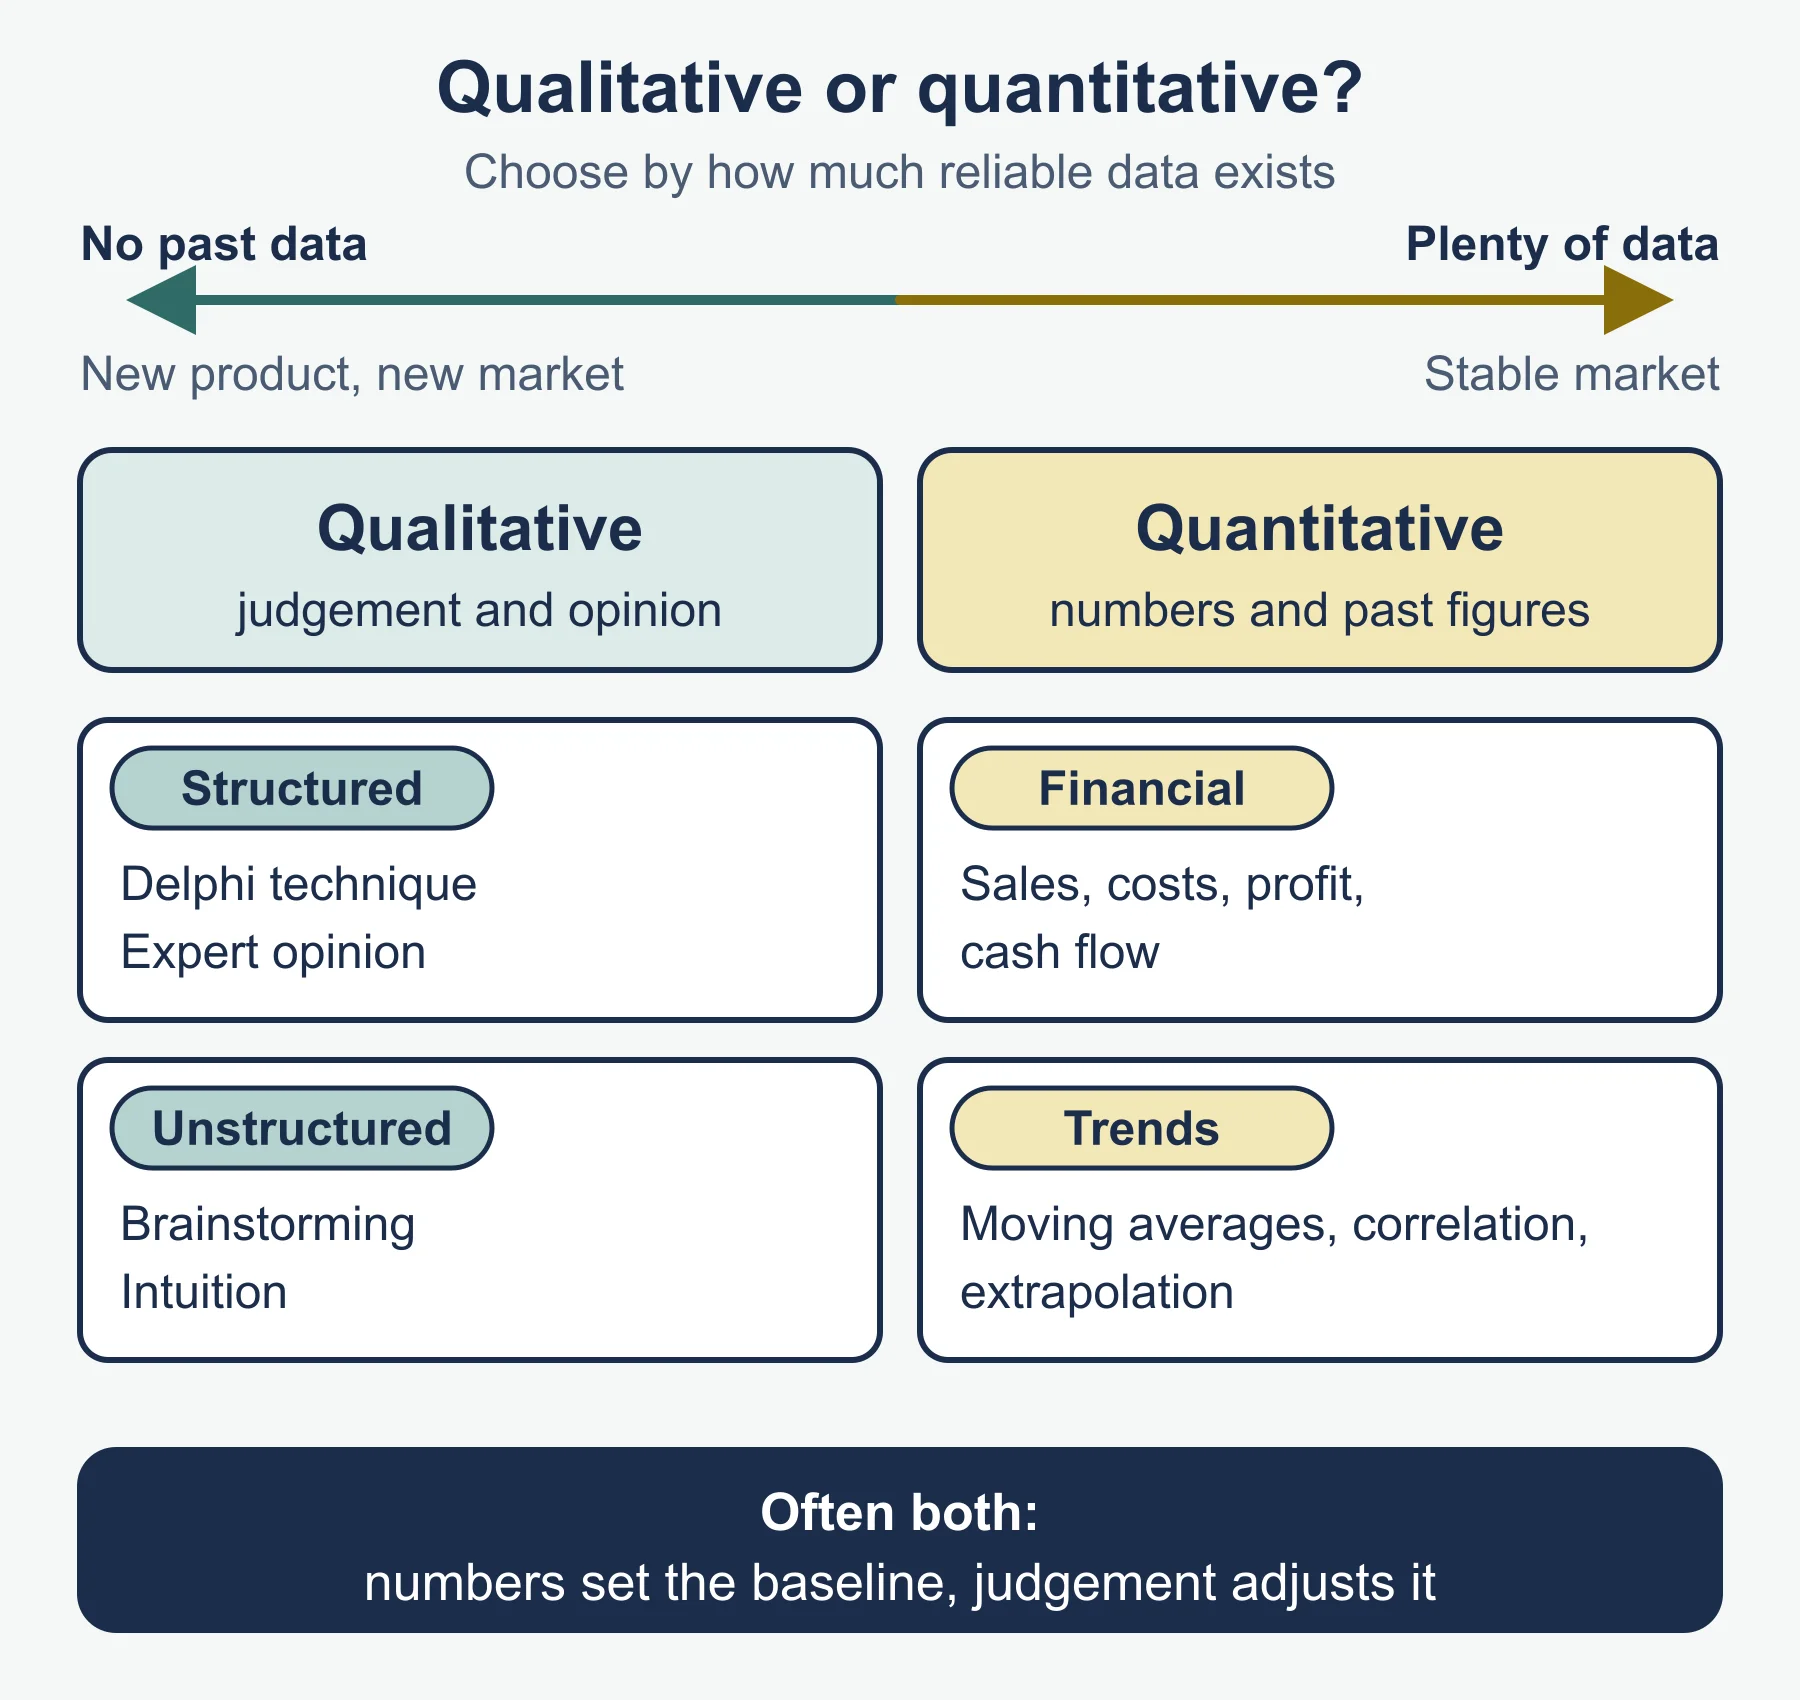
Qualitative forecasting relies on judgement, opinion and experience. It suits situations with no reliable history, such as a new product or a new market. Quantitative forecasting uses numerical data and calculation, usually past figures. It suits stable markets with plenty of data. Many businesses use both: numbers set the baseline and judgement adjusts it for things the numbers cannot see.
Qualitative methods
Structured methods follow a defined process.
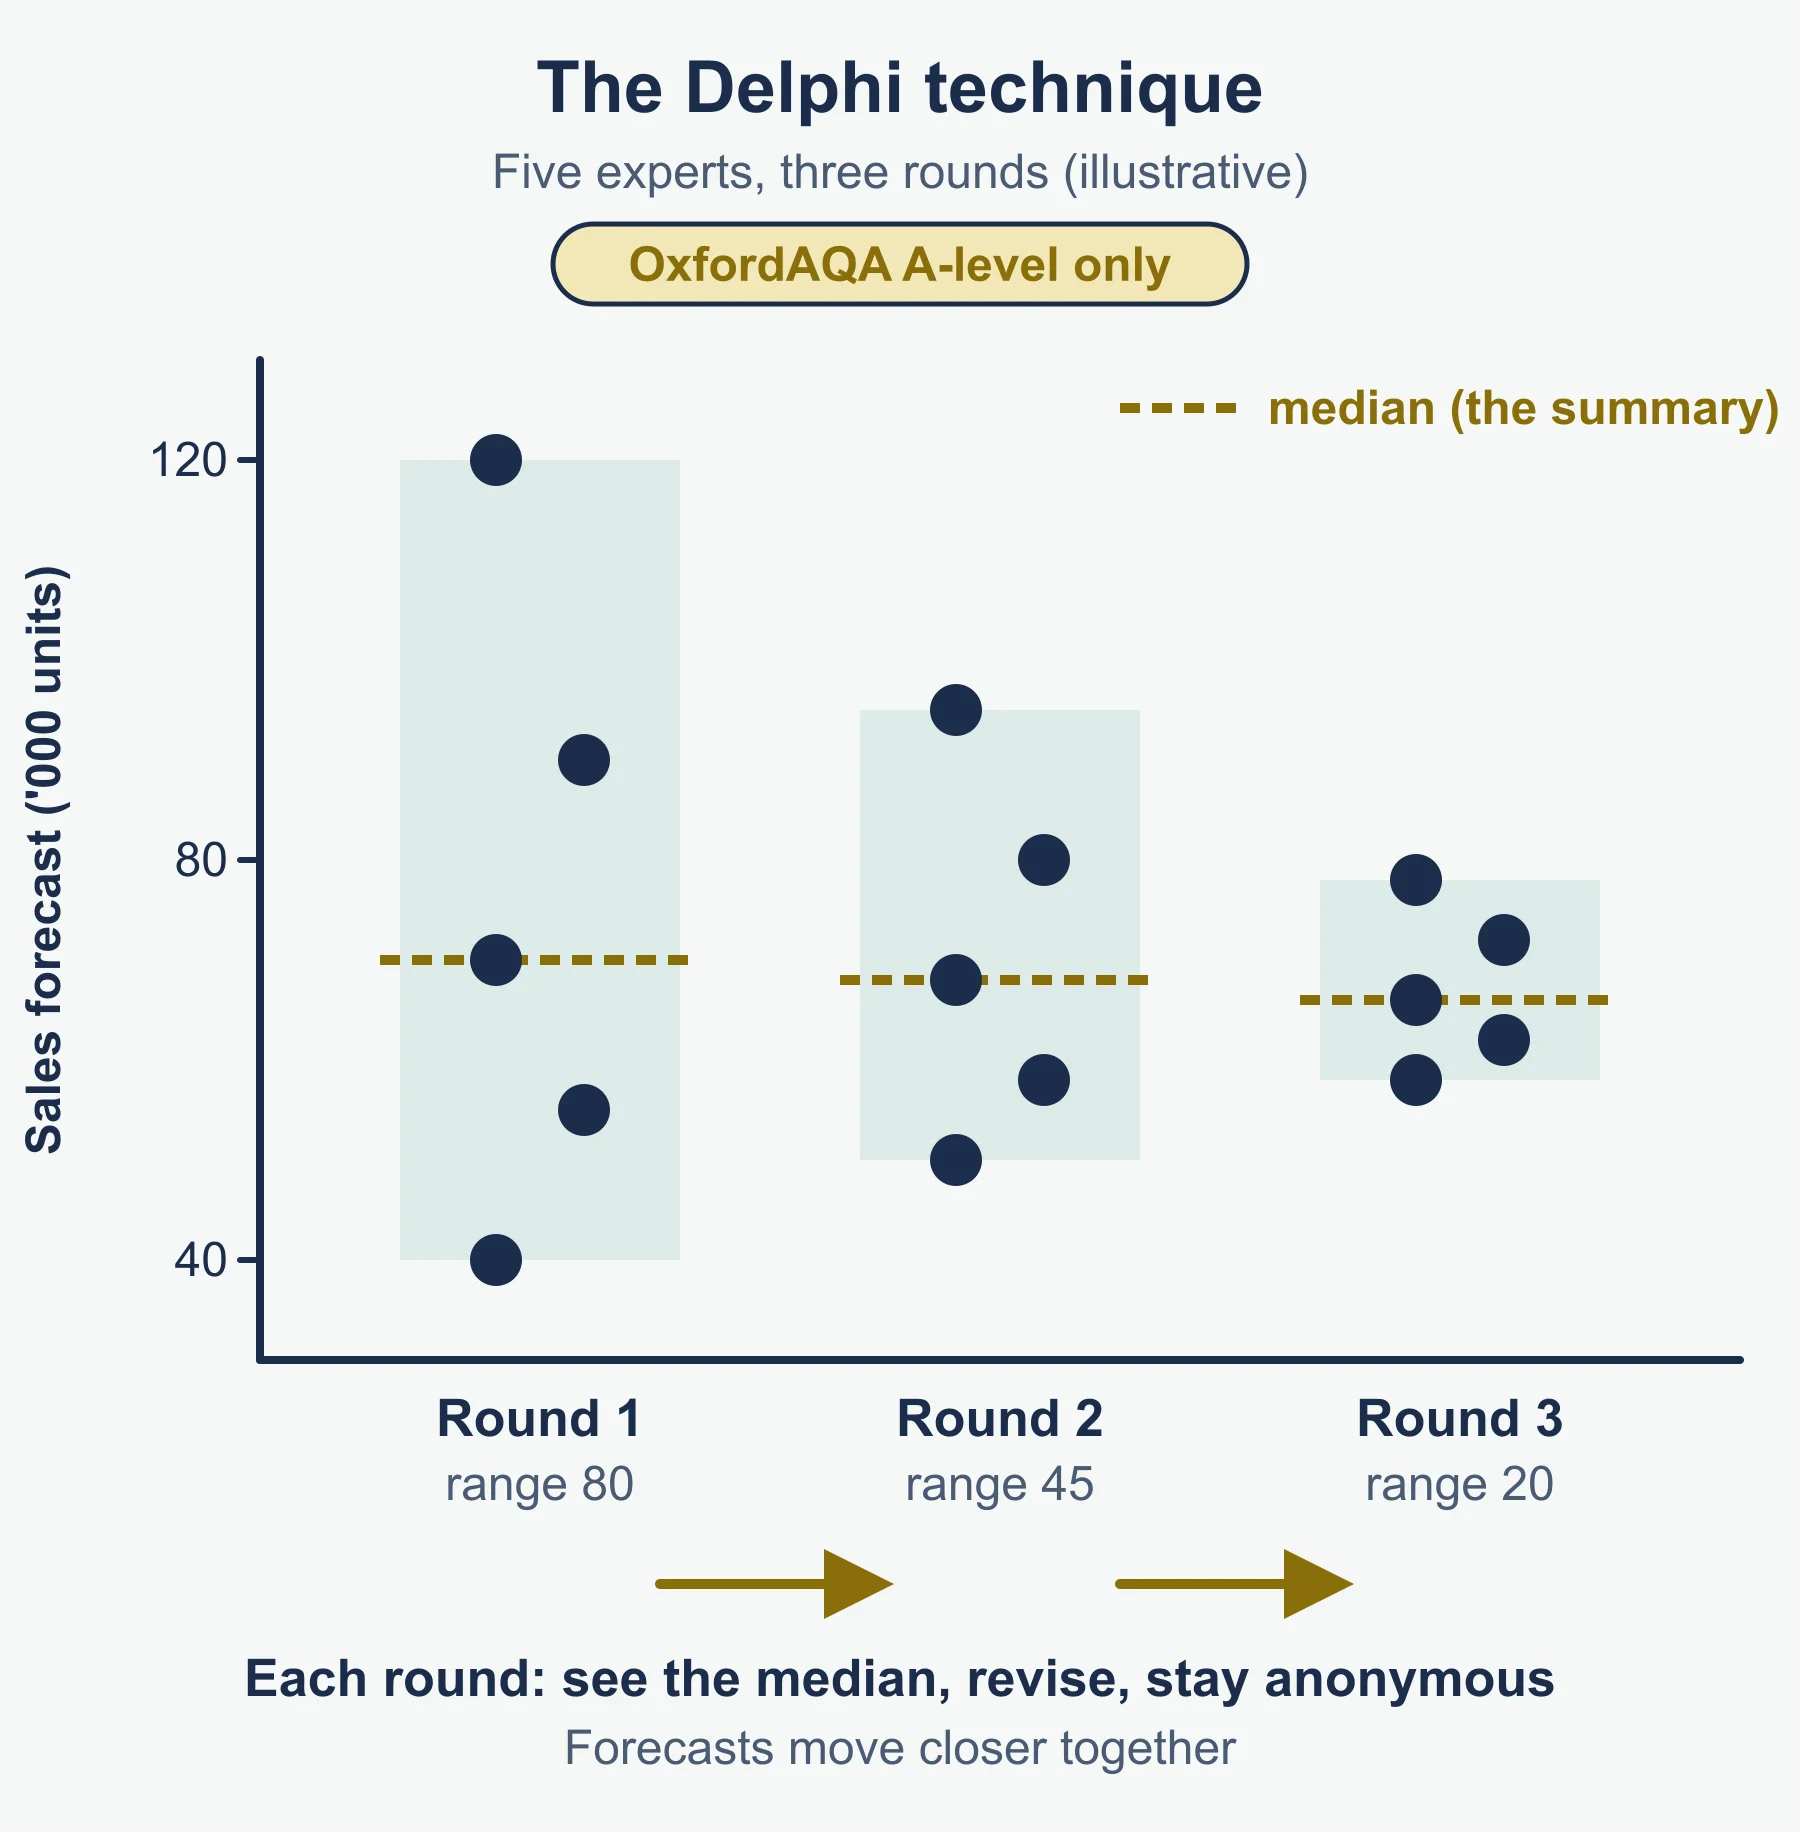
- Delphi technique. A panel of experts answers questions separately, usually anonymously. A coordinator circulates a summary of the answers, and the experts revise their views over several rounds until opinion converges.
- Expert opinion. The business asks one or more specialists, such as an industry consultant, for a view. It is quicker than Delphi but depends on one person’s judgement.
Unstructured methods have no fixed procedure.
- Brainstorming. A group generates as many ideas or predictions as it can, without early criticism.
- Intuition. A manager relies on gut feeling built from experience.
Evaluation. Structured methods are more systematic, less affected by individual bias and easier to defend to stakeholders, but they take longer and cost more, and experts can all be wrong together. Unstructured methods are cheap, fast and flexible, and work where there is no data, but they are subjective and hard to check. Intuition is only as good as the manager’s experience and can be overconfident. The best choice depends on the cost of an error, the time available and how novel the decision is.
Financial forecasts: sales, costs, profit and cash flow
Worked example: Burnsall Joinery. Burnsall sells fitted wardrobes at £240 each. Variable cost is £95 per wardrobe and fixed costs are £18,000 a month. Forecast units for four months are 150, 170, 160 and 210.
Standard forms: sales revenue = units × price; total costs = fixed costs + variable costs; profit = sales revenue − total costs.
| Month | Units | Sales revenue (£) | Variable costs (£) | Fixed costs (£) | Profit (£) |
|---|---|---|---|---|---|
| 1 | 150 | 36,000 | 14,250 | 18,000 | 3,750 |
| 2 | 170 | 40,800 | 16,150 | 18,000 | 6,650 |
| 3 | 160 | 38,400 | 15,200 | 18,000 | 5,200 |
| 4 | 210 | 50,400 | 19,950 | 18,000 | 12,450 |
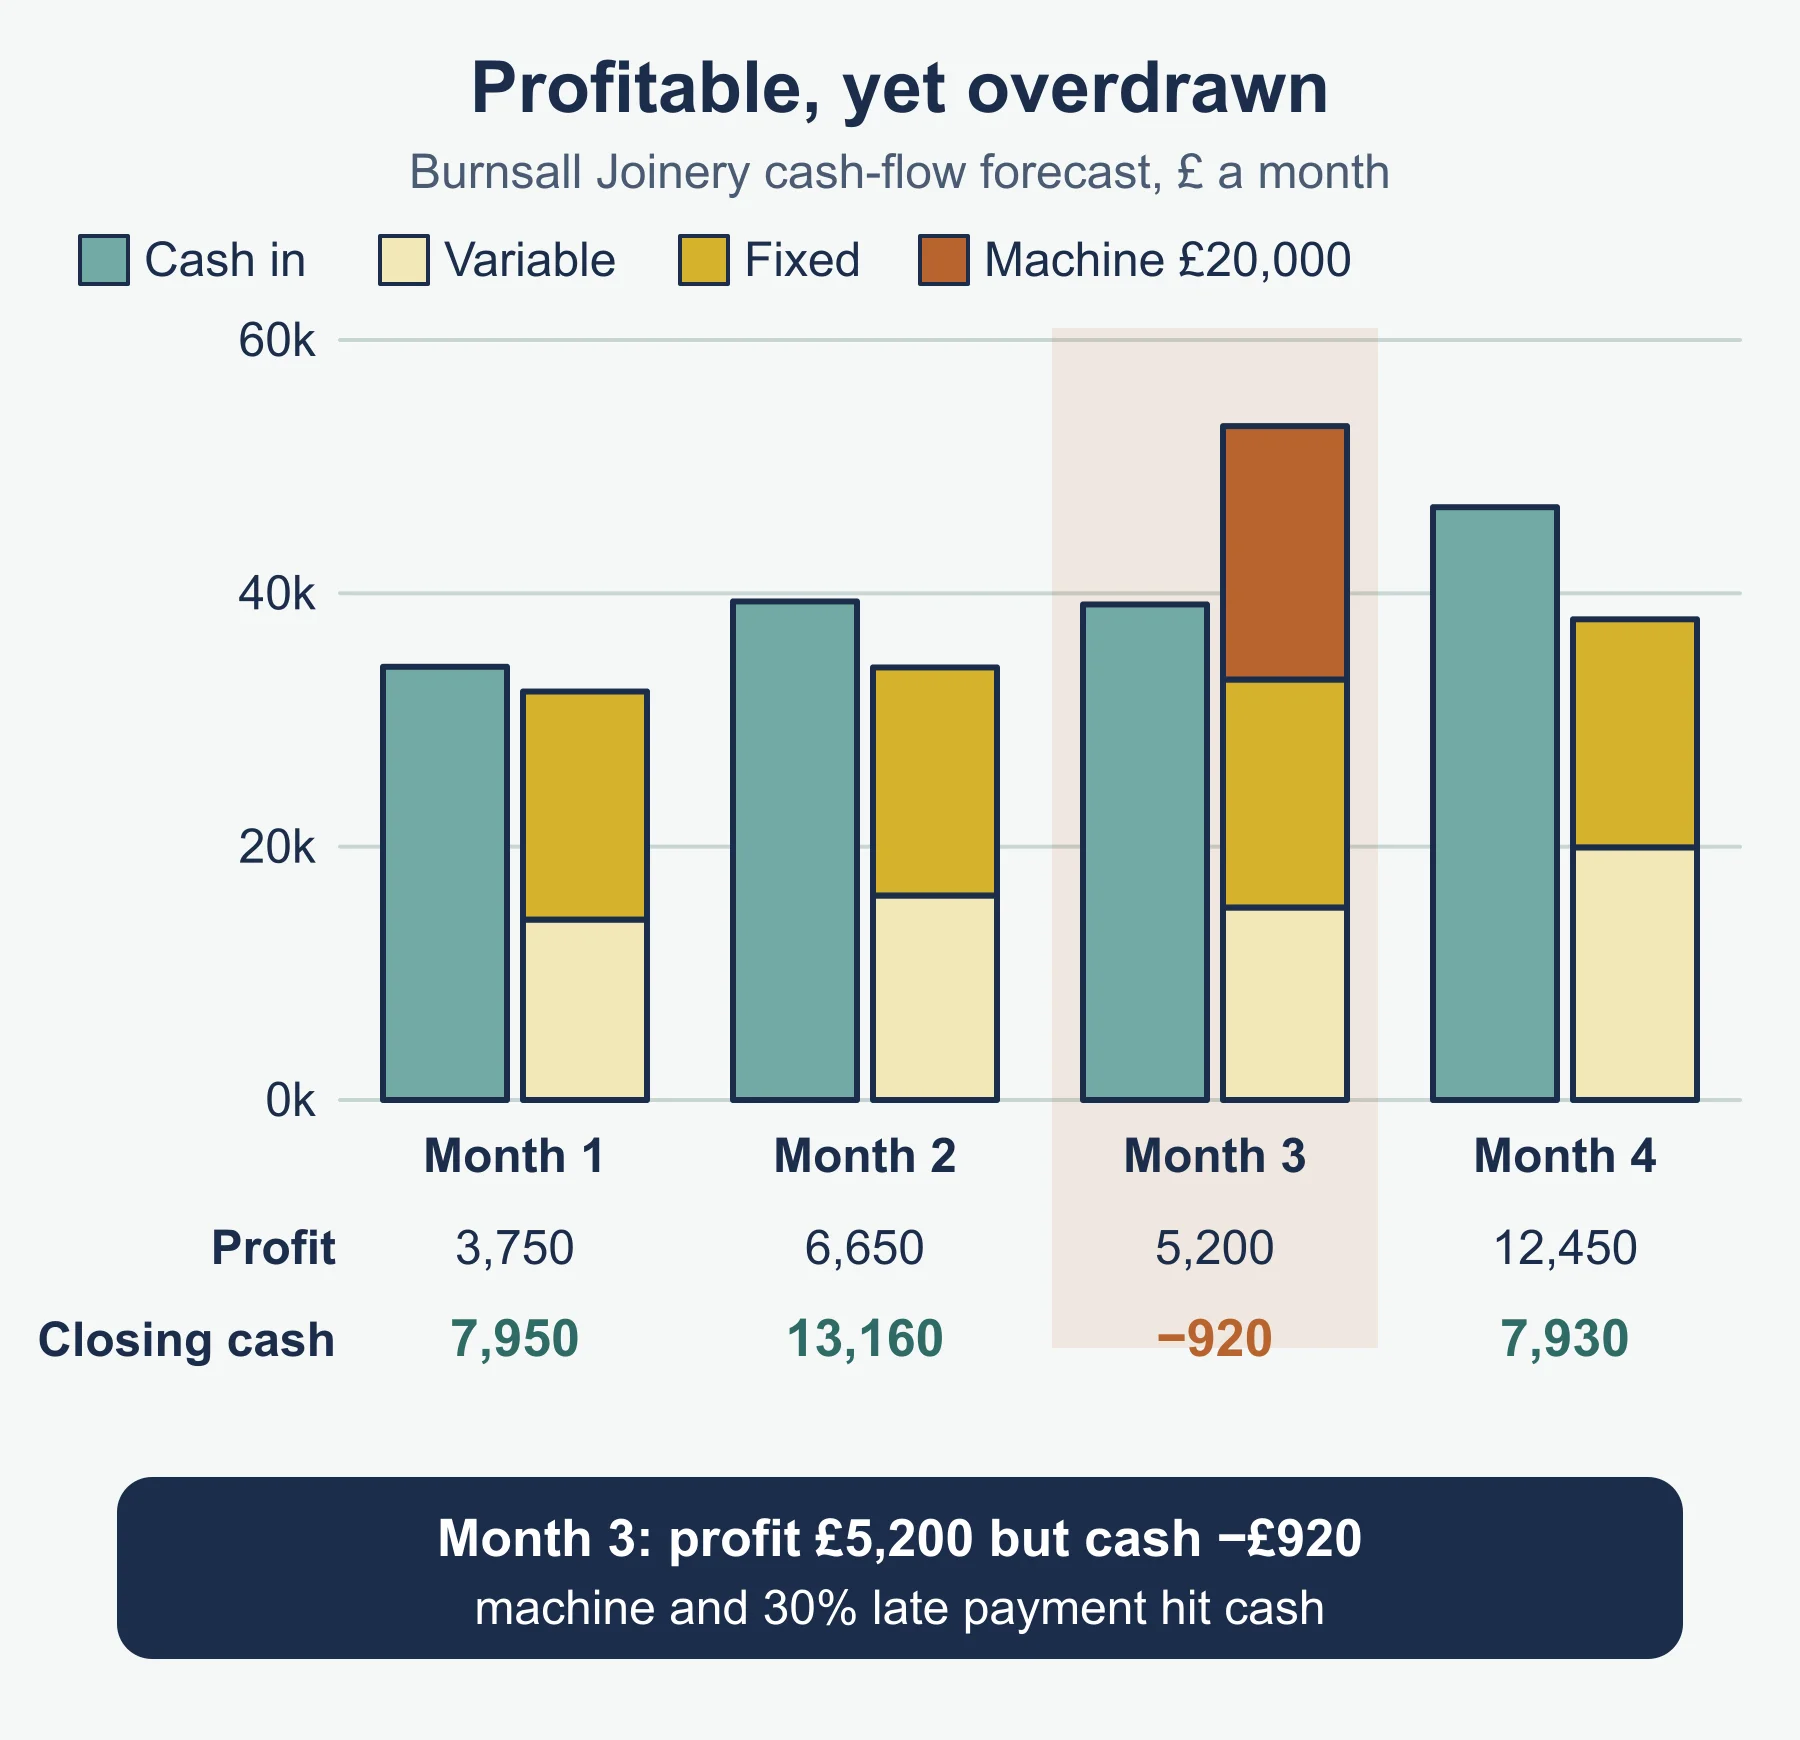
Now the cash-flow forecast. Customers pay 70% of a month’s sales in that month and 30% the month after. The previous month’s sales were £30,000. Costs are paid in the month incurred. Burnsall plans to buy a £20,000 machine in month 3. Opening cash in month 1 is £6,000.
Month 1 cash in: 0.7 × 36,000 + 0.3 × 30,000 = 25,200 + 9,000 = 34,200. Month 2: 28,560 + 10,800 = 39,360. Month 3: 26,880 + 12,240 = 39,120. Month 4: 35,280 + 11,520 = 46,800.
| Month | Opening (£) | Cash in (£) | Cash out (£) | Net (£) | Closing (£) |
|---|---|---|---|---|---|
| 1 | 6,000 | 34,200 | 32,250 | 1,950 | 7,950 |
| 2 | 7,950 | 39,360 | 34,150 | 5,210 | 13,160 |
| 3 | 13,160 | 39,120 | 53,200 | −14,080 | −920 |
| 4 | −920 | 46,800 | 37,950 | 8,850 | 7,930 |
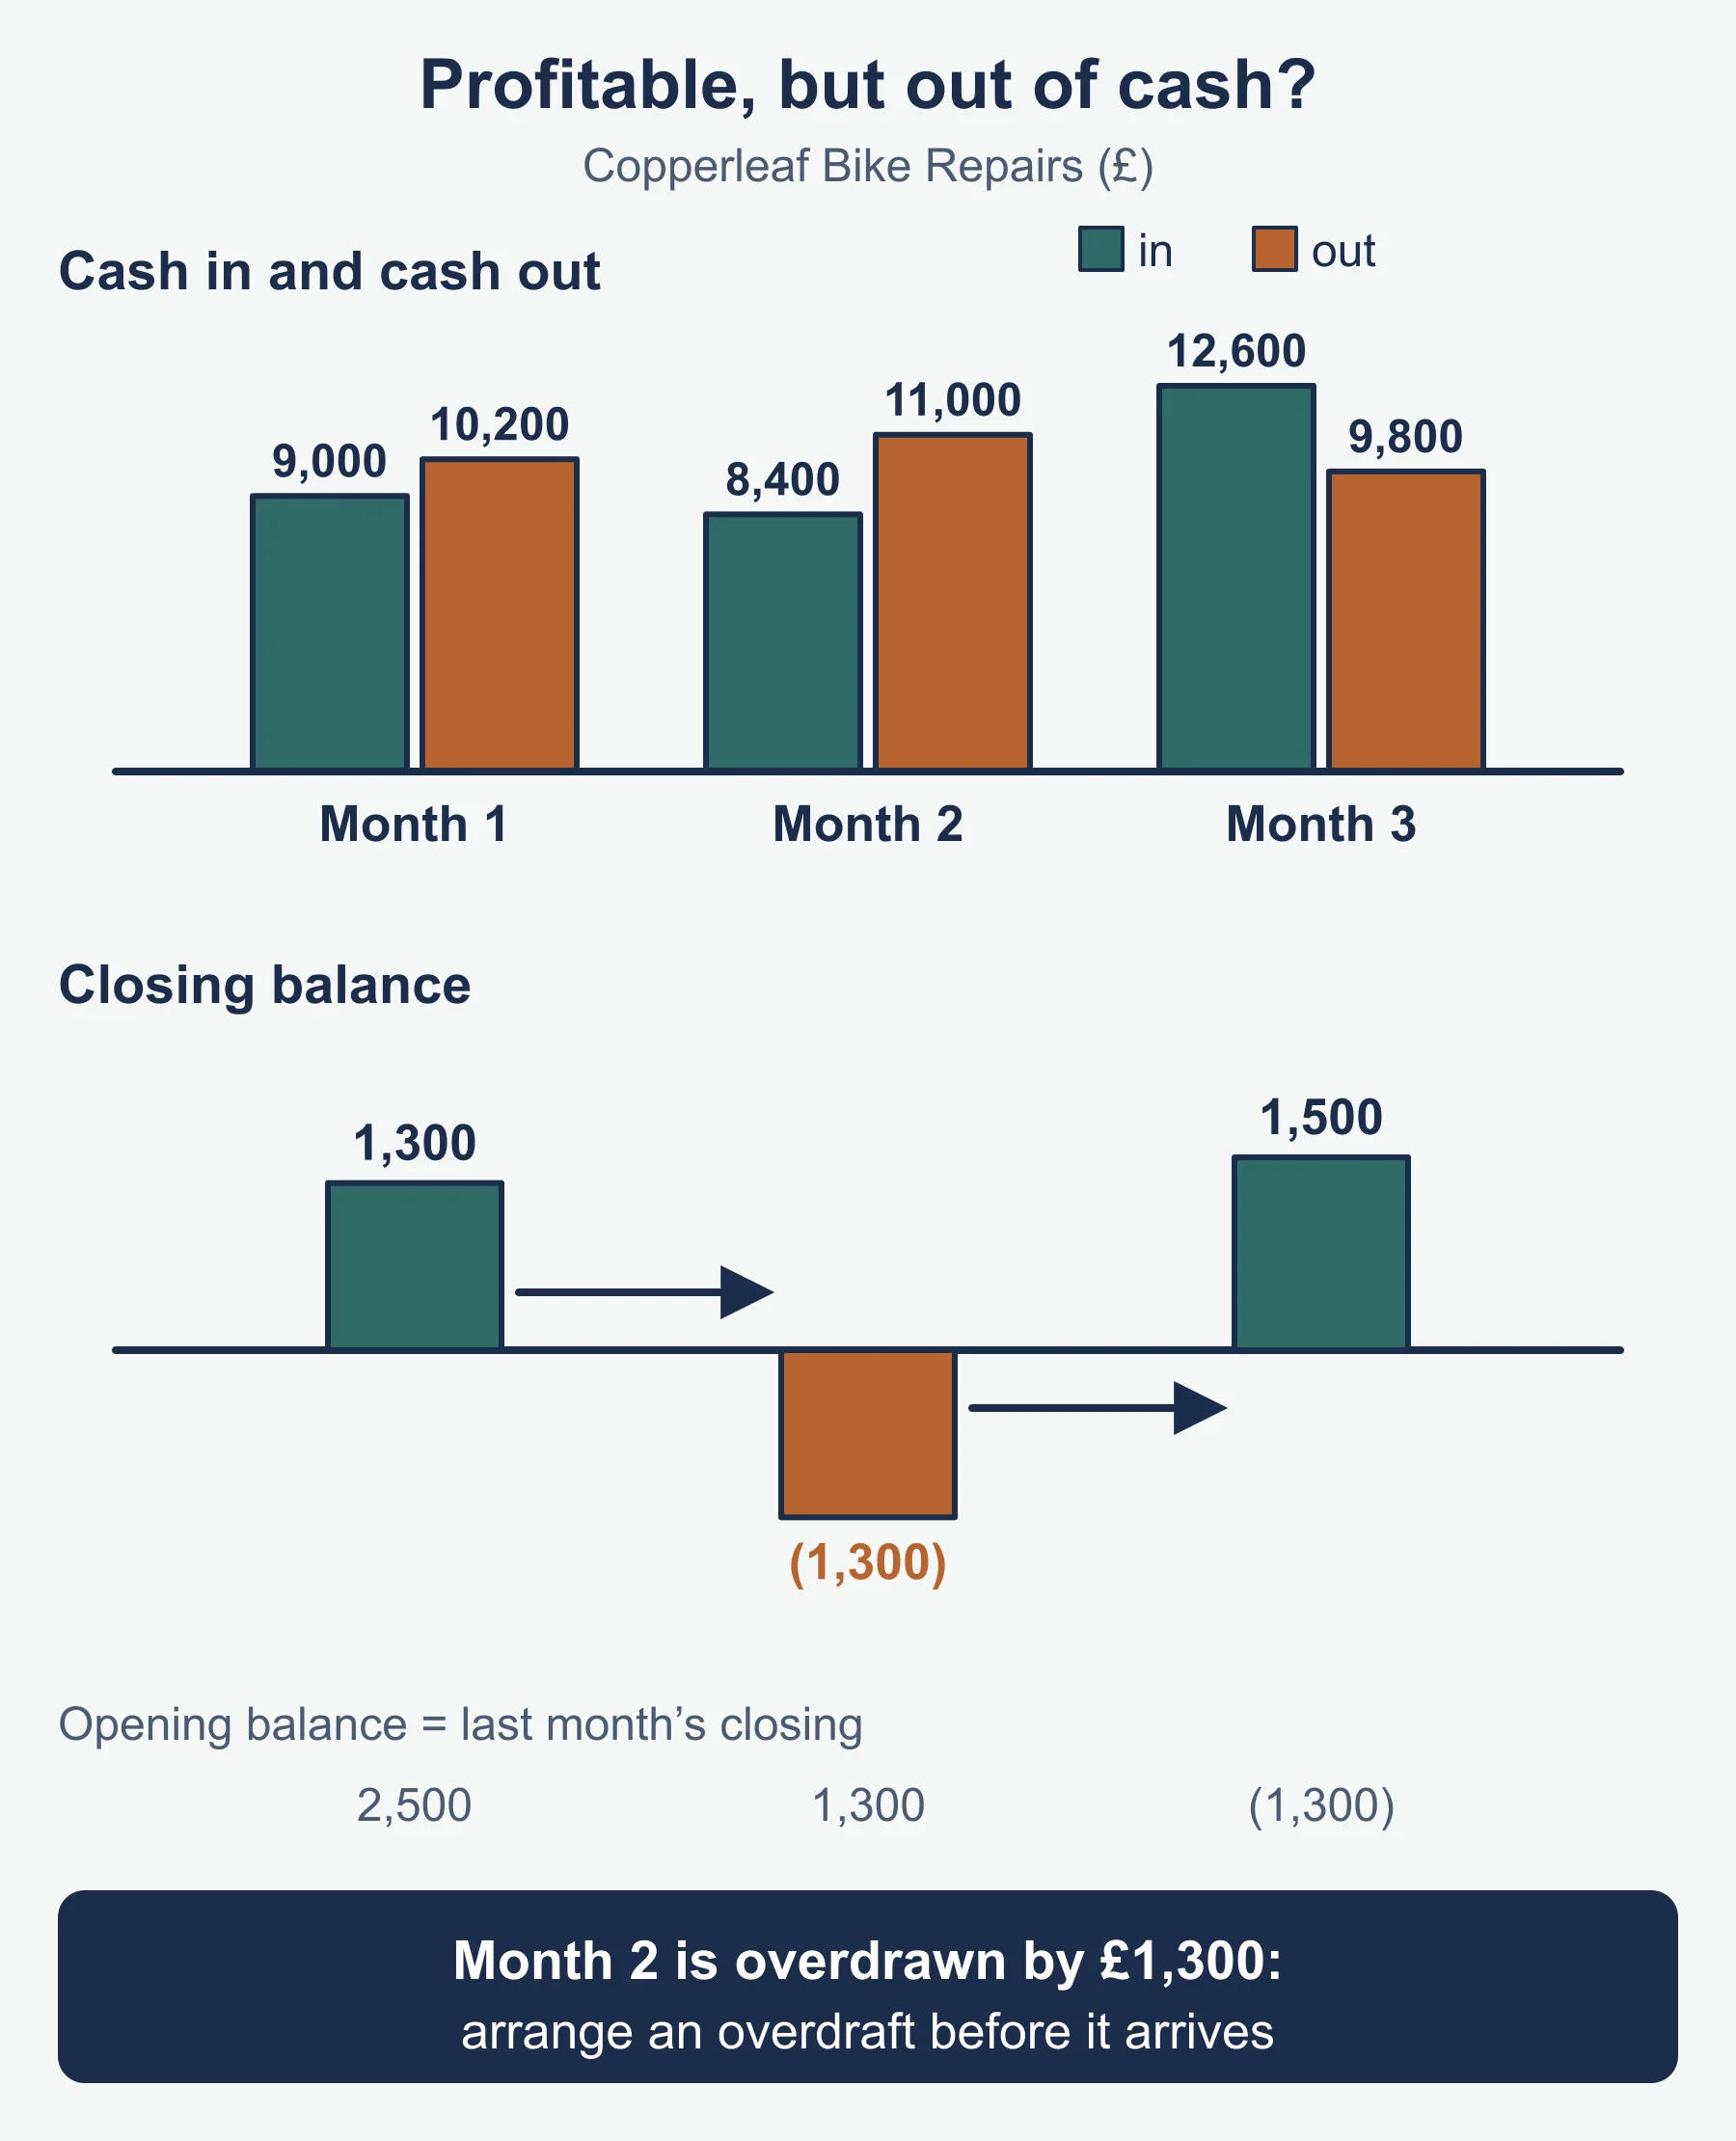
Interpretation. Month 3 is profitable (£5,200) yet closes £920 overdrawn. Profit is not cash: the machine is a cash outflow that does not appear in a month’s profit calculation, and 30% of sales arrive a month late. The forecast warns Burnsall in advance. It could negotiate an overdraft, lease the machine, or delay the purchase to month 4.
Seasonal and cyclical variations
Seasonal variation is a regular, repeating pattern within a year, linked to weather, holidays or the calendar. Cyclical variation is a longer pattern, over several years, linked to the economic cycle or an industry cycle of boom, slowdown, recession and recovery. Both sit around an underlying trend, the long-run direction of the data.
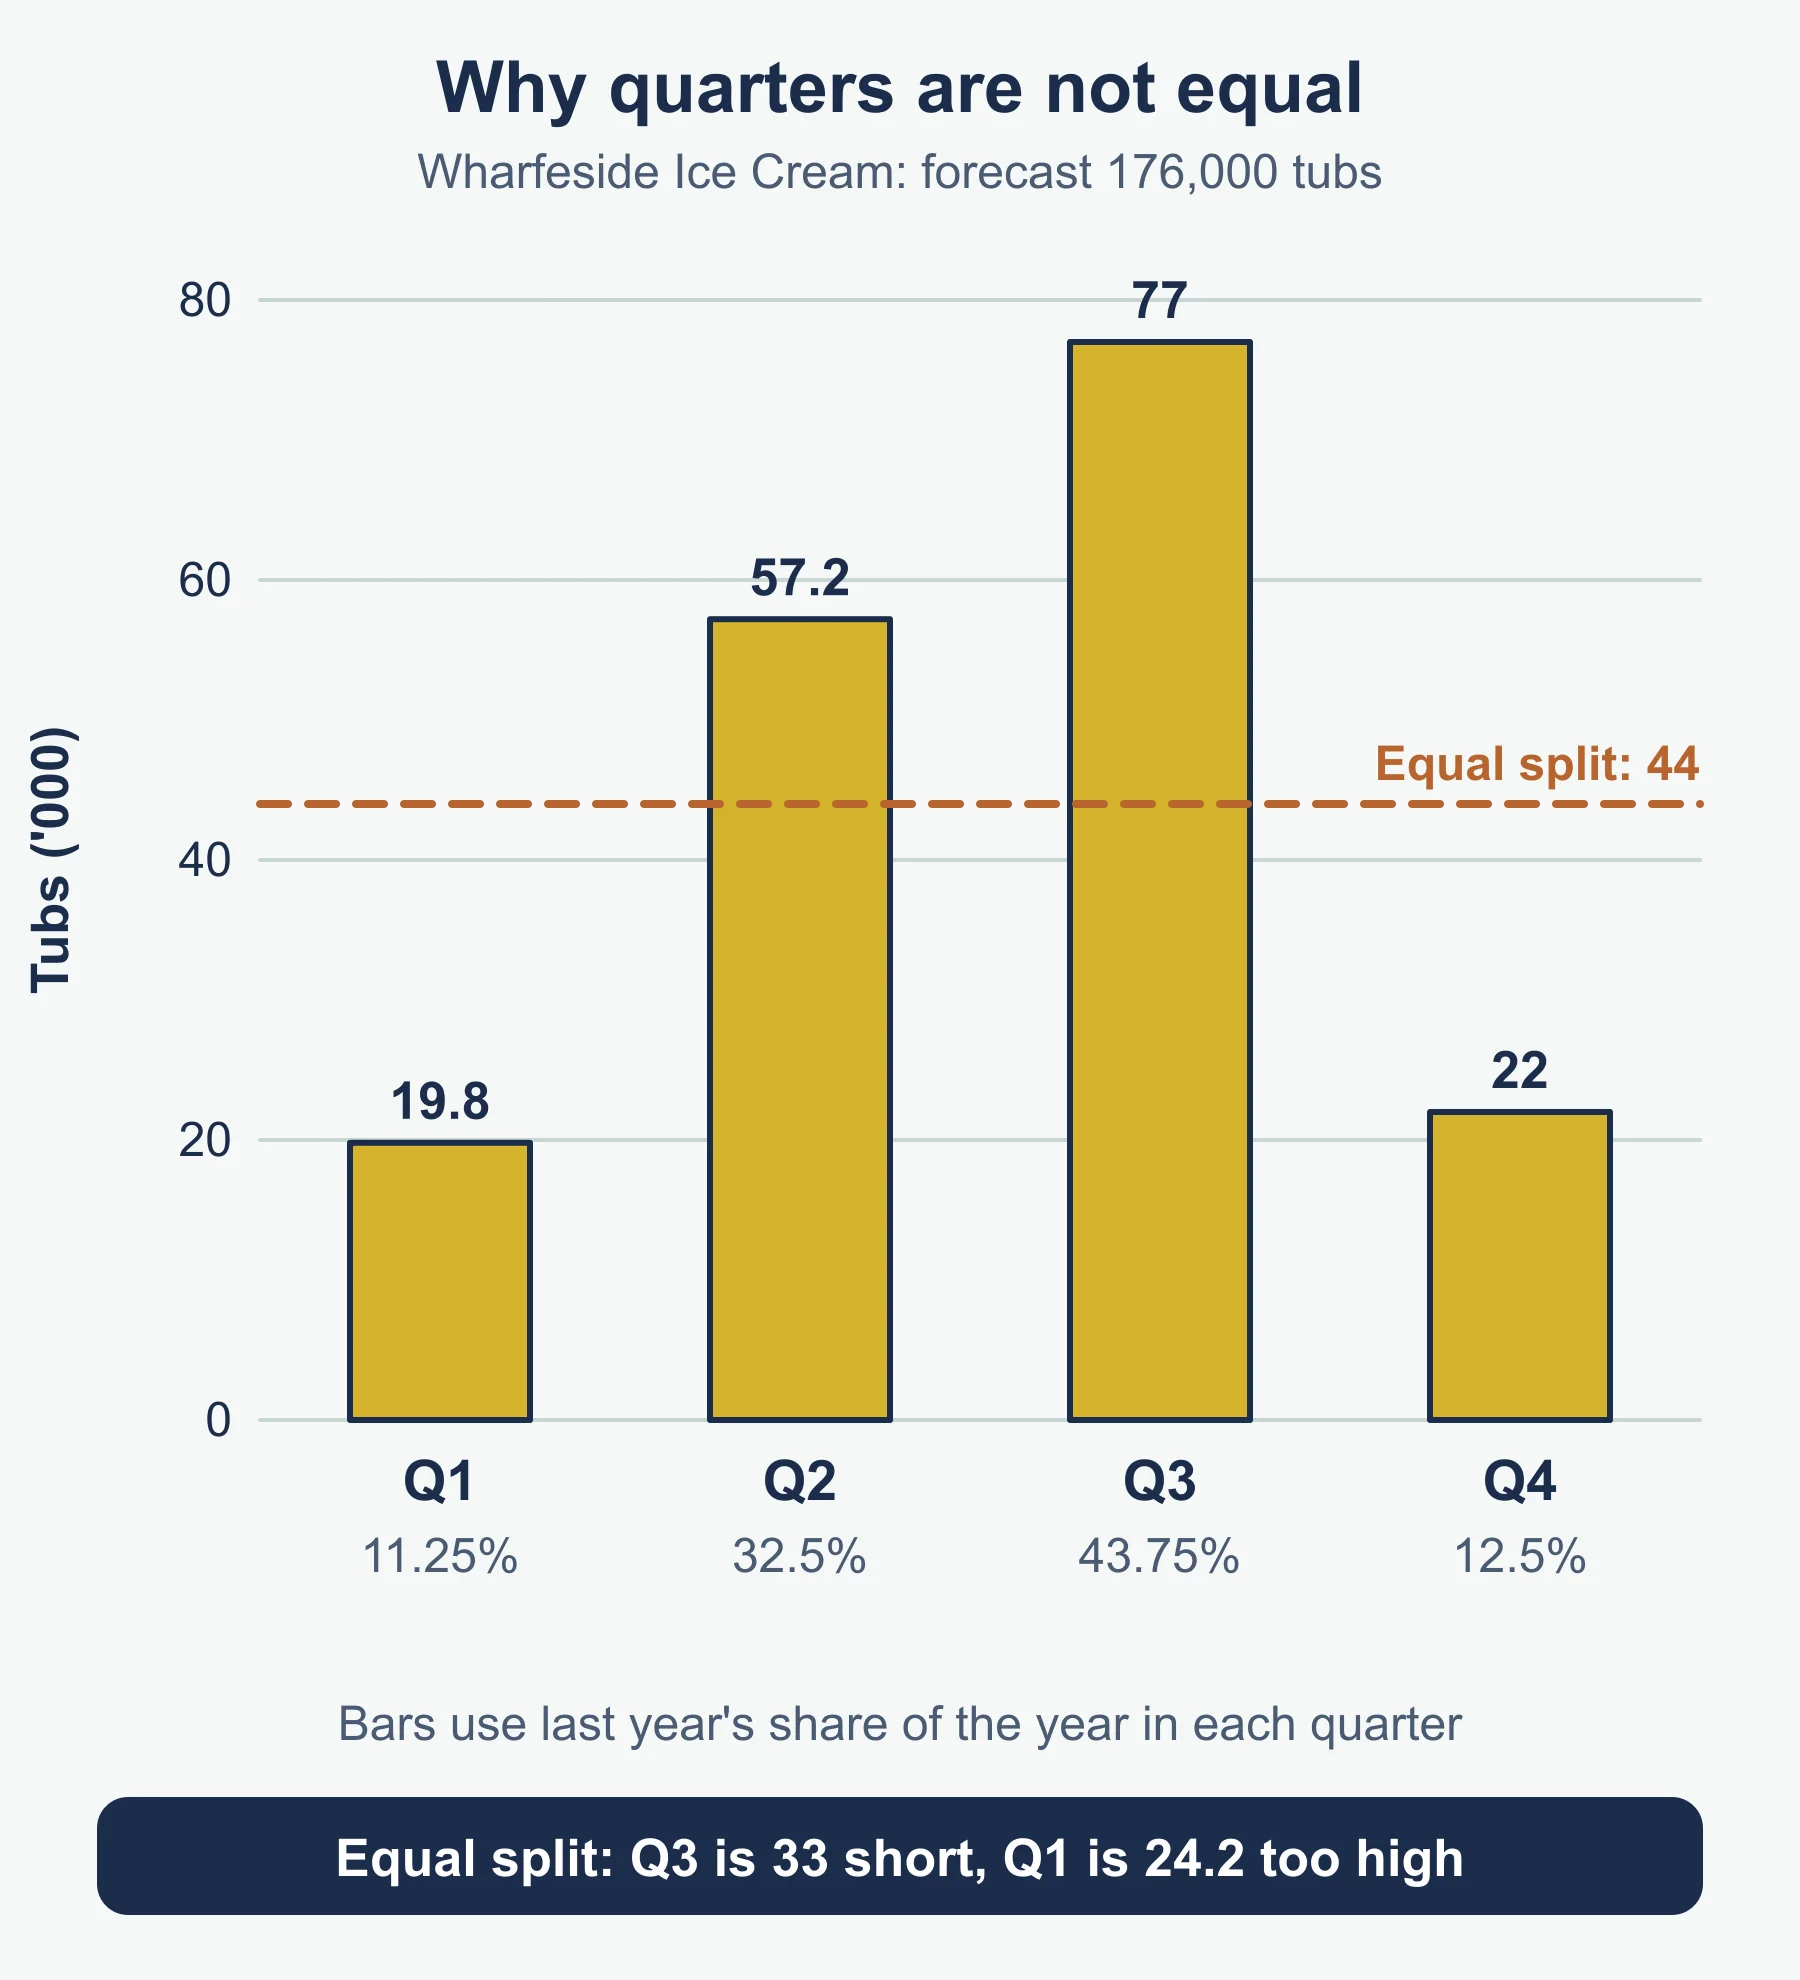
Seasonal example: Wharfeside Ice Cream. Annual sales were 160,000 tubs, split by quarter as 18, 52, 70 and 20 thousand. The quarterly average is 40,000, so the deviations from average are −22, +12, +30 and −20. As shares of the year: 11.25%, 32.5%, 43.75% and 12.5%. If the forecast for next year is 176,000 tubs, applying the same shares gives 19,800, 57,200, 77,000 and 22,000. A forecast that simply divided 176,000 by four would give 44,000 a quarter and badly misjudge staffing and stock. This share method is a simple illustration of allowing for seasonality, not a method named by the specification.
Calculating cyclical variation. A moving average smooths out short-term movement to show the trend. The standard form is: cyclical variation = actual value − trend value (the moving average). A positive figure means the year was above trend, a negative figure below.
Impact on forecasting. Ignoring seasonality makes quarterly or monthly forecasts wrong even if the annual total is right. Ignoring the cycle makes a boom look like permanent growth, so a business may expand just before a downturn. Cycles vary in length, so the next peak or trough is hard to date.
Time series analysis: moving averages
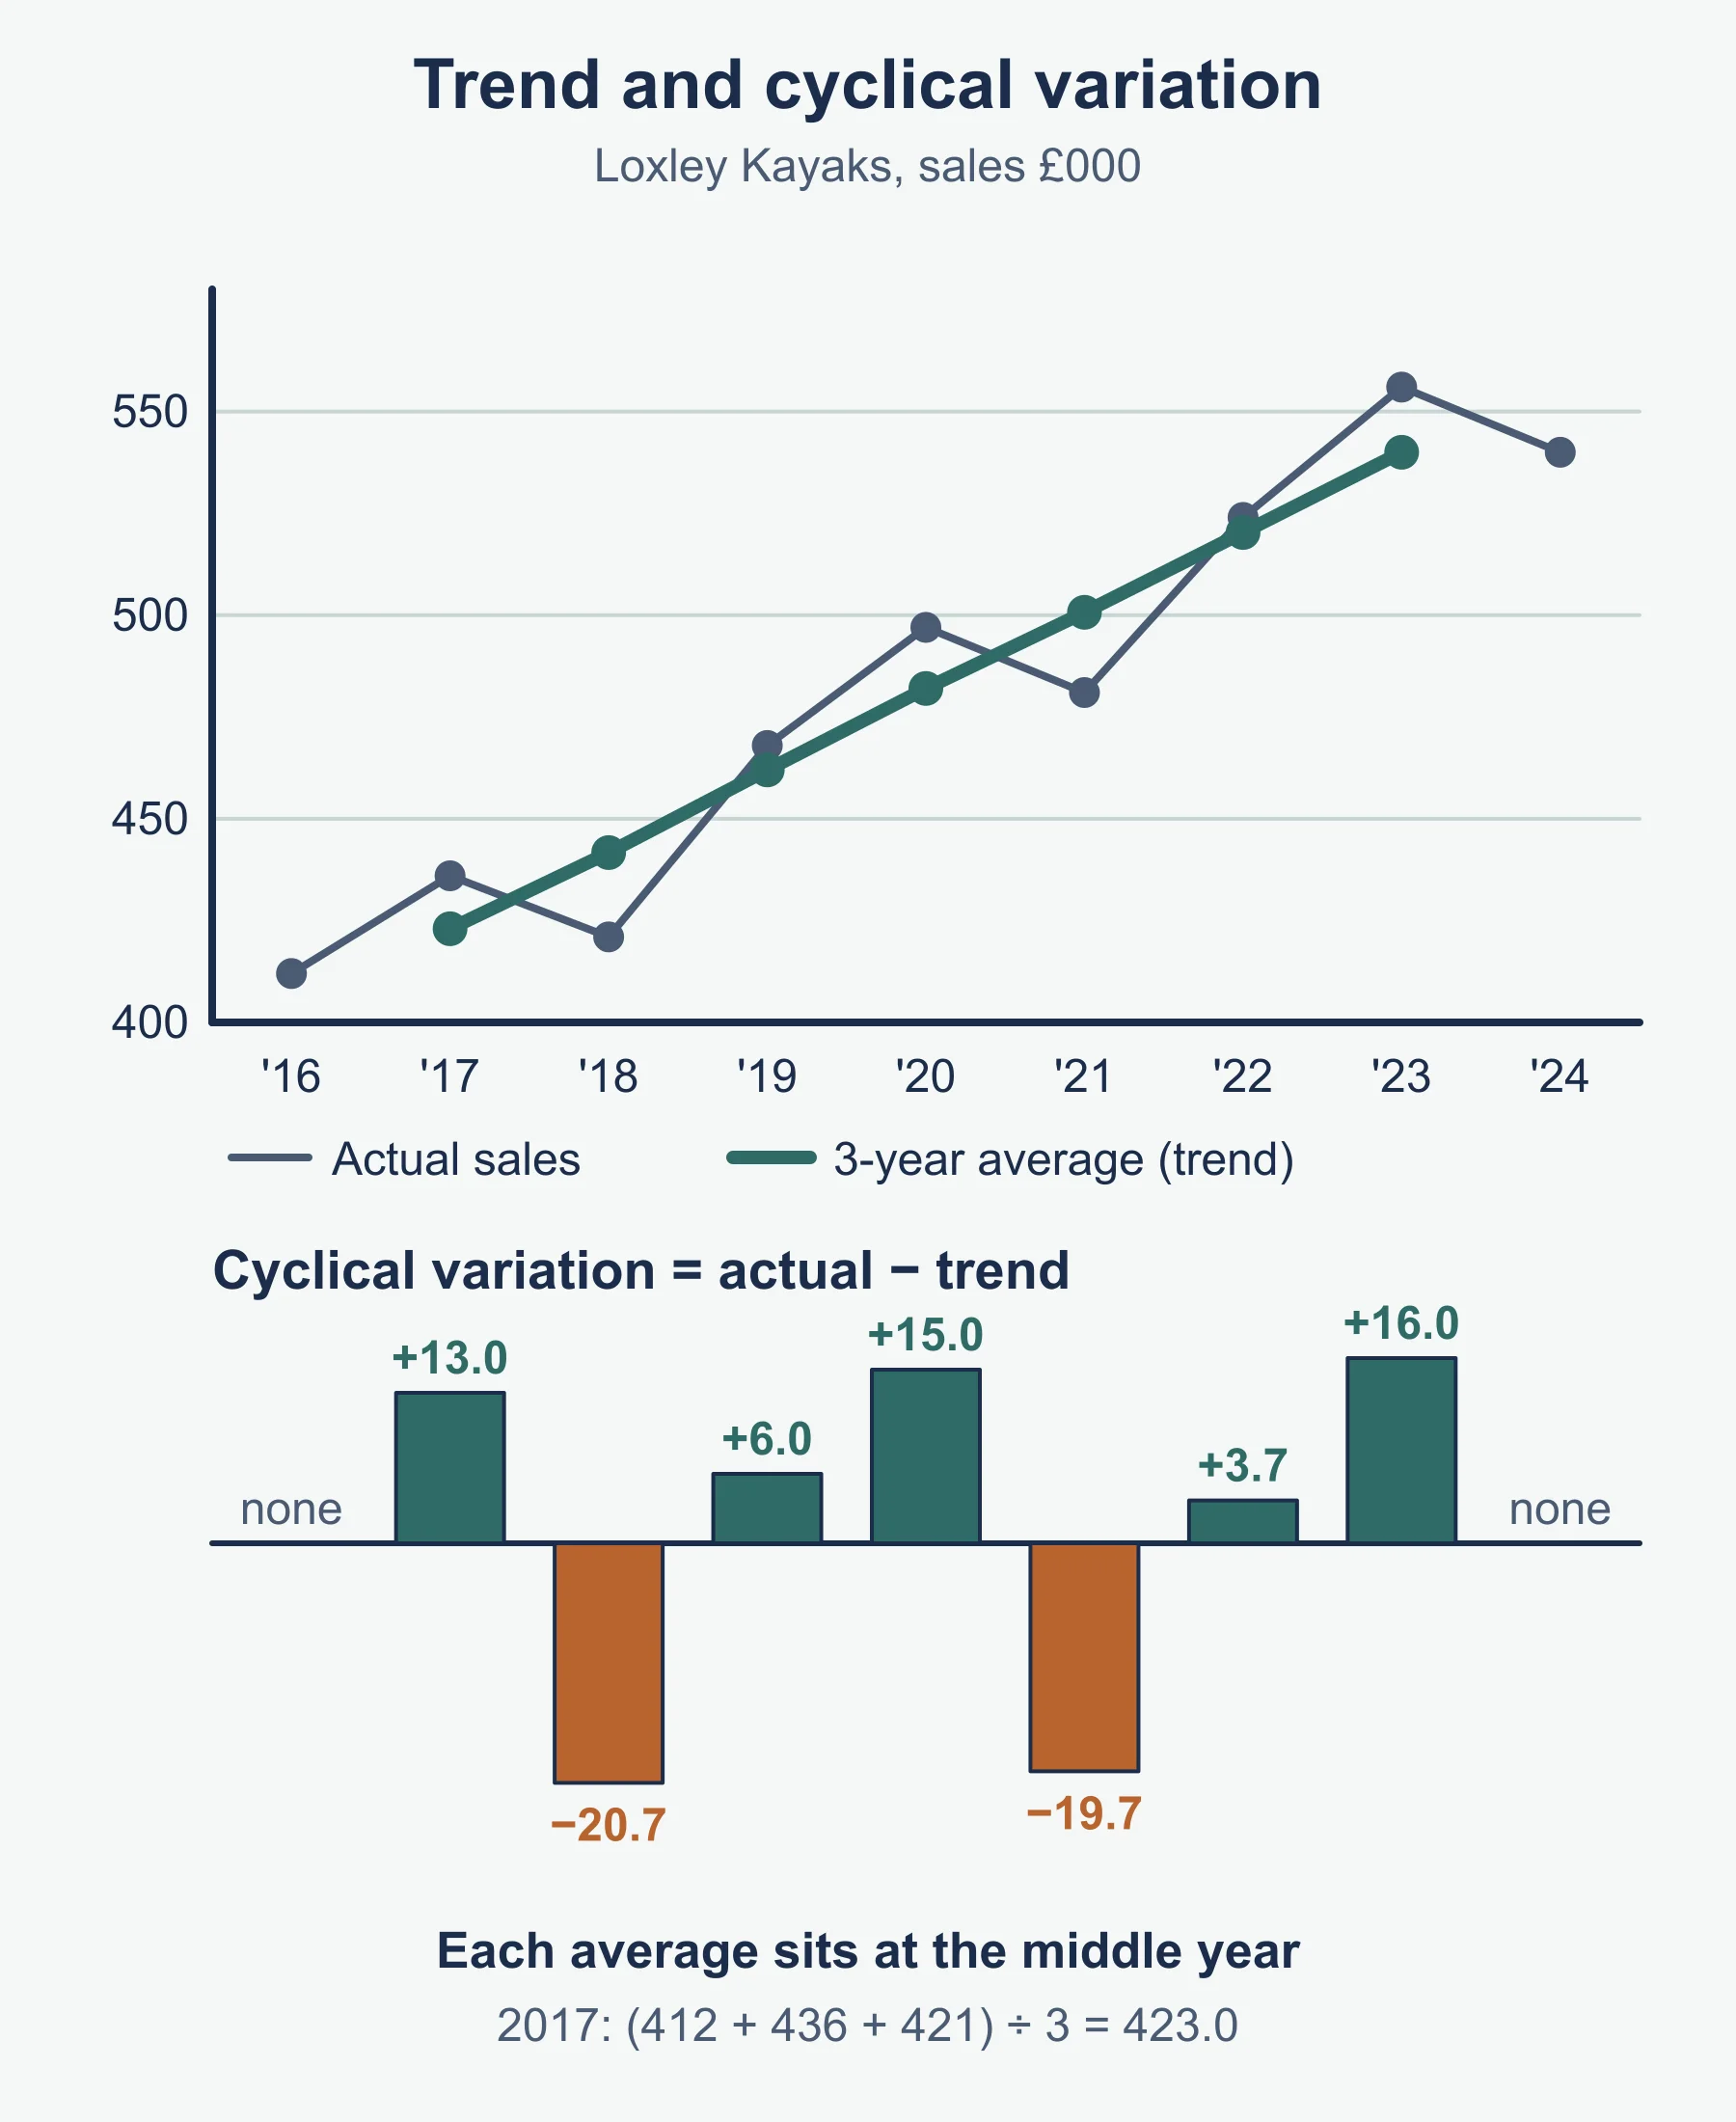
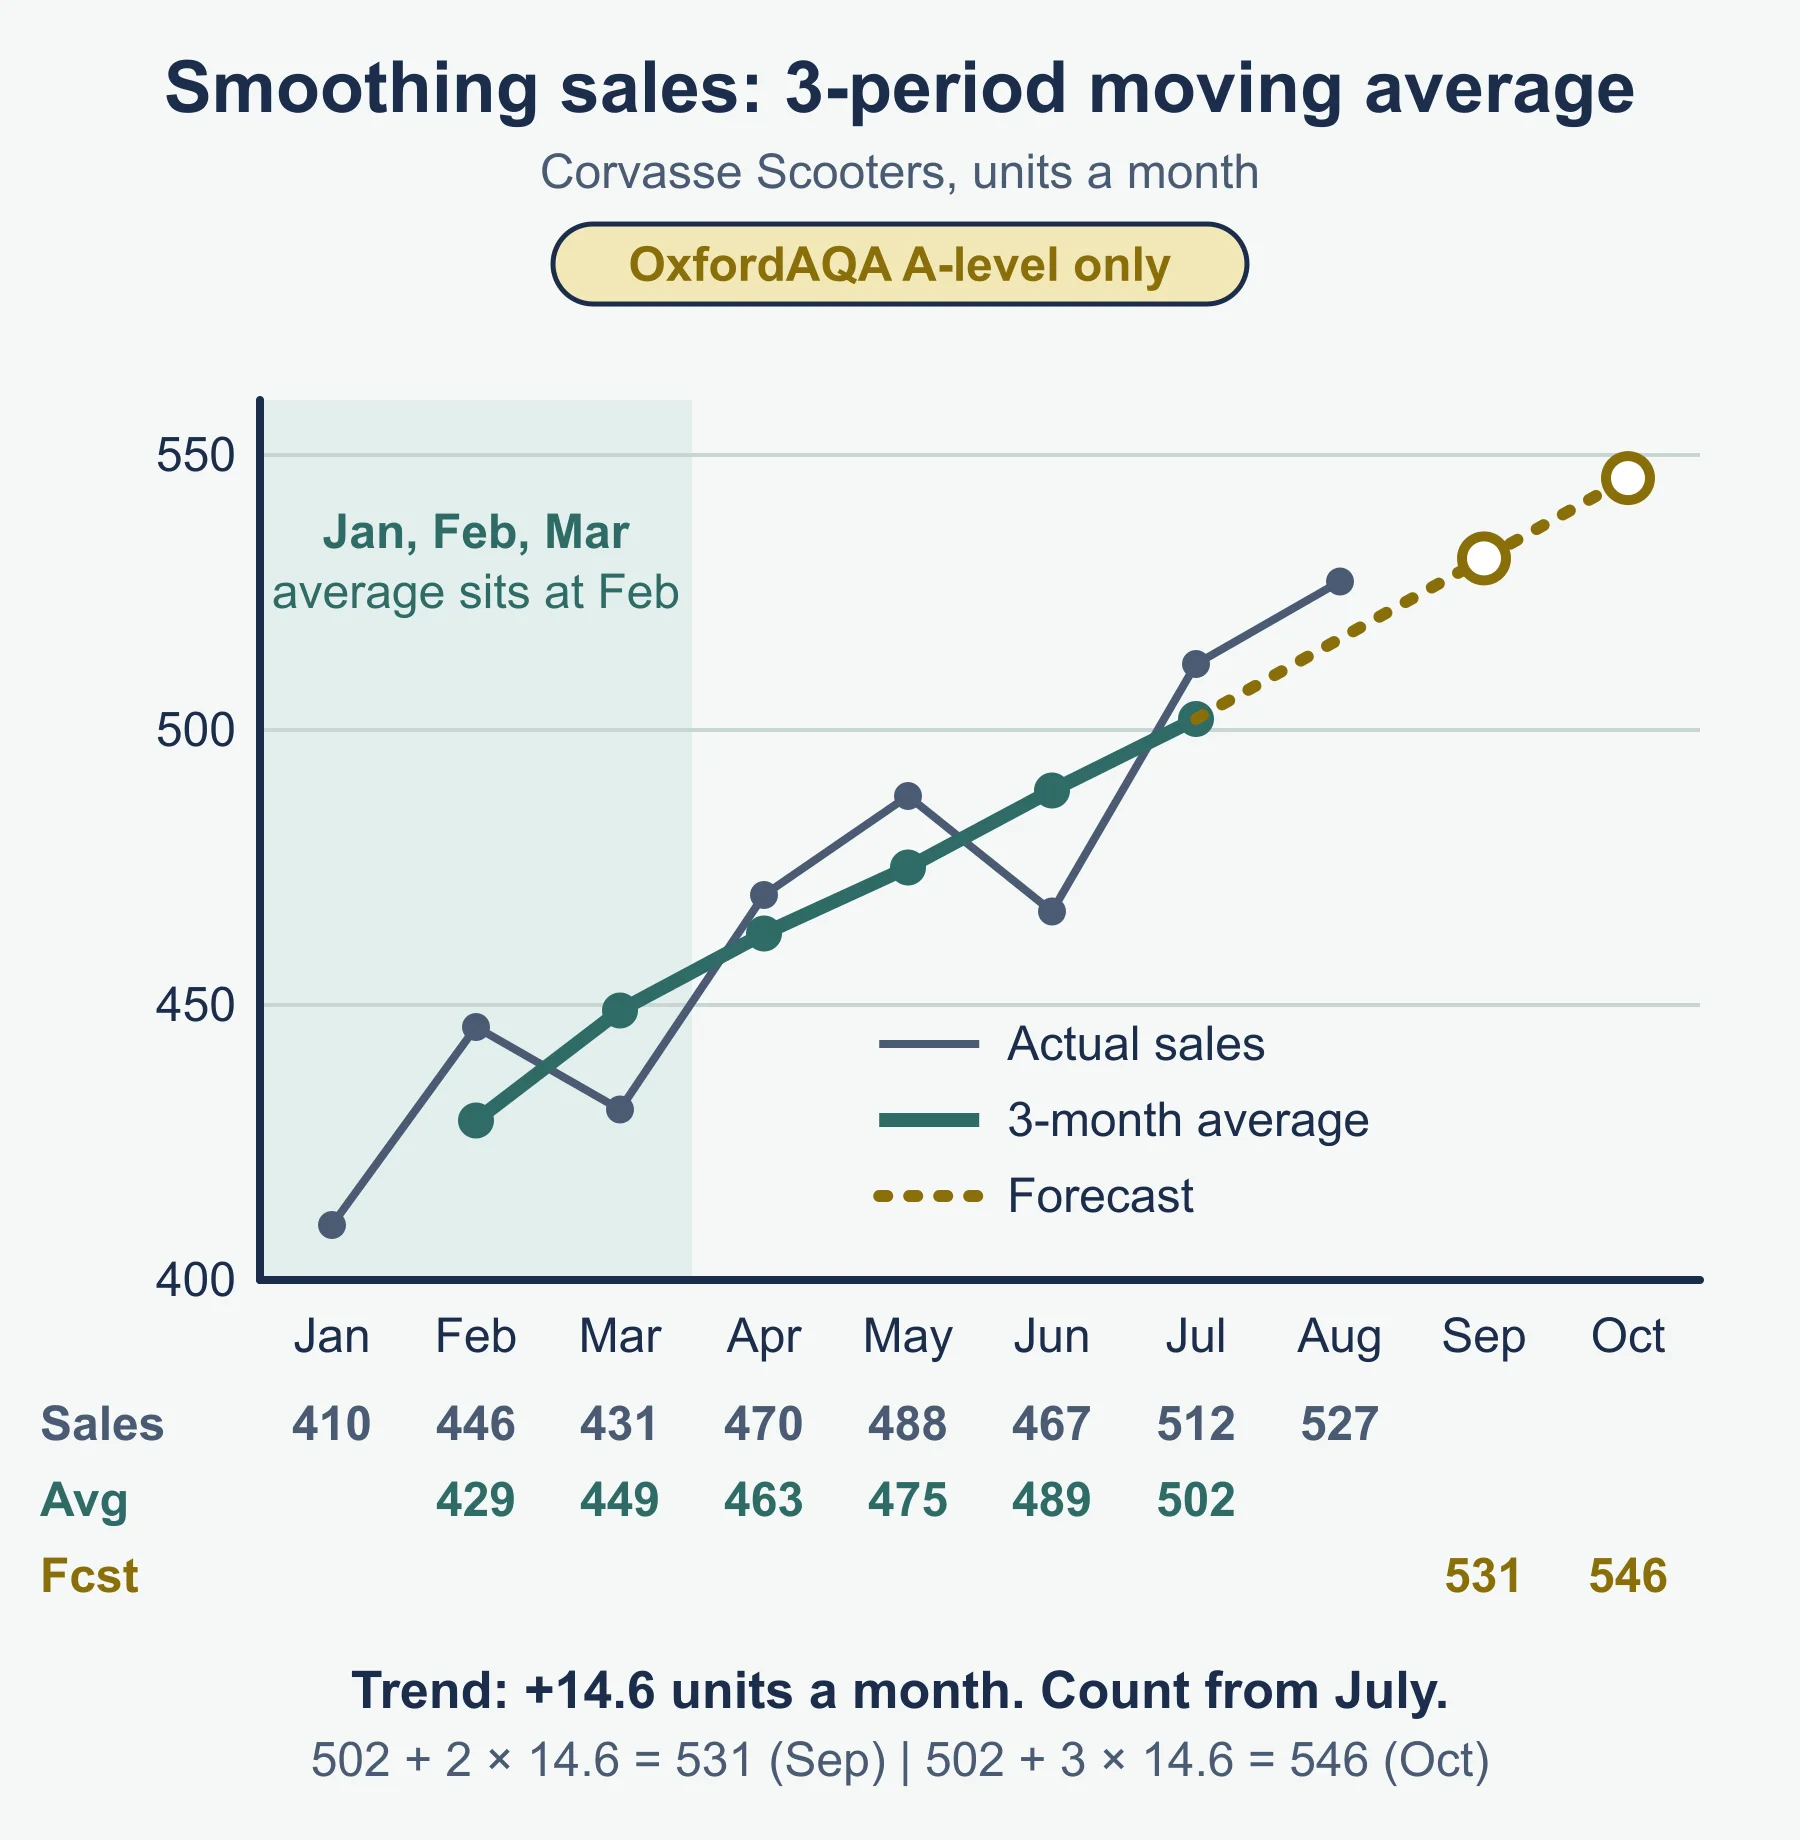
Time series analysis studies data over time to identify the trend and predict future values. The specification asks for moving averages over an odd number of years. A three-year moving average is the mean of an actual value and the values either side, placed at the middle year.
Worked example: Loxley Kayaks. Sales (£000) for 2016 to 2024: 412, 436, 421, 468, 497, 481, 524, 556, 540.
| Year | Sales | 3-year moving average (trend) | Cyclical variation |
|---|---|---|---|
| 2016 | 412 | – | – |
| 2017 | 436 | 423.0 | +13.0 |
| 2018 | 421 | 441.7 | −20.7 |
| 2019 | 468 | 462.0 | +6.0 |
| 2020 | 497 | 482.0 | +15.0 |
| 2021 | 481 | 500.7 | −19.7 |
| 2022 | 524 | 520.3 | +3.7 |
| 2023 | 556 | 540.0 | +16.0 |
| 2024 | 540 | – | – |
For 2017: (412 + 436 + 421) ÷ 3 = 423.0. For 2018: (436 + 421 + 468) ÷ 3 = 441.7. The dips in 2018 and 2021 suggest a cycle of about three years.
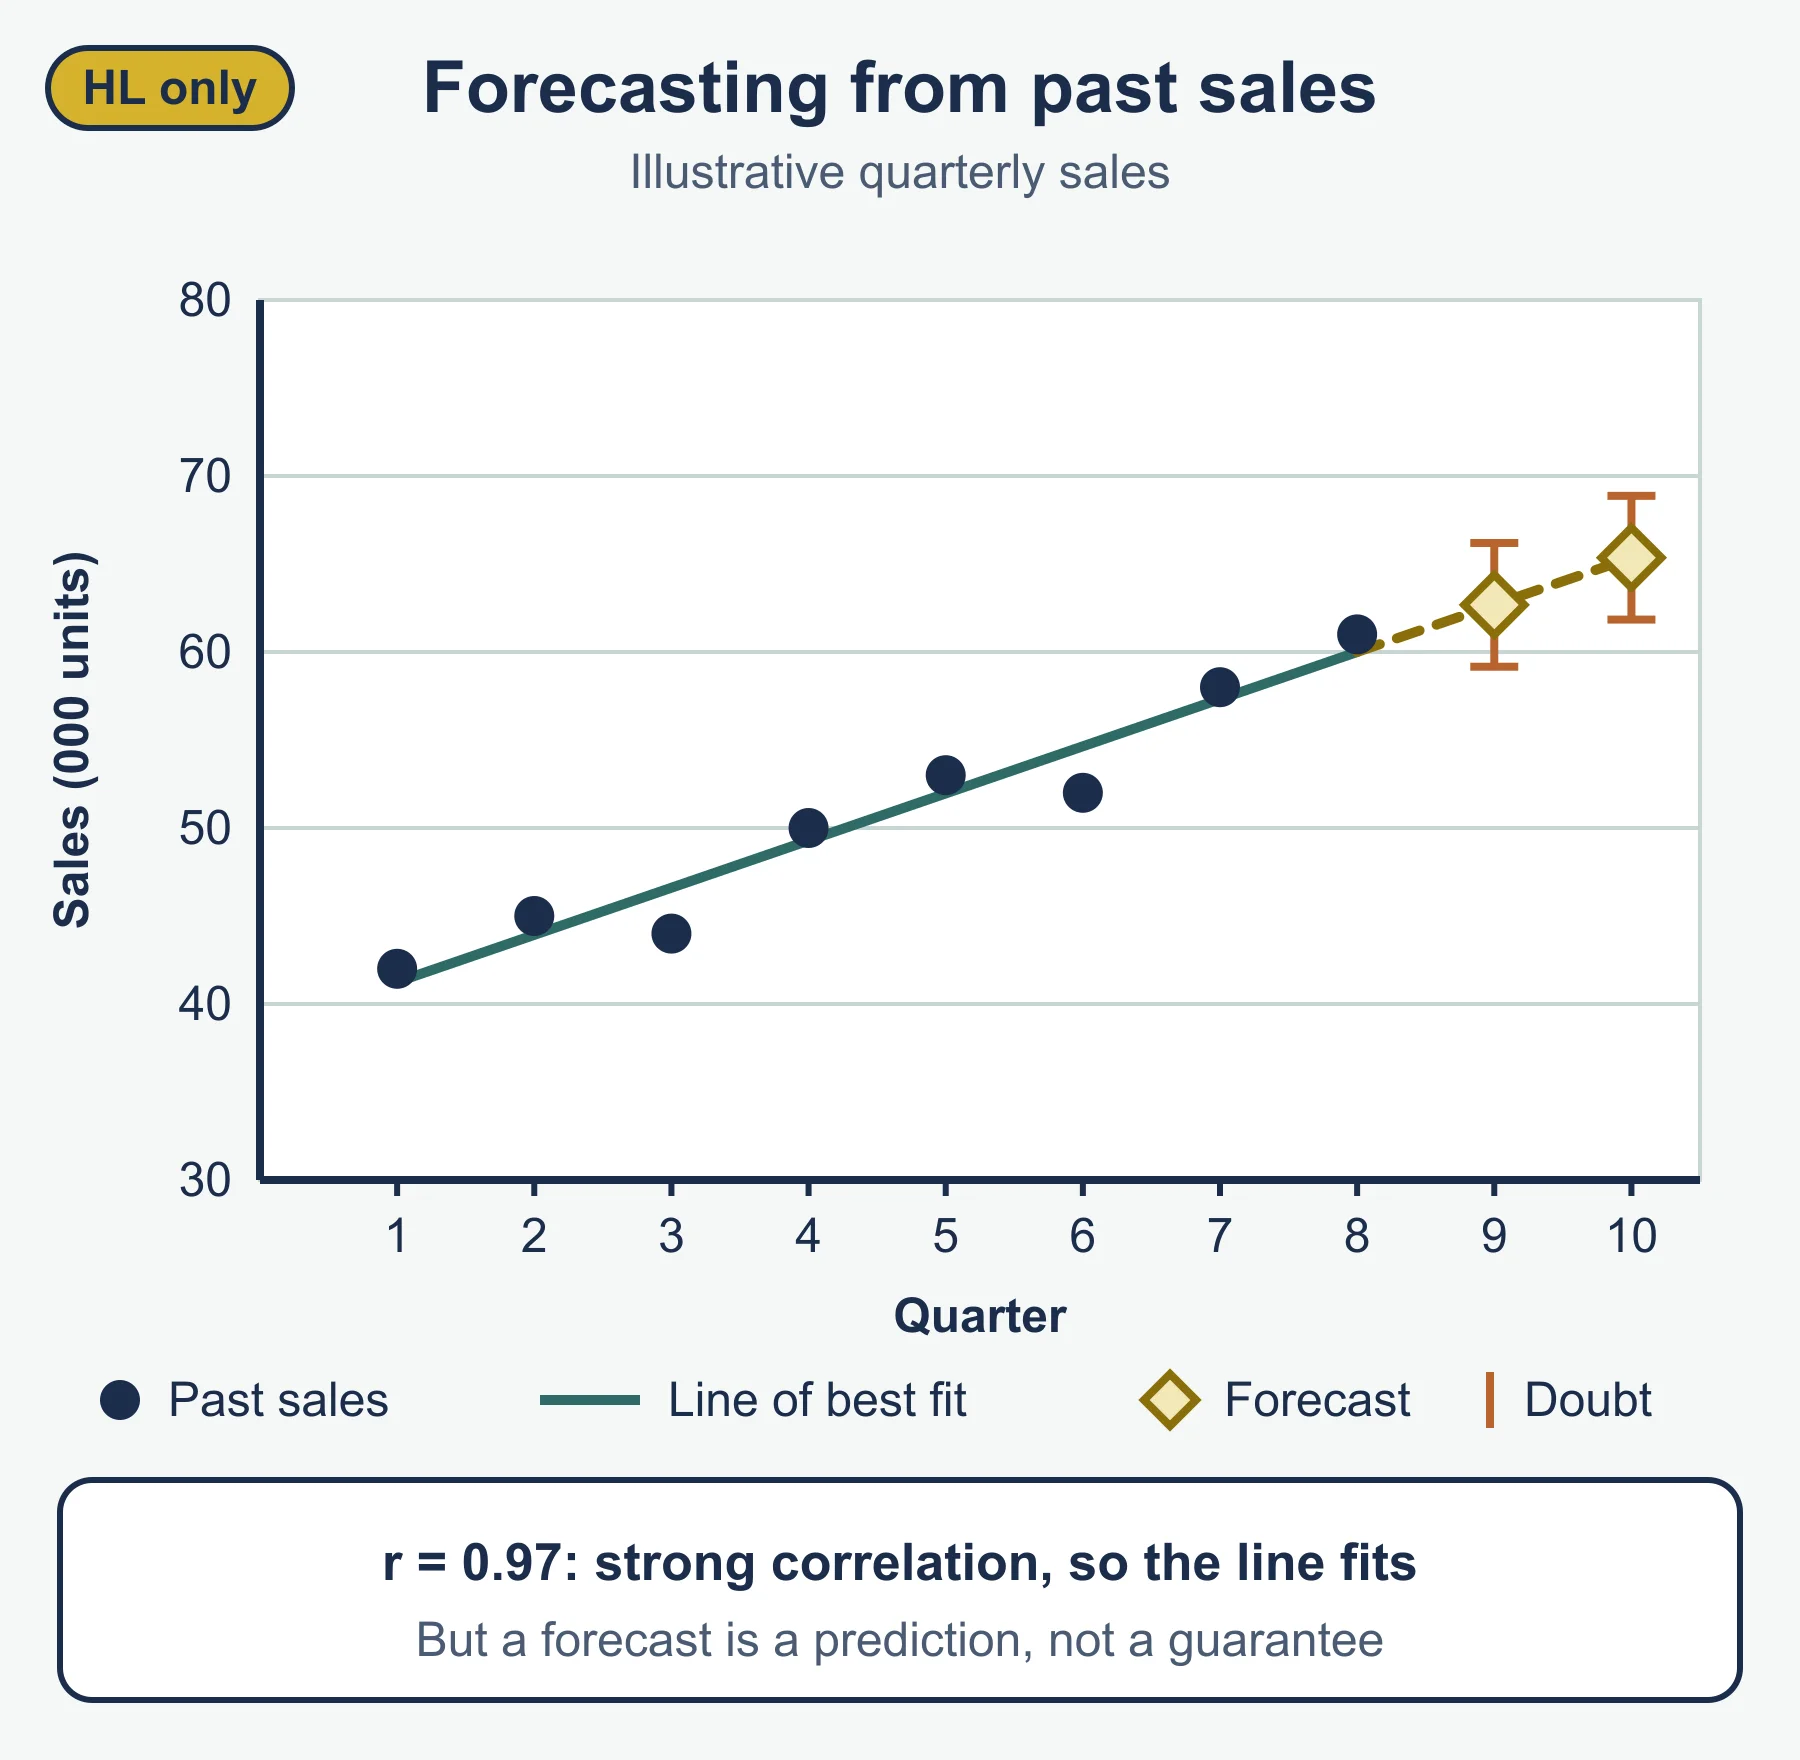
Using the trend to forecast. The trend rose from 423.0 in 2017 to 540.0 in 2023, a rise of 117.0 over six years, or 19.5 a year. Extending the trend: 2024 about 559.5 and 2025 about 579.0. The 2024 actual was 540, which is 19.5 below that trend and fits the repeating dip. If the three-year pattern continues, 2025 should sit slightly above trend, so a forecast of roughly £580,000 to £585,000 is reasonable, not a precise figure.
Evaluating time series analysis. It is objective, cheap and shows the trend clearly. But the latest years have no moving average, so the method lags exactly where the forecast is needed. It assumes the past pattern will continue, and it cannot predict shocks such as a new competitor, a change in regulation or a recession. It needs enough years of reliable data. A longer average smooths more but reacts more slowly.
Correlation and extrapolation
Correlation describes the relationship between two variables. On a scatter graph, points rising from left to right show positive correlation, points falling show negative correlation, and no pattern shows no correlation. The closer the points sit to a line, the stronger the correlation. A correlation figure runs from −1 to +1.
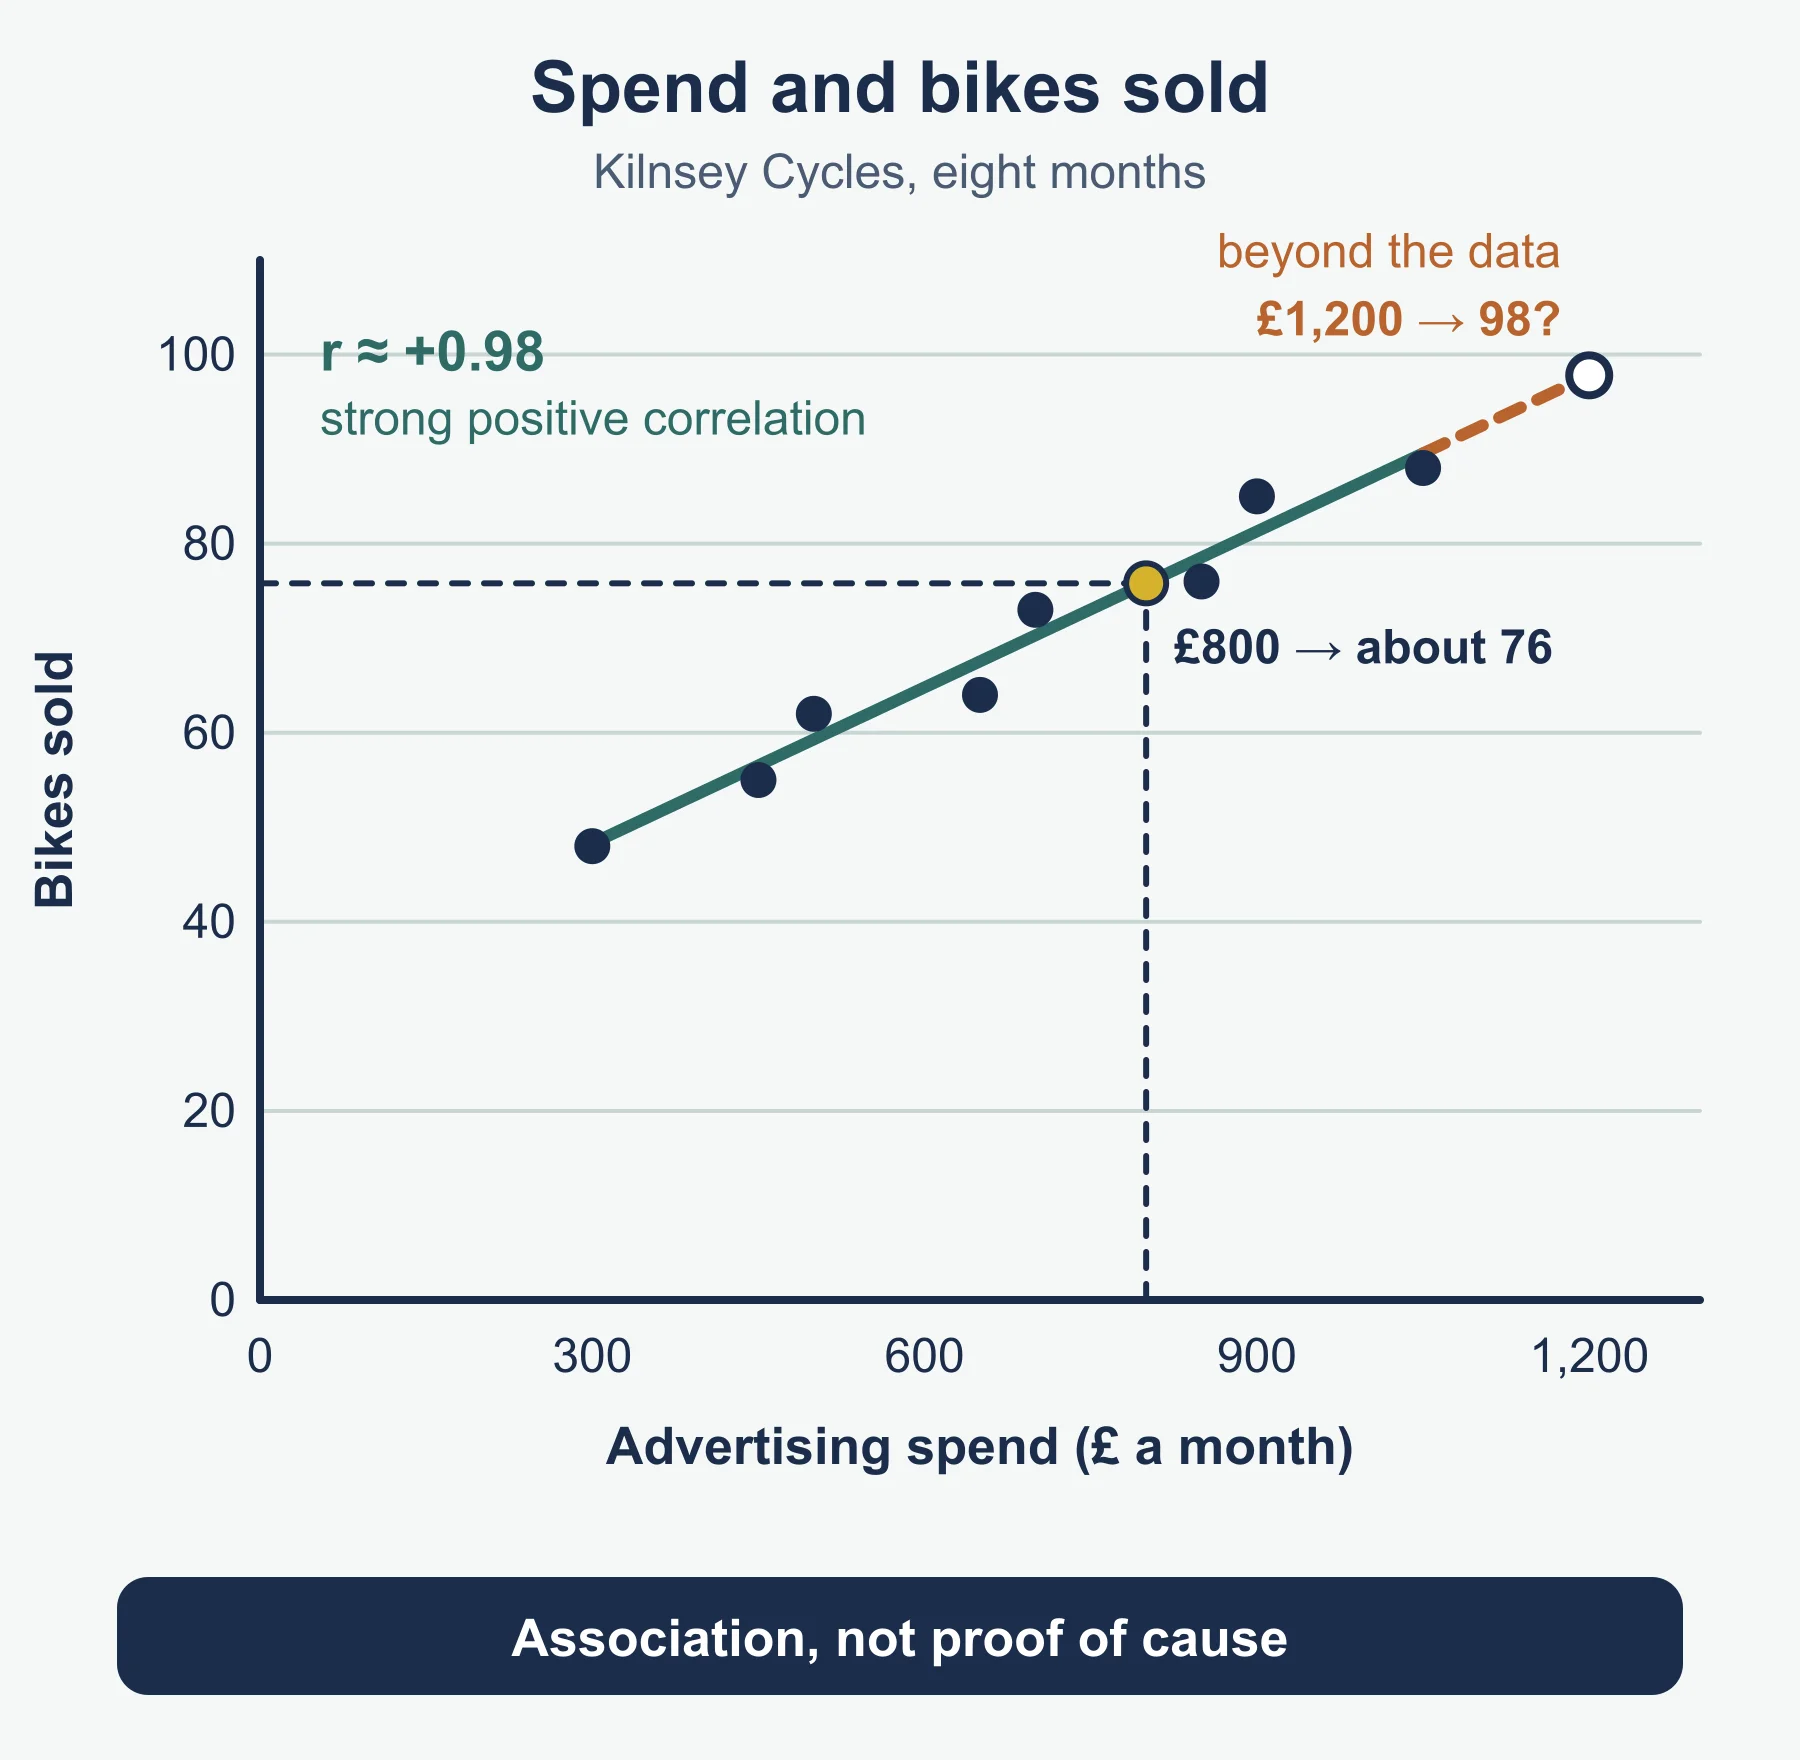
Worked example: Kilnsey Cycles. Over eight months, monthly advertising spend (£) and bikes sold were:
| Spend (£) | 300 | 450 | 500 | 650 | 700 | 850 | 900 | 1,050 |
|---|---|---|---|---|---|---|---|---|
| Bikes sold | 48 | 55 | 62 | 64 | 73 | 76 | 85 | 88 |
The scatter shows a strong positive correlation. A line of best fit, drawn by eye or calculated, is approximately bikes = 31.8 + 0.055 × spend (correlation about +0.98). Reading from it, spend of £800 predicts about 76 bikes. Each extra £100 of advertising is associated with about 5 or 6 extra bikes.
Cautions. Correlation shows association, not cause: advertising may rise in the same months as demand for other reasons, such as good weather. A forecast of £1,200 spend would give roughly 98 bikes, but that lies outside the data range, so it is extrapolation beyond the evidence and less reliable.
Extrapolating trends. To extrapolate, extend the existing trend line or the average change forward and read off or calculate the future value, as with Loxley above. Always state the assumption (the trend continues) and treat the result as an estimate: the further ahead, the less reliable.
Responding to forecasts and why accuracy matters
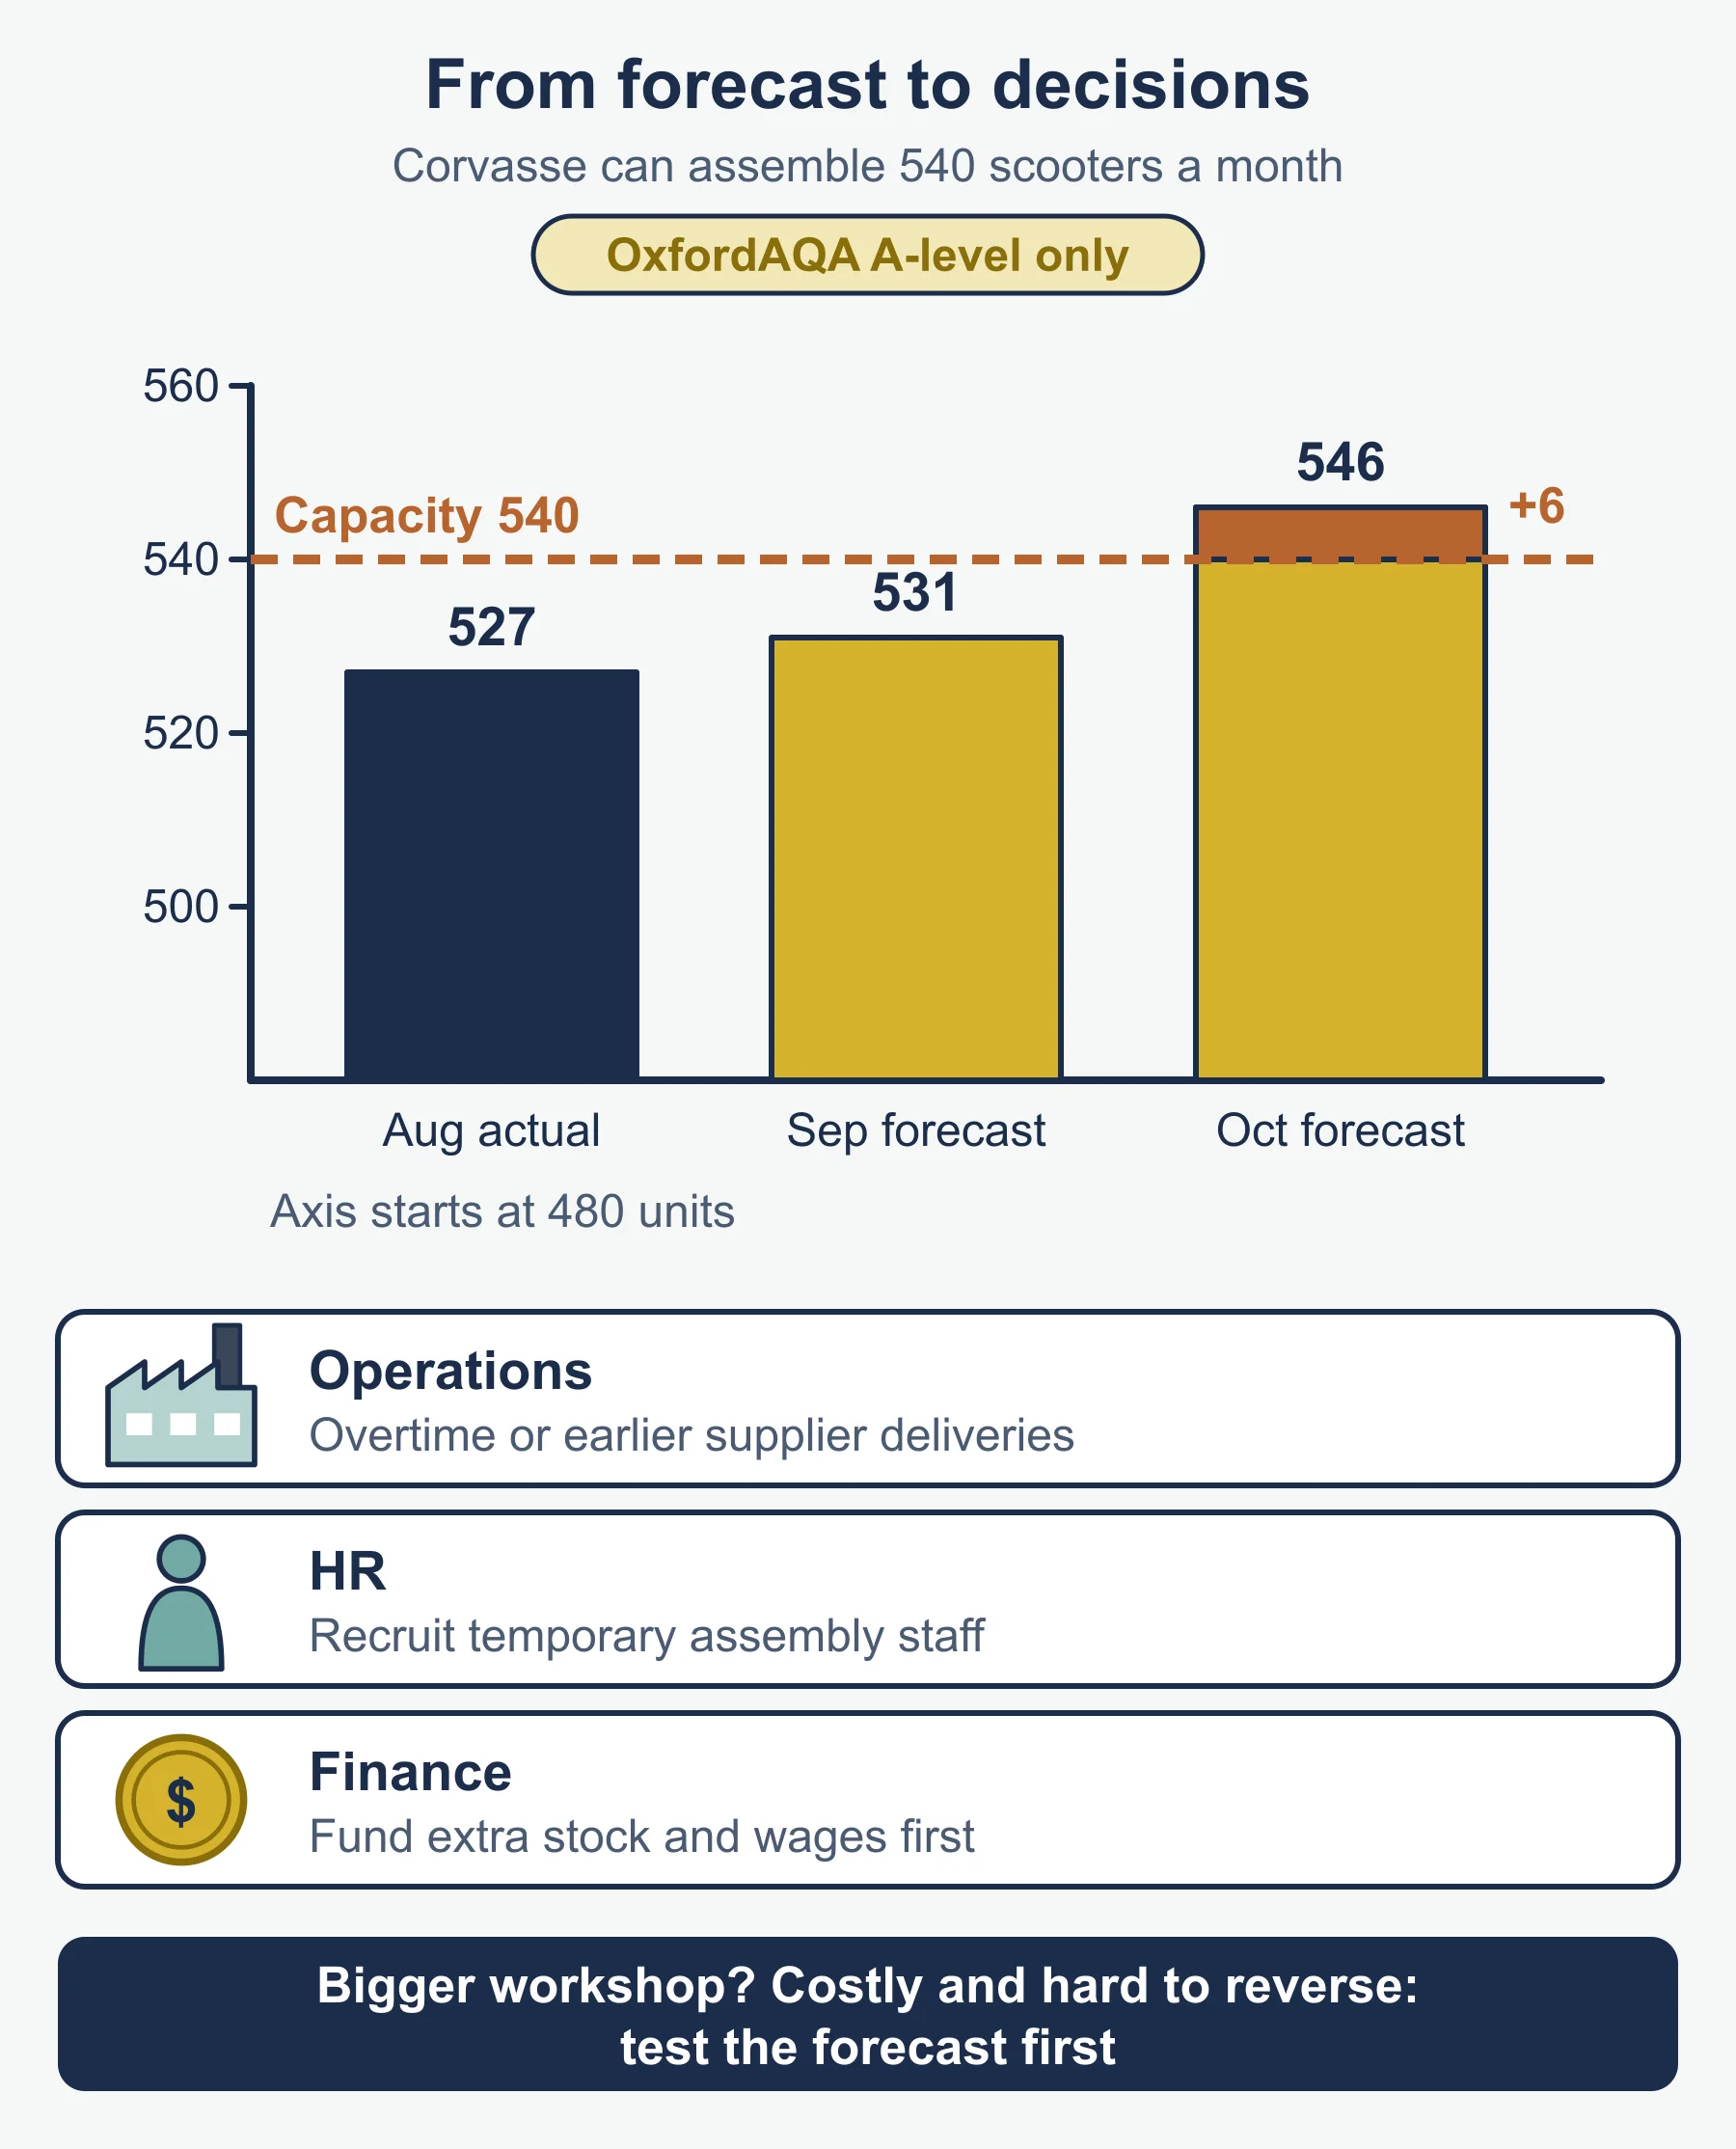
A business can respond to a forecast by changing production, stock levels, staffing or prices, arranging finance, or adjusting its objectives. To recommend and justify, link the response to the forecast, the cost of acting and the cost of being wrong. For Burnsall, a forecast overdraft of £920 is small and short-lived, so arranging an overdraft or leasing is proportionate, whereas cancelling the machine would sacrifice future capacity.
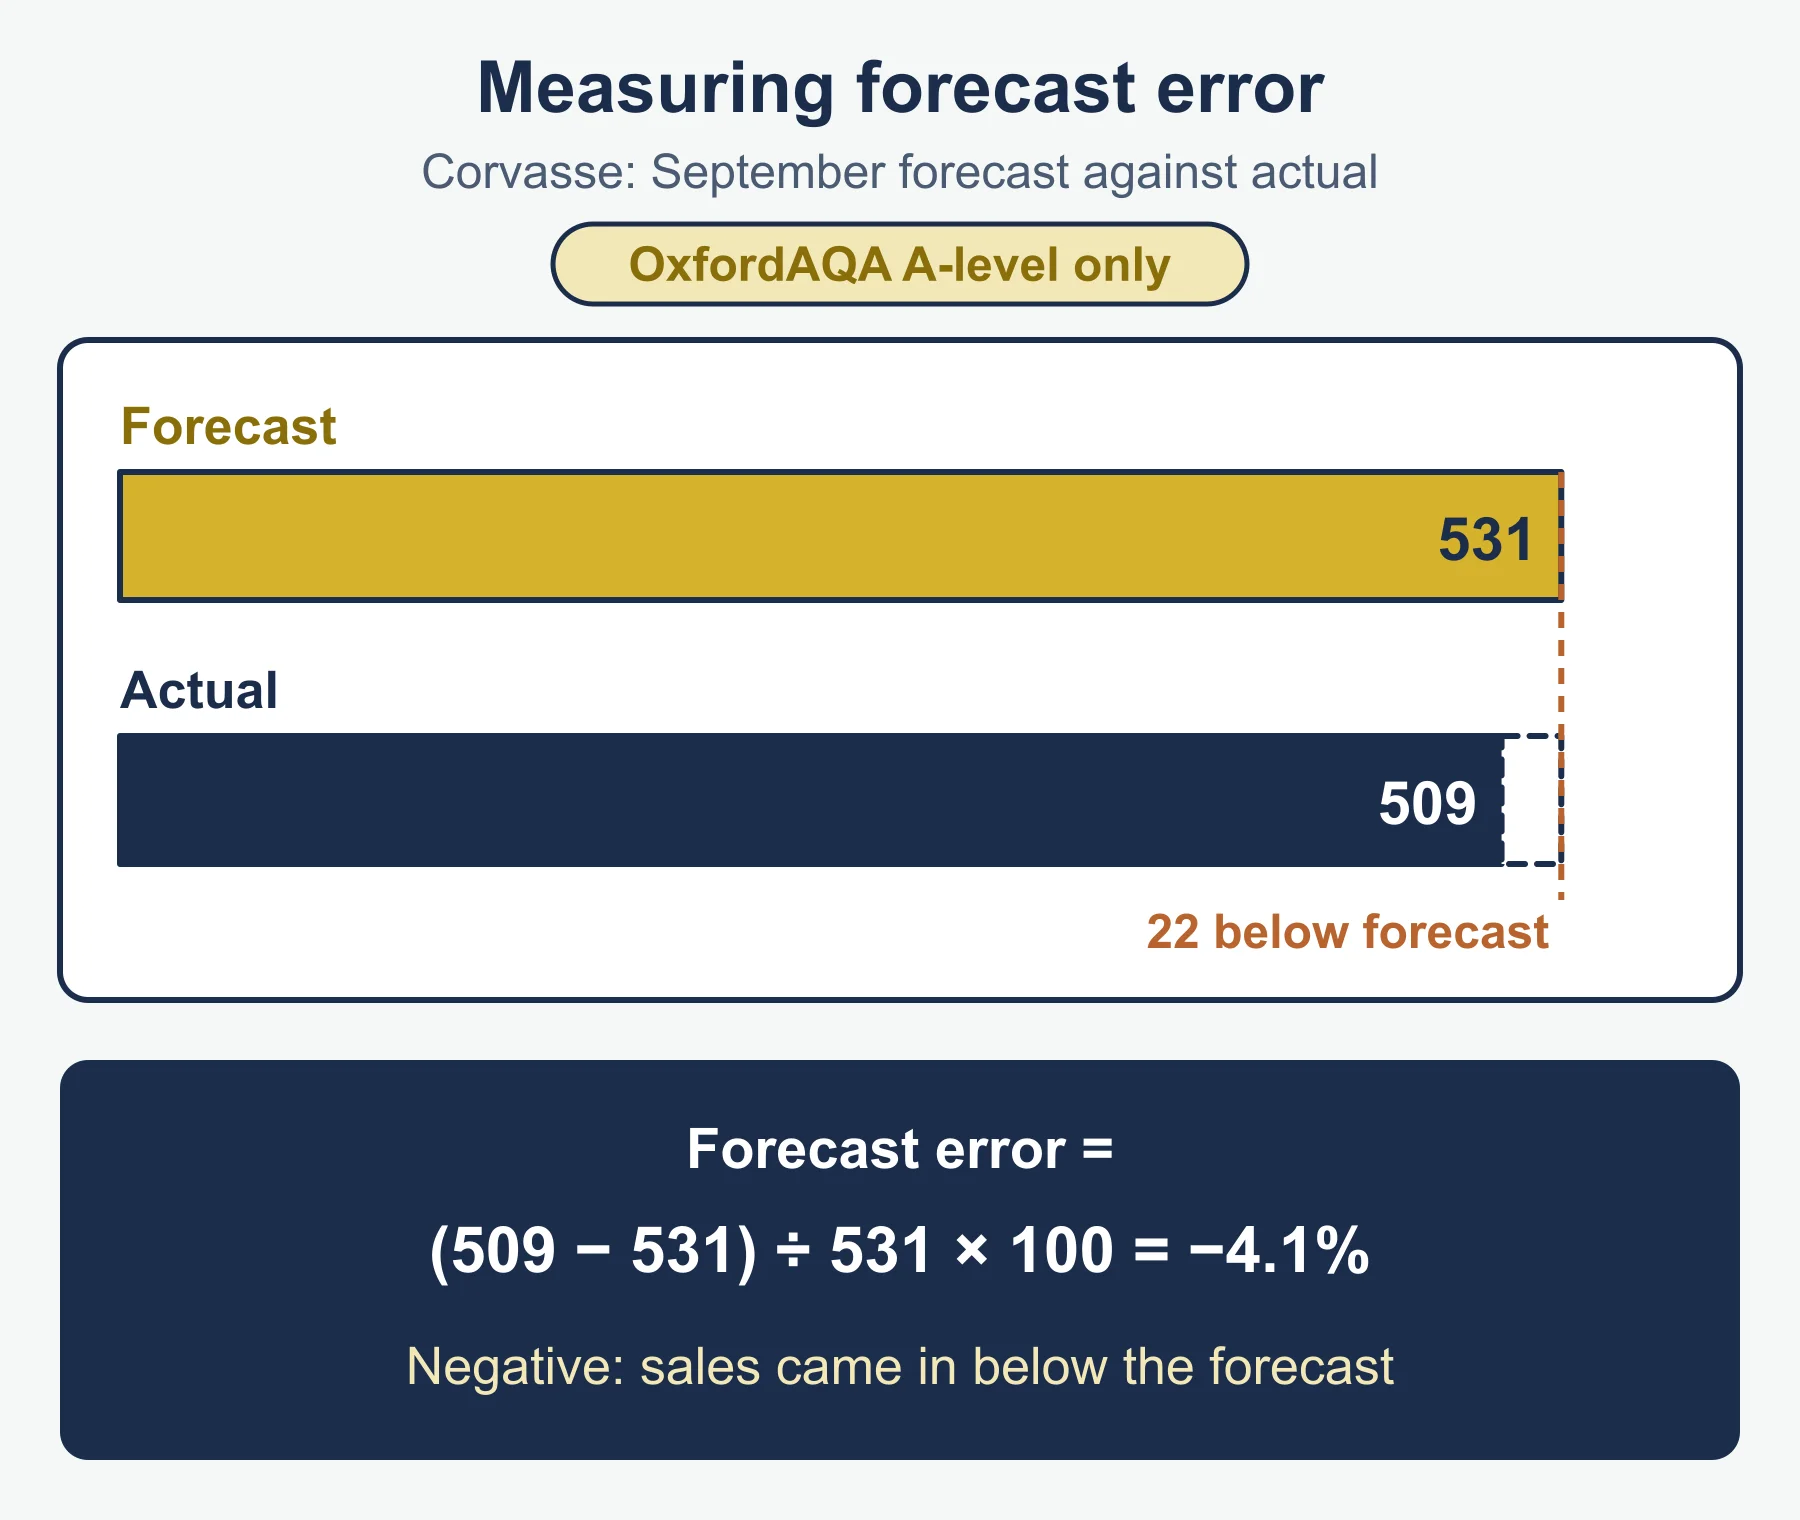
Accurate forecasting matters to the business and to lenders, suppliers and employees, because decisions are costly to reverse. Overestimating demand leaves unsold stock and idle capacity. Underestimating it loses sales and customers. Inaccurate cash forecasts risk insolvency. Accuracy is limited by data quality, volatility and forecaster bias. Importance depends on the size of the decision and how fast the business can adjust if the forecast is wrong.
Common errors
- Treating profit and cash flow as the same thing.
- Placing a moving average against the wrong year. It belongs to the middle year.
- Calculating cyclical variation as trend − actual. Use actual − trend.
- Claiming correlation proves cause.
- Giving advantages and disadvantages without a judgement tied to the business in the case.
Frequently asked questions
What is the Delphi technique? A panel of experts answers questions separately, usually anonymously, a coordinator circulates a summary, and the experts revise their views over several rounds until opinion converges.
Is profit the same as cash flow in a forecast? No. A month can be profitable yet close overdrawn, because items such as a machine purchase are cash outflows that do not appear in that month’s profit, and customers may pay later.
What are the limitations of time series analysis? The latest years have no moving average, so the method lags exactly where the forecast is needed. It also assumes the past pattern will continue and cannot predict shocks such as a new competitor or a recession.
Why does accurate forecasting matter? Decisions are costly to reverse. Overestimating demand leaves unsold stock and idle capacity, while underestimating it loses sales and customers, which matters to lenders, suppliers and employees as well as the business.
Official syllabus
OCR A Level Business (H431), Version 2.1 (January 2026), published by OCR, for first assessment in 2017 with final assessment in summer 2027. Content covered: Forecasting, within the area of study Business objectives and strategy.
Get free revision emails (optional)
Occasional emails with practice questions, worked explanations and links to free resources for the qualification and subjects you choose. No spam, and you can unsubscribe from any email. The free tools on this site never need an email.
Related resources
-
Practice questions
OCR A Level Business: Forecasting (H431) – Practice Questions
Original practice questions with worked answers on forecasting for OCR A Level Business (H431): qualitative methods, moving averages and cash flow.
Business · OCR · A Level
Try questions -
Revision notes
OCR A Level Business: Forecasting (H431) – Revision Notes
Condensed revision notes on forecasting for OCR A Level Business (H431): methods, formulas, moving averages, correlation, a self-test and lost marks.
Business · OCR · A Level
Revise topic -
Study guides
OCR A Level Business: Measures of performance: financial and non-financial (H431)
Guide to financial and non-financial measures of performance for OCR A Level Business H431, with worked ratio, cash-flow and variance examples.
Business · OCR · A Level
Read guide
Related articles
-
teaching
A Level tuition in Dubai: Cambridge or Pearson Edexcel International A Level?
Schools in Dubai and Abu Dhabi teach either Cambridge International AS & A Level or Pearson Edexcel International A Level. How the two are structured, why it matters for tuition, and how online classes from Lahore work.
9 October 2026
-
curriculum guides
Choosing subjects at IGCSE and A Level
How subject choices at 14 and 16 affect university options later, and how to keep pathways open without overloading a timetable.
28 July 2026
Studying this with a teacher
Working through Business A LEVELS?
This page is free and stays free. If you would rather be taught it, Marlbridge runs Business classes one-to-one, online in your own time zone. One-to-one only for this course: Rs 6,000 per class in Pakistan, with other currencies on the fees page. The first trial class is free. WhatsApp replies within an hour (8am–11pm Pakistan time, every day); email the same day.
OCR Business teachers at Marlbridge
