
Revision Notes
OCR A Level Business: Forecasting (H431) – Revision Notes
Condensed revision notes on forecasting for OCR A Level Business (H431): methods, formulas, moving averages, correlation, a self-test and lost marks.
- Subject
- Business
- Level
- A LEVELS
- Topic
- Business objectives and strategic decisions
- Author
- Marlbridge Academic Team
- Updated
- Reviewed by
- Salman Ahmad (what this means)
Aligned to OCR A Level Business (H431), Version 2.1 (January 2026), for first assessment in 2017; final assessment summer 2027. Official specification .
Syllabus page (what it covers and how it is assessed): OCR A Level Business.
Syllabus points this page covers
H431
- 1.12 Forecasting
Found an error? Report a correction.
Need help with this topic? Request a free trial class for A Level Business (H431).
These are quick-recall notes on Forecasting from the Business objectives and strategy area of study in the OCR A Level Business (H431) specification, Version 2.1 (January 2026), with final assessment in summer 2027. Full explanations and worked examples are in the forecasting study guide. Test yourself with the practice questions. Wider context: objectives and strategic decisions guide, strategy revision notes and strategy practice set. Links: course hub, checklist and free 10-minute diagnostics.
Nature and purpose
- Forecast: an informed estimate of a future variable (sales, costs, profit, cash flow, demand).
- Purpose: reduce uncertainty; plan output, staffing, stock and finance; set targets; support funding requests; compare actual with expected results.
- Advantages to a business: better planning, early warning, evidence for lenders, a benchmark for control.
- Disadvantages: based on assumptions, can be wrong, costs time and money, risk of false confidence.
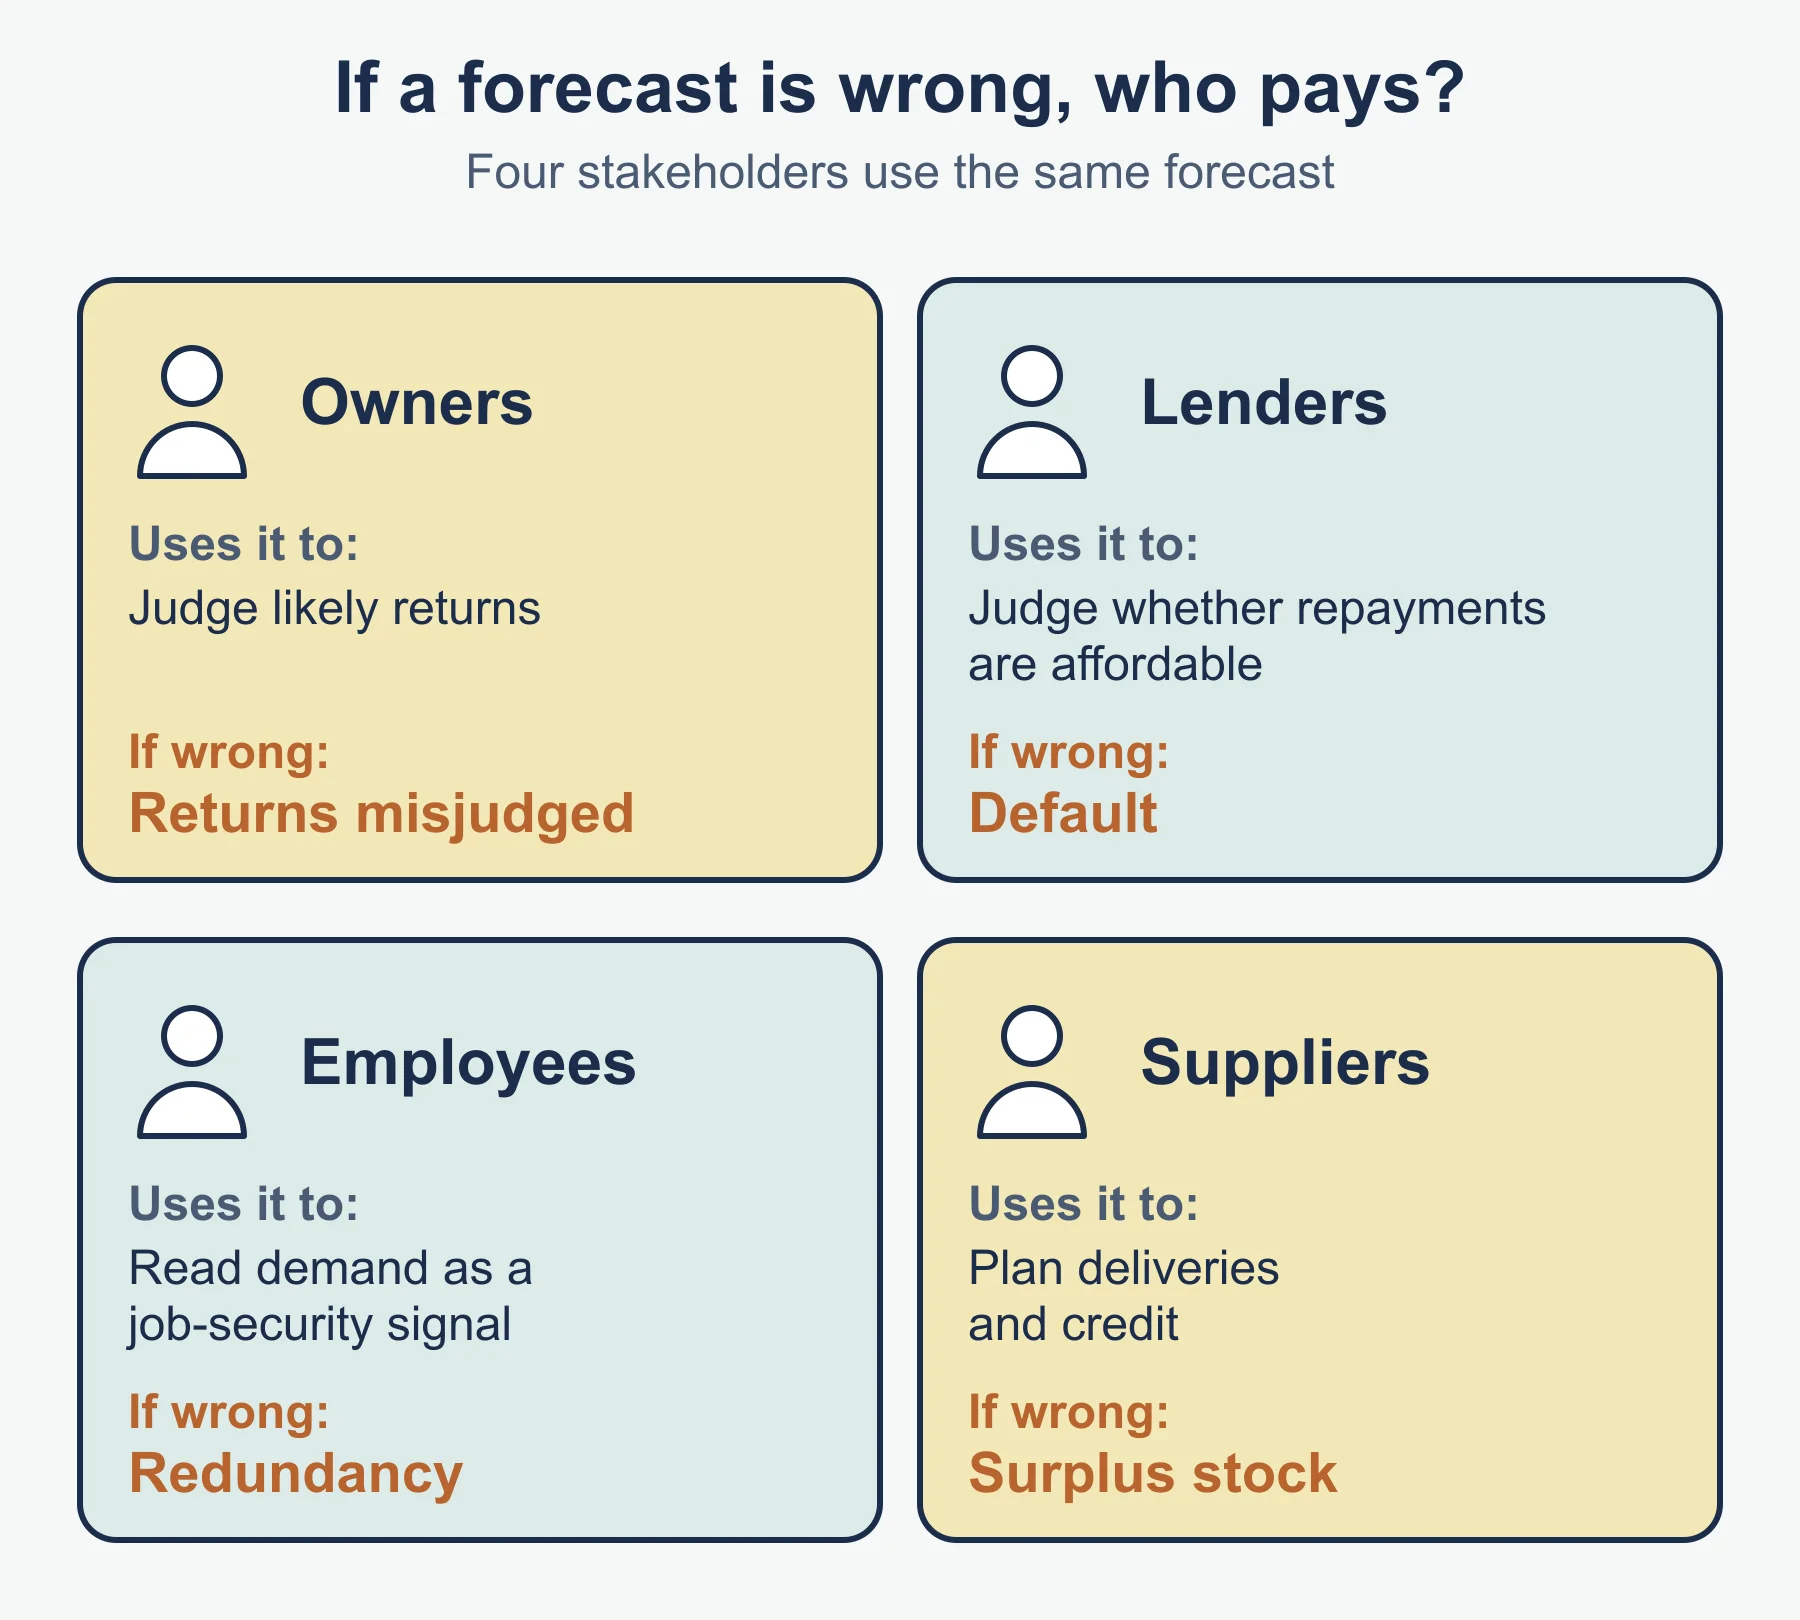
- Stakeholders: owners (returns), lenders (repayment), employees (job security), suppliers (orders and credit). Wrong forecasts hurt each of them in different ways.
Qualitative versus quantitative
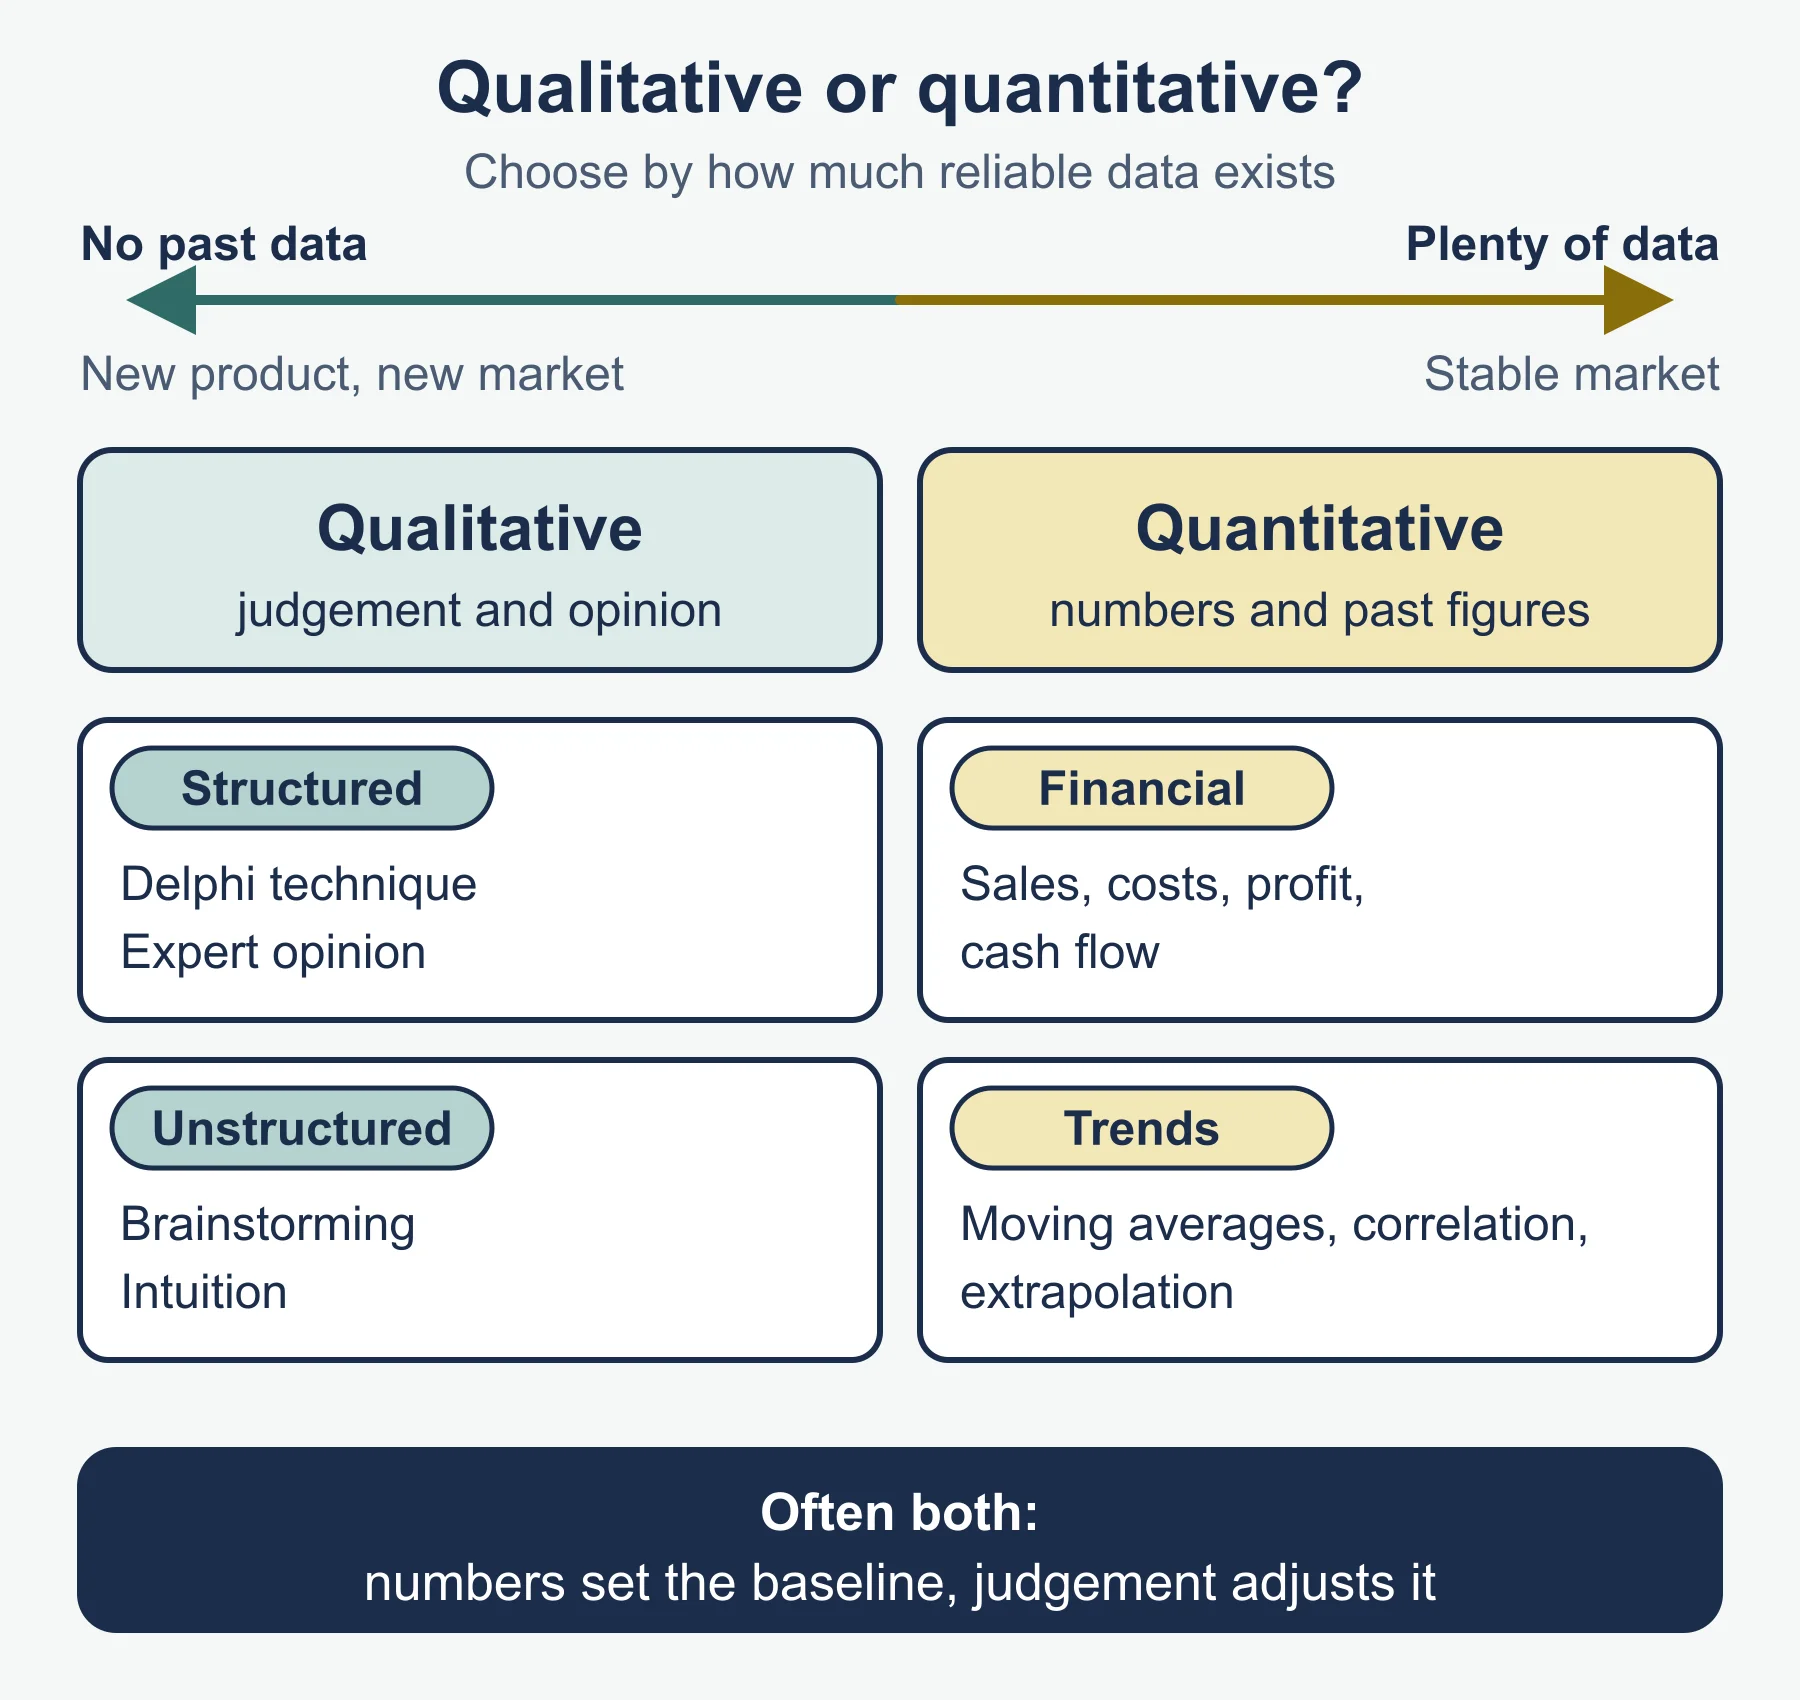
| Qualitative | Quantitative | |
|---|---|---|
| Based on | Opinion, judgement, experience | Numerical data and calculation |
| Best when | New product or market, little data | Stable market, good past data |
| Weakness | Subjective, hard to check | Assumes the past repeats |
| Cost | Often cheaper and quicker | Data and skills needed |
Qualitative methods
| Type | Method | How it works | Plus | Minus |
|---|---|---|---|---|
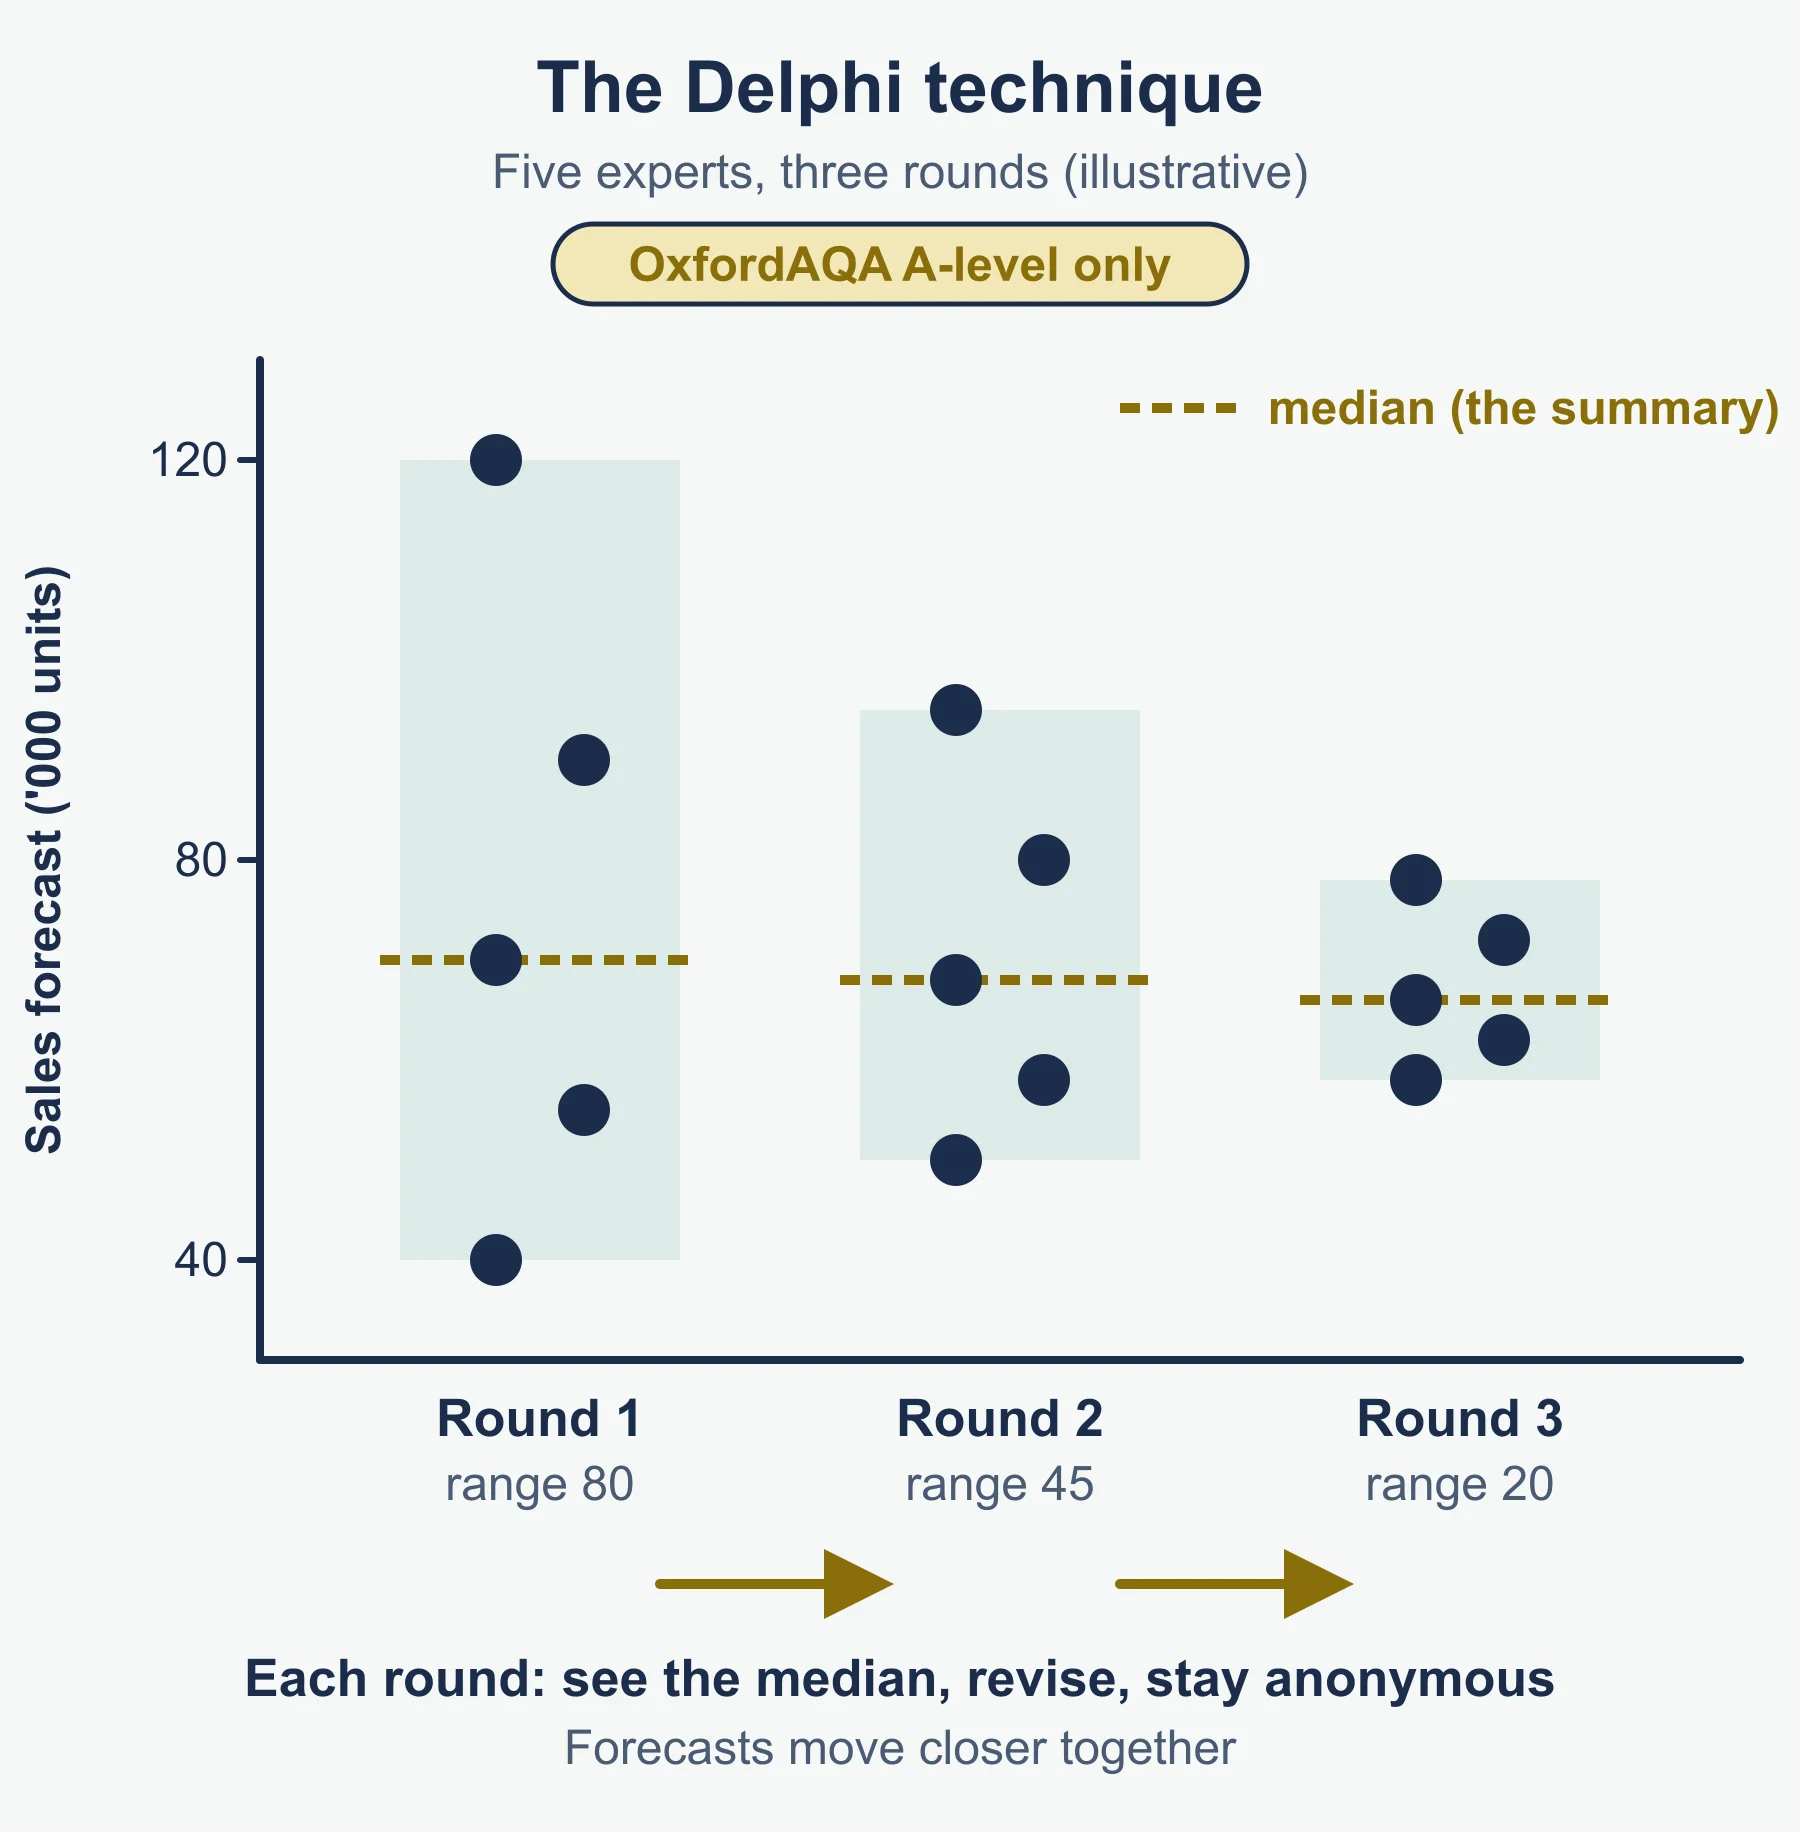
| Structured | Delphi technique | Experts give views separately, see an anonymous summary, revise over several rounds | Reduces dominant-voice bias; systematic | Slow, costly; experts may share the same blind spot |
| Structured | Expert opinion | One or more specialists give a judgement | Quick; specialist knowledge | Depends on one view; may be biased |
| Unstructured | Brainstorming | Group produces many ideas or predictions without early criticism | Cheap; creative; involves staff | Little rigour; louder voices dominate |
| Unstructured | Intuition | Manager’s gut feeling from experience | Instant; useful with no data | Subjective; overconfidence |
Evaluation hook: the right method depends on the cost of being wrong, the time available and how new the situation is.
Quantitative financial forecasts
| Item | Standard form |
|---|---|
| Sales revenue | units × price |
| Total costs | fixed costs + variable costs (units × variable cost per unit) |
| Profit | sales revenue − total costs |
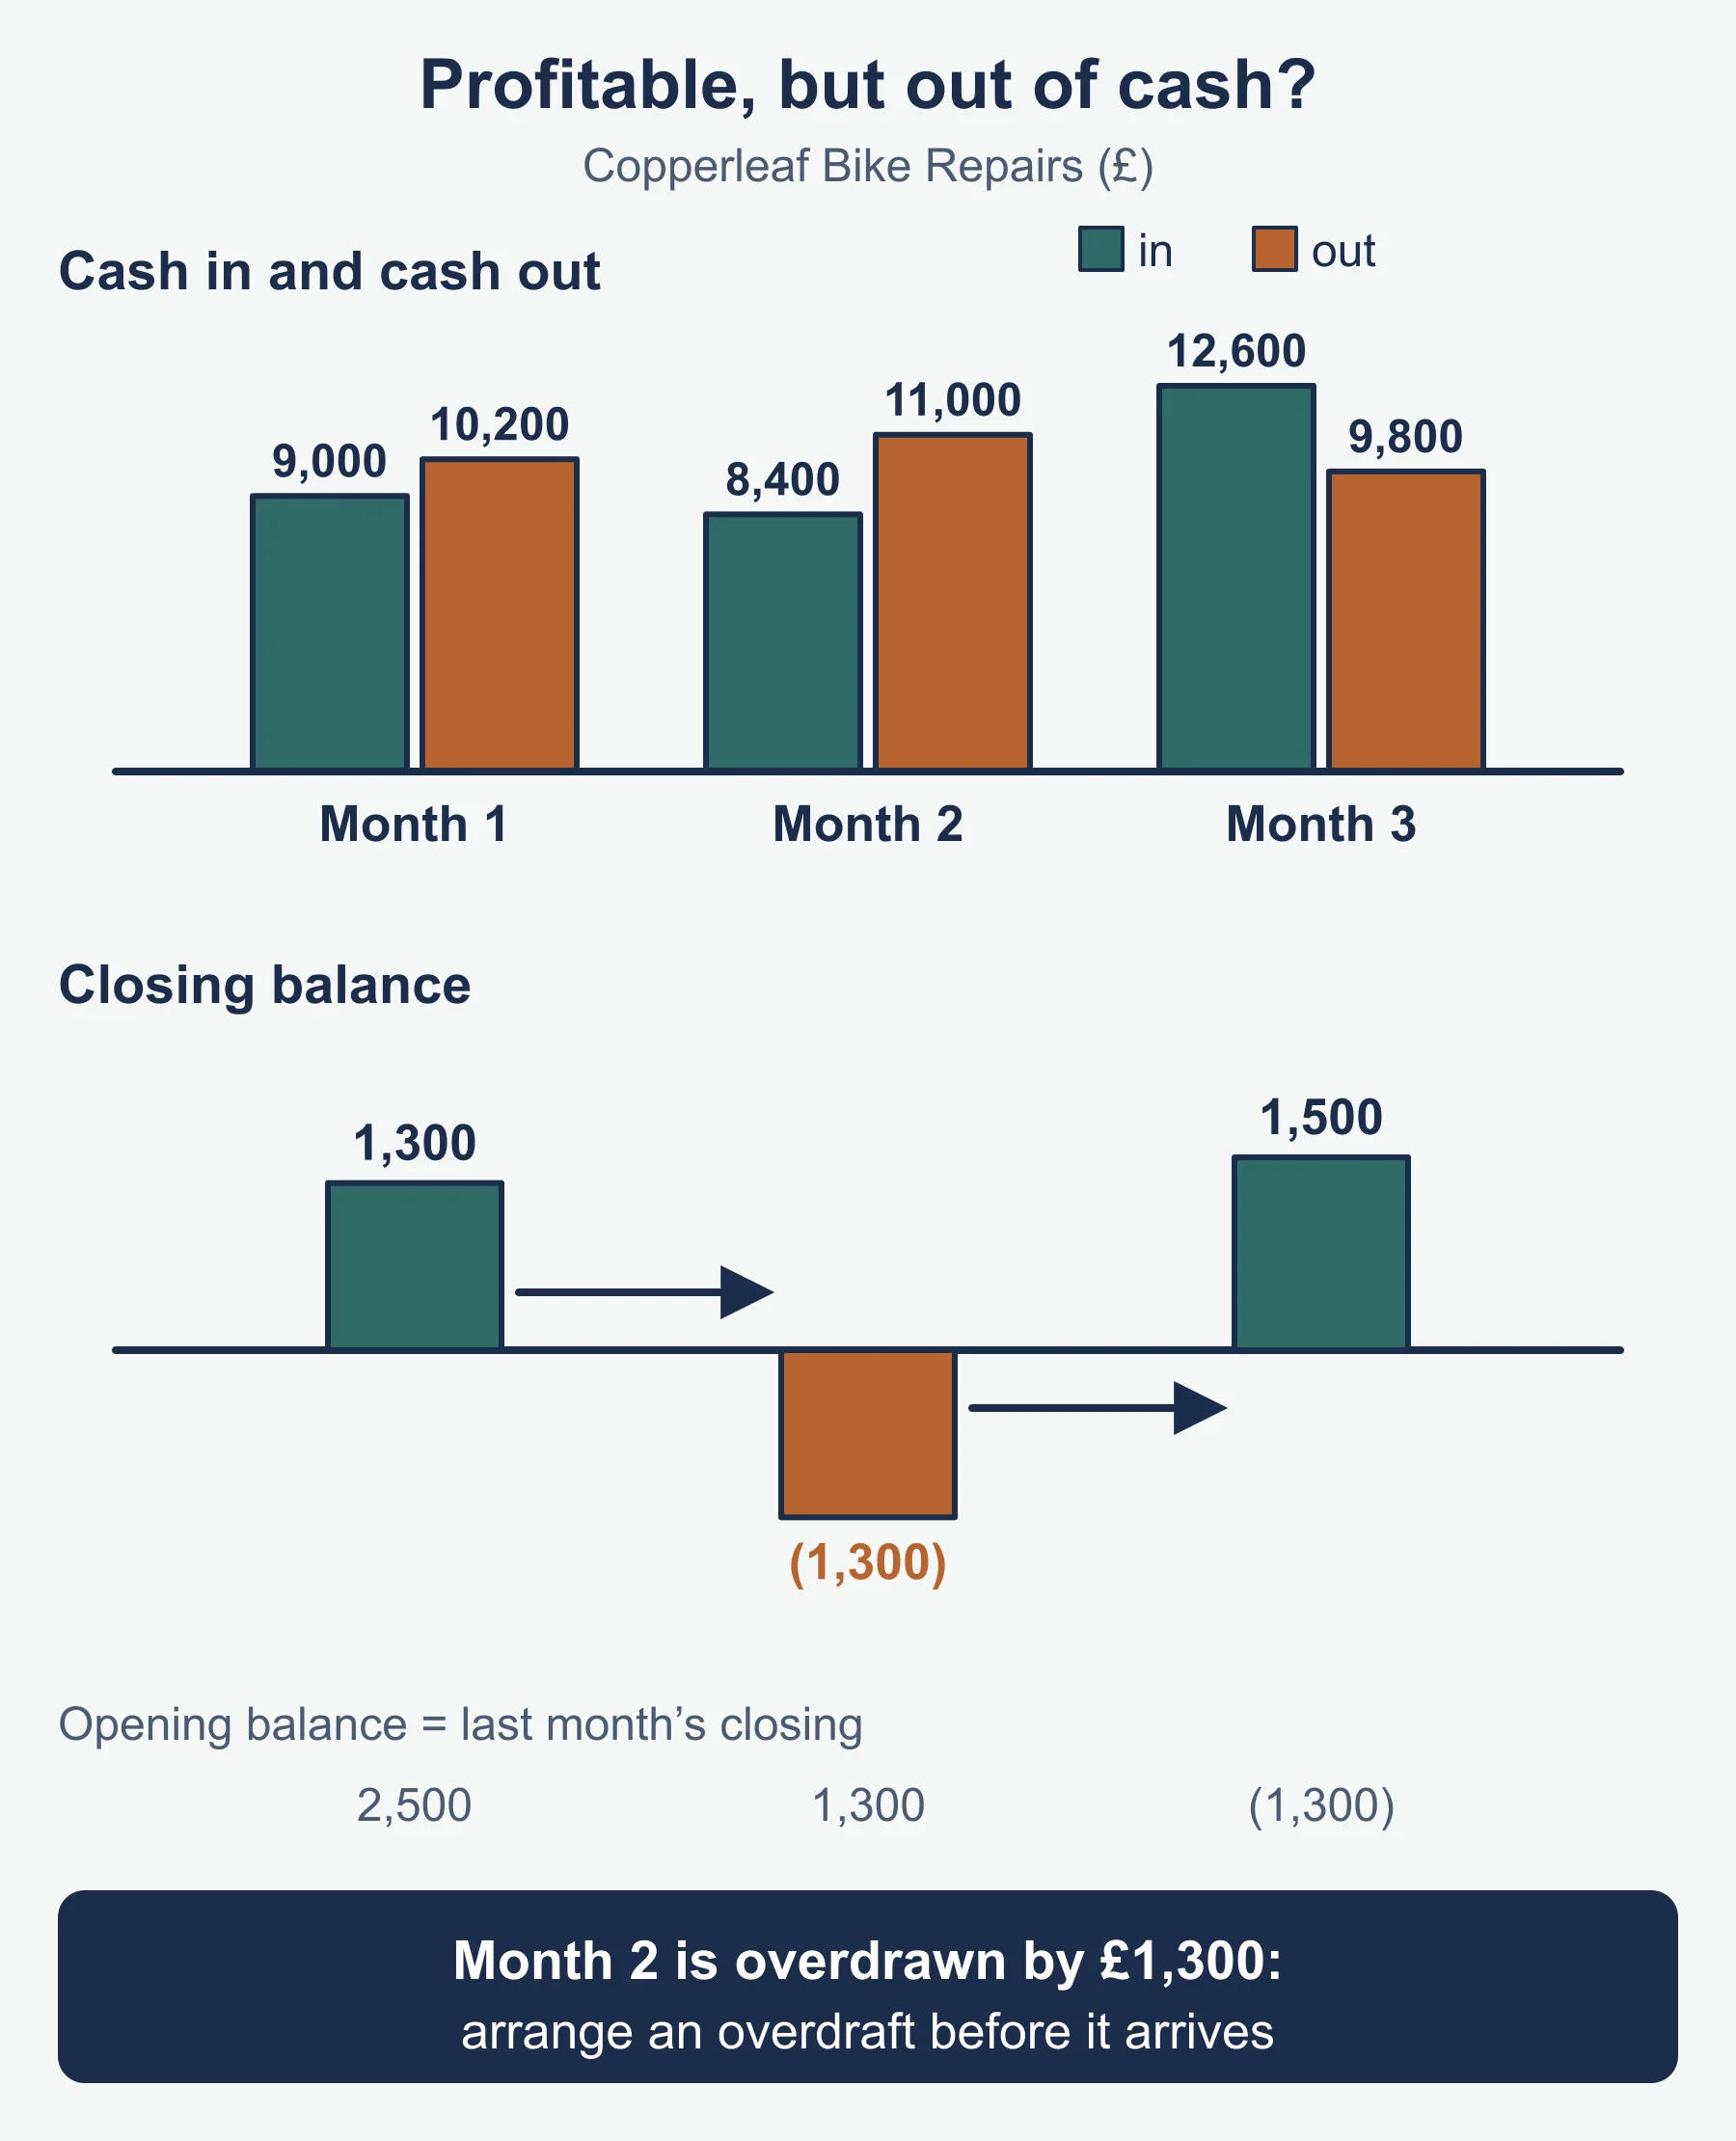
| Closing cash | opening cash + cash in − cash out |
| Next month’s opening cash | this month’s closing cash |
Method in steps for a cash-flow forecast
- Work out sales for each month.
- Split receipts by credit terms (for example 60% this month, 40% next).
- List payments in the month they are paid, including one-off items.
- Net cash flow = cash in − cash out.
- Closing = opening + net; carry it forward.
- Interpret: any negative closing balance needs action.
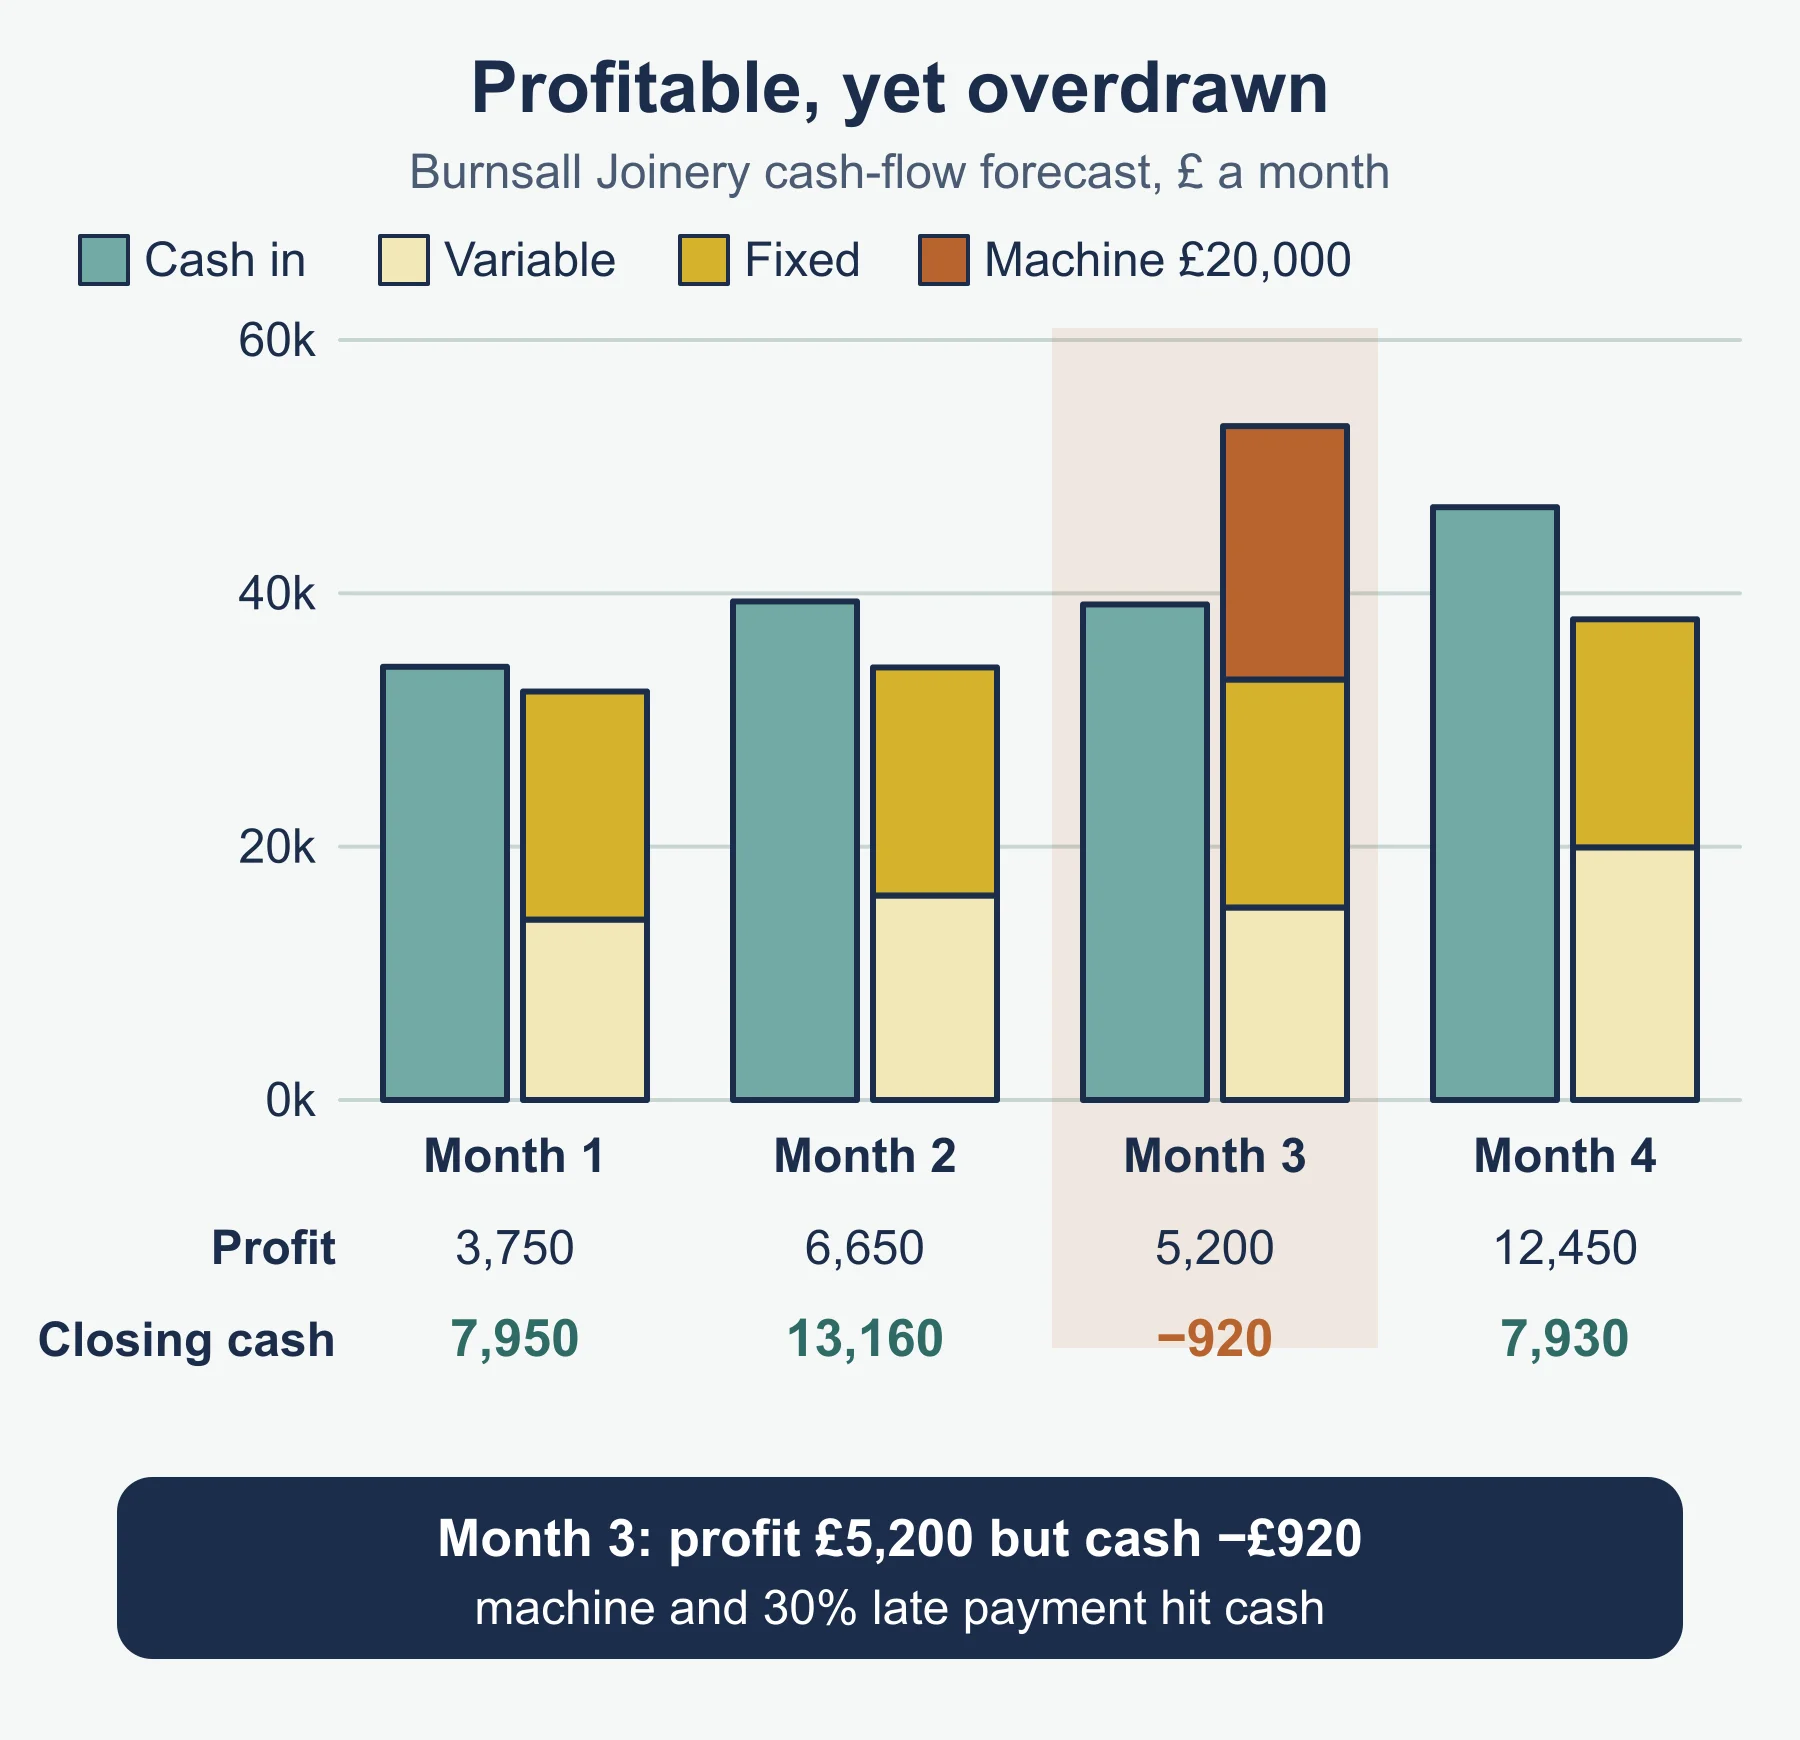
Reminder: profit is not cash. Credit terms, stock purchases and equipment buying shift cash away from profit.
Rushbeck Garden Centre mini-example. A cash forecast shows opening 2,000, receipts 9,000 and payments 11,500. Closing is 2,000 + 9,000 − 11,500 = −500, so the garden centre needs an overdraft or must delay a payment.
Seasonal and cyclical variation
| Seasonal | Cyclical | |
|---|---|---|
| Length | Within a year | Several years |
| Cause | Weather, holidays, calendar | Economic or industry cycle |
| Repeats | Predictably | Irregular in length and size |
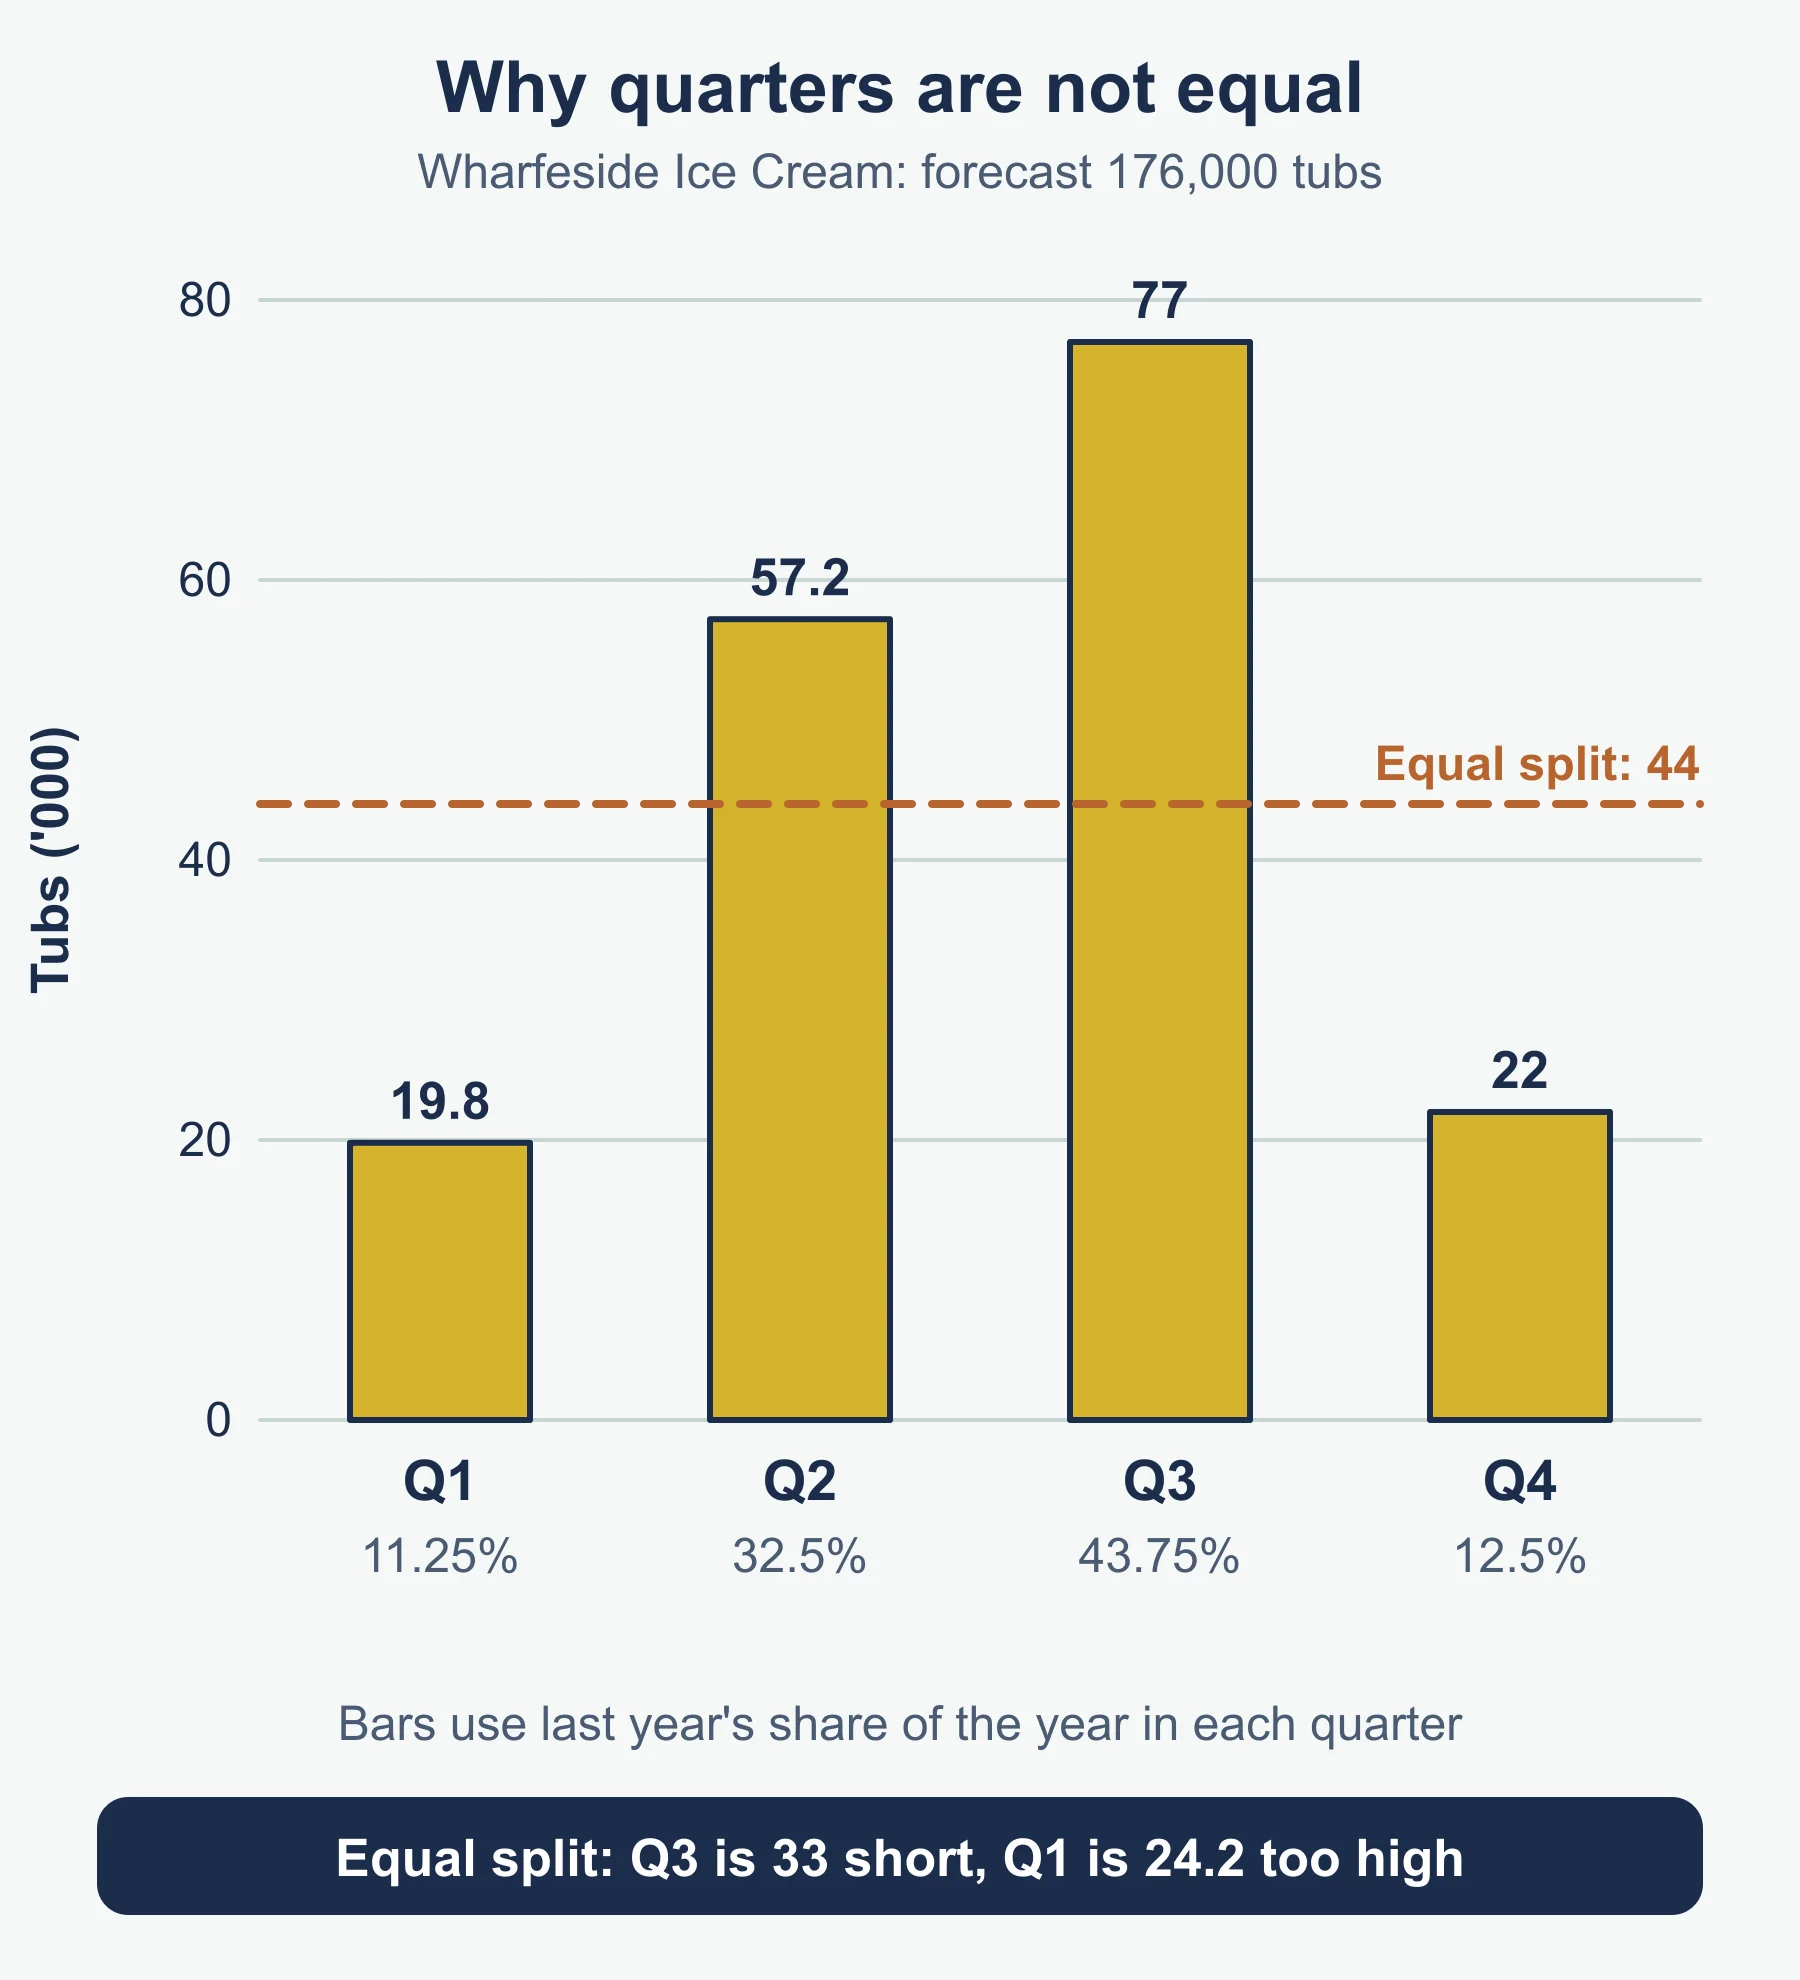
| Effect on forecasts | Monthly and quarterly figures differ from the annual average | Boom or slump can be mistaken for permanent change |
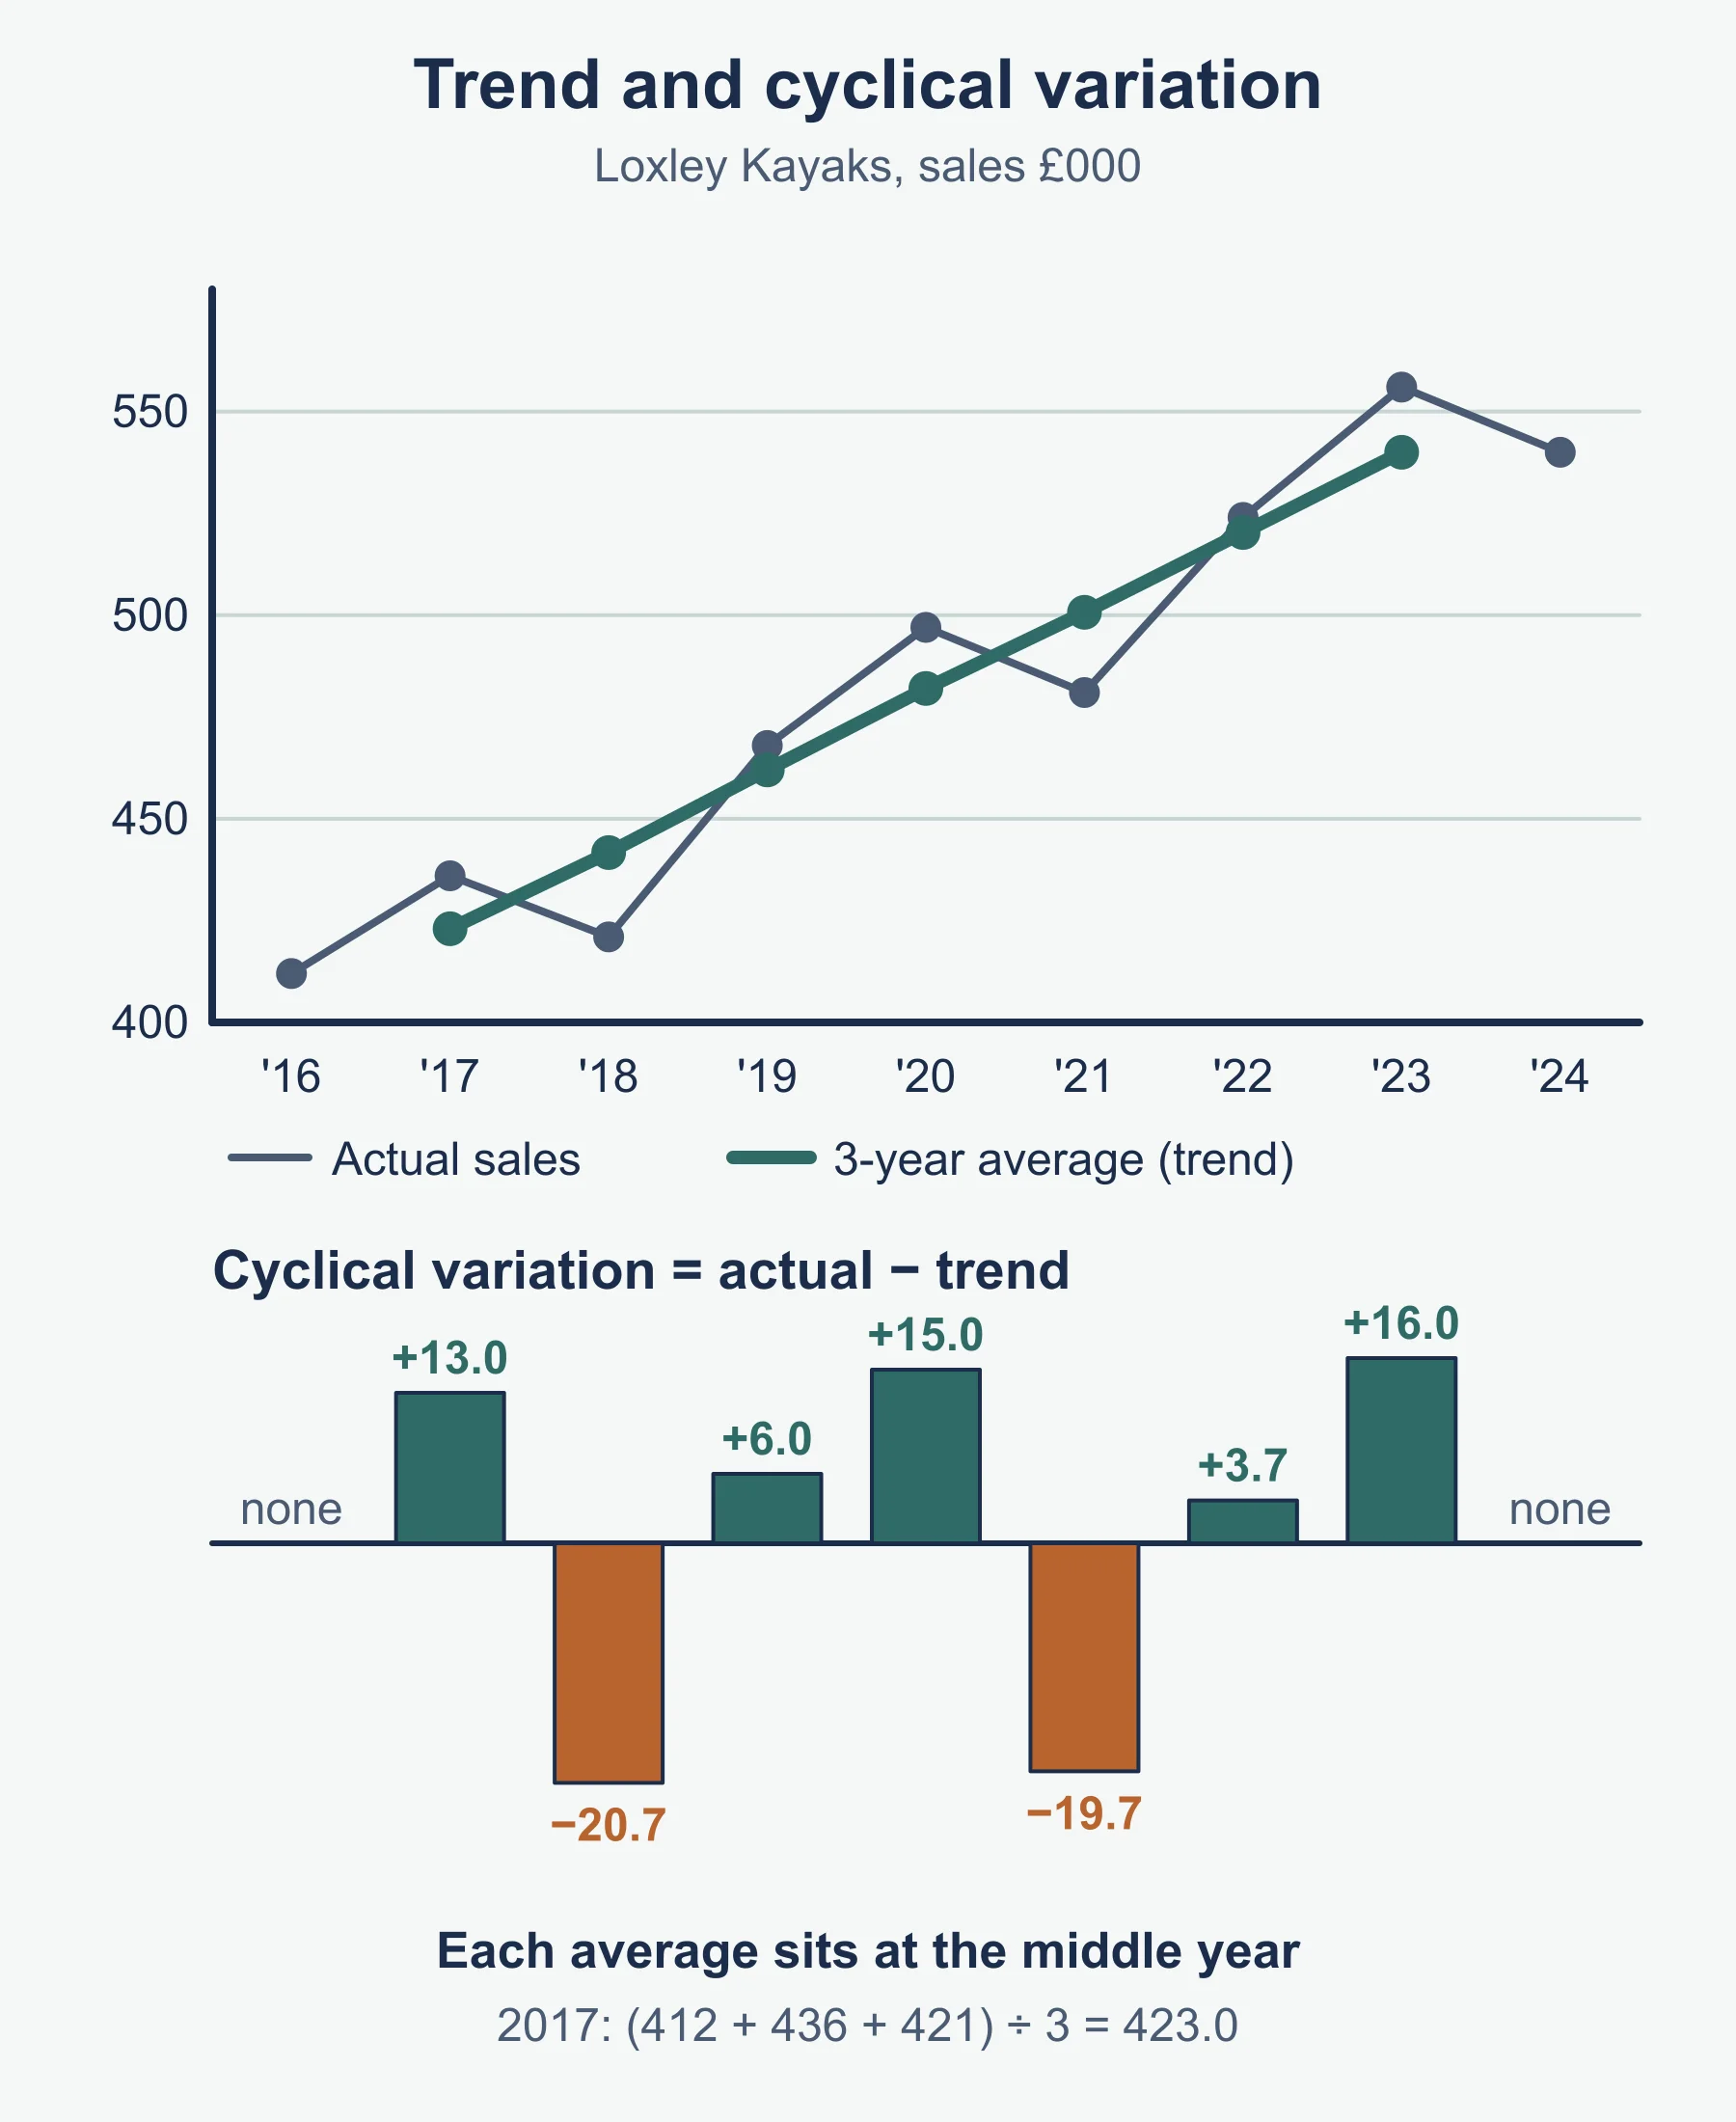
- Trend: the long-run direction, found by a moving average.
- Cyclical variation = actual value − trend value (standard form). Positive: above trend. Negative: below.
- Seasonal illustration: Rushbeck sells 240 plants a year, with shares of 15%, 47.5%, 30% and 7.5% across the quarters. The quarterly forecast is 36, 114, 72 and 18, not 60 each. Using shares like this is a simple illustration, not a method the specification names.
- Impact: ignoring seasonality leads to wrong stock and staffing; ignoring the cycle leads to over-expansion near a peak.
Time series analysis: moving averages (odd number of years)
Three-year moving average for a year = (previous + current + next) ÷ 3, written against the middle year.
Worked reminder: Lindeth Bakery, sales (£000) 2018 to 2024: 88, 92, 97, 95, 103, 108, 112.
| Year | Sales | Trend | Cyclical variation |
|---|---|---|---|
| 2019 | 92 | 92.3 | −0.3 |
| 2020 | 97 | 94.7 | +2.3 |
| 2021 | 95 | 98.3 | −3.3 |
| 2022 | 103 | 102.0 | +1.0 |
| 2023 | 108 | 107.7 | +0.3 |
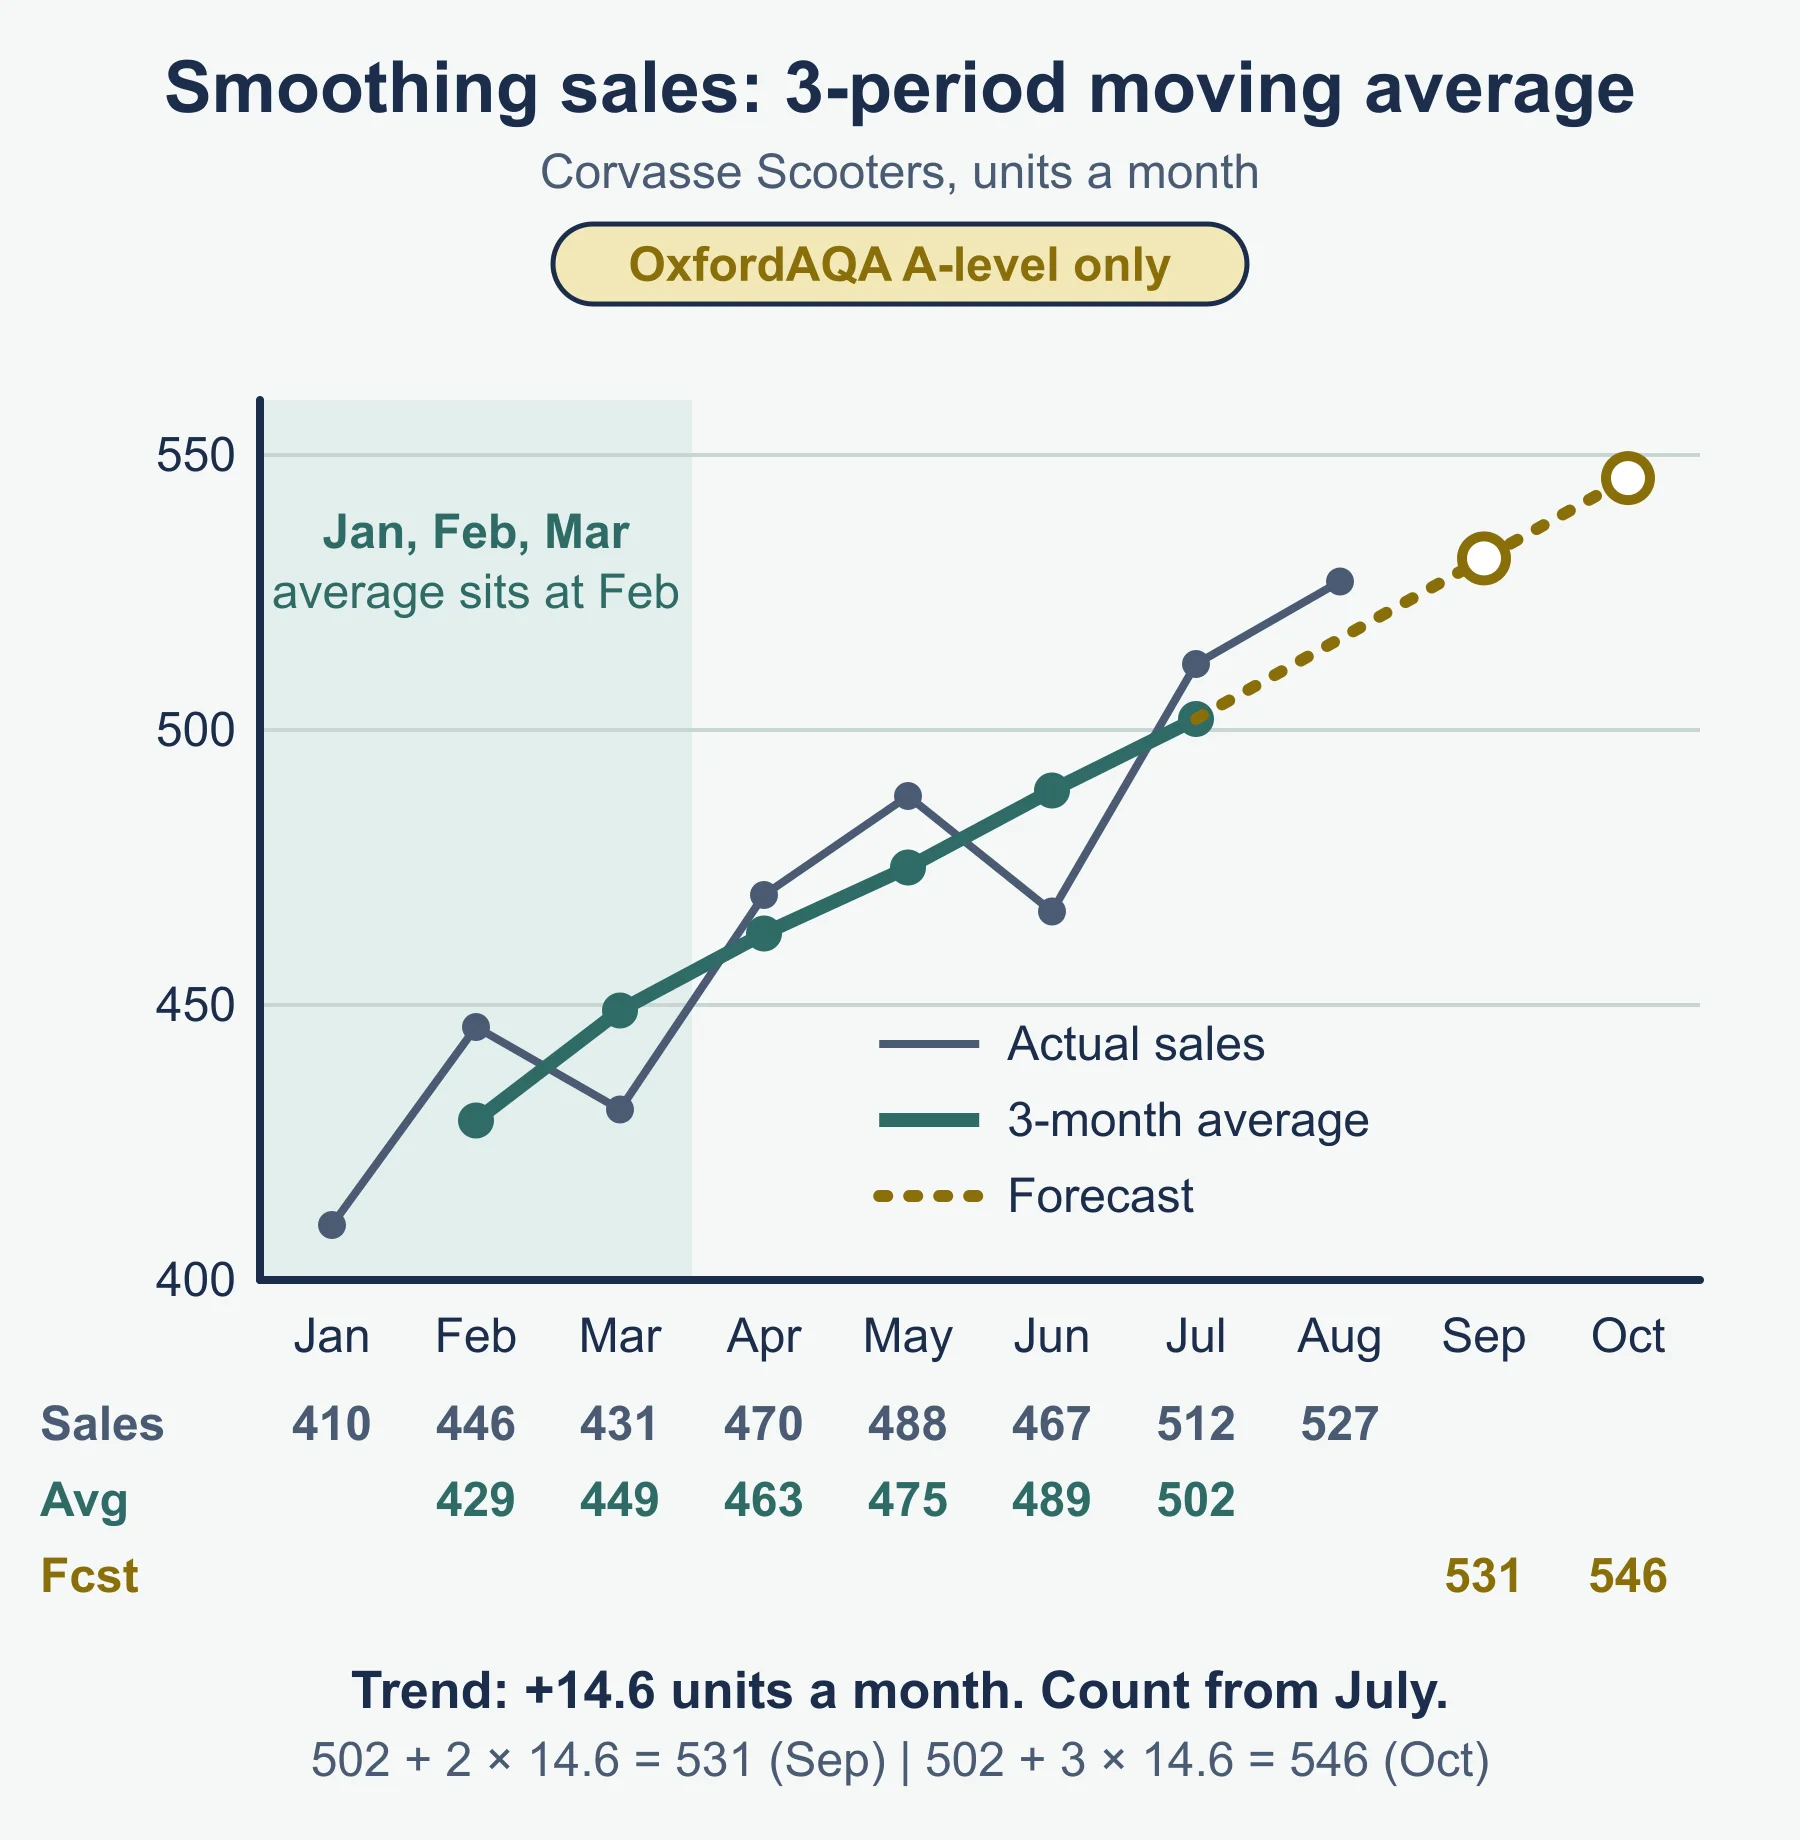
Trend moves from 92.3 to 107.7 over four years, so the average rise is 3.8 a year. Extrapolating: 2024 trend about 111.5, 2025 trend about 115.3. State that this is an estimate.
Method in steps
- Choose an odd number of years (3 or 5).
- Add that many consecutive values and divide.
- Place the result against the middle year.
- Find the average yearly change in the trend.
- Extend the trend forward for the forecast.
- Adjust for known cyclical or seasonal effects, and comment on reliability.
Evaluating time series analysis
- For: objective, cheap, smooths random fluctuation, shows direction.
- Against: assumes the past continues; no value for the latest years; cannot foresee shocks; needs enough reliable data; a longer average reacts more slowly.
Correlation and extrapolation
| Pattern on a scatter graph | Correlation |
|---|---|
| Points rise left to right | Positive |
| Points fall left to right | Negative |
| No clear pattern | None |
| Tight around a line | Strong |
| Spread widely | Weak |
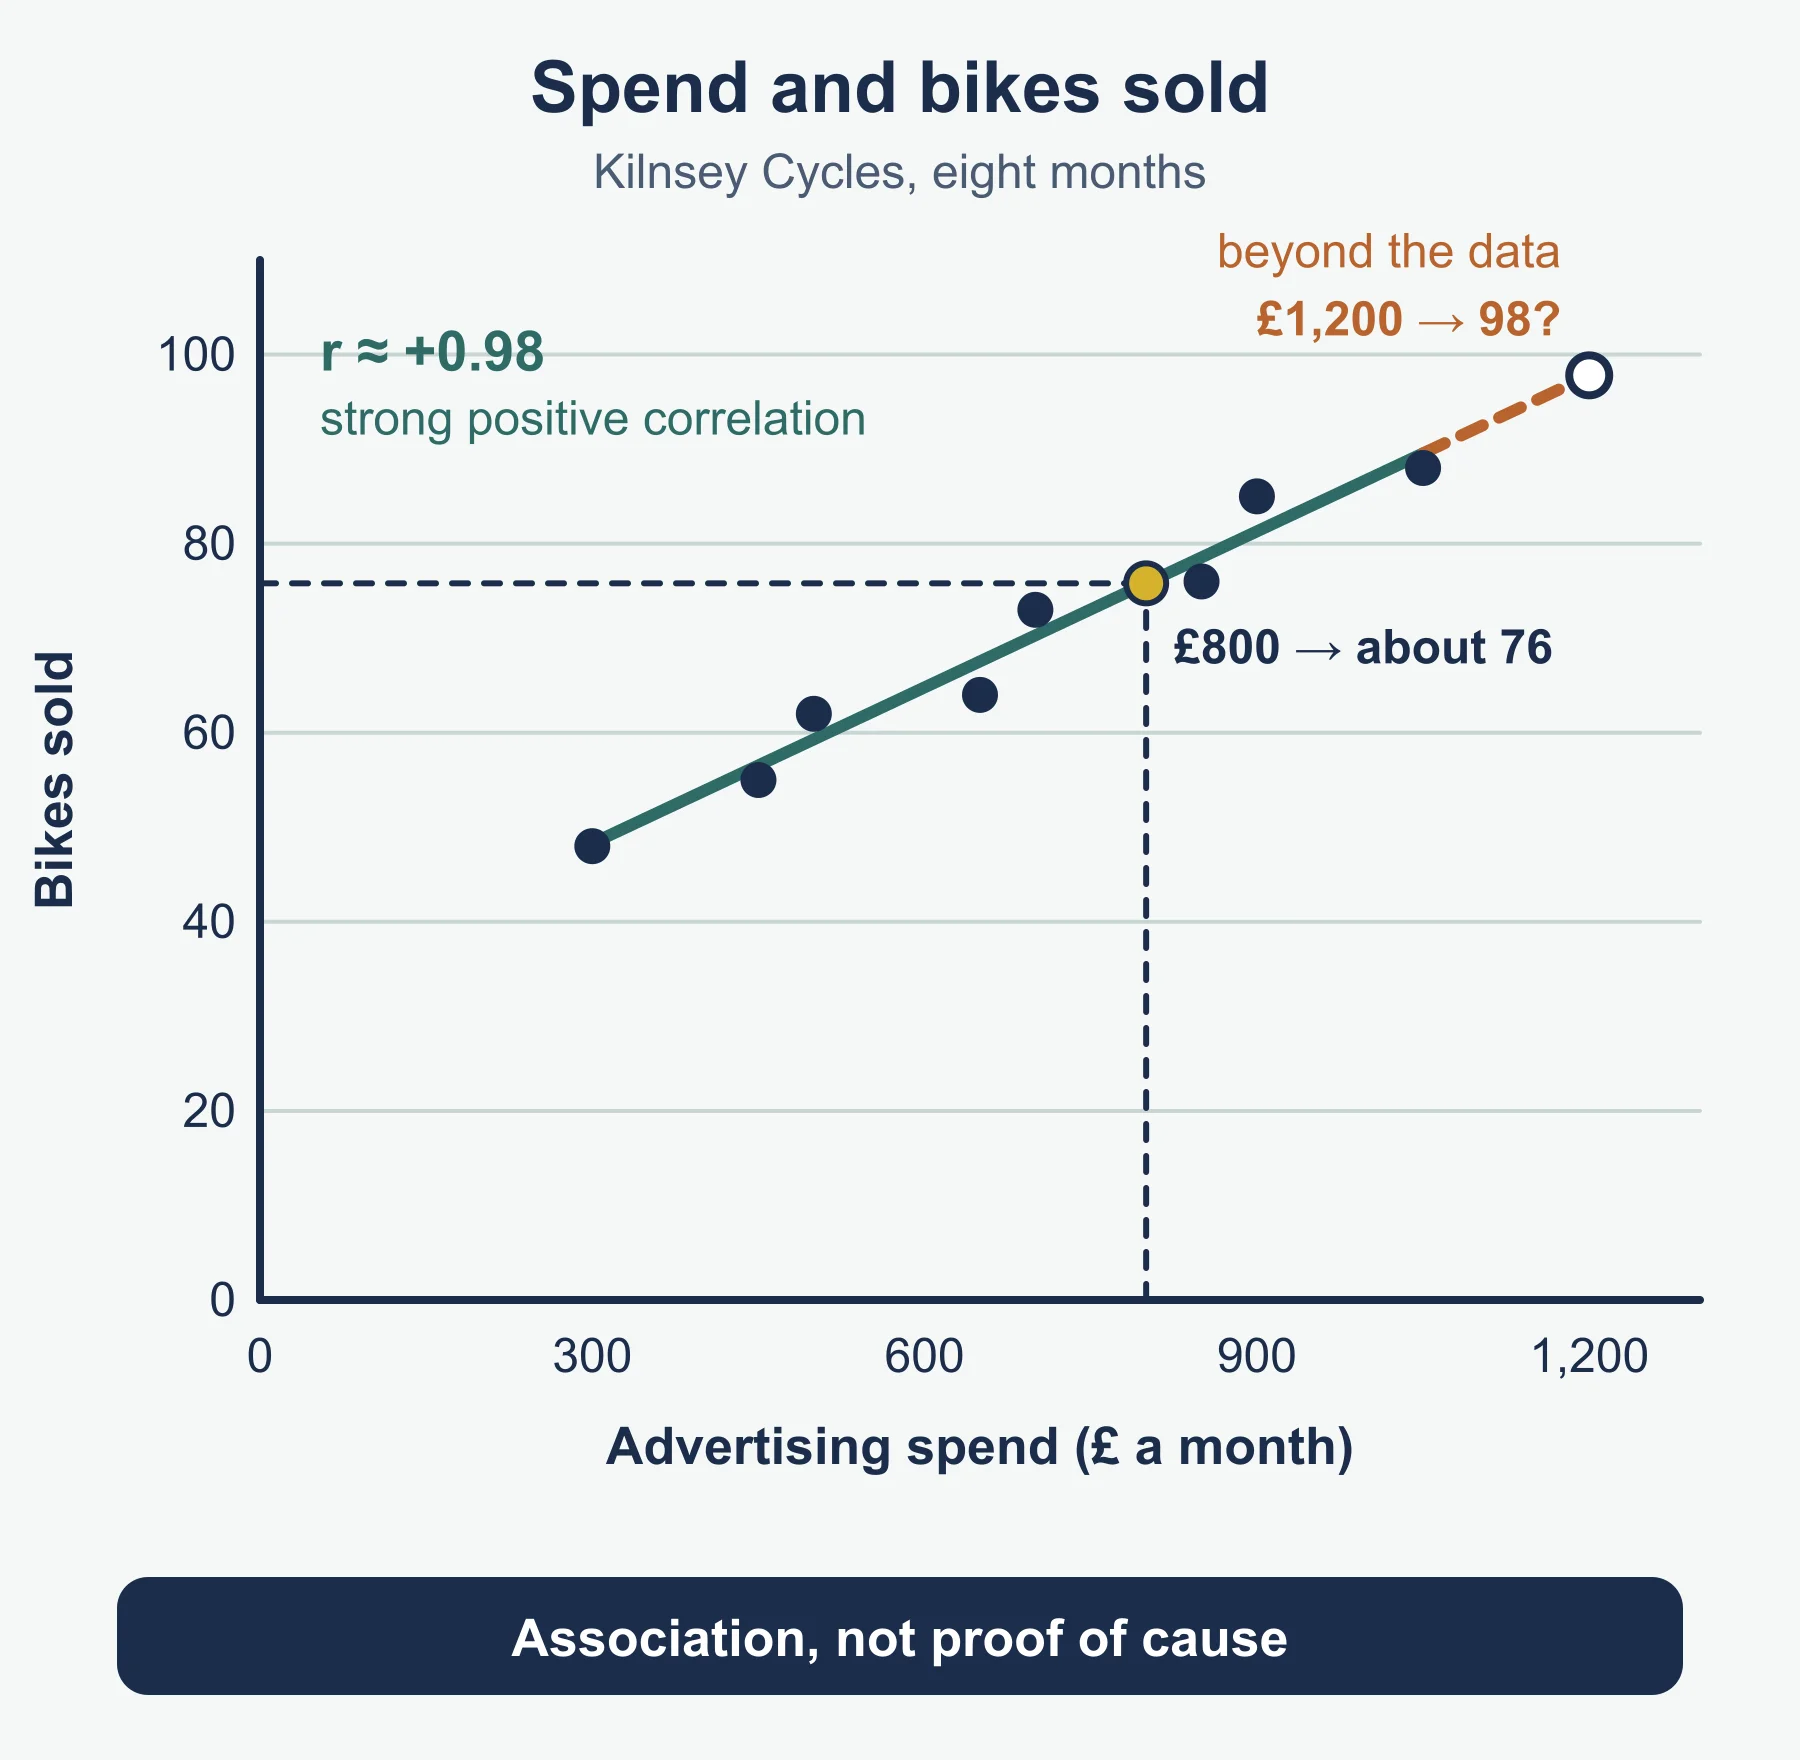
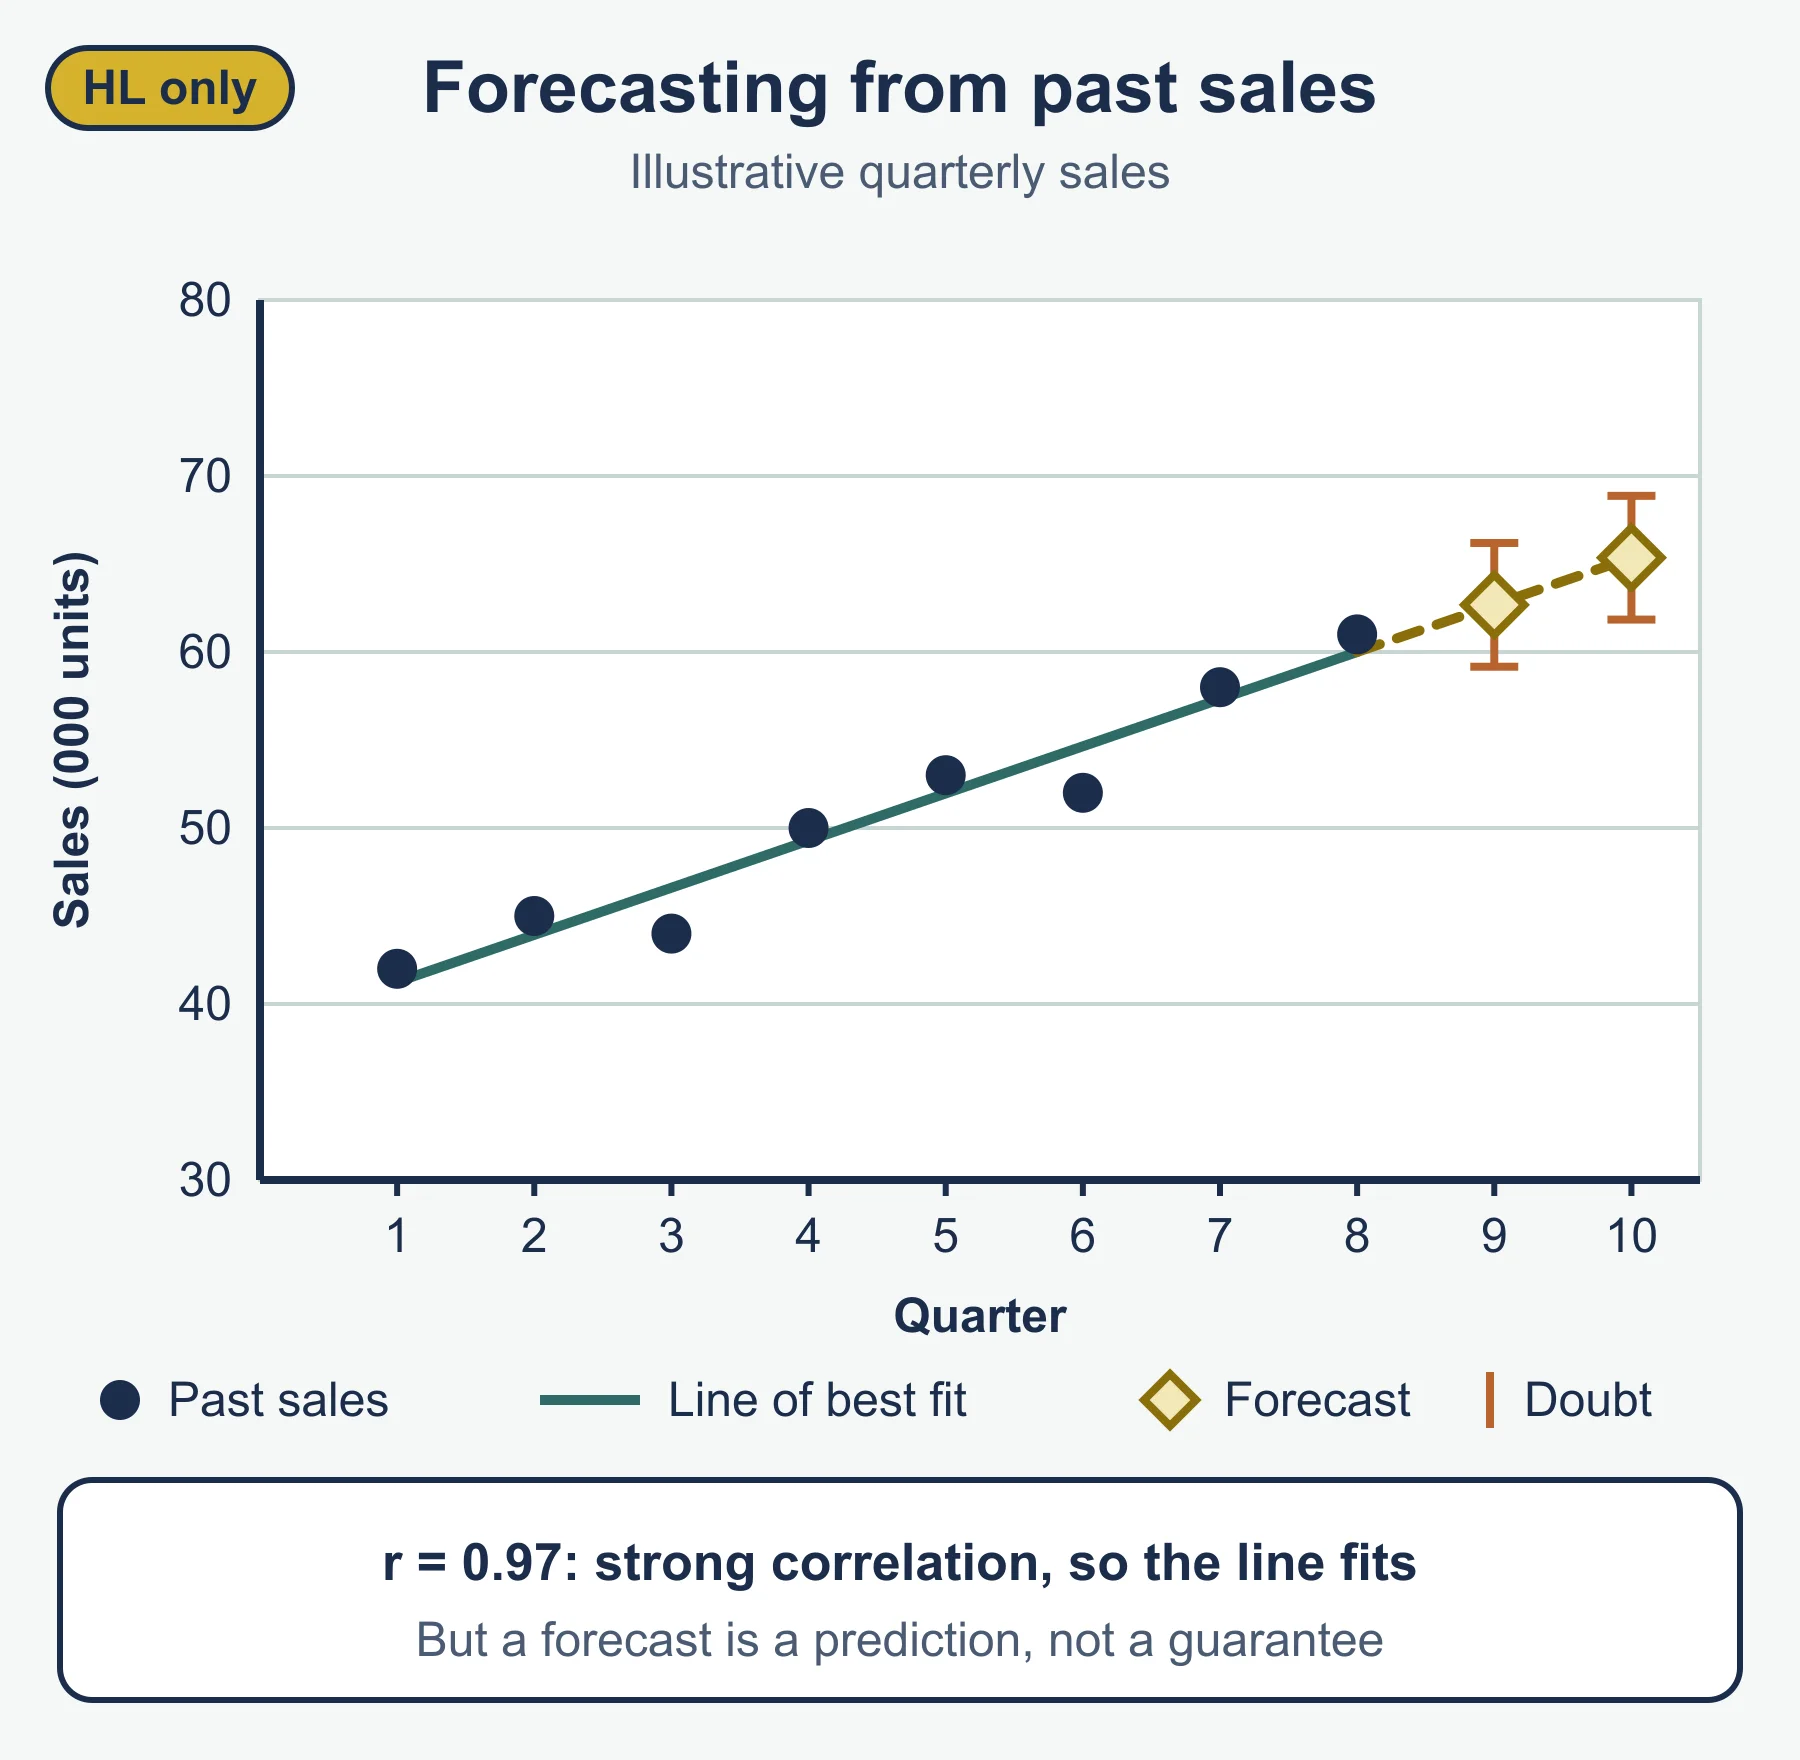
- A line of best fit lets you read off a forecast for a given value of the other variable.
- Correlation is not causation: a third factor may drive both.
- Extrapolation beyond the range of the data is less reliable than reading within it.
- For numerical or graphical data: find the average change or the slope, extend it, state the assumption, interpret the figure in the context of the business.
Responding to forecasts
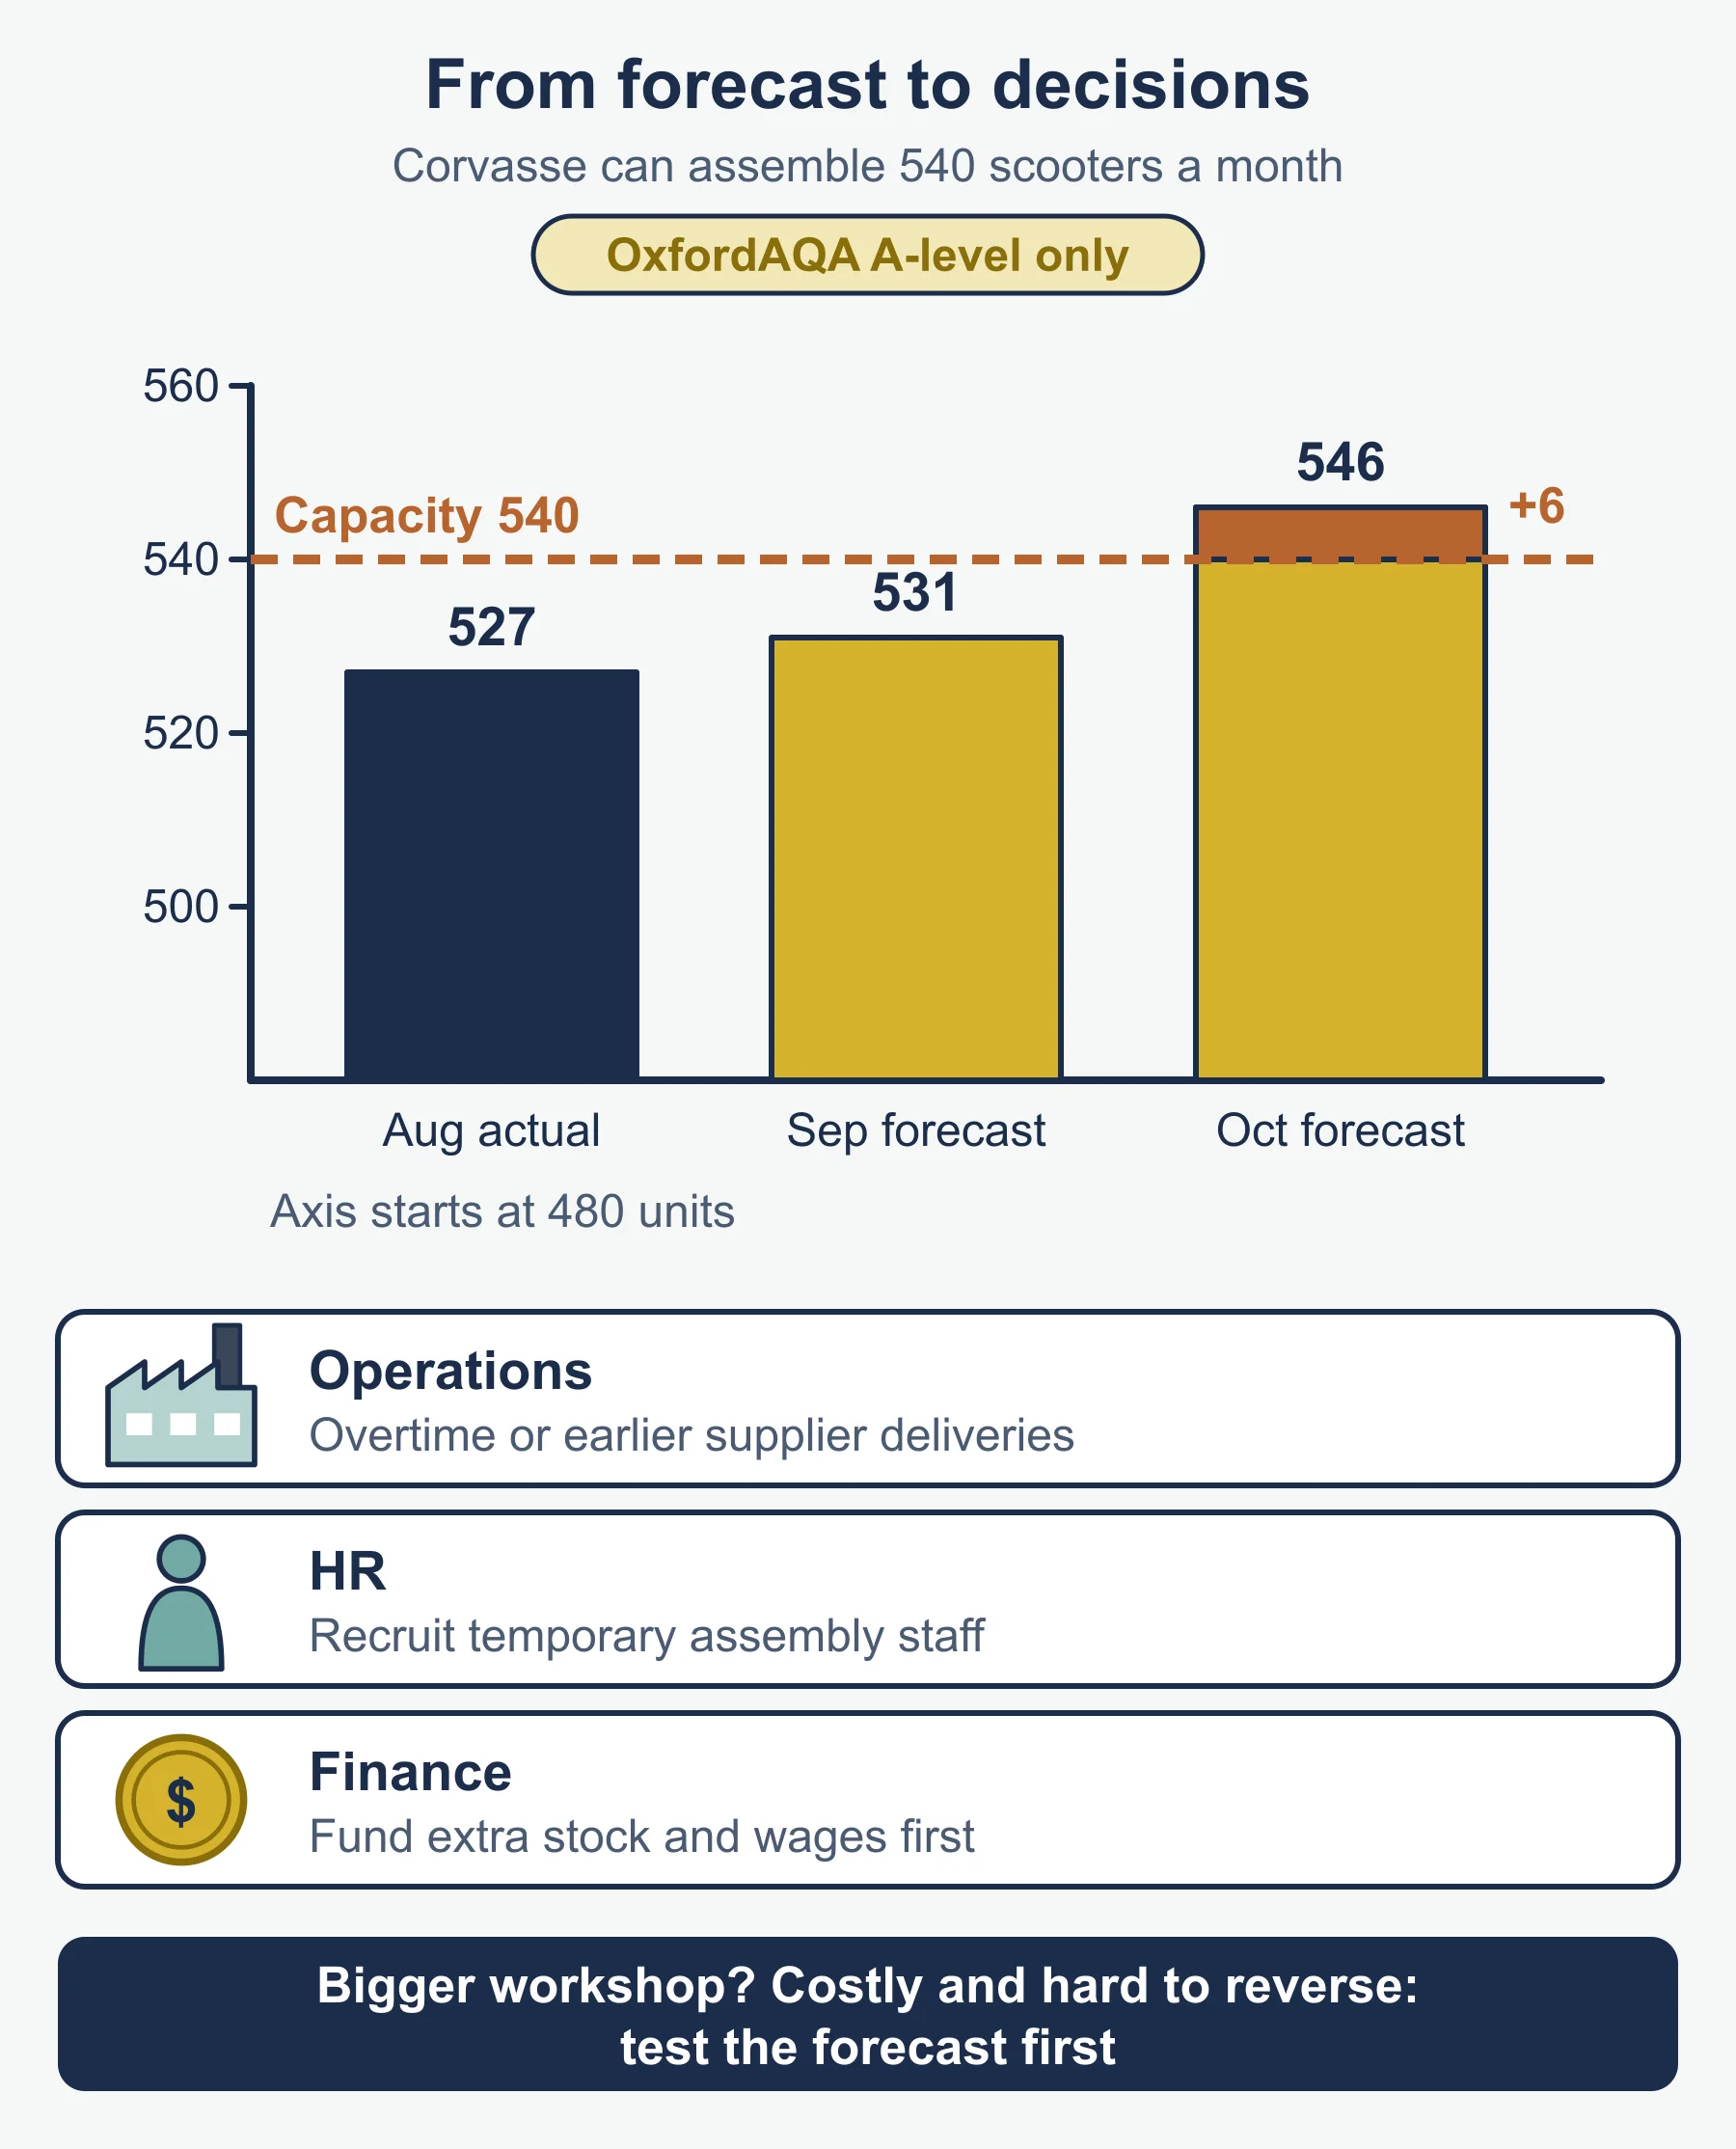
- Match the response to the size of the forecast gap and the cost of acting: adjust production, stock, staffing, prices or finance.
- Examples: arrange an overdraft for a forecast cash shortfall; hire temporary staff for a seasonal peak; delay expansion if the cycle is about to turn.
- To justify, give the reason and compare it with a realistic alternative.
- Importance of accuracy: high when decisions are expensive or hard to reverse, when the lead time is long, or when stakeholders such as lenders rely on the figures.
Quick self-test
- Define a forecast.
- Name two structured qualitative methods.
- Name two unstructured qualitative methods.
- Annual sales are 50, 56 and 53 (£000) in three consecutive years. Calculate the three-year moving average for the middle year.
- The actual value is 140 and the trend value is 132. Calculate the cyclical variation.
- A scatter graph gives a correlation of −0.9. What does that tell you?
- State one difference between seasonal and cyclical variation.
- Opening cash is £4,000, cash in is £18,000 and cash out is £20,500. Find the closing balance.
- A business sells 800 units at £15, with variable cost £9 per unit and fixed costs £4,000. Calculate profit.
- The trend in 2023 is 130 and rises by 6 a year. Extrapolate the trend for 2026.
- Give one reason why a moving average cannot be calculated for the latest year.
- Give one reason why accurate forecasting matters to lenders.
Answers
- An informed estimate of what will happen to a variable in the future.
- Delphi technique and expert opinion.
- Brainstorming and intuition.
- (50 + 56 + 53) ÷ 3 = 53.0, so £53,000.
- 140 − 132 = +8, so 8 above trend.
- Strong negative correlation: as one variable rises, the other tends to fall. It does not prove cause.
- Seasonal repeats within a year; cyclical spans several years and is irregular in length.
- 4,000 + 18,000 − 20,500 = £1,500.
- Revenue 12,000, variable costs 7,200, fixed costs 4,000, so profit is £800.
- 130 + 3 × 6 = 148.
- A three-year average needs the following year’s value, which does not exist yet.
- They rely on cash-flow forecasts to judge whether repayments will be met, so an error raises the risk of default.
Where marks are usually lost
- Describing a method without saying how it is used to forecast.
- Mixing up structured and unstructured methods.
- Writing the moving average against the first year of the three, not the middle one.
- Subtracting the wrong way round for cyclical variation.
- Treating profit and closing cash as the same number.
- Forgetting that opening cash equals the previous month’s closing cash.
- Claiming that correlation proves cause.
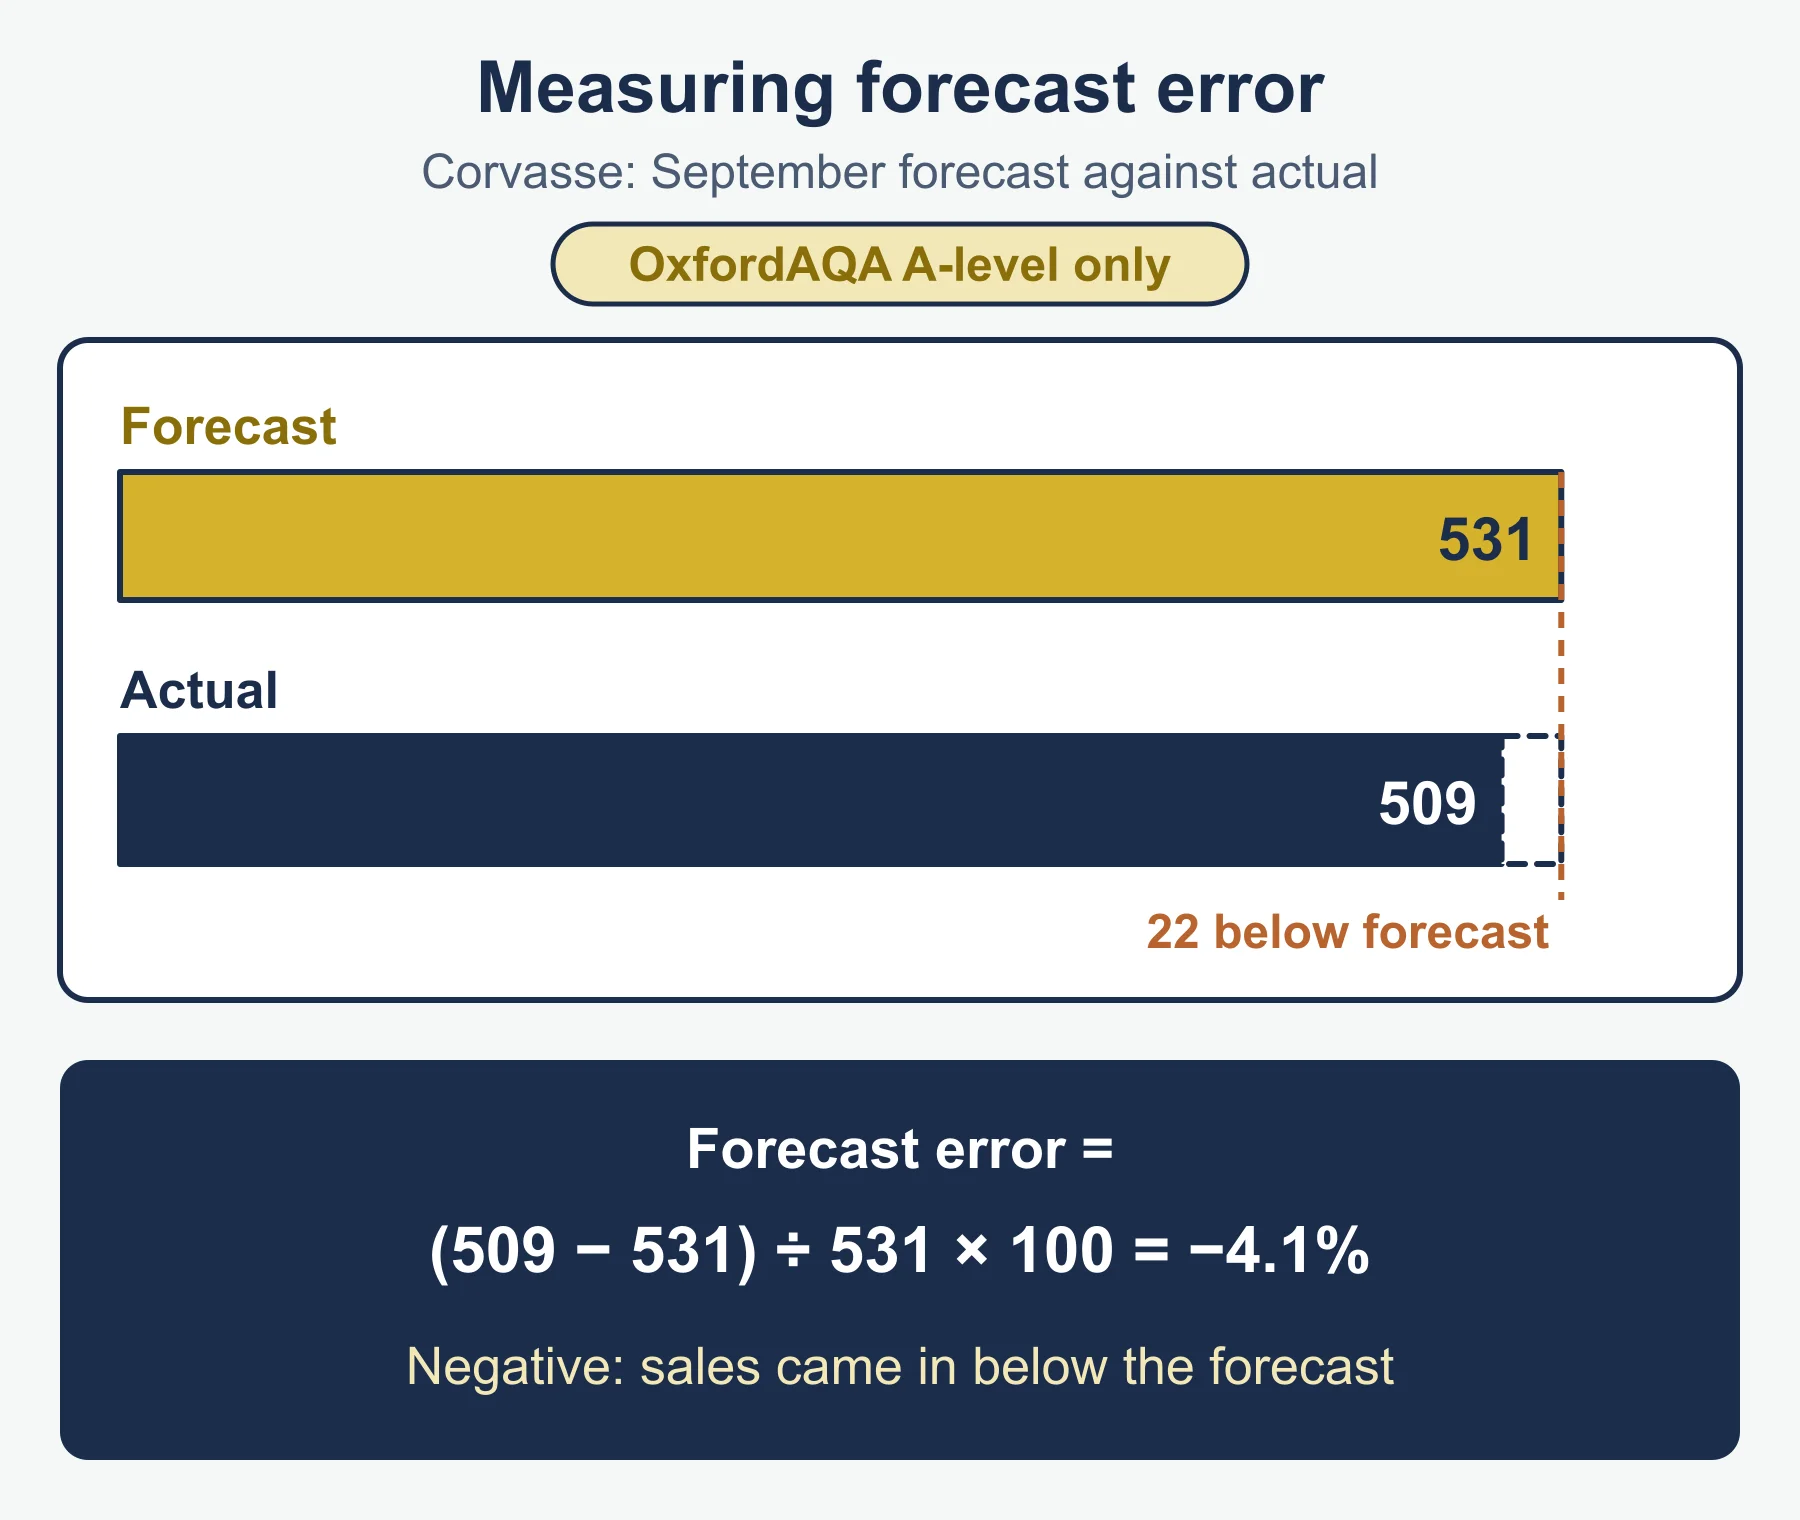
- Giving a forecast as exact, with no comment on assumptions or reliability.
- Listing advantages and disadvantages with no judgement tied to the business in the case.
- Recommending a response with no reason or no comparison with an alternative.
Frequently asked questions
What is the difference between seasonal and cyclical variation? Seasonal variation is a regular, repeating pattern within a year, linked to weather, holidays or the calendar. Cyclical variation is a longer pattern over several years, linked to the economic cycle or an industry cycle of boom, slowdown, recession and recovery.
How do you calculate cyclical variation? Cyclical variation = actual value − trend value, where the trend comes from a moving average. Calculating trend minus actual reverses the sign.
Does correlation prove that one variable causes another? No. Correlation is not causation: a third factor may drive both variables, so treat a forecast based on correlation with care.
What is the difference between qualitative and quantitative forecasting? Qualitative forecasting uses judgement, opinion and experience, and suits a new product with no history. Quantitative forecasting uses numerical data and calculation, such as moving averages and correlation.
Official syllabus
OCR A Level Business (H431), Version 2.1 (January 2026), published by OCR, for first assessment in 2017 with final assessment in summer 2027. Content covered: Forecasting, within the area of study Business objectives and strategy.
Get free revision emails (optional)
Occasional emails with practice questions, worked explanations and links to free resources for the qualification and subjects you choose. No spam, and you can unsubscribe from any email. The free tools on this site never need an email.
Related resources
-
Study guides
OCR A Level Business: Measures of performance: financial and non-financial (H431)
Guide to financial and non-financial measures of performance for OCR A Level Business H431, with worked ratio, cash-flow and variance examples.
Business · OCR · A Level
Read guide -
Practice questions
OCR A Level Business: Measures of performance: financial and non-financial (H431) – Practice Questions
Twelve original practice questions with worked answers on financial and non-financial measures of performance for OCR A Level Business H431.
Business · OCR · A Level
Try questions -
Revision notes
OCR A Level Business: Measures of performance: financial and non-financial (H431) – Revision Notes
Condensed recall notes on financial and non-financial measures of performance for OCR A Level Business H431: ratios, cash flow, variances and a self-test.
Business · OCR · A Level
Revise topic
Related articles
-
teaching
A Level tuition in Dubai: Cambridge or Pearson Edexcel International A Level?
Schools in Dubai and Abu Dhabi teach either Cambridge International AS & A Level or Pearson Edexcel International A Level. How the two are structured, why it matters for tuition, and how online classes from Lahore work.
9 October 2026
-
curriculum guides
Choosing subjects at IGCSE and A Level
How subject choices at 14 and 16 affect university options later, and how to keep pathways open without overloading a timetable.
28 July 2026
Studying this with a teacher
Working through Business A LEVELS?
This page is free and stays free. If you would rather be taught it, Marlbridge runs Business classes one-to-one, online in your own time zone. One-to-one only for this course: Rs 6,000 per class in Pakistan, with other currencies on the fees page. The first trial class is free. WhatsApp replies within an hour (8am–11pm Pakistan time, every day); email the same day.
OCR Business teachers at Marlbridge
