
Study Guides
OCR A Level Business: Risk and uncertainty and Opportunity cost (H431)
Study guide to risk and reward, quantifiable and unquantifiable risk, uncertainty and opportunity cost for OCR A Level Business, with worked examples.
- Subject
- Business
- Level
- A LEVELS
- Topic
- Business objectives and strategic decisions
- Author
- Marlbridge Academic Team
- Updated
- Reviewed by
- Salman Ahmad (what this means)
Aligned to OCR A Level Business (H431), Version 2.1 (January 2026), for first assessment in 2017; final assessment summer 2027. Official specification .
Syllabus page (what it covers and how it is assessed): OCR A Level Business.
Syllabus points this page covers
H431
- 1.7 Risk and uncertainty
- 1.8 Opportunity cost
Found an error? Report a correction.
Need help with this topic? Request a free trial class for A Level Business (H431).
This guide teaches the Risk and uncertainty and Opportunity cost content (numbered 1.7 and 1.8 on this site; the specification itself does not number them) of the OCR A Level Business specification (H431, Version 2.1, January 2026), both part of the Business objectives and strategic decisions area. It follows the wording of the learning outcomes in the specification. The qualification has three components, each a two-hour written paper. See the OCR A Level Business hub and the printable checklist.
Wider context is in the area study guide and area revision notes. For this unit, use the quick revision notes and the practice questions. Not sure where you stand? Try a free 10-minute diagnostic.
What you must be able to do
| Content | What the specification asks of you |
|---|---|
| Risk and reward | Explain both terms and the relationship between them; evaluate that relationship in a business |
| Quantifiable and unquantifiable risk | Distinguish them; evaluate each type of risk to a business |
| Managing risk | Evaluate ways to reduce risk; evaluate the consequences of poor risk management for the business and its stakeholders |
| The entrepreneur | Evaluate the specific risks an entrepreneur faces |
| Uncertainty | Explain it; distinguish internal from external causes; evaluate their impact on the business and its stakeholders; explain effects on aims and objectives, planning, decision making, business analysis and forecasting |
| Opportunity cost | Explain it; identify it for a business decision; analyse its impact on decision making |
Risk and reward
Risk is the possibility that a decision ends worse than hoped: a loss, lower profit or damage to the business. Reward is the benefit that a business or entrepreneur gains if the decision works, such as profit, growth, market share or a return on money invested.
The usual relationship is that higher potential reward comes with higher risk. A safe, familiar activity earns a modest return. An untested market can earn far more but can also lose the investment.
The relationship is a tendency, not a law. Evaluate it by asking:
- Is the extra reward large enough to justify the extra risk?
- Can the business survive the worst case?
- How do stakeholders view it? Owners who can spread their money may accept more risk than employees whose jobs depend on one firm.
- What are the business’s objectives? A business aiming at survival will accept less risk than one aiming at rapid growth.
Worked example: risk and reward at Mossgill Cycles
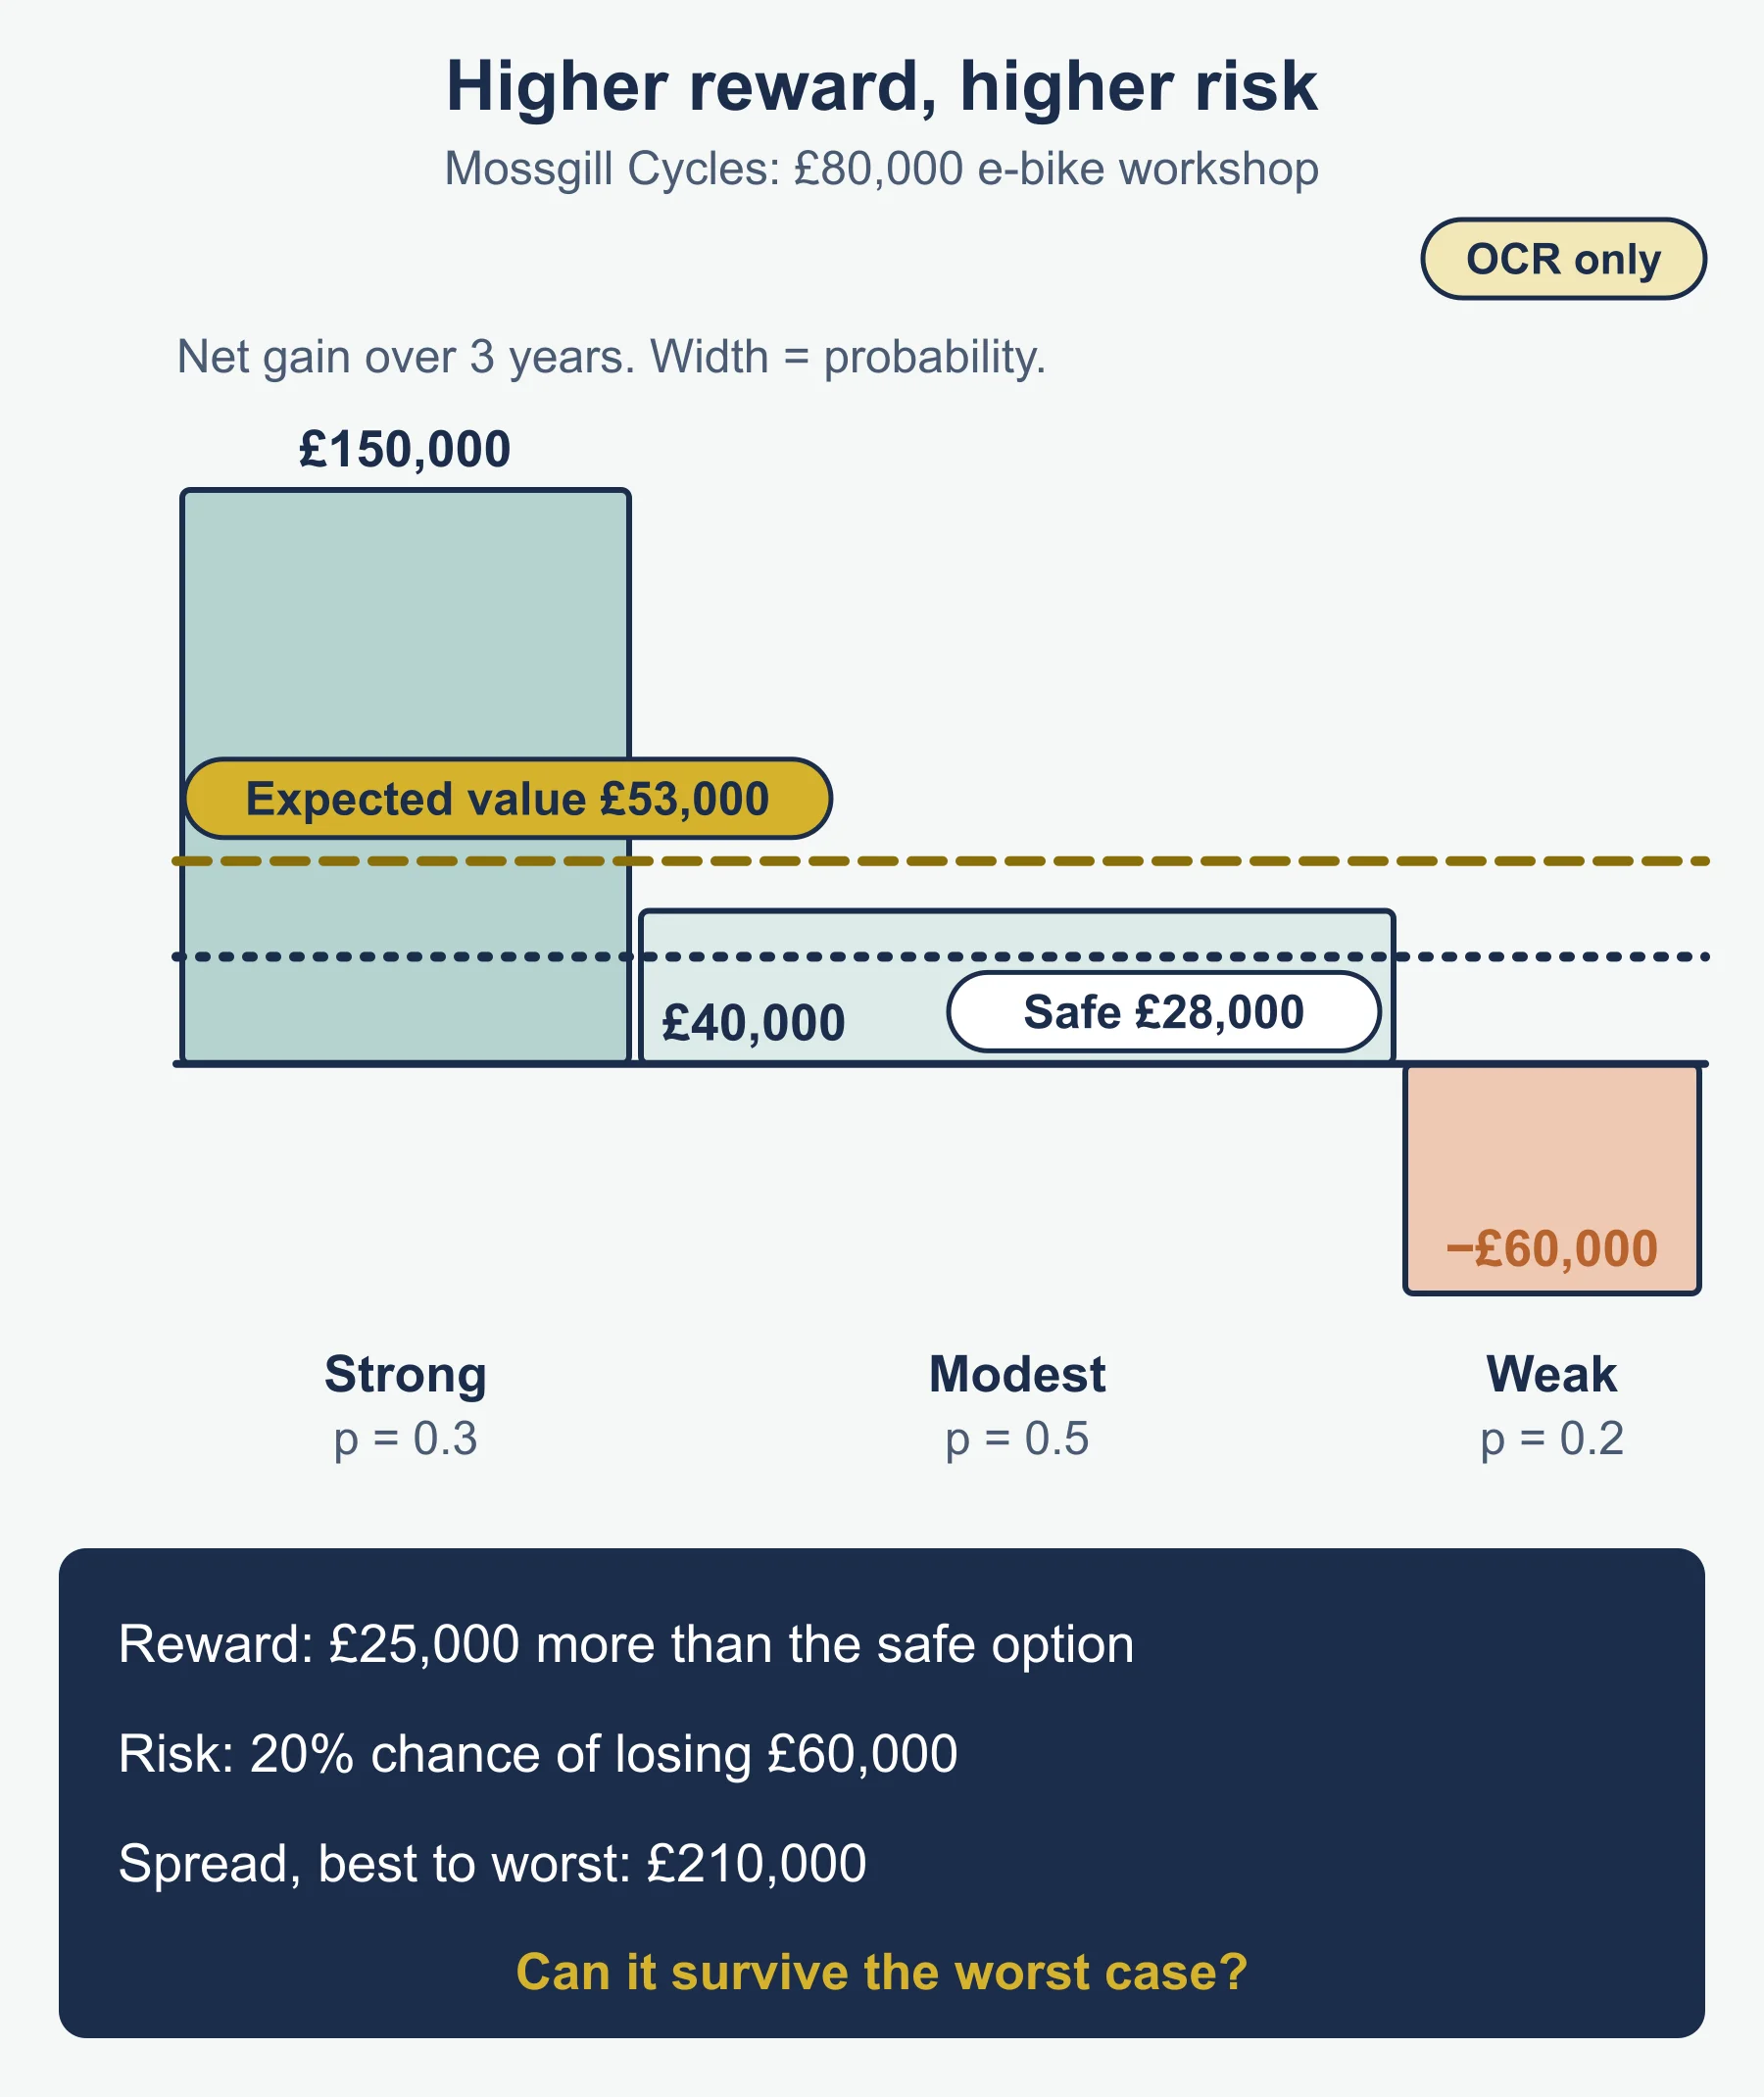
Mossgill Cycles is a three-shop bicycle retailer. It is considering an £80,000 e-bike workshop. Its managers estimate the net gain over three years, after recovering the outlay, as follows.
| Outcome | Net gain | Probability |
|---|---|---|
| Strong take-up | £150,000 | 0.3 |
| Modest take-up | £40,000 | 0.5 |
| Weak take-up | -£60,000 | 0.2 |
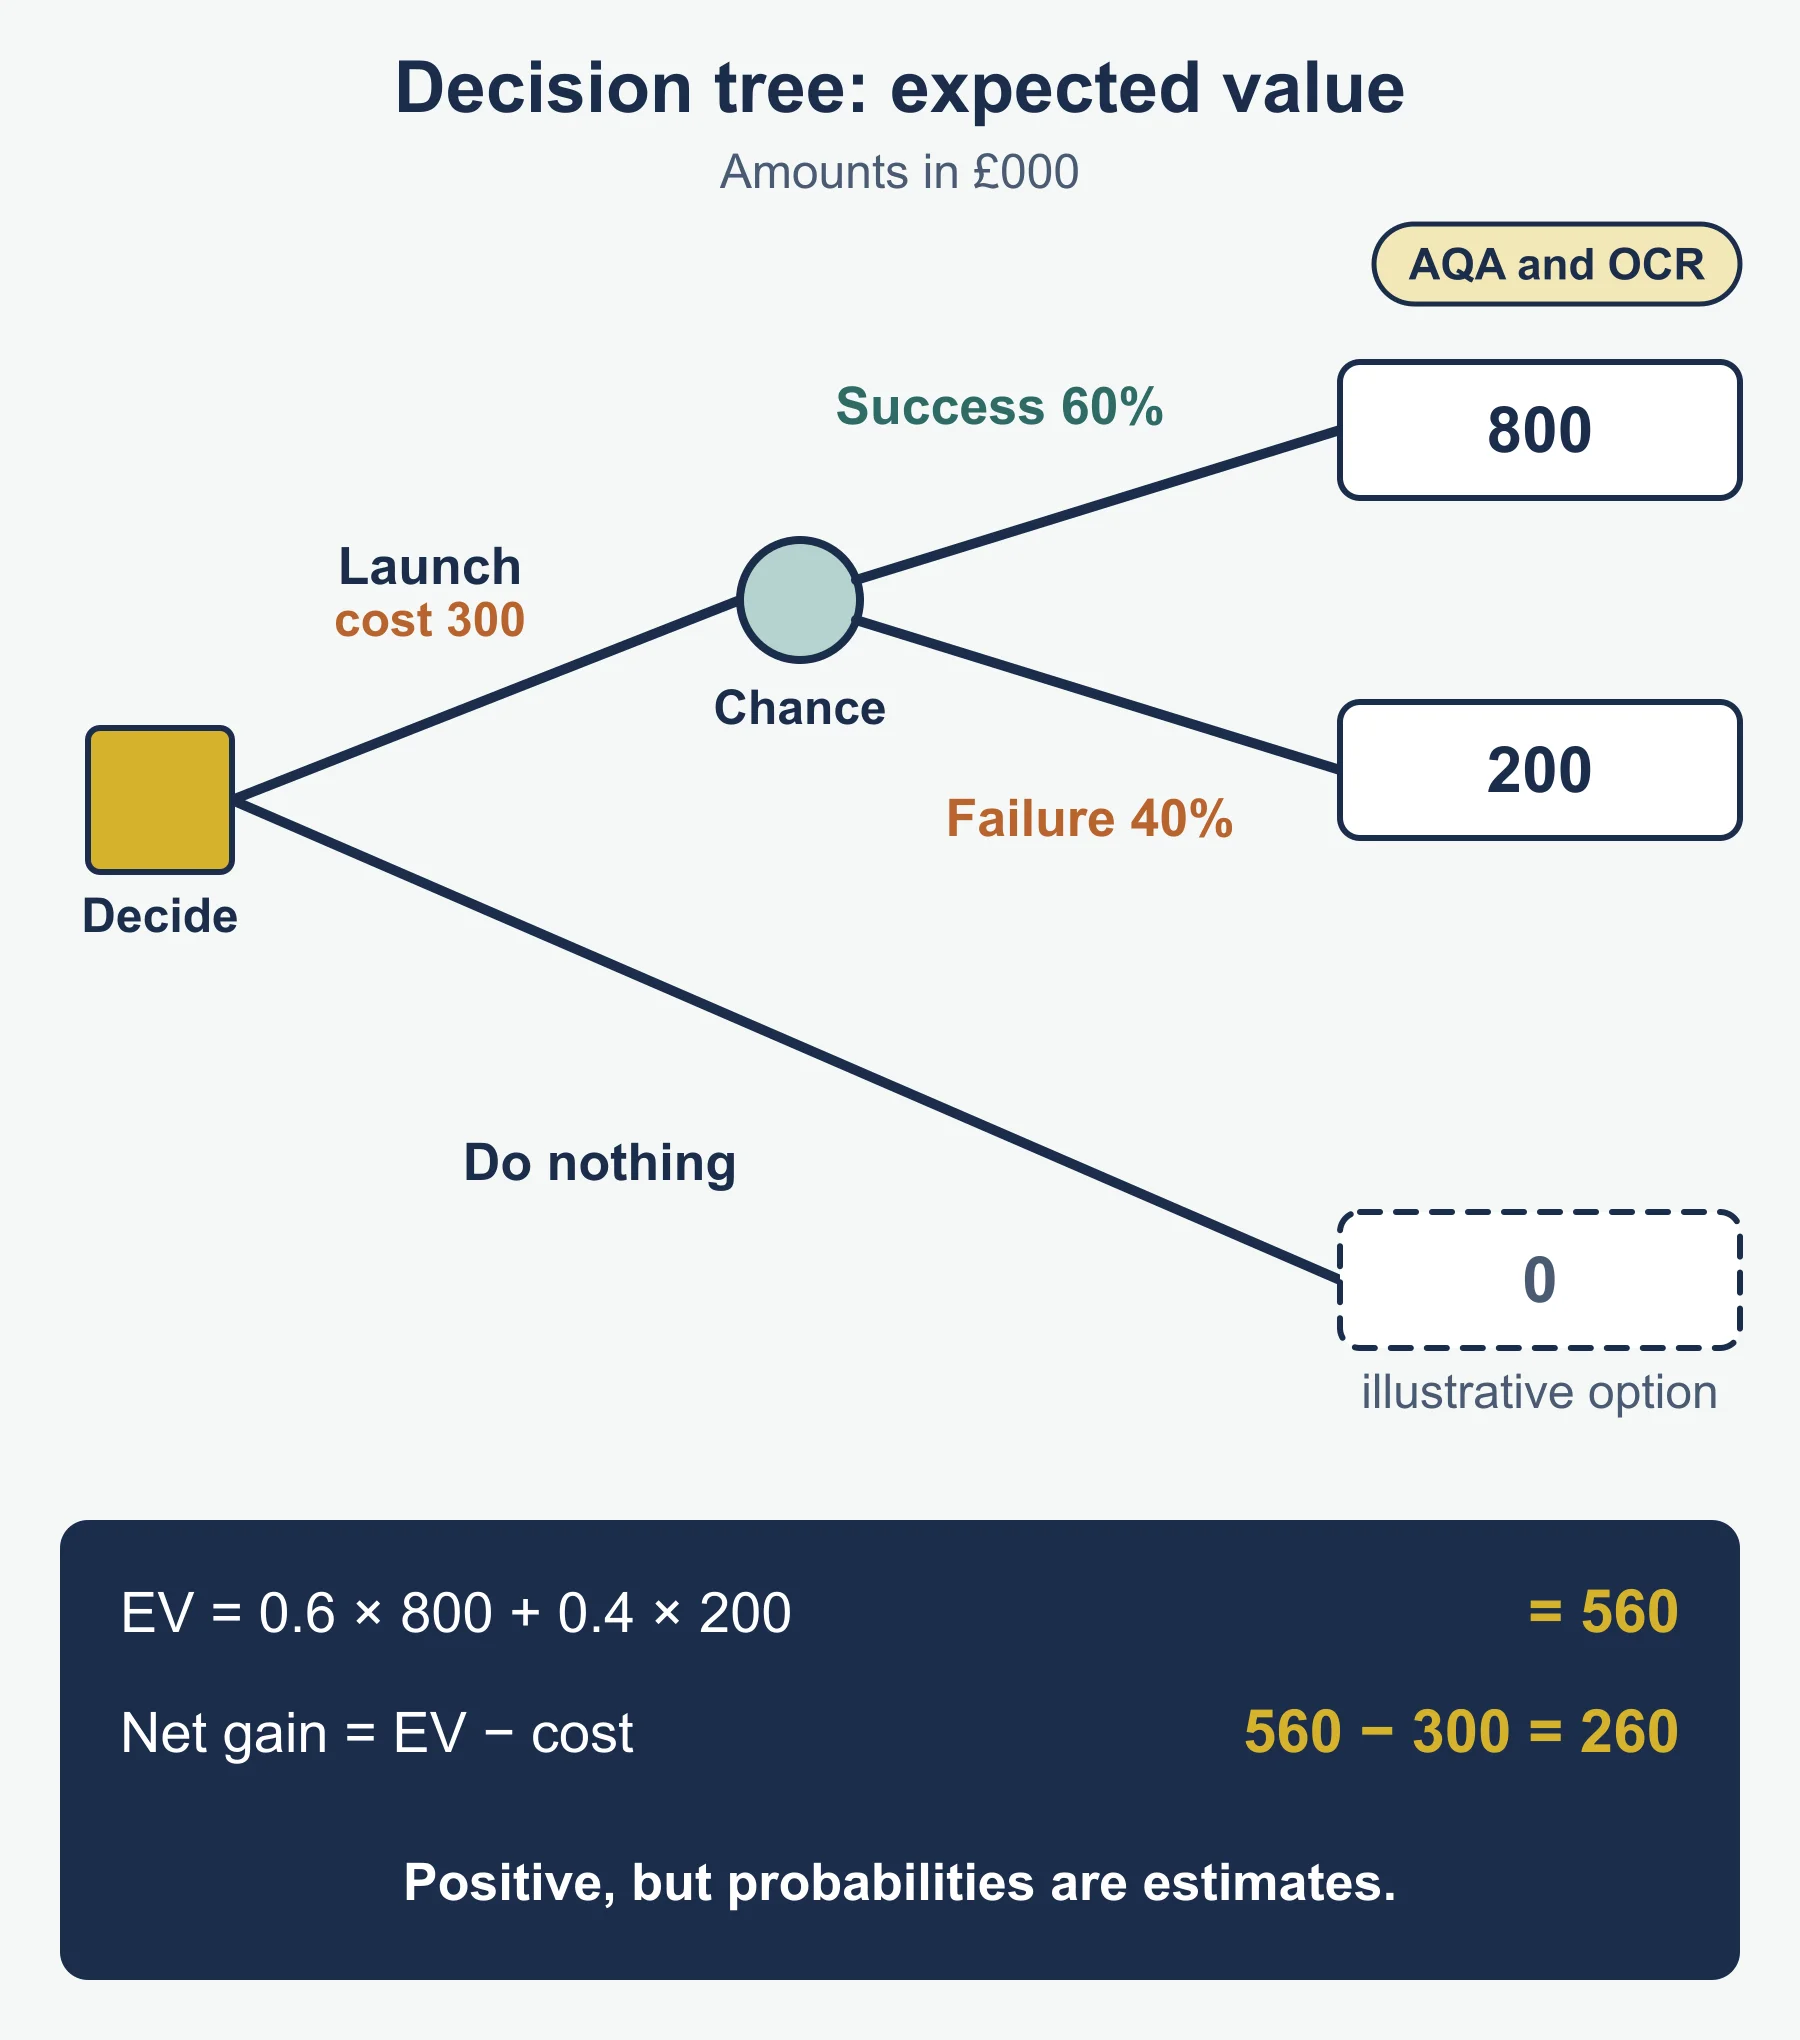
Expected value = (0.3 × 150,000) + (0.5 × 40,000) + (0.2 × -60,000) = 45,000 + 20,000 - 12,000 = £53,000.
The safe alternative is a servicing contract with a certain gain of £28,000. The workshop has an expected value £25,000 higher, so the reward is higher. The risk is also higher: there is a 20% chance of a £60,000 loss, and the spread between best and worst outcomes is £210,000.
Judgement: the workshop looks attractive if Mossgill could absorb a £60,000 loss. If that would threaten the three shops, the certain £28,000 may be better. The expected value is an average, not a result the business will actually receive.
Quantifiable and unquantifiable risk
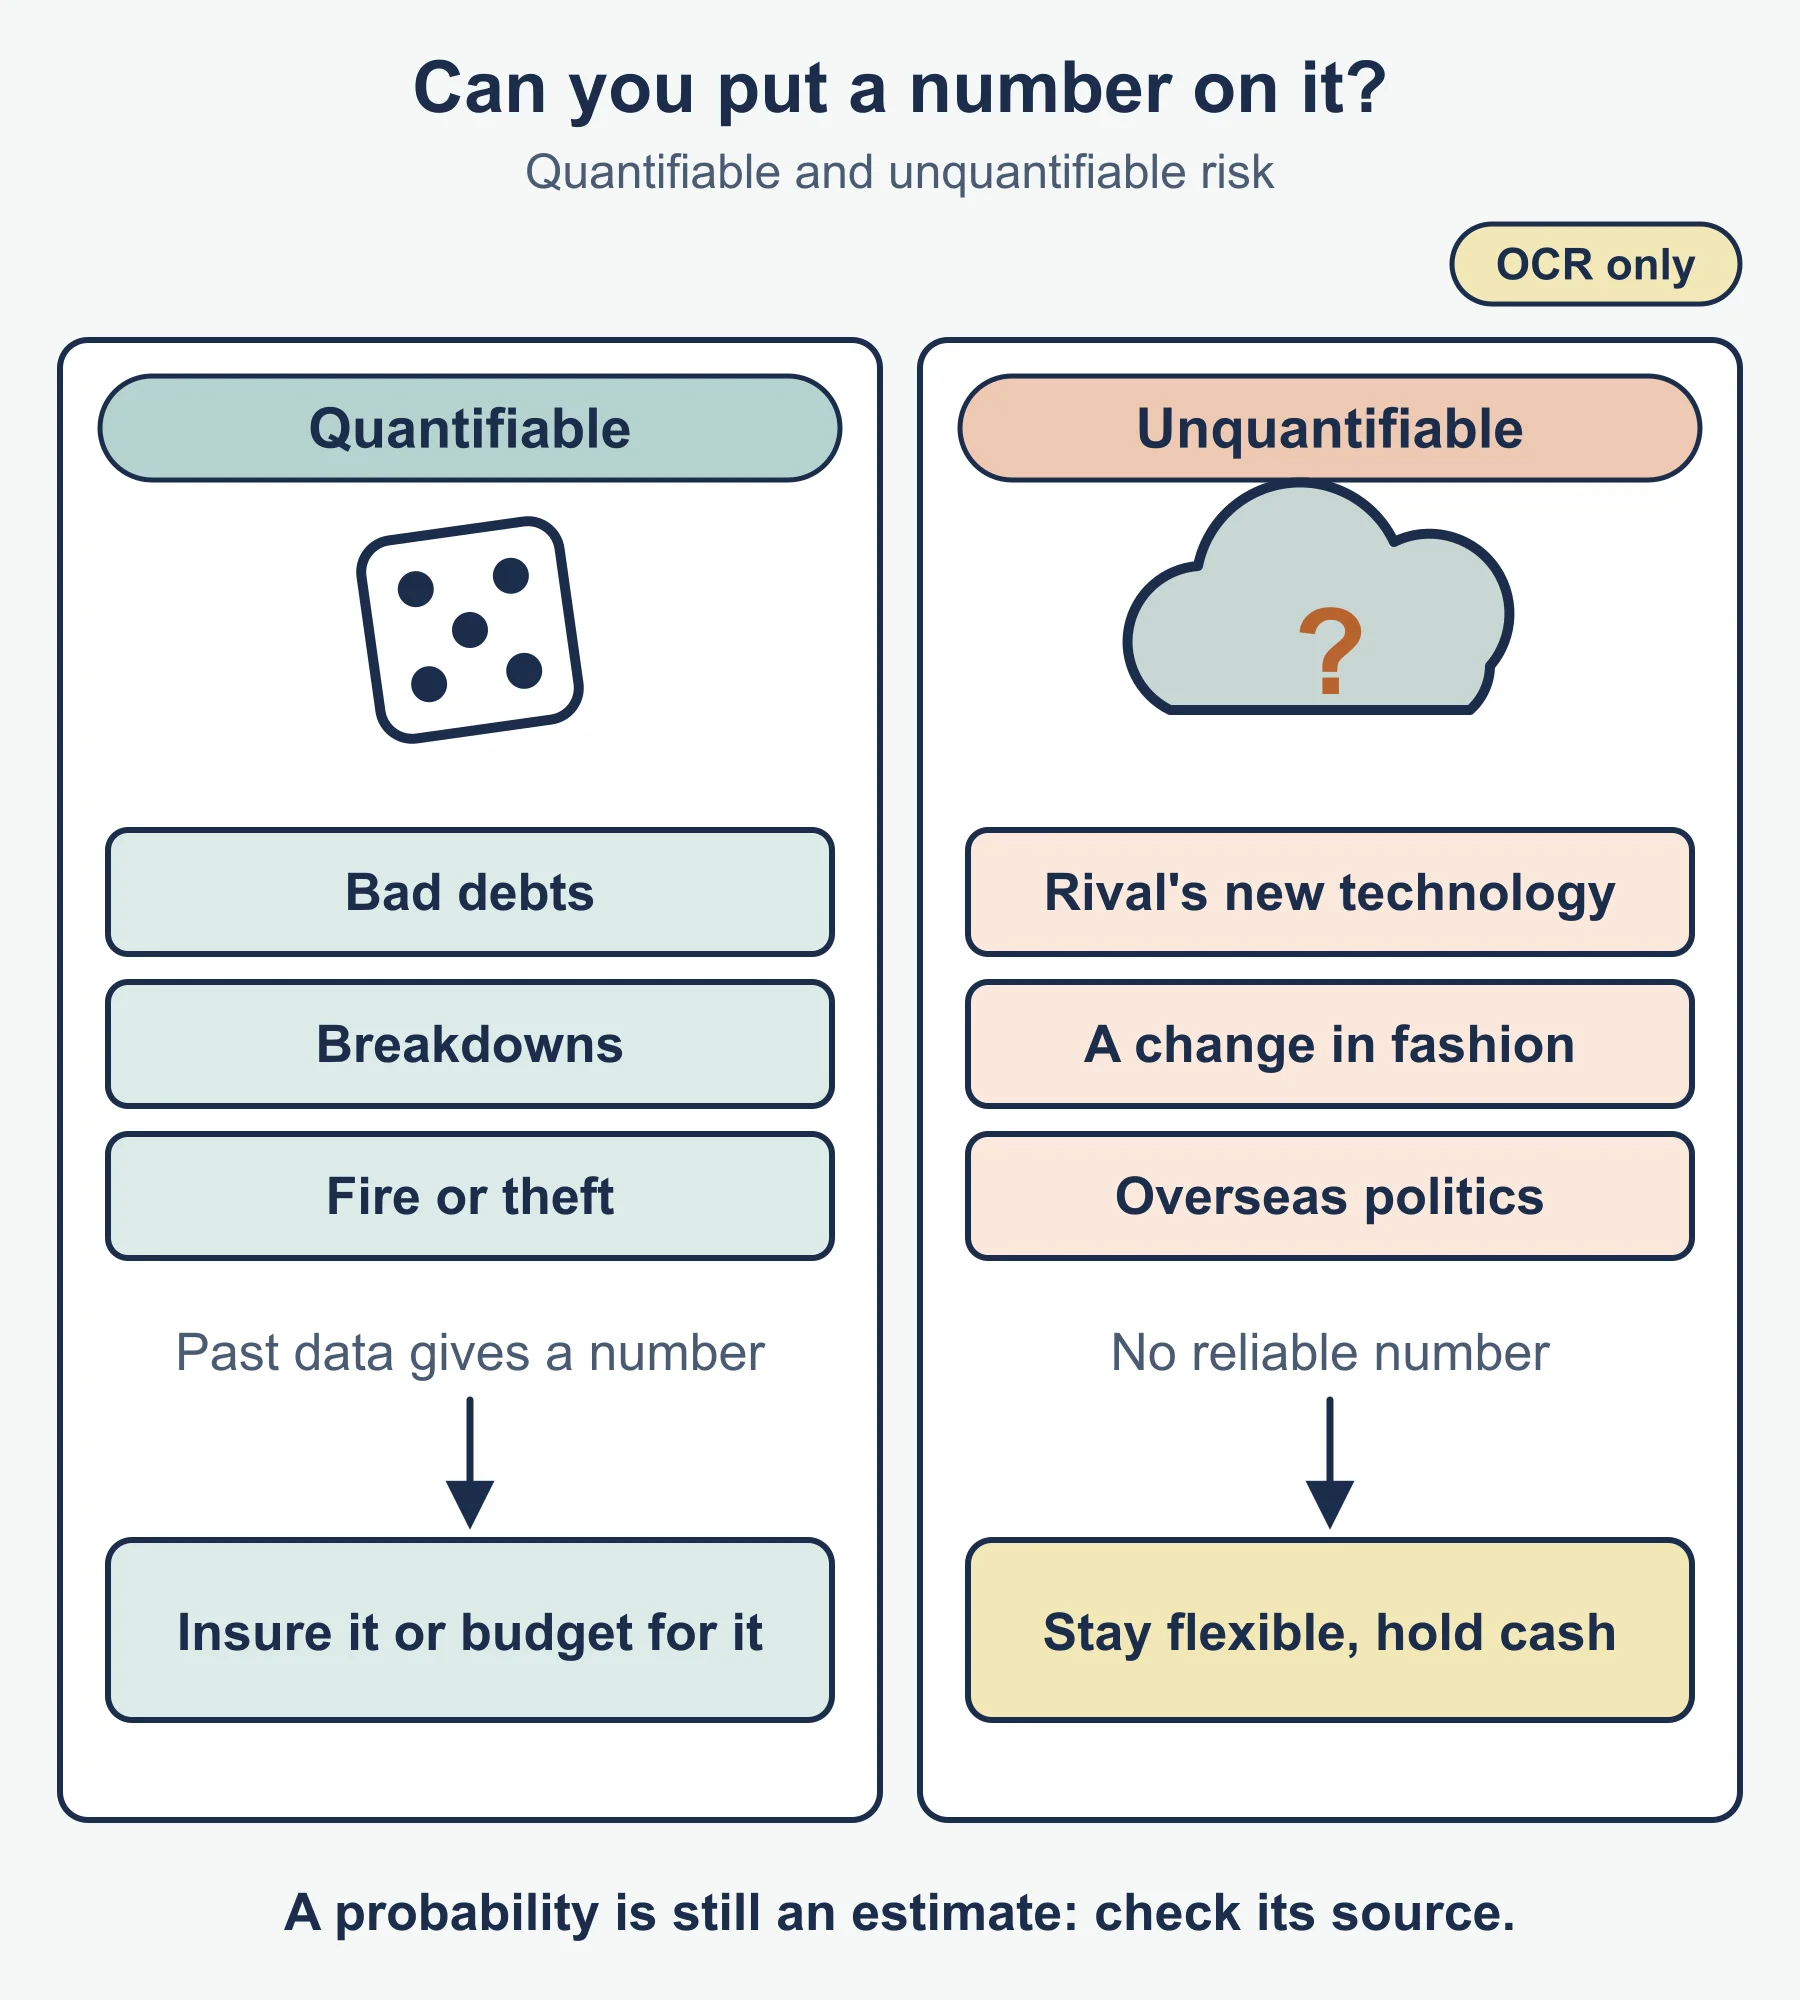
A quantifiable risk is one where the business can put a number on the likelihood, the size of the loss, or both, usually from past data or research. The standard technique (general business knowledge; the specification does not name it here) is expected value, which weights each outcome by its probability. Examples: bad debts as a share of credit sales, breakdowns based on maintenance records, theft or fire risks that an insurer prices.
An unquantifiable risk is one where there is no reliable basis for a number. The business knows something could go wrong but cannot say how likely it is or how large the loss would be. Examples: a rival’s new technology, a change in fashion, a political event overseas.
A quantifiable risk can be priced, insured or budgeted for, while an unquantifiable risk can only be reduced by general flexibility and preparation. A probability is still an estimate, so examine where a figure such as 30% came from.
Evaluating quantifiable risks. Strengths: numbers allow comparison between options, insurance and provisions. Weaknesses: past data may not repeat, the figures suggest more precision than exists, and non-financial effects such as morale are ignored.
Evaluating unquantifiable risks. Recognising them encourages scenario planning, flexibility and cash reserves. The weakness is that there is nothing to compare, so managers may ignore them or freeze. They can hurt most because the business cannot prepare precisely.
Reducing risk
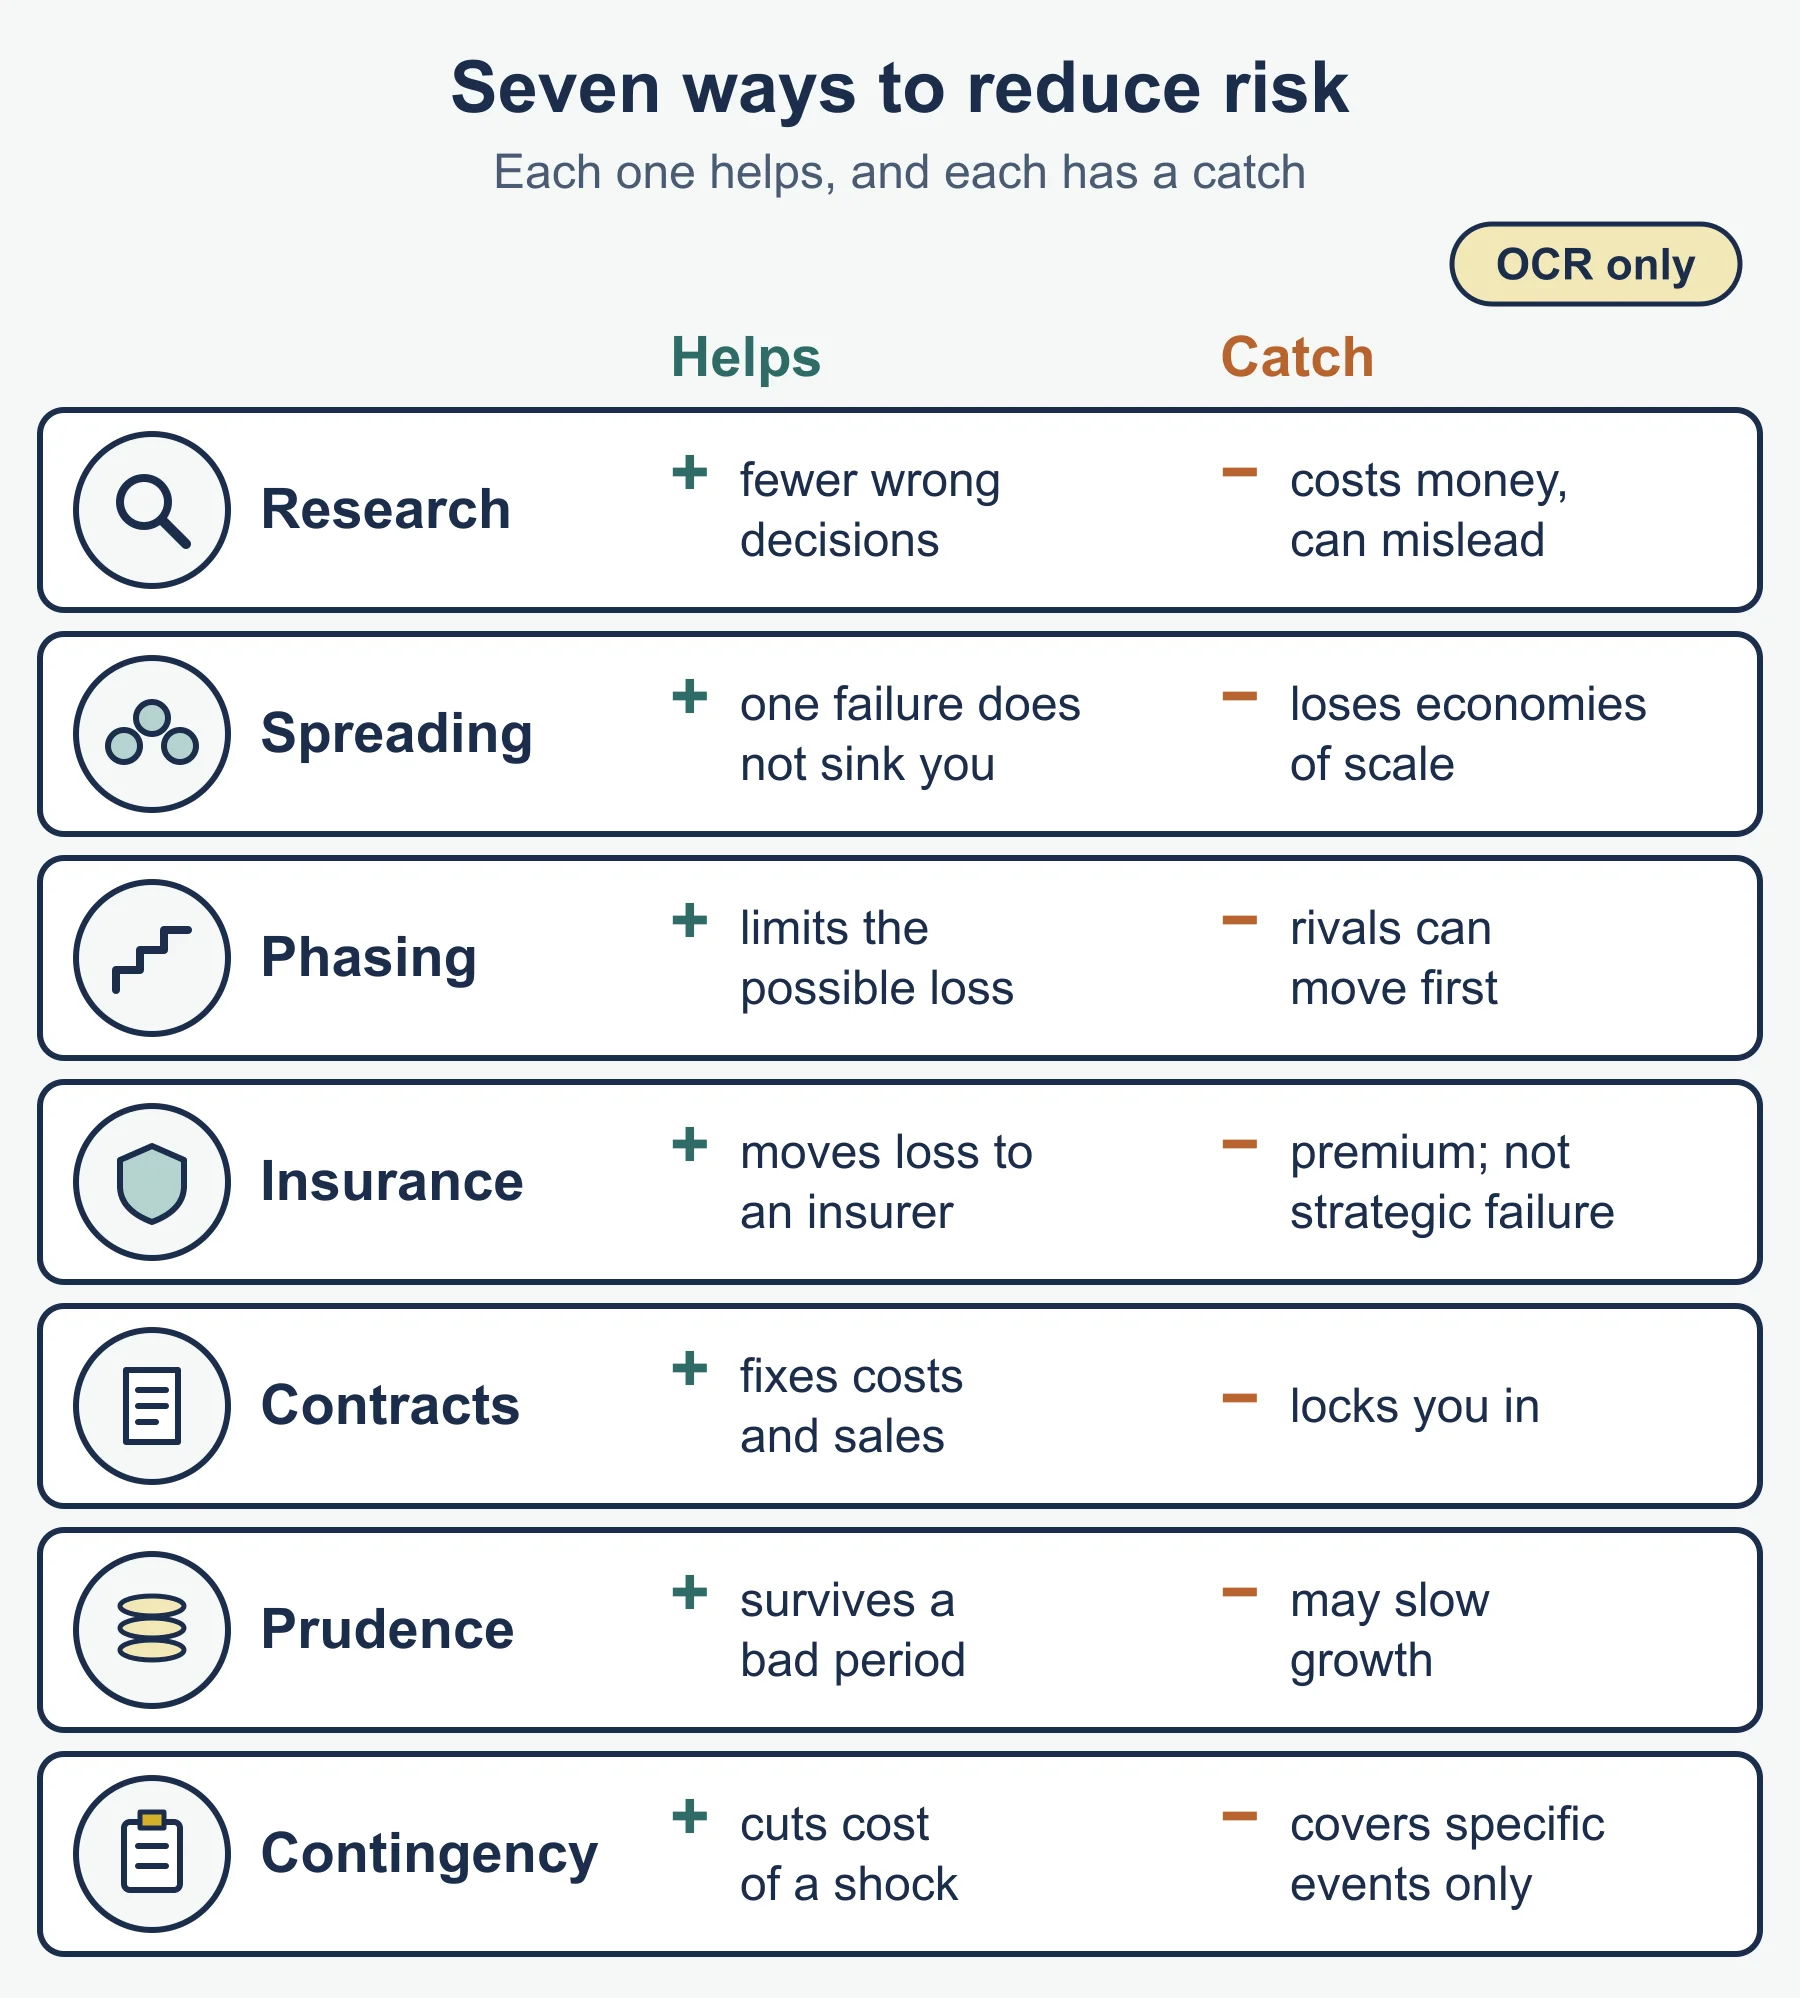
A business cannot remove risk, but it can reduce its level. Evaluate each method for cost, effectiveness and suitability:
- Research. Market research and forecasts reduce the chance of a wrong decision, but cost money and can mislead.
- Spreading risk. Several markets, suppliers or products mean one failure does not sink the business, but it can cost economies of scale.
- Phasing or piloting. Starting small limits the possible loss but can let rivals move first.
- Insurance. It transfers insurable losses to an insurer for a premium but does not cover most strategic failures.
- Contracts. Fixed-price supply deals or advance orders fix costs and sales but lock the business in.
- Financial prudence. Low borrowing and cash reserves help survive a bad period but may slow growth.
- Contingency planning. Plans for specific events cut the cost of a shock (see the area guide).
Consequences of poor risk management
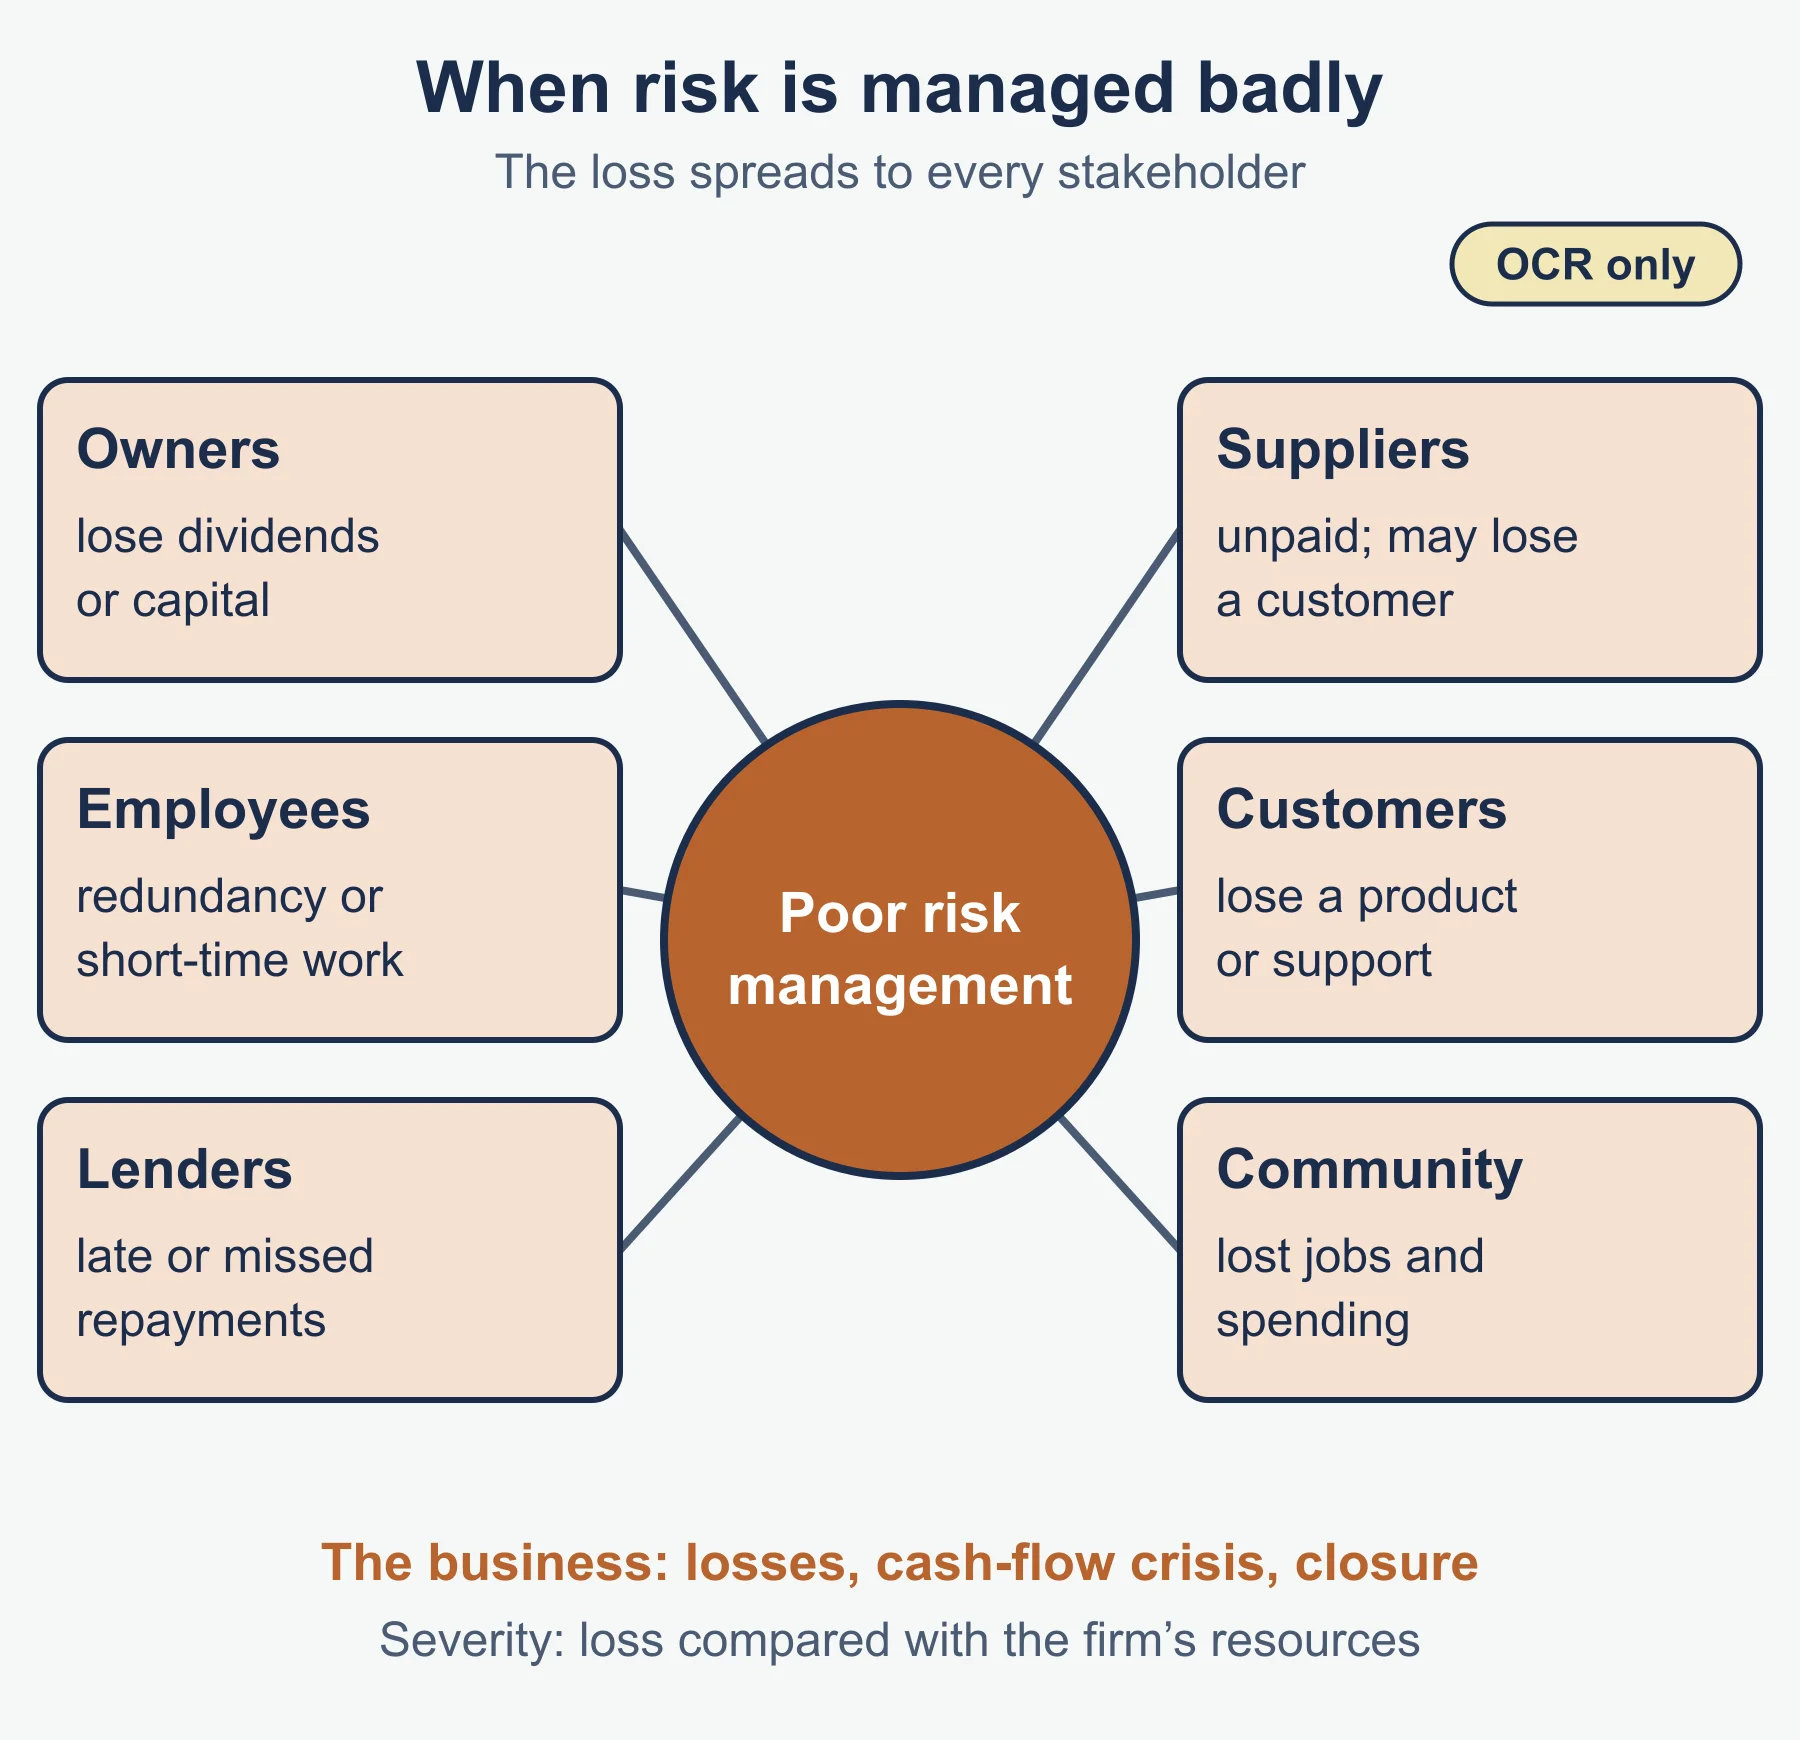
For the business: unexpected losses, cash-flow crisis, lost sales, damaged reputation, higher borrowing costs and, at worst, closure. For stakeholders: owners or shareholders lose dividends or capital; employees face redundancy or short-time working; lenders face late or missed repayments; suppliers are not paid and may lose a customer; customers lose a product or after-sales support; the local community loses jobs and spending. Judge severity by the loss relative to the firm’s resources.
Risks specific to the entrepreneur
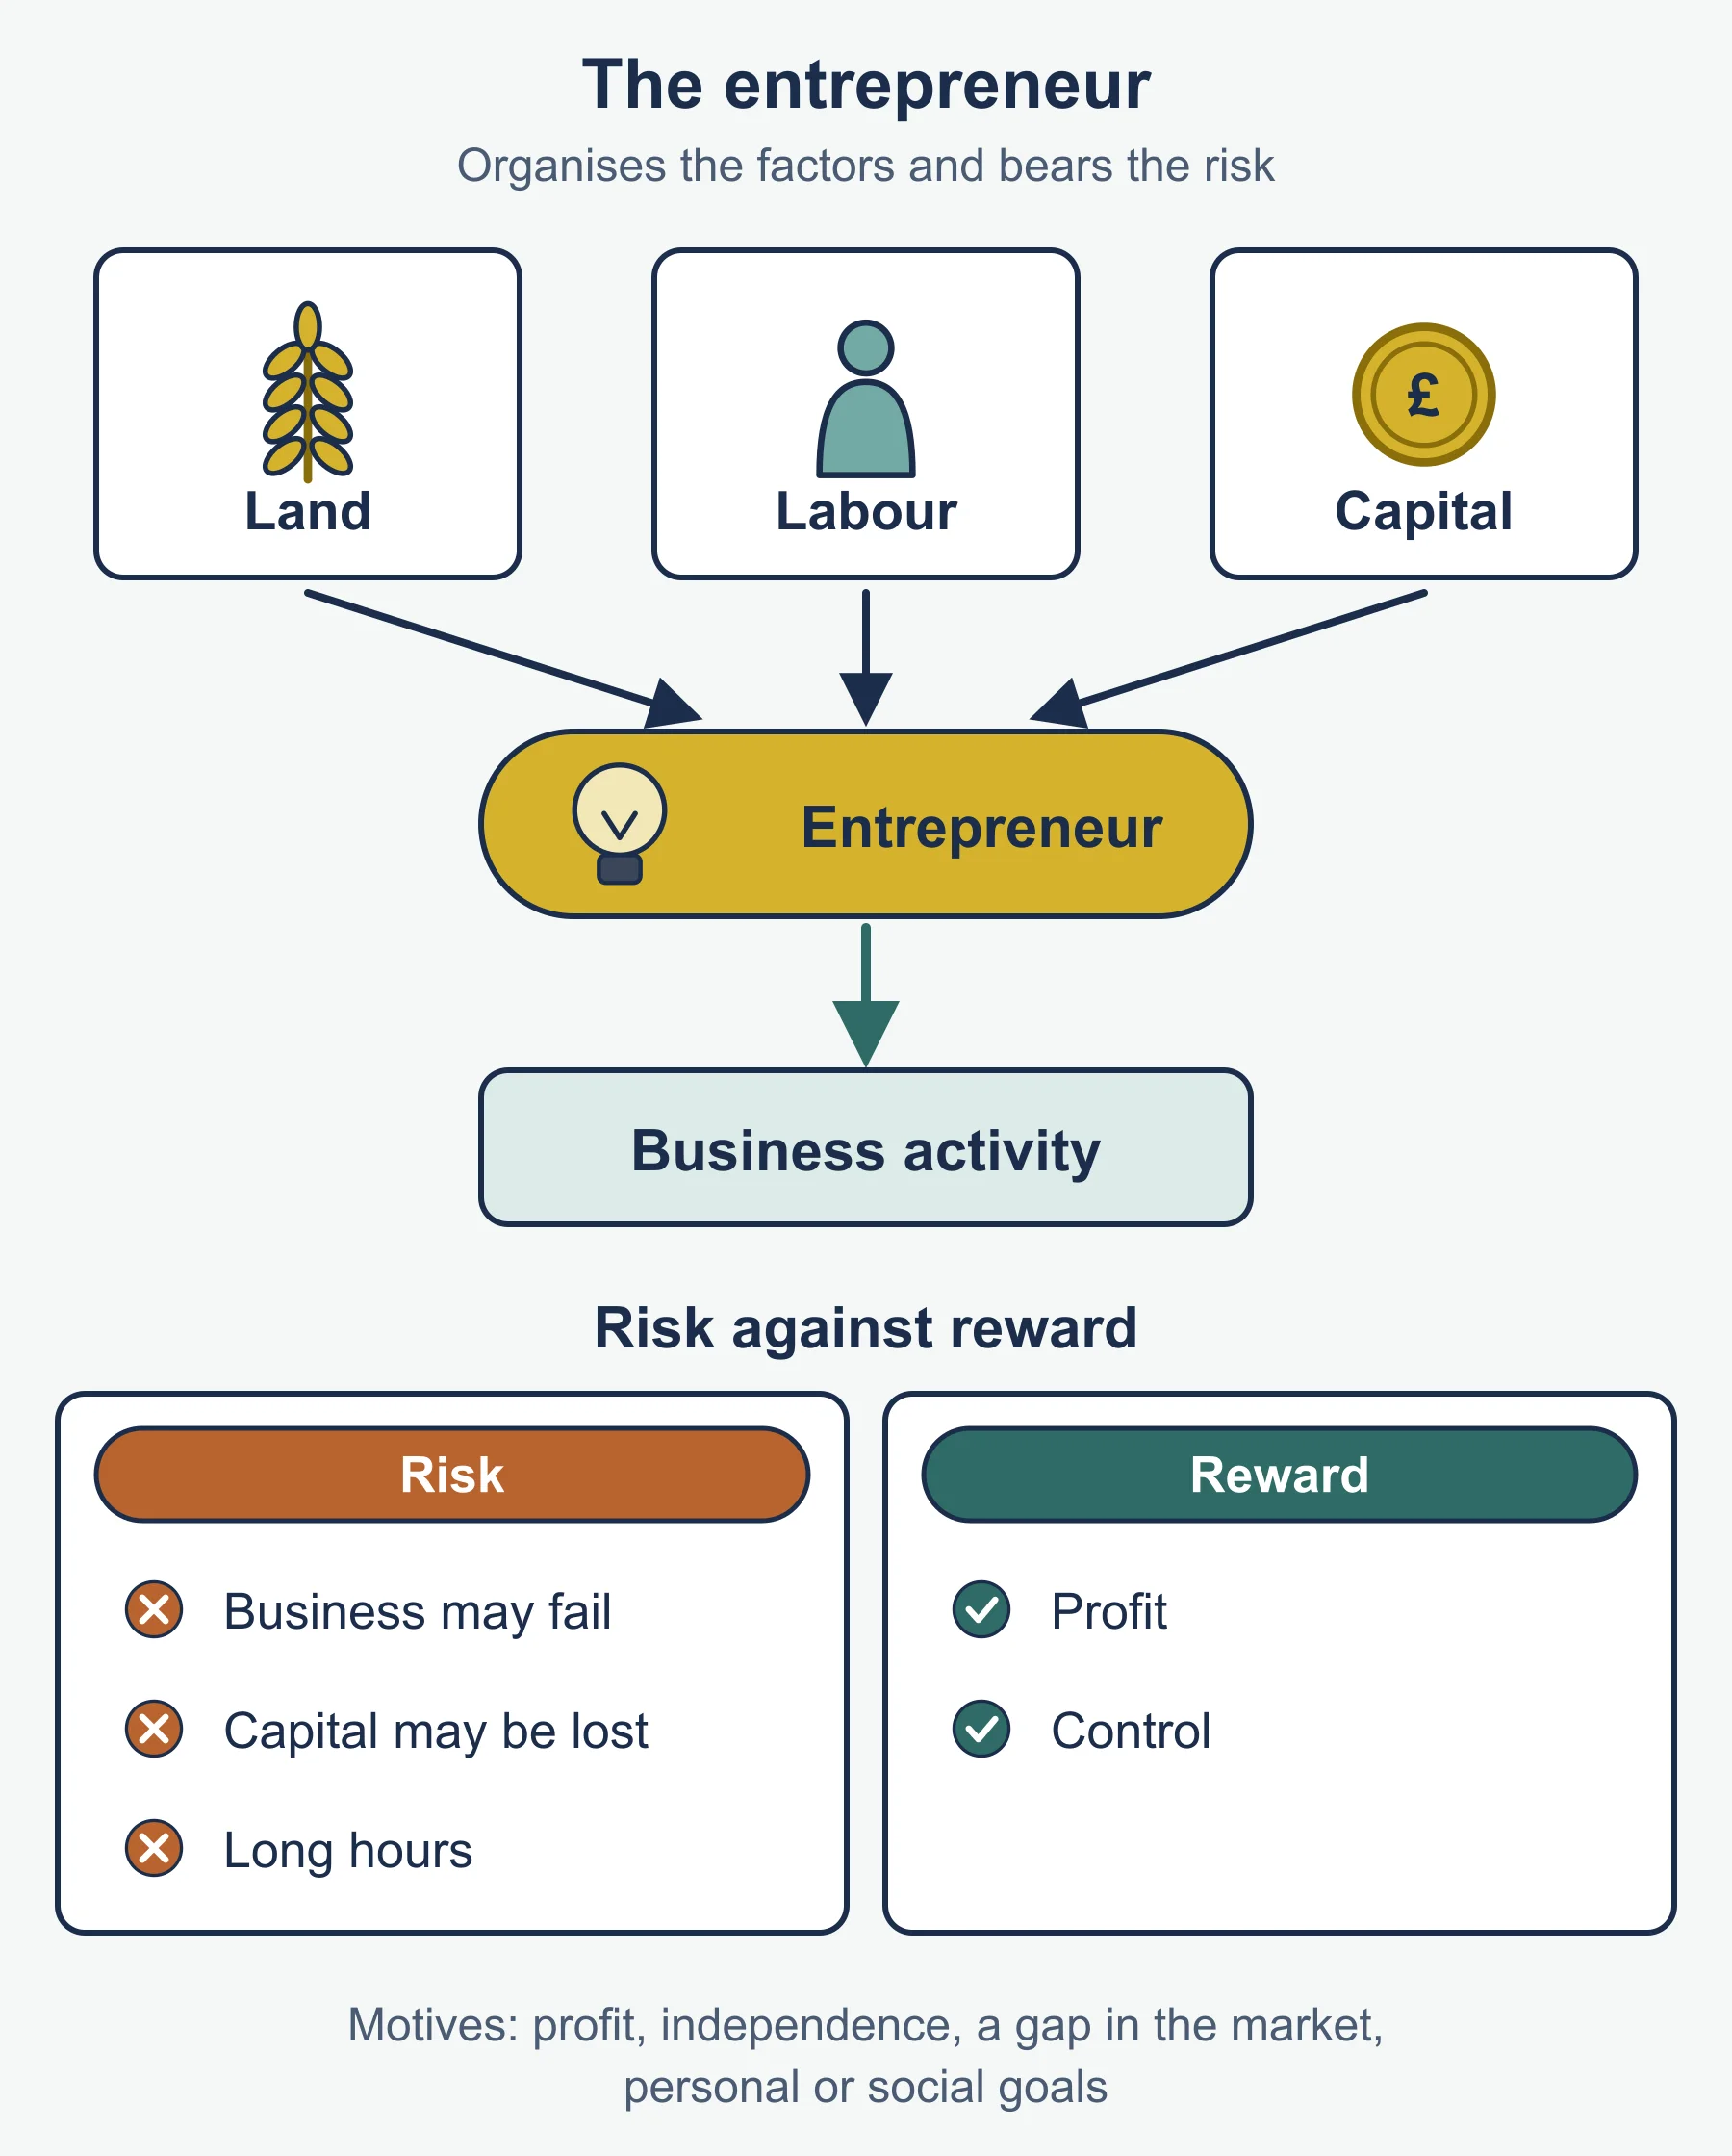
An entrepreneur takes the risk of starting or running a business in the hope of reward. The risks to evaluate are personal as well as commercial:
- Financial loss. Savings put in can be lost. As general knowledge, not a point the specification lists: if the business has unlimited liability, personal assets can also be at risk. If liability is limited, the loss of the money invested is usually the limit, although lenders may ask for personal guarantees.
- No guaranteed income. Profit is what remains after costs, so the entrepreneur may earn less than an employee would, or nothing.
- Opportunity cost of the career forgone. Salary, pension and security given up are part of the cost of the venture.
- Business failure through poor demand, strong competition or weak cash flow, with the effects on health, family and reputation.
Judge the size of these risks against the entrepreneur’s savings, experience and support, and set them against the reward: profit, independence and a business that can be sold.
Uncertainty
Uncertainty means a business cannot know in advance what will happen, or cannot assign reliable probabilities to the possibilities. In the standard (general-knowledge) distinction, risk can be measured and uncertainty cannot, although in practice the two overlap.
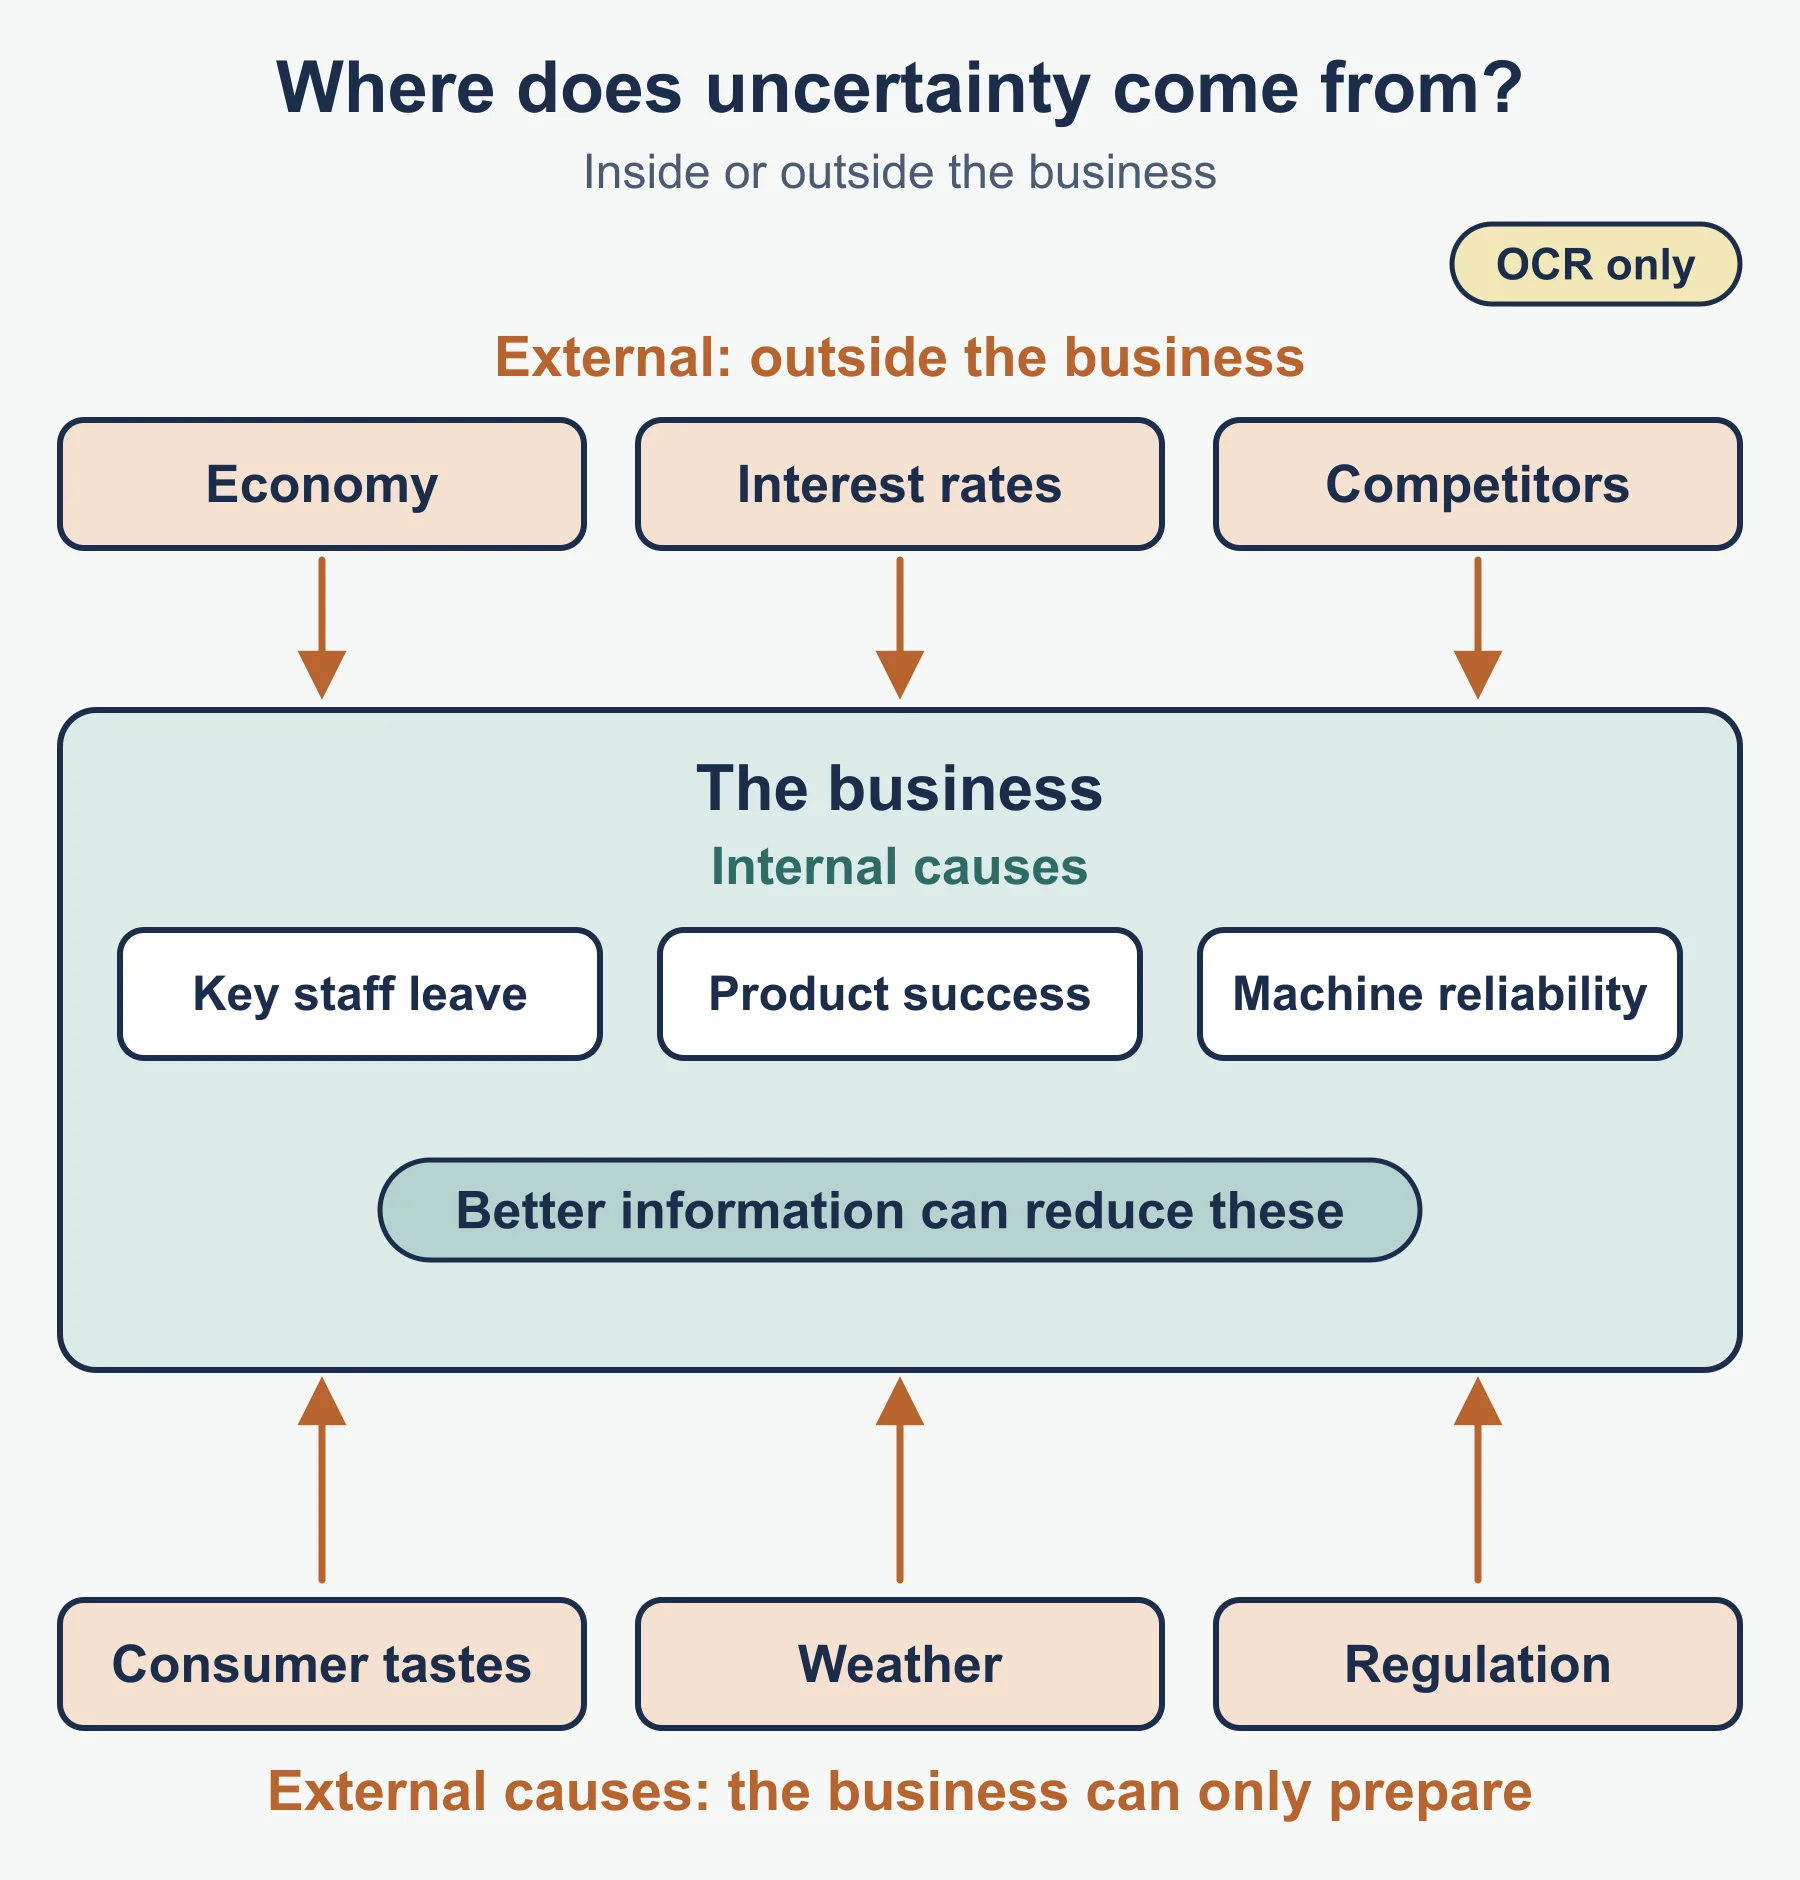
Internal causes arise within the business’s control or knowledge: a key employee leaving, the success of a new product, machinery reliability, uncertain staff morale, the effects of a change of strategy, the accuracy of the firm’s own cost estimates. External causes arise outside it: changes in the economy, interest rates and exchange rates, competitor actions, technology, regulation, consumer tastes, the weather and political events. The business can often reduce internal uncertainty with better information; it can only prepare for the external kind.
Impact on the business and stakeholders. Evaluate by asking how large the uncertainty is, how soon it will resolve and who bears the effect. High uncertainty can mean delayed investment and lost sales if the business holds back, or wasted money if it commits too early. Employees may feel insecure and lenders may charge more.
Effects on business activities (all named in the specification):
- Aims and objectives: targets may become unrealistic or need to be set as ranges; the business may favour survival over growth.
- Planning: longer plans become less reliable, so shorter planning periods, flexible budgets and scenario plans are used.
- Decision making: managers may delay, choose lower-risk options, or use techniques such as decision trees and sensitivity analysis.
- Business analysis: tools such as SWOT and PESTLE become less certain because their inputs may change quickly.
- Forecasting: forecasts are less accurate, so ranges and several scenarios replace single figures.
Worked example: uncertain demand at Coldwater Print
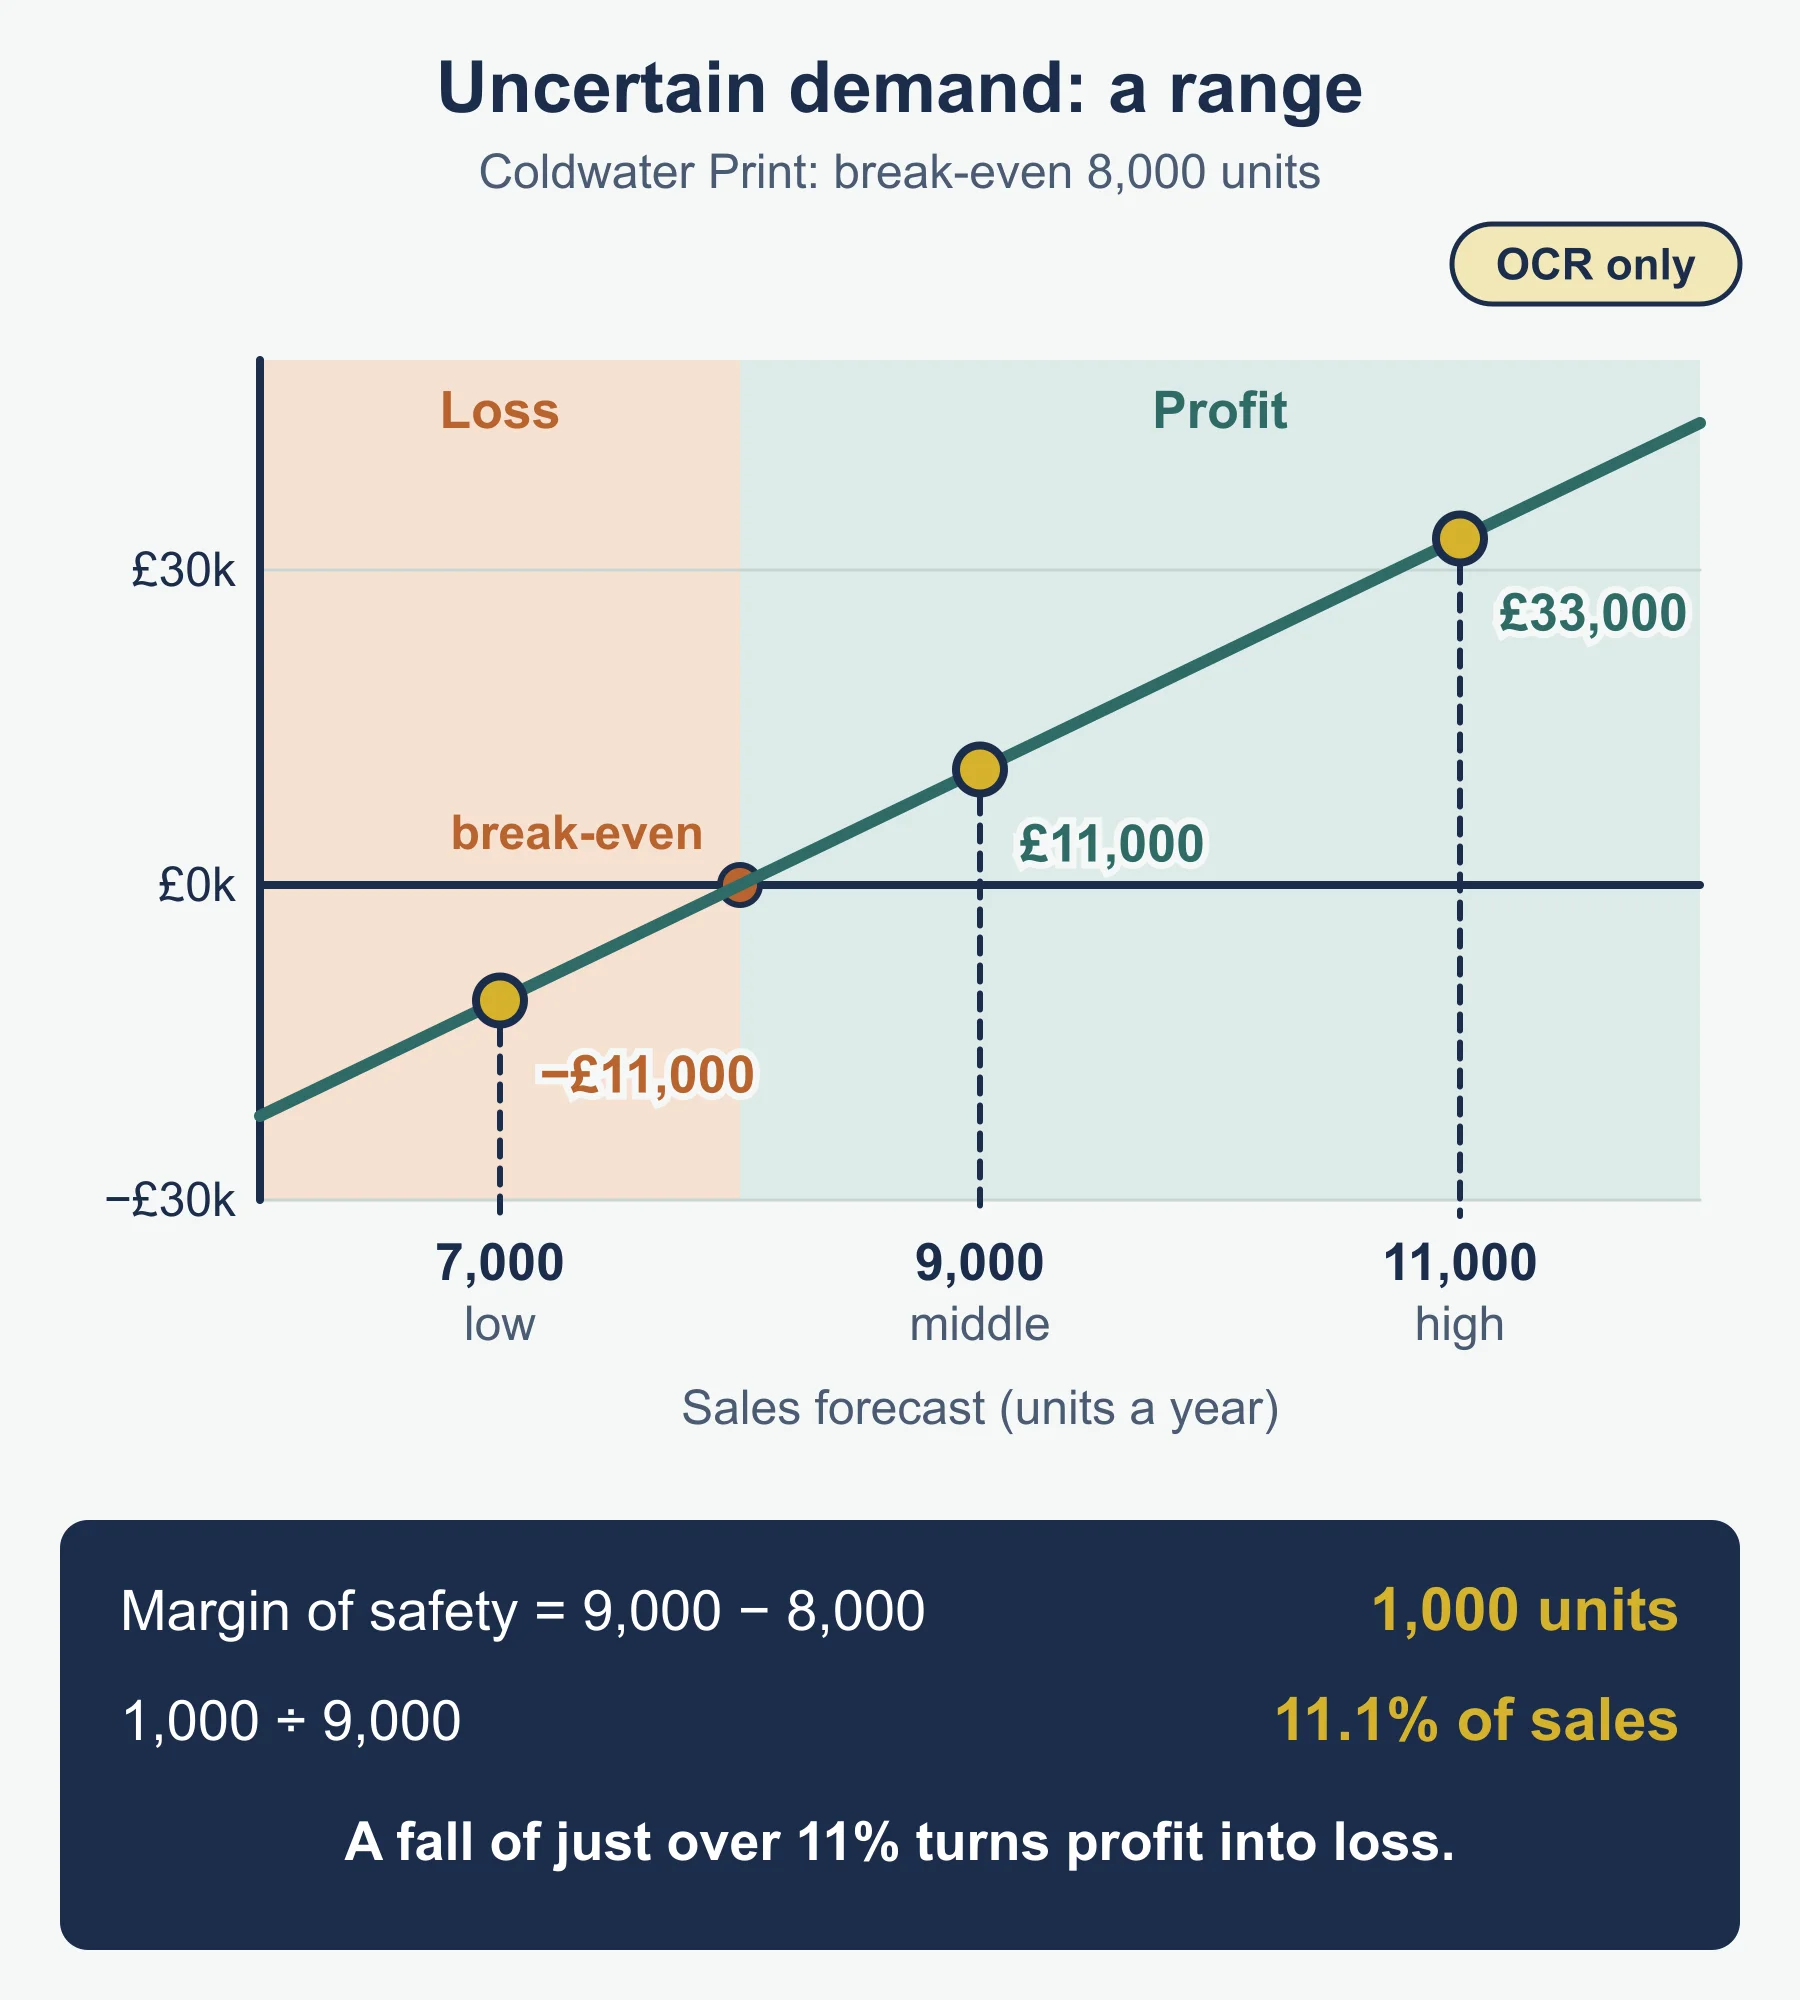
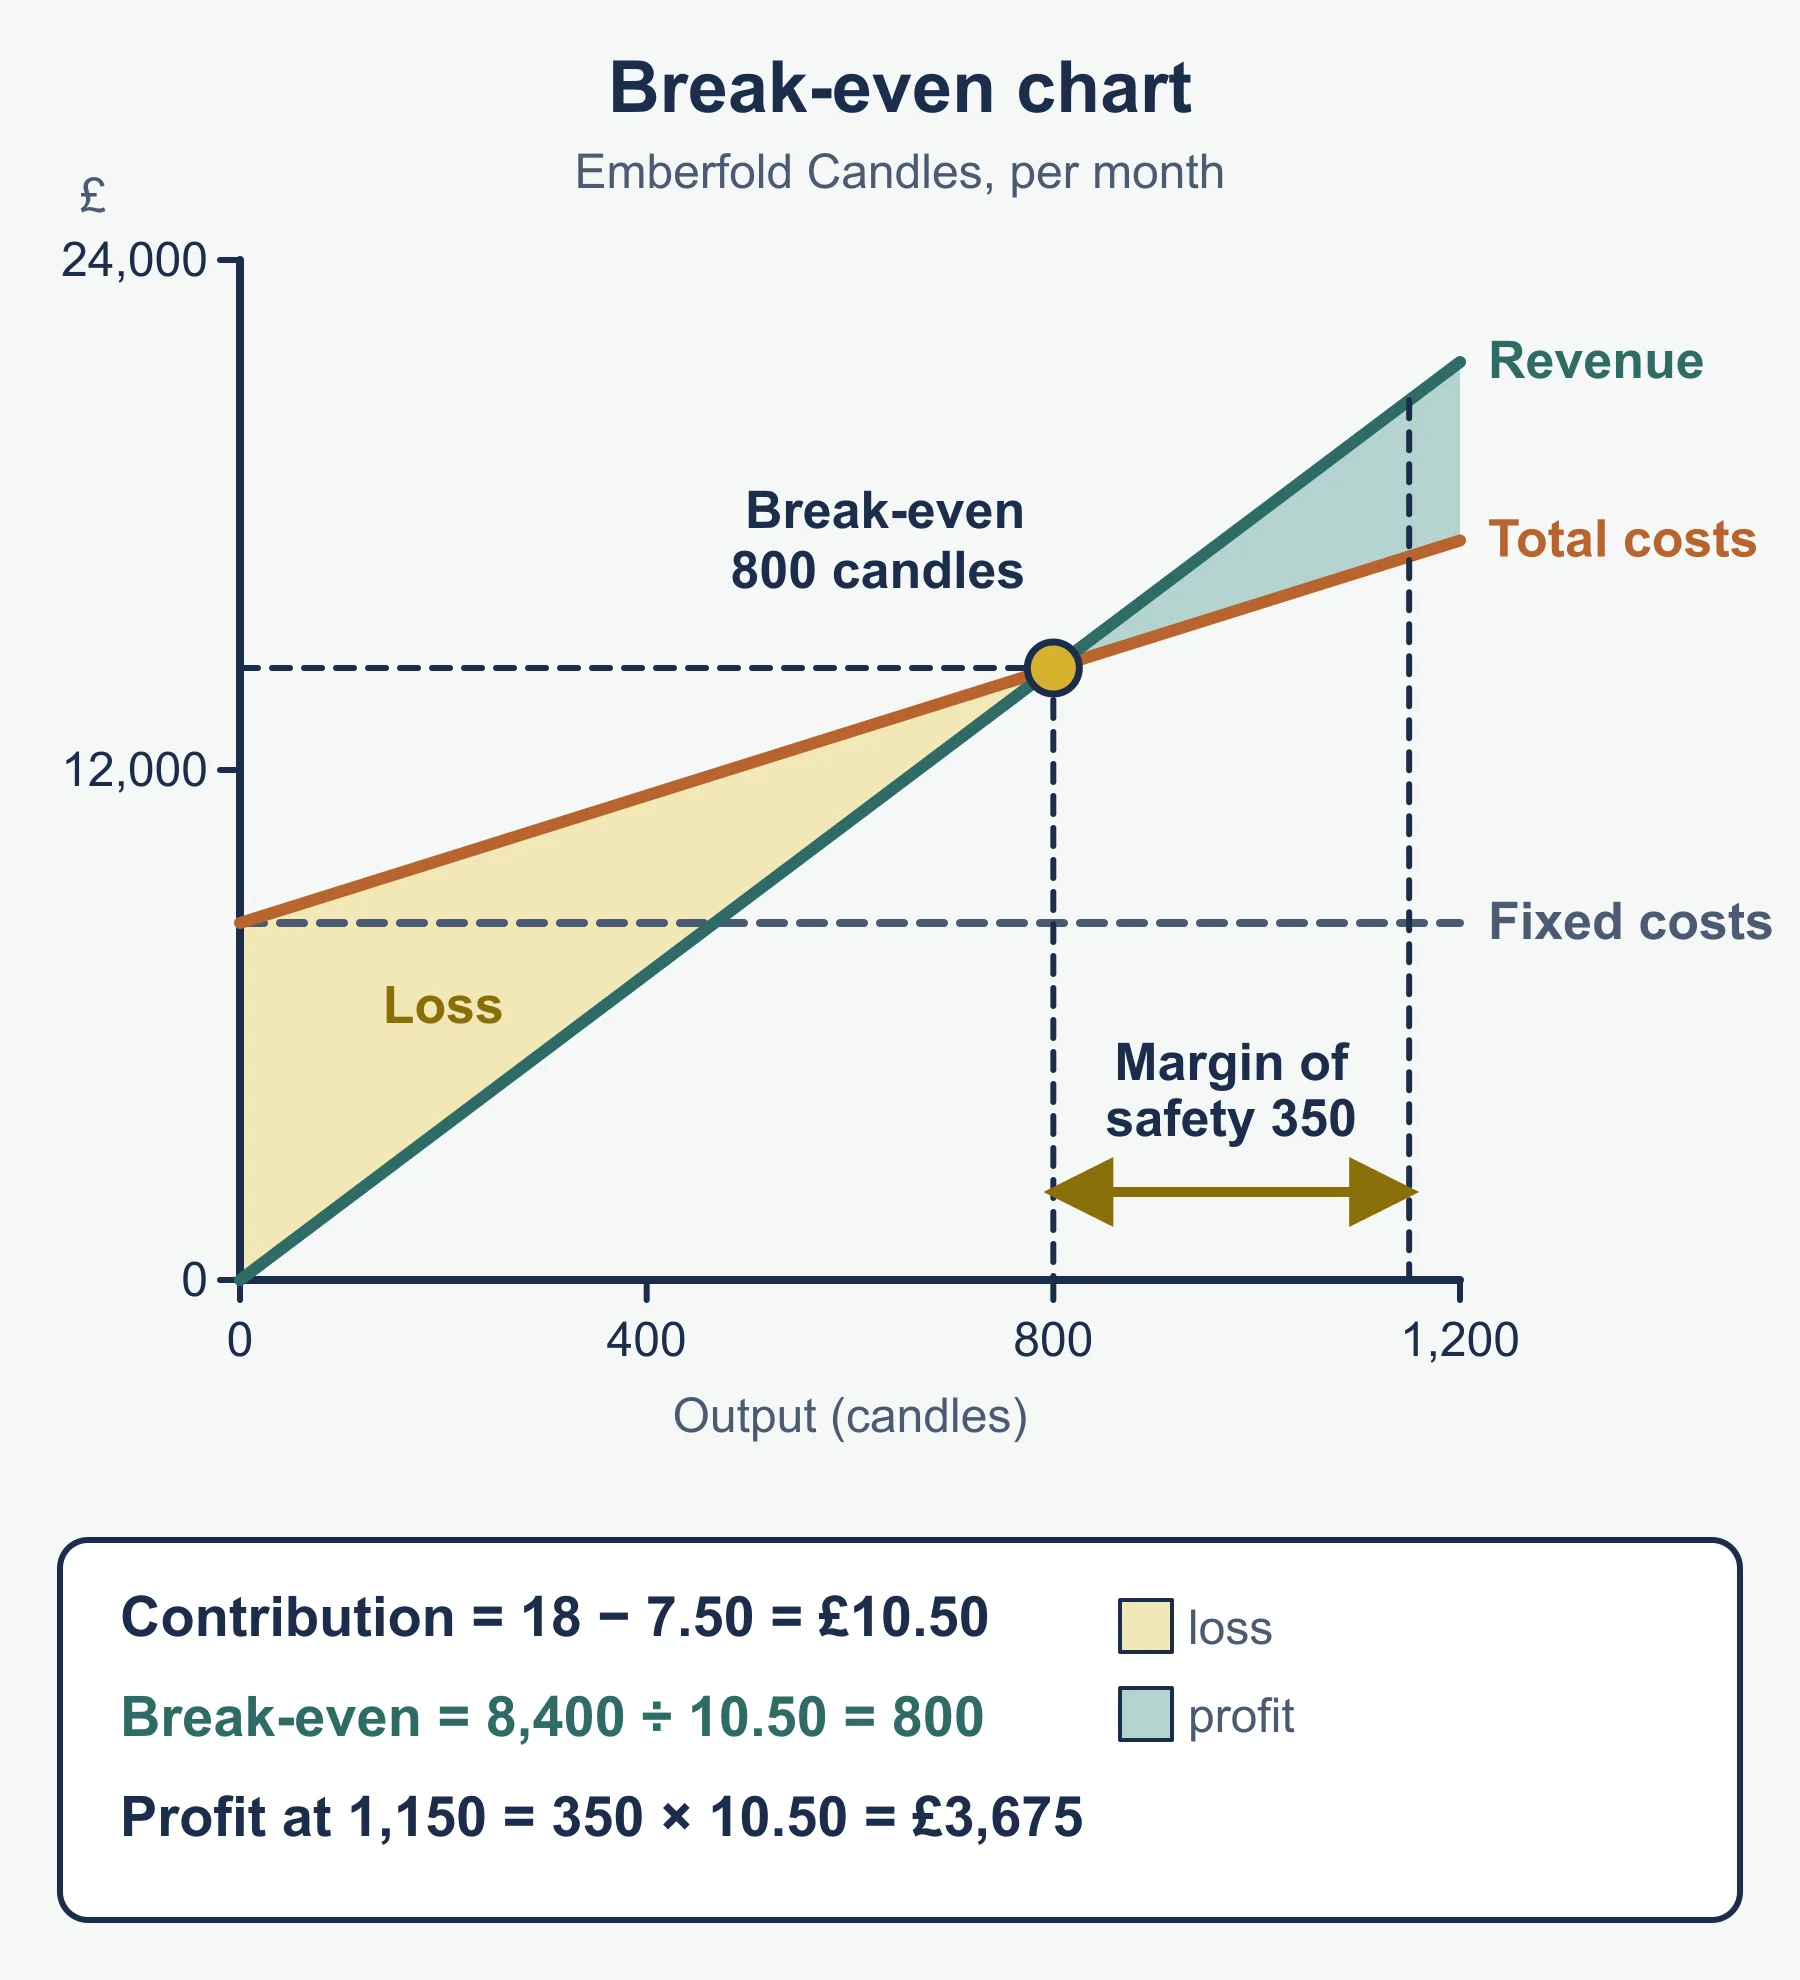
Coldwater Print sells a product at £25 with variable cost £14 per unit and fixed costs of £88,000. Contribution per unit = 25 - 14 = £11. Break-even output = 88,000 ÷ 11 = 8,000 units.
Demand is uncertain because a large customer may reduce its orders (external) and a new press may not run as fast as promised (internal). The sales manager forecasts a range, not a single figure.
| Sales | Profit |
|---|---|
| 7,000 | 7,000 × 11 - 88,000 = -£11,000 |
| 9,000 | 9,000 × 11 - 88,000 = £11,000 |
| 11,000 | 11,000 × 11 - 88,000 = £33,000 |
At the middle forecast the margin of safety is 9,000 - 8,000 = 1,000 units, which is 11.1% of forecast sales. A fall of just over 11% turns profit into loss. So uncertainty affects planning (a cash buffer), decision making (delay the second press until orders are confirmed) and forecasting (three scenarios, not one number).
Opportunity cost
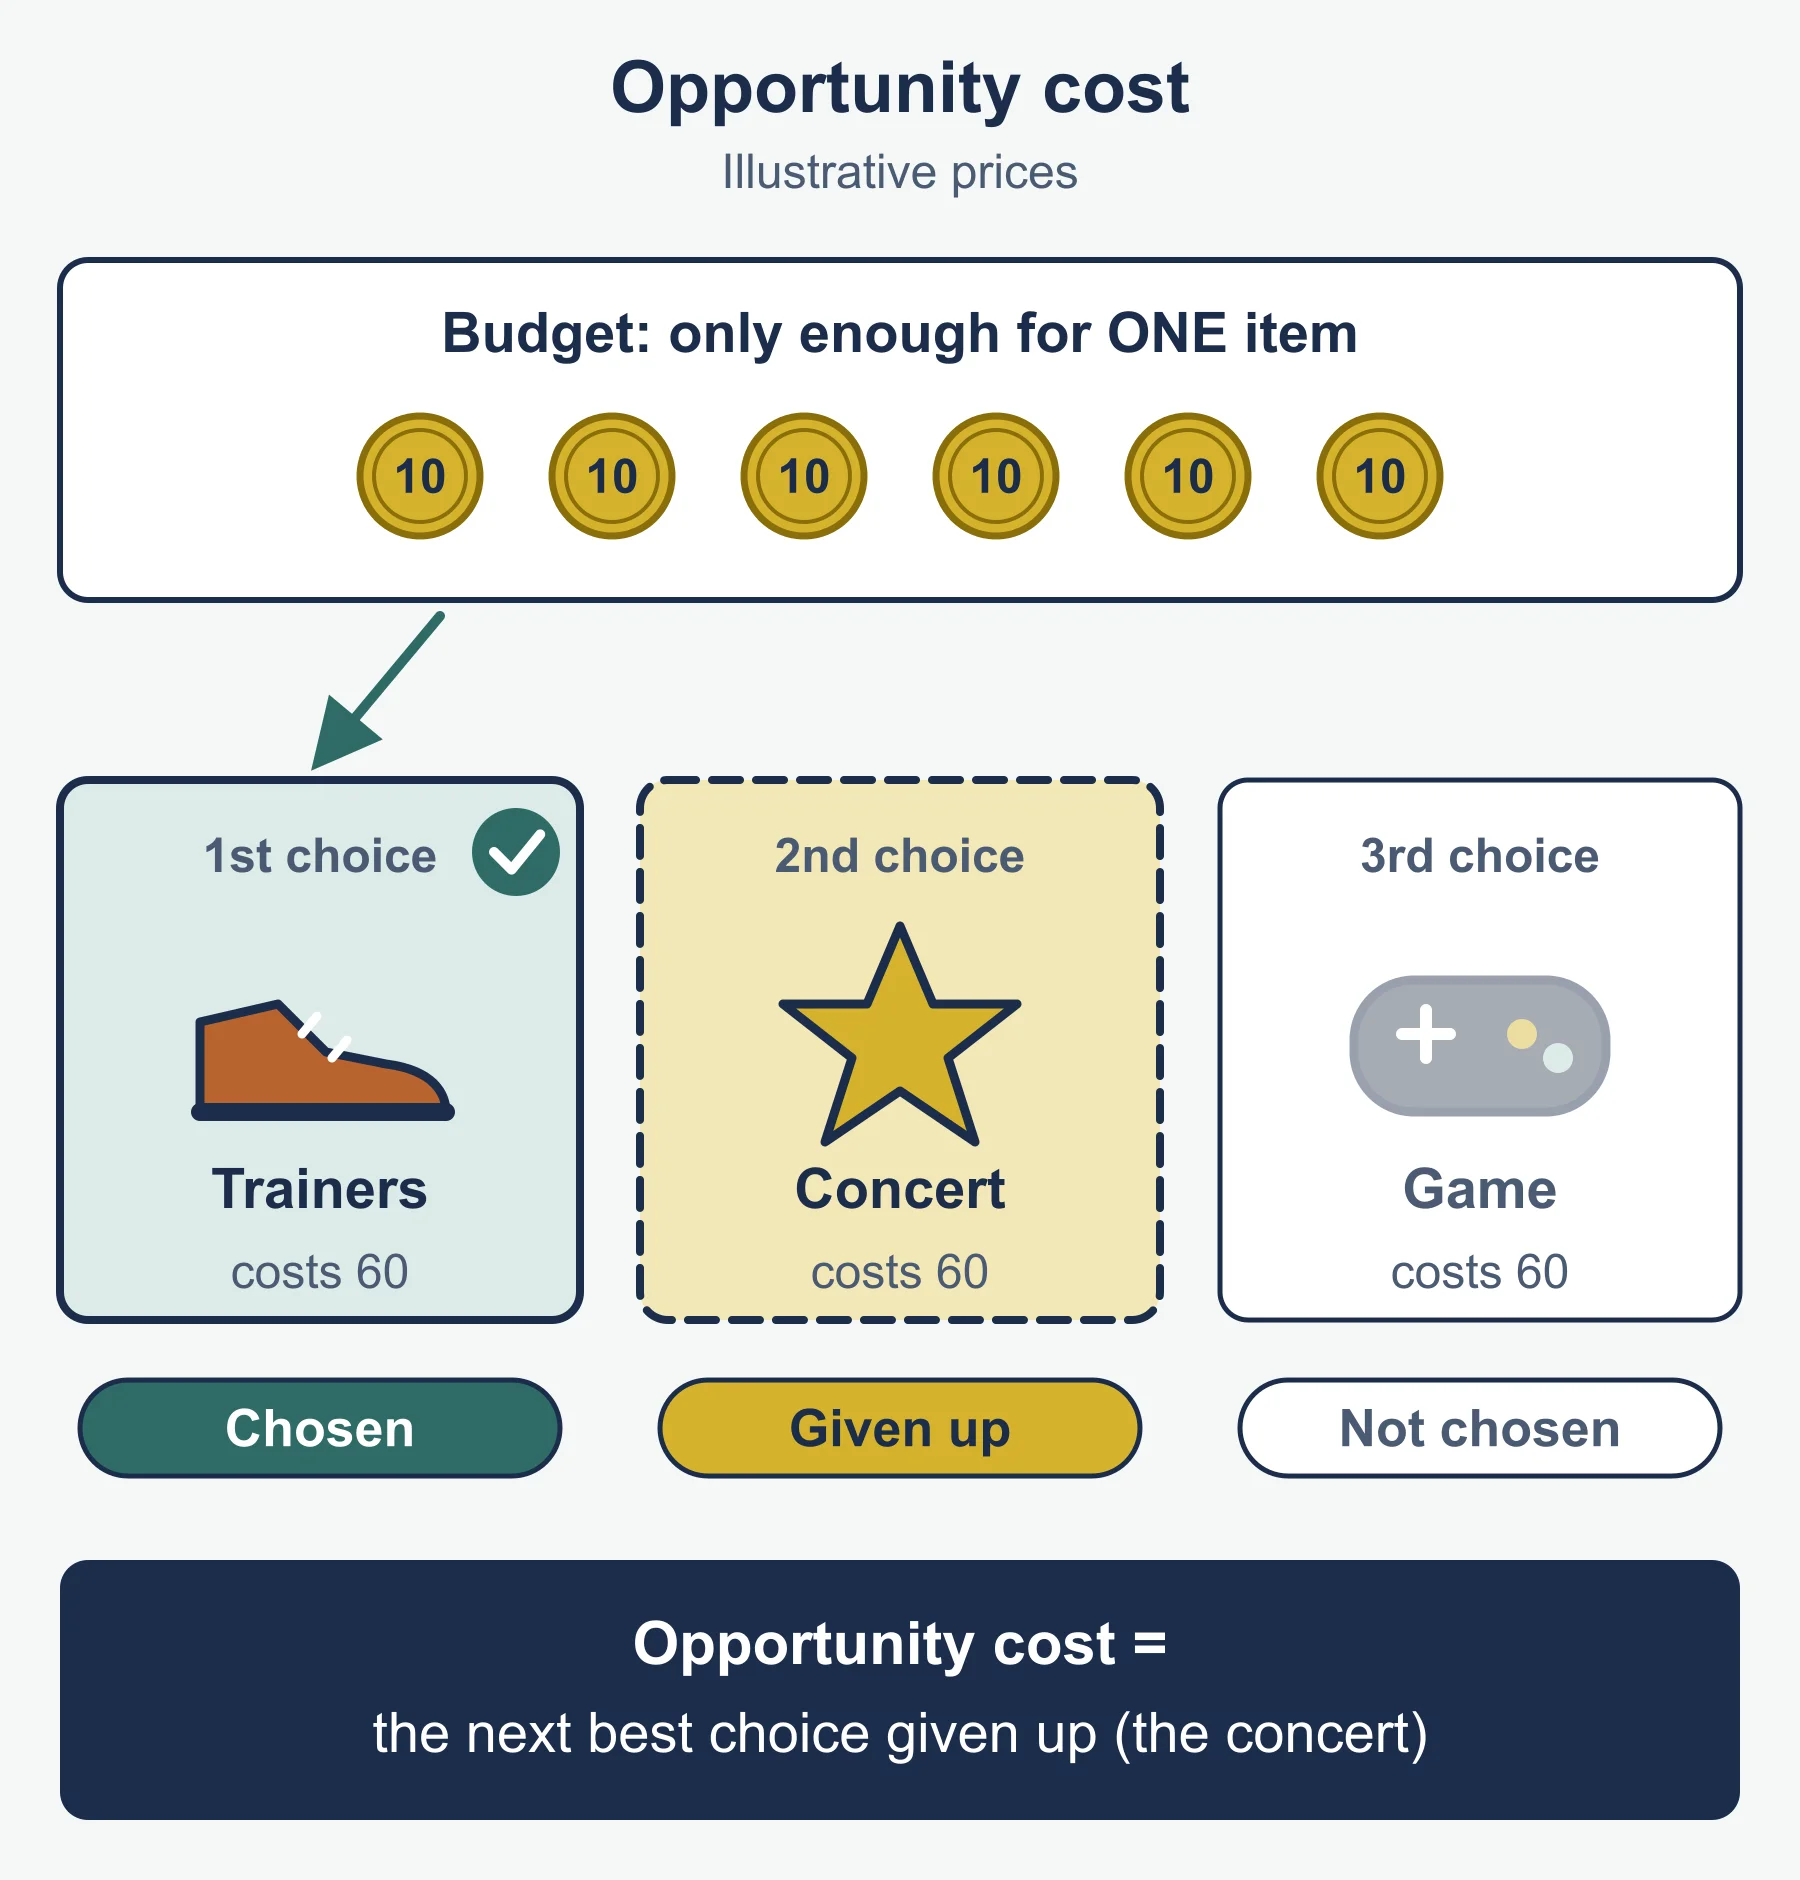
Opportunity cost is what the second-best use of the same resources would have been worth, lost because another use was chosen. Money, time, staff and equipment are limited, so every decision leaves something undone.
To identify the opportunity cost of a decision:
- List the realistic alternatives for the same resource.
- Value each one, in money or in a stated benefit.
- Rank them and select the one chosen.
- The opportunity cost is the next best option, not the total of all the options rejected.
Worked example: Birchall Farm Shop
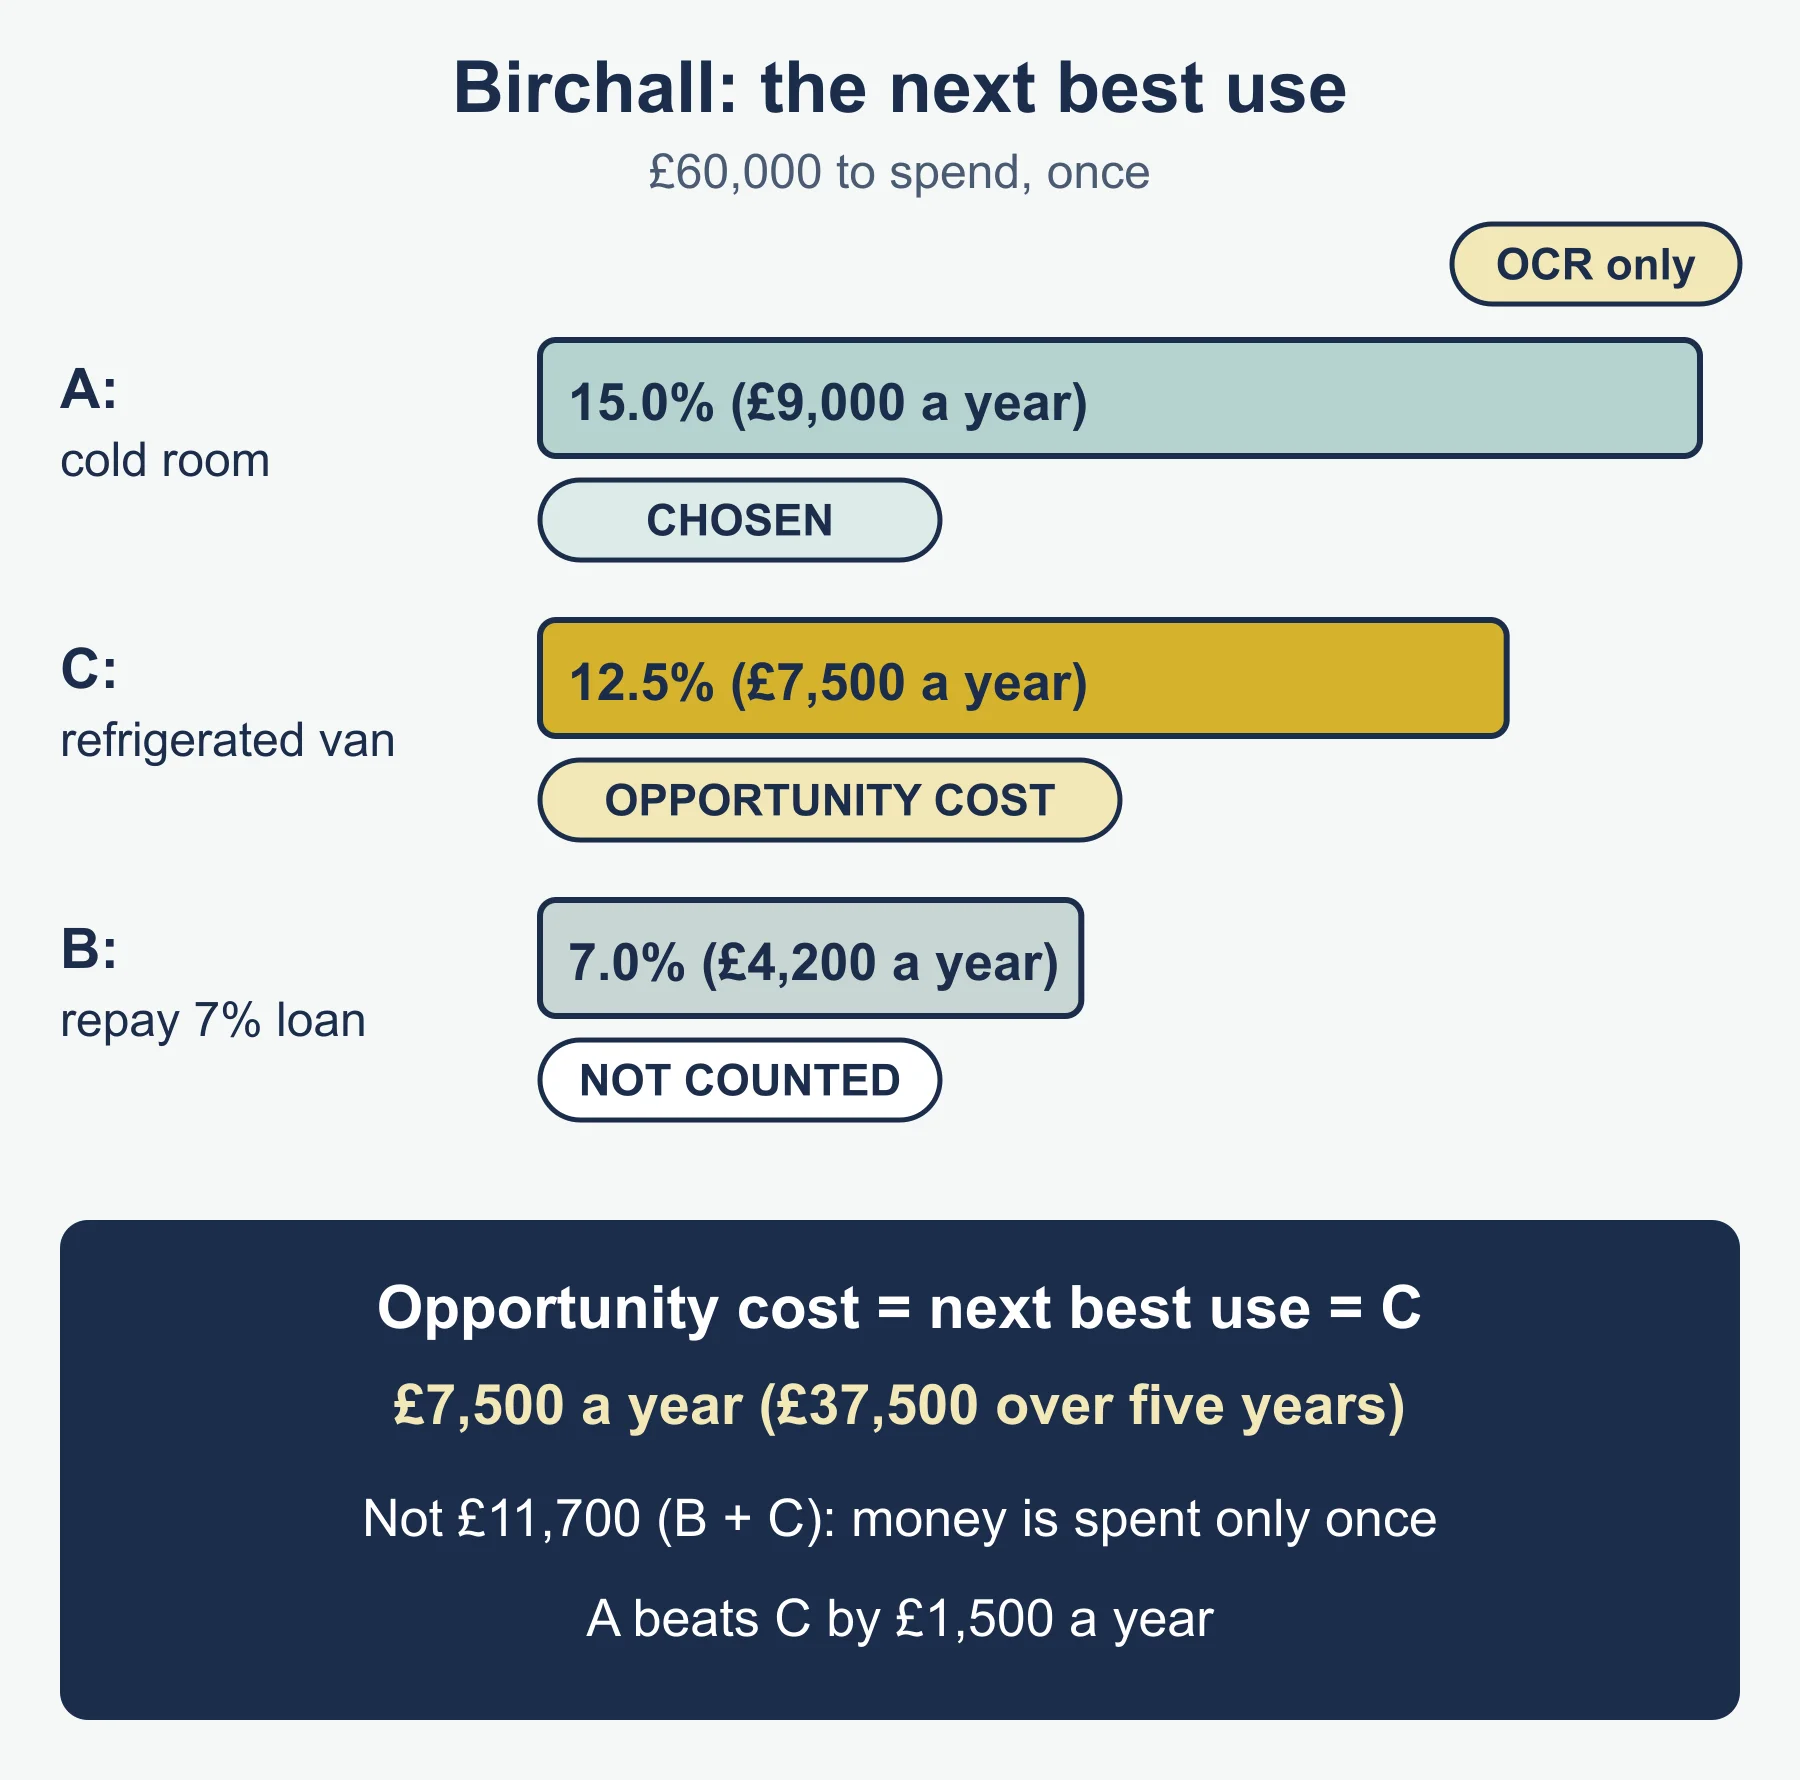
Birchall Farm Shop has £60,000 and three options.
| Option | Annual benefit | Annual return on £60,000 |
|---|---|---|
| A: cold room | £9,000 extra net cash | 15.0% |
| B: repay a loan at 7% | £4,200 interest saved | 7.0% |
| C: refrigerated van | £7,500 extra net cash | 12.5% |
The owner chooses A. The opportunity cost is option C, £7,500 a year (£37,500 over five years). It is not £11,700 (B plus C), because the money can be spent only once. A is better than C by £1,500 a year, so the decision looks sound on these figures alone.
Analysing the impact on decision making. Opportunity cost:
- forces comparison of options, not judgement of one project in isolation;
- shows that a project with a positive return can still be a poor choice if another use earns more;
- applies to time and management attention as well as money;
- links to risk, because the next best option may be safer;
- depends on estimates, and non-financial factors may change the ranking.
In longer answers, state the alternative forgone, give its value, then judge whether the chosen option beats it by enough to cover any extra risk.
Common errors
- Defining risk and uncertainty as identical, or saying uncertainty can always be given a probability.
- Describing opportunity cost as every alternative given up.
- Treating expected value as the amount the business will certainly earn.
- Naming stakeholders without saying how each is affected.
Frequently asked questions
What is opportunity cost in OCR A Level Business? Opportunity cost is what the second-best use of the same resources would have been worth, lost because another use was chosen. In OCR A Level Business (H431) you should name the alternative given up and give its value where the data allows.
Why can a project with a positive return still be a poor choice? A project can earn a positive return but still be worse than the best alternative use of the same money or resources. Opportunity cost forces a business to compare options rather than judging one project in isolation.
Can a business remove risk completely? No. A business cannot remove risk, but it can reduce it through methods such as research and forecasting, and each method should be judged on its cost, effectiveness and suitability for the business.
Official syllabus
Source: OCR, Advanced GCE in Business (H431), Version 2.1, January 2026, for first assessment in 2017 with final assessment in summer 2027, area of study Business objectives and strategy, the Risk and uncertainty and Opportunity cost content (numbered 1.7 and 1.8 on this site, not in the specification).
Get free revision emails (optional)
Occasional emails with practice questions, worked explanations and links to free resources for the qualification and subjects you choose. No spam, and you can unsubscribe from any email. The free tools on this site never need an email.
Related resources
-
Practice questions
OCR A Level Business: Risk and uncertainty and Opportunity cost (H431) – Practice Questions
Ten original questions with worked answers on risk and reward, uncertainty and opportunity cost for OCR A Level Business, using invented businesses.
Business · OCR · A Level
Try questions -
Revision notes
OCR A Level Business: Risk and uncertainty and Opportunity cost (H431) – Revision Notes
Condensed recall notes on risk and reward, quantifiable risk, uncertainty and opportunity cost for OCR A Level Business, with a ten-question self-test.
Business · OCR · A Level
Revise topic -
Study guides
OCR A Level Business: Strategy and implementation and Business plan (H431)
Study guide to strategy, implementation, business plans, Plan-Do-Review and strategic review for OCR A Level Business H431, with worked examples.
Business · OCR · A Level
Read guide
Related articles
-
teaching
A Level tuition in Dubai: Cambridge or Pearson Edexcel International A Level?
Schools in Dubai and Abu Dhabi teach either Cambridge International AS & A Level or Pearson Edexcel International A Level. How the two are structured, why it matters for tuition, and how online classes from Lahore work.
9 October 2026
-
curriculum guides
Choosing subjects at IGCSE and A Level
How subject choices at 14 and 16 affect university options later, and how to keep pathways open without overloading a timetable.
28 July 2026
Studying this with a teacher
Working through Business A LEVELS?
This page is free and stays free. If you would rather be taught it, Marlbridge runs Business classes one-to-one, online in your own time zone. One-to-one only for this course: Rs 6,000 per class in Pakistan, with other currencies on the fees page. The first trial class is free. WhatsApp replies within an hour (8am–11pm Pakistan time, every day); email the same day.
OCR Business teachers at Marlbridge
