
Revision Notes
OCR A Level Business: Risk and uncertainty and Opportunity cost (H431) – Revision Notes
Condensed recall notes on risk and reward, quantifiable risk, uncertainty and opportunity cost for OCR A Level Business, with a ten-question self-test.
- Subject
- Business
- Level
- A LEVELS
- Topic
- Business objectives and strategic decisions
- Author
- Marlbridge Academic Team
- Updated
- Reviewed by
- Salman Ahmad (what this means)
Aligned to OCR A Level Business (H431), Version 2.1 (January 2026), for first assessment in 2017; final assessment summer 2027. Official specification .
Syllabus page (what it covers and how it is assessed): OCR A Level Business.
Syllabus points this page covers
H431
- 1.7 Risk and uncertainty
- 1.8 Opportunity cost
Found an error? Report a correction.
Need help with this topic? Request a free trial class for A Level Business (H431).
Condensed notes for the Risk and uncertainty and Opportunity cost content (numbered 1.7 and 1.8 on this site; the specification itself does not number them) of the OCR A Level Business specification (H431, Version 2.1, January 2026). For full explanations and worked examples, use the study guide. Test yourself with the practice questions. For the wider area see the area revision notes. Course pages: the OCR A Level Business hub and the checklist. To find weak spots first, take a free 10-minute diagnostic.
Key definitions
| Term | Meaning |
|---|---|
| Risk | The possibility that a decision ends worse than hoped |
| Reward | The benefit if the decision works: profit, growth, return on money invested |
| Quantifiable risk | A risk where likelihood or loss can be given a number from data or research |
| Unquantifiable risk | A risk with no reliable basis for a number |
| Uncertainty | Not knowing what will happen, or being unable to give reliable probabilities |
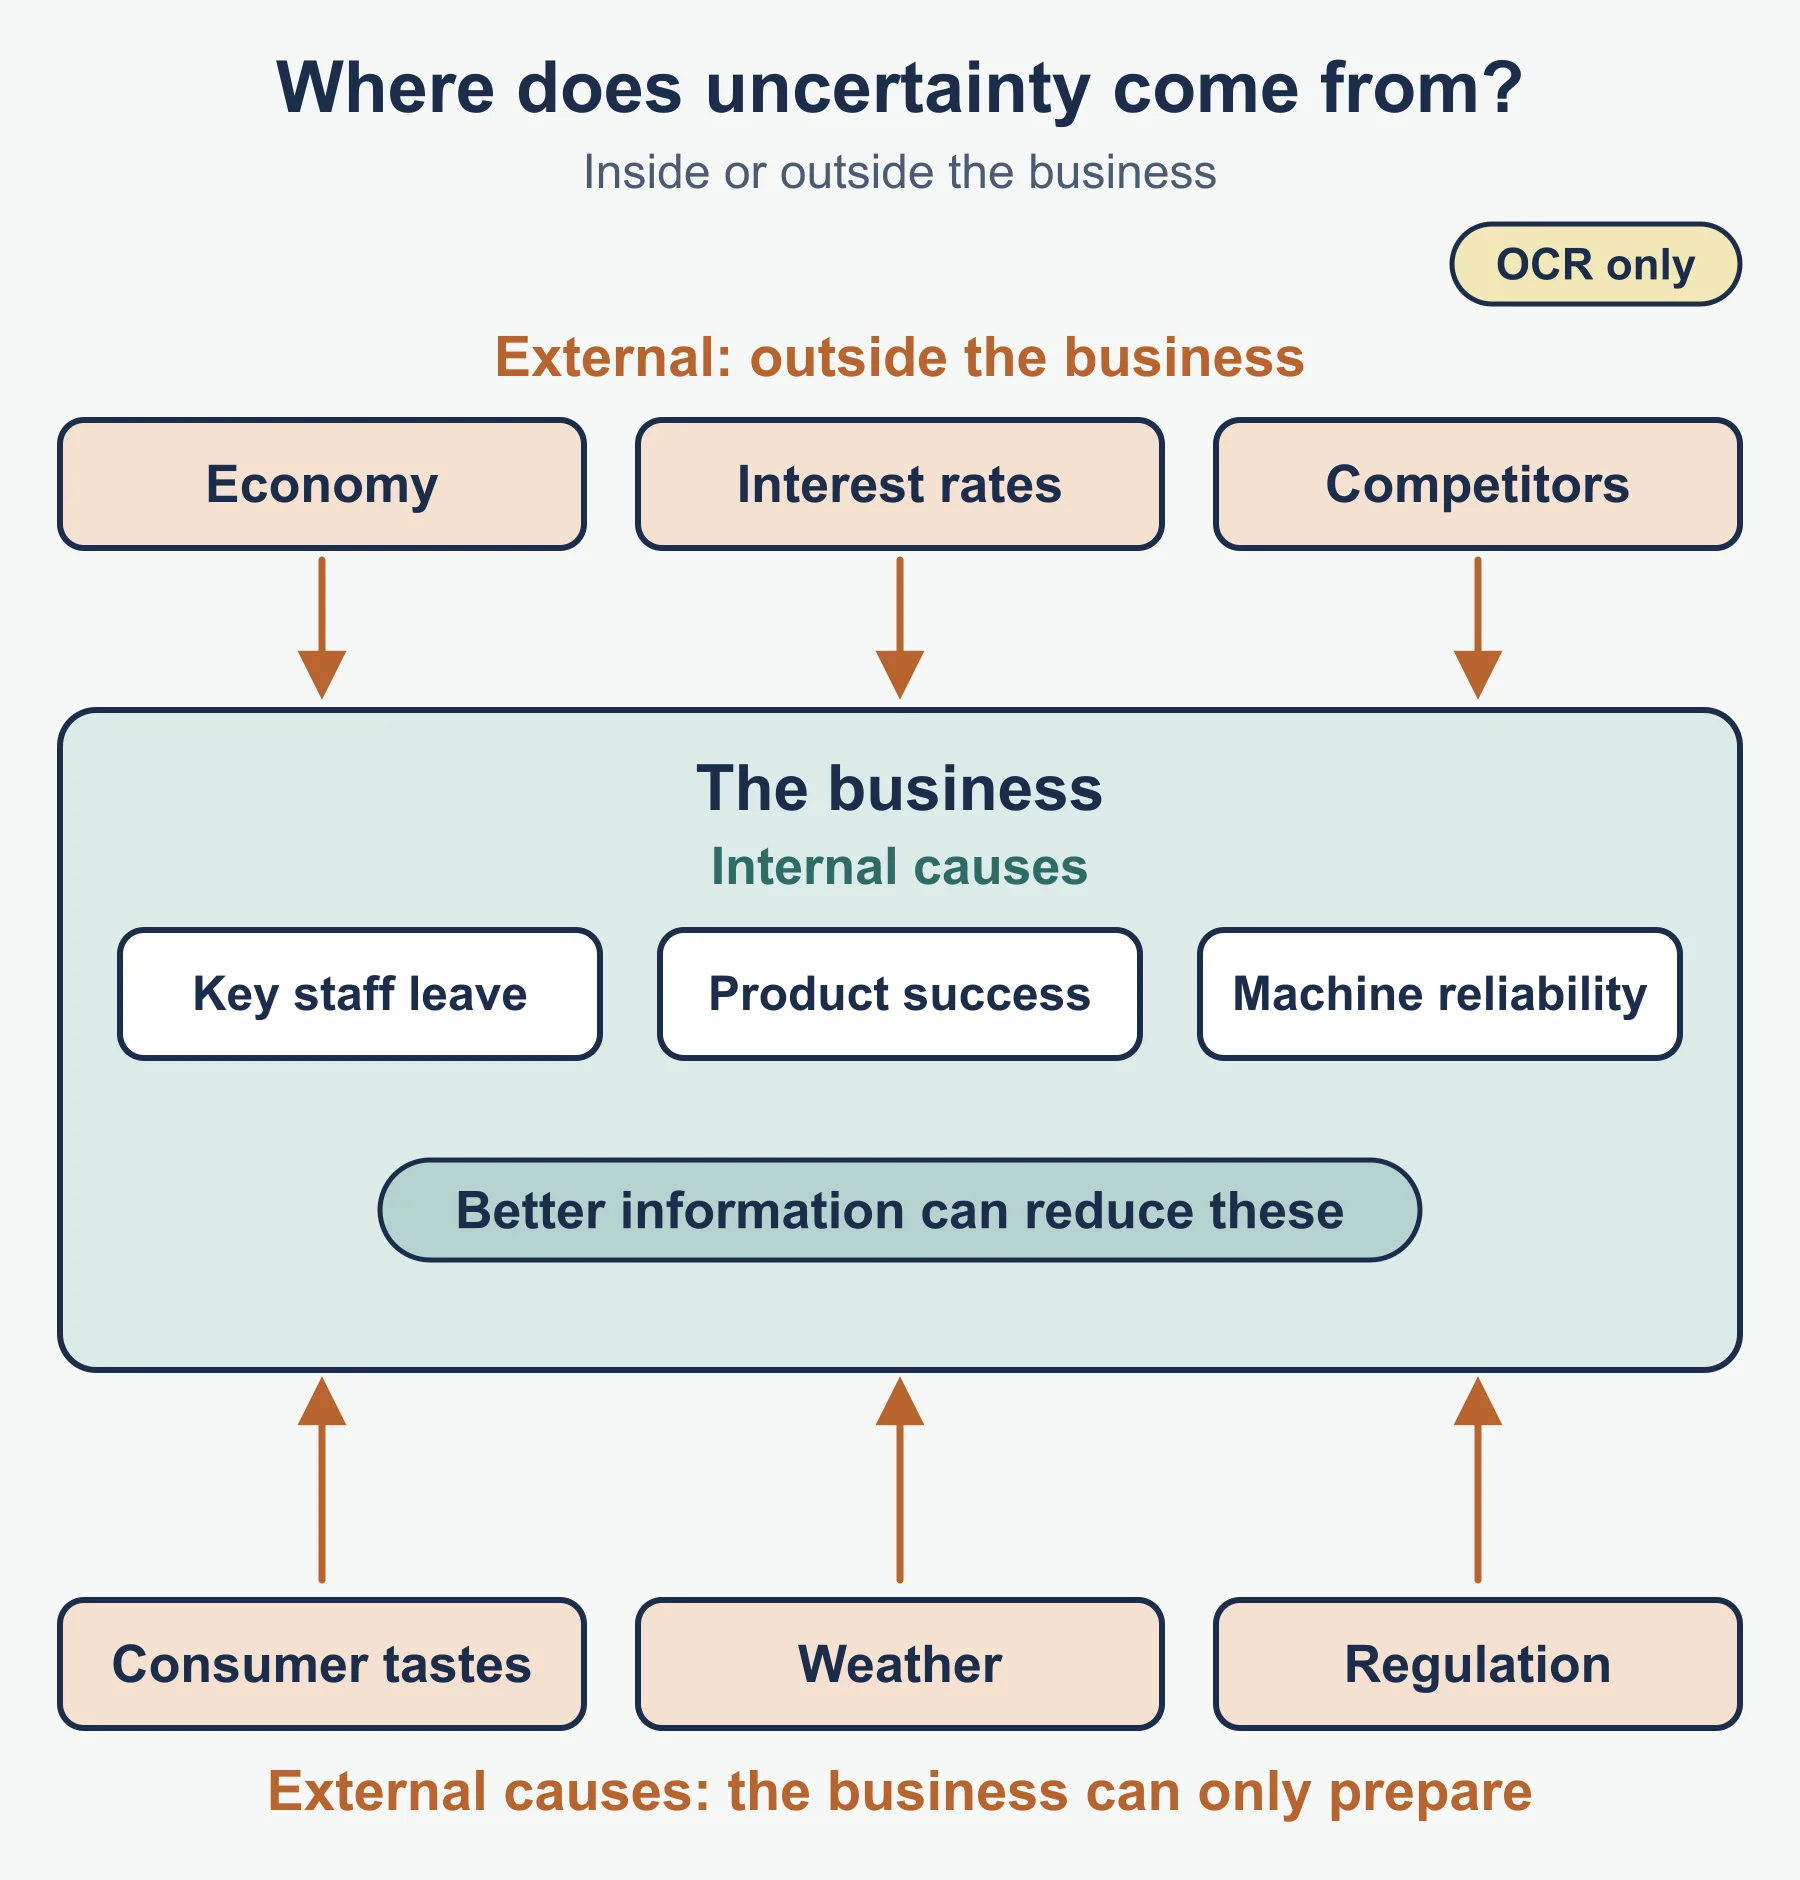
| Internal cause | Source of uncertainty inside the business |
| External cause | Source of uncertainty outside the business |
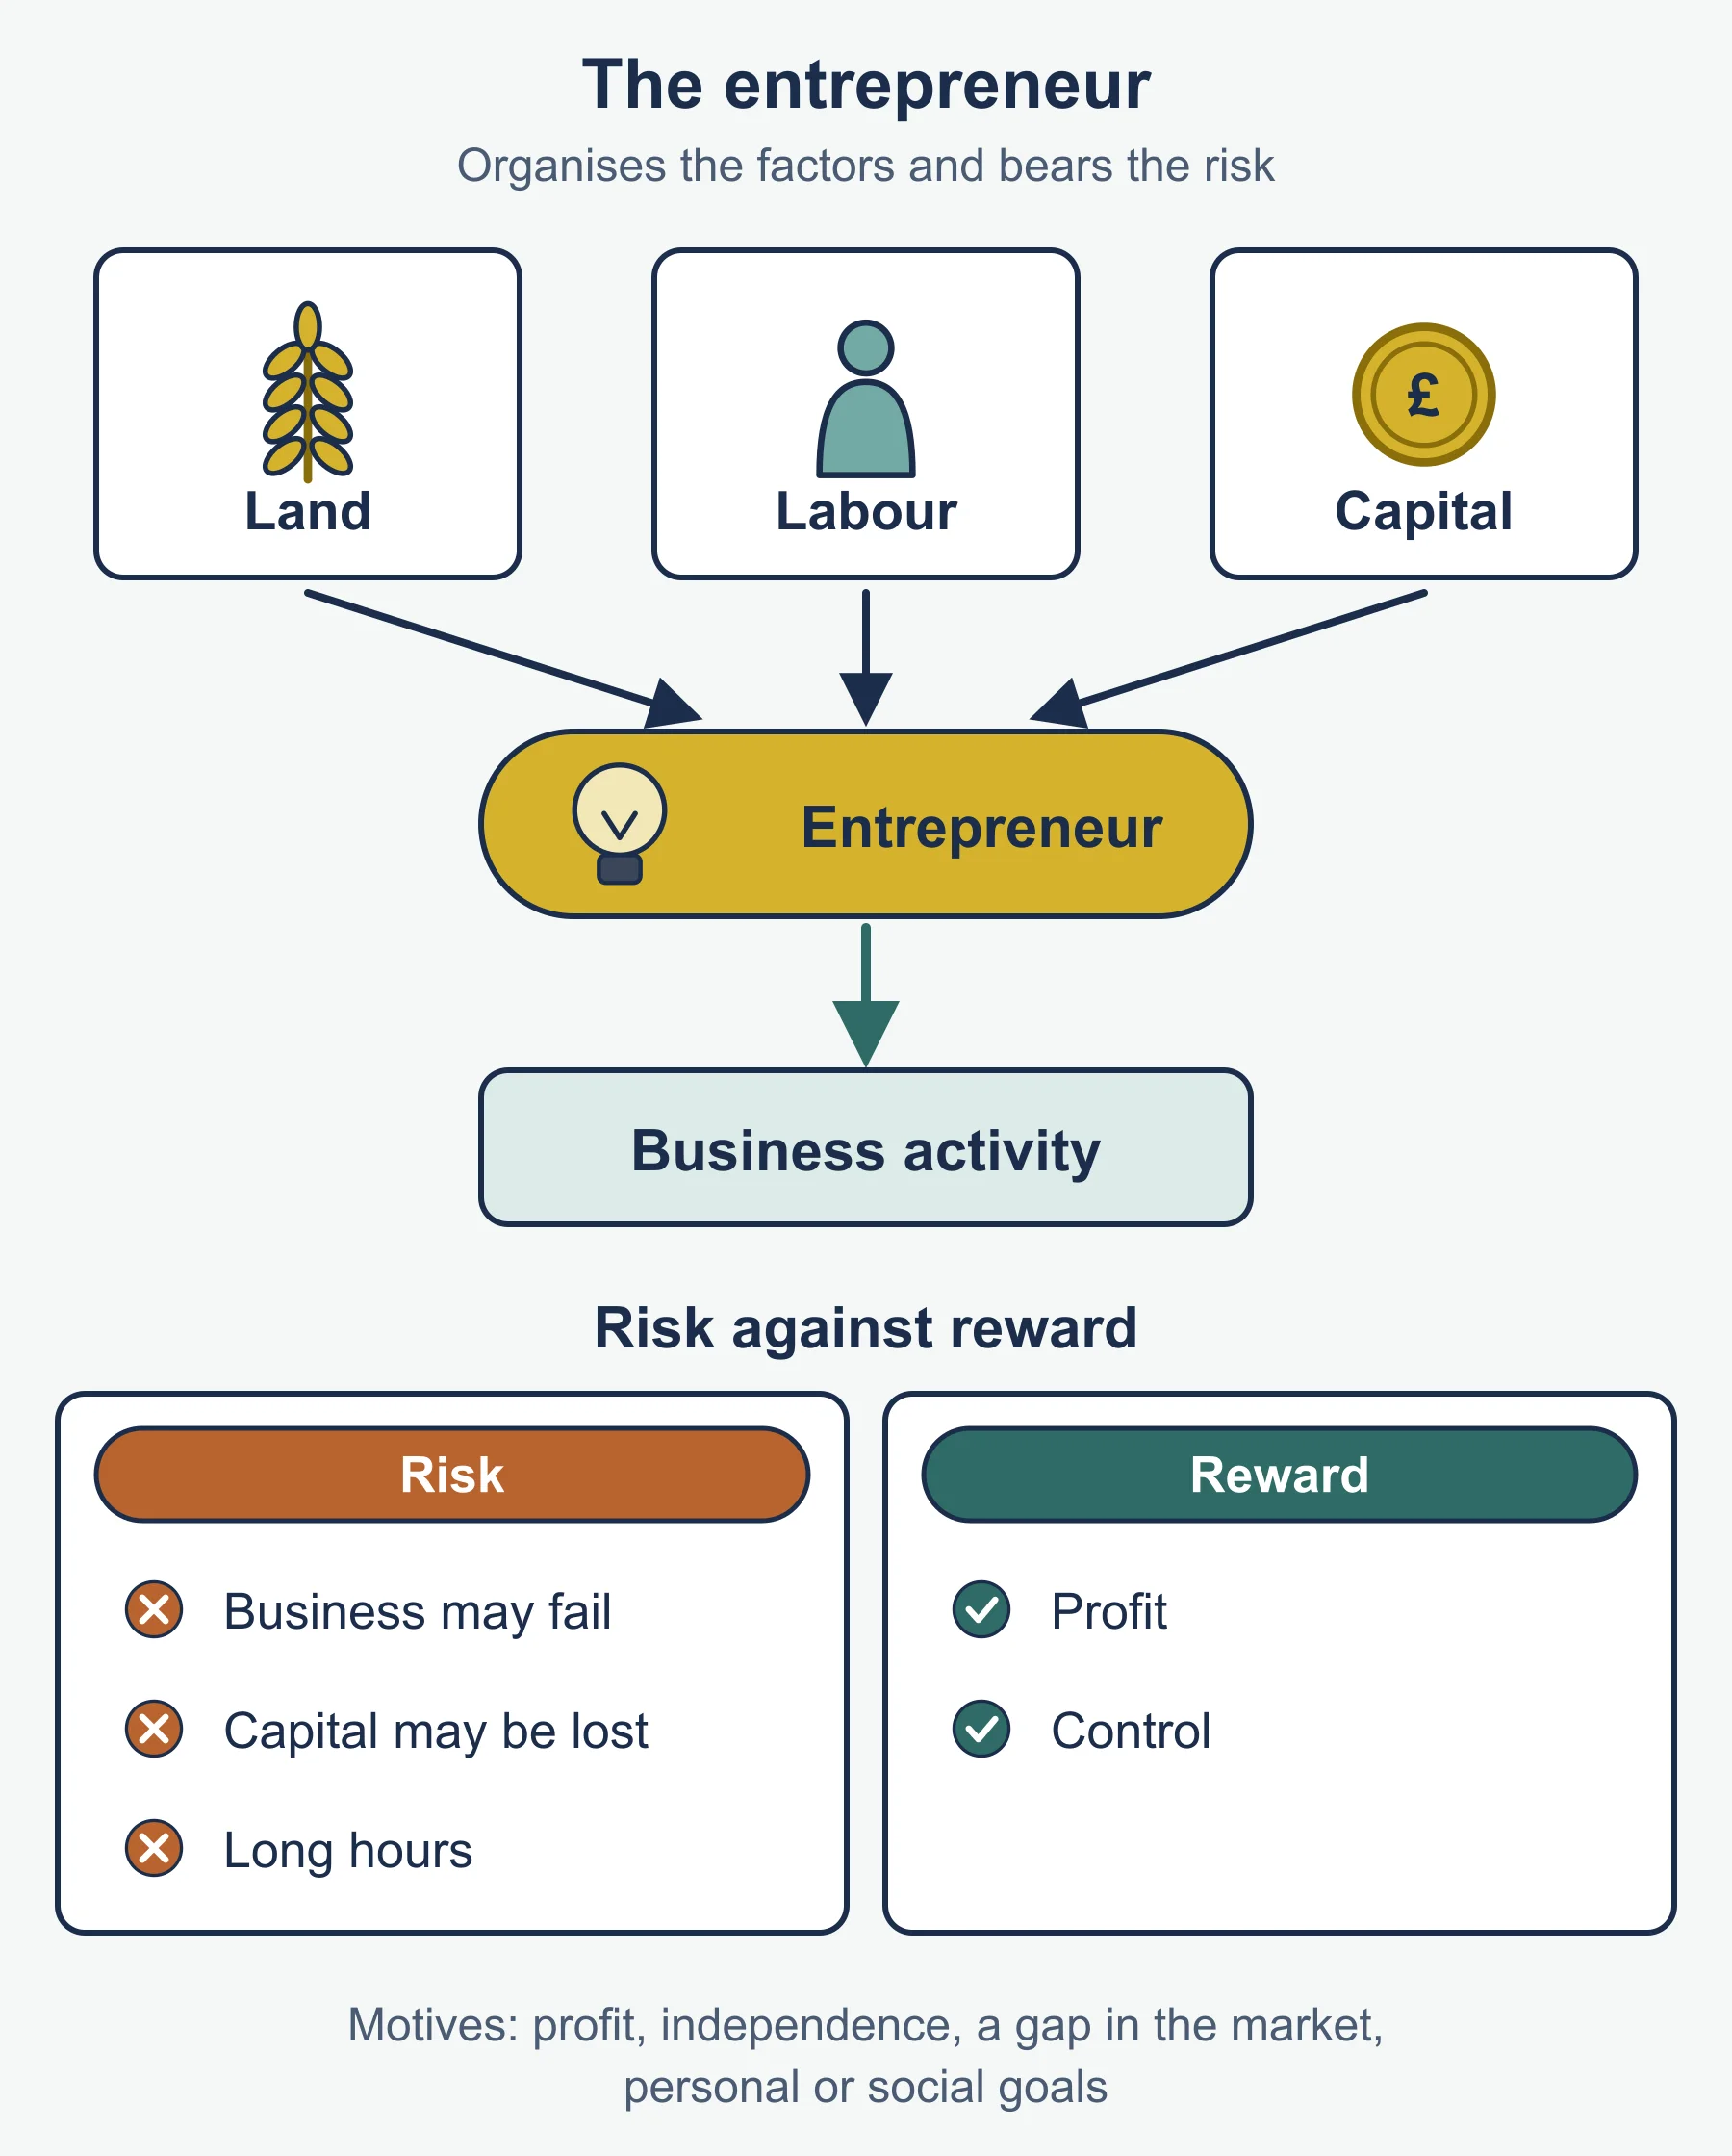
| Entrepreneur | A person who takes the risk of starting or running a business for the reward |
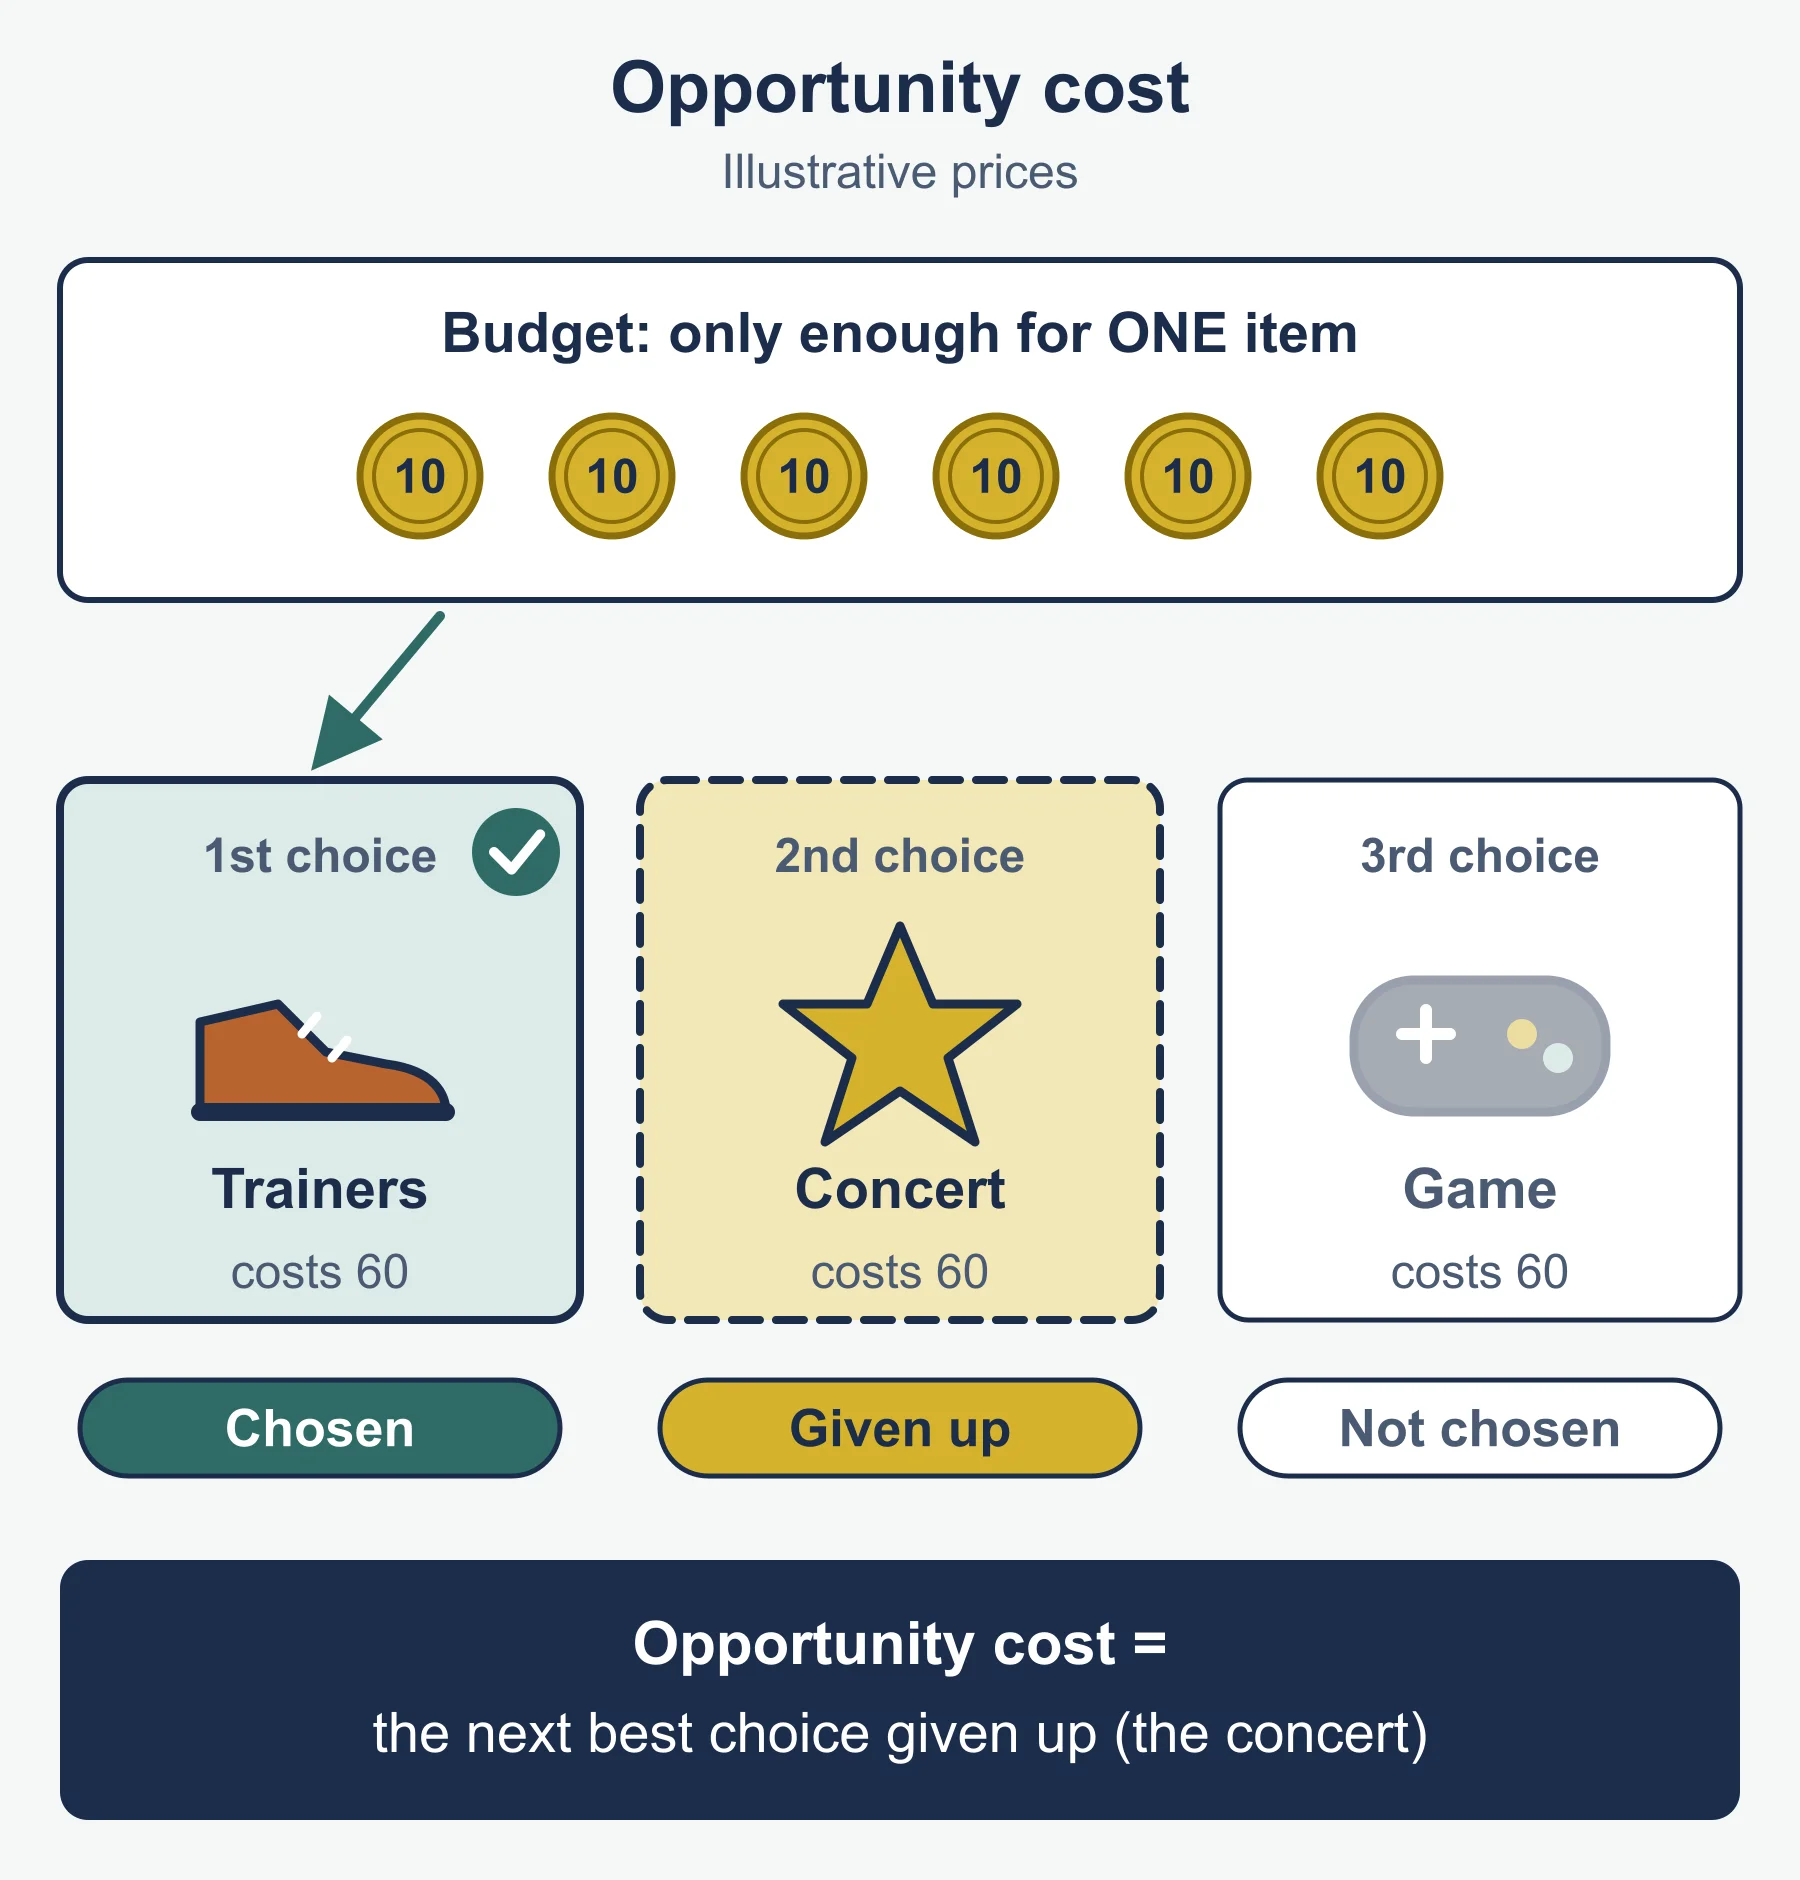
| Opportunity cost | What the second-best use of the same resources was worth, lost by choosing another |
| Expected value | Sum of each outcome multiplied by its probability (the standard form) |
Risk and reward
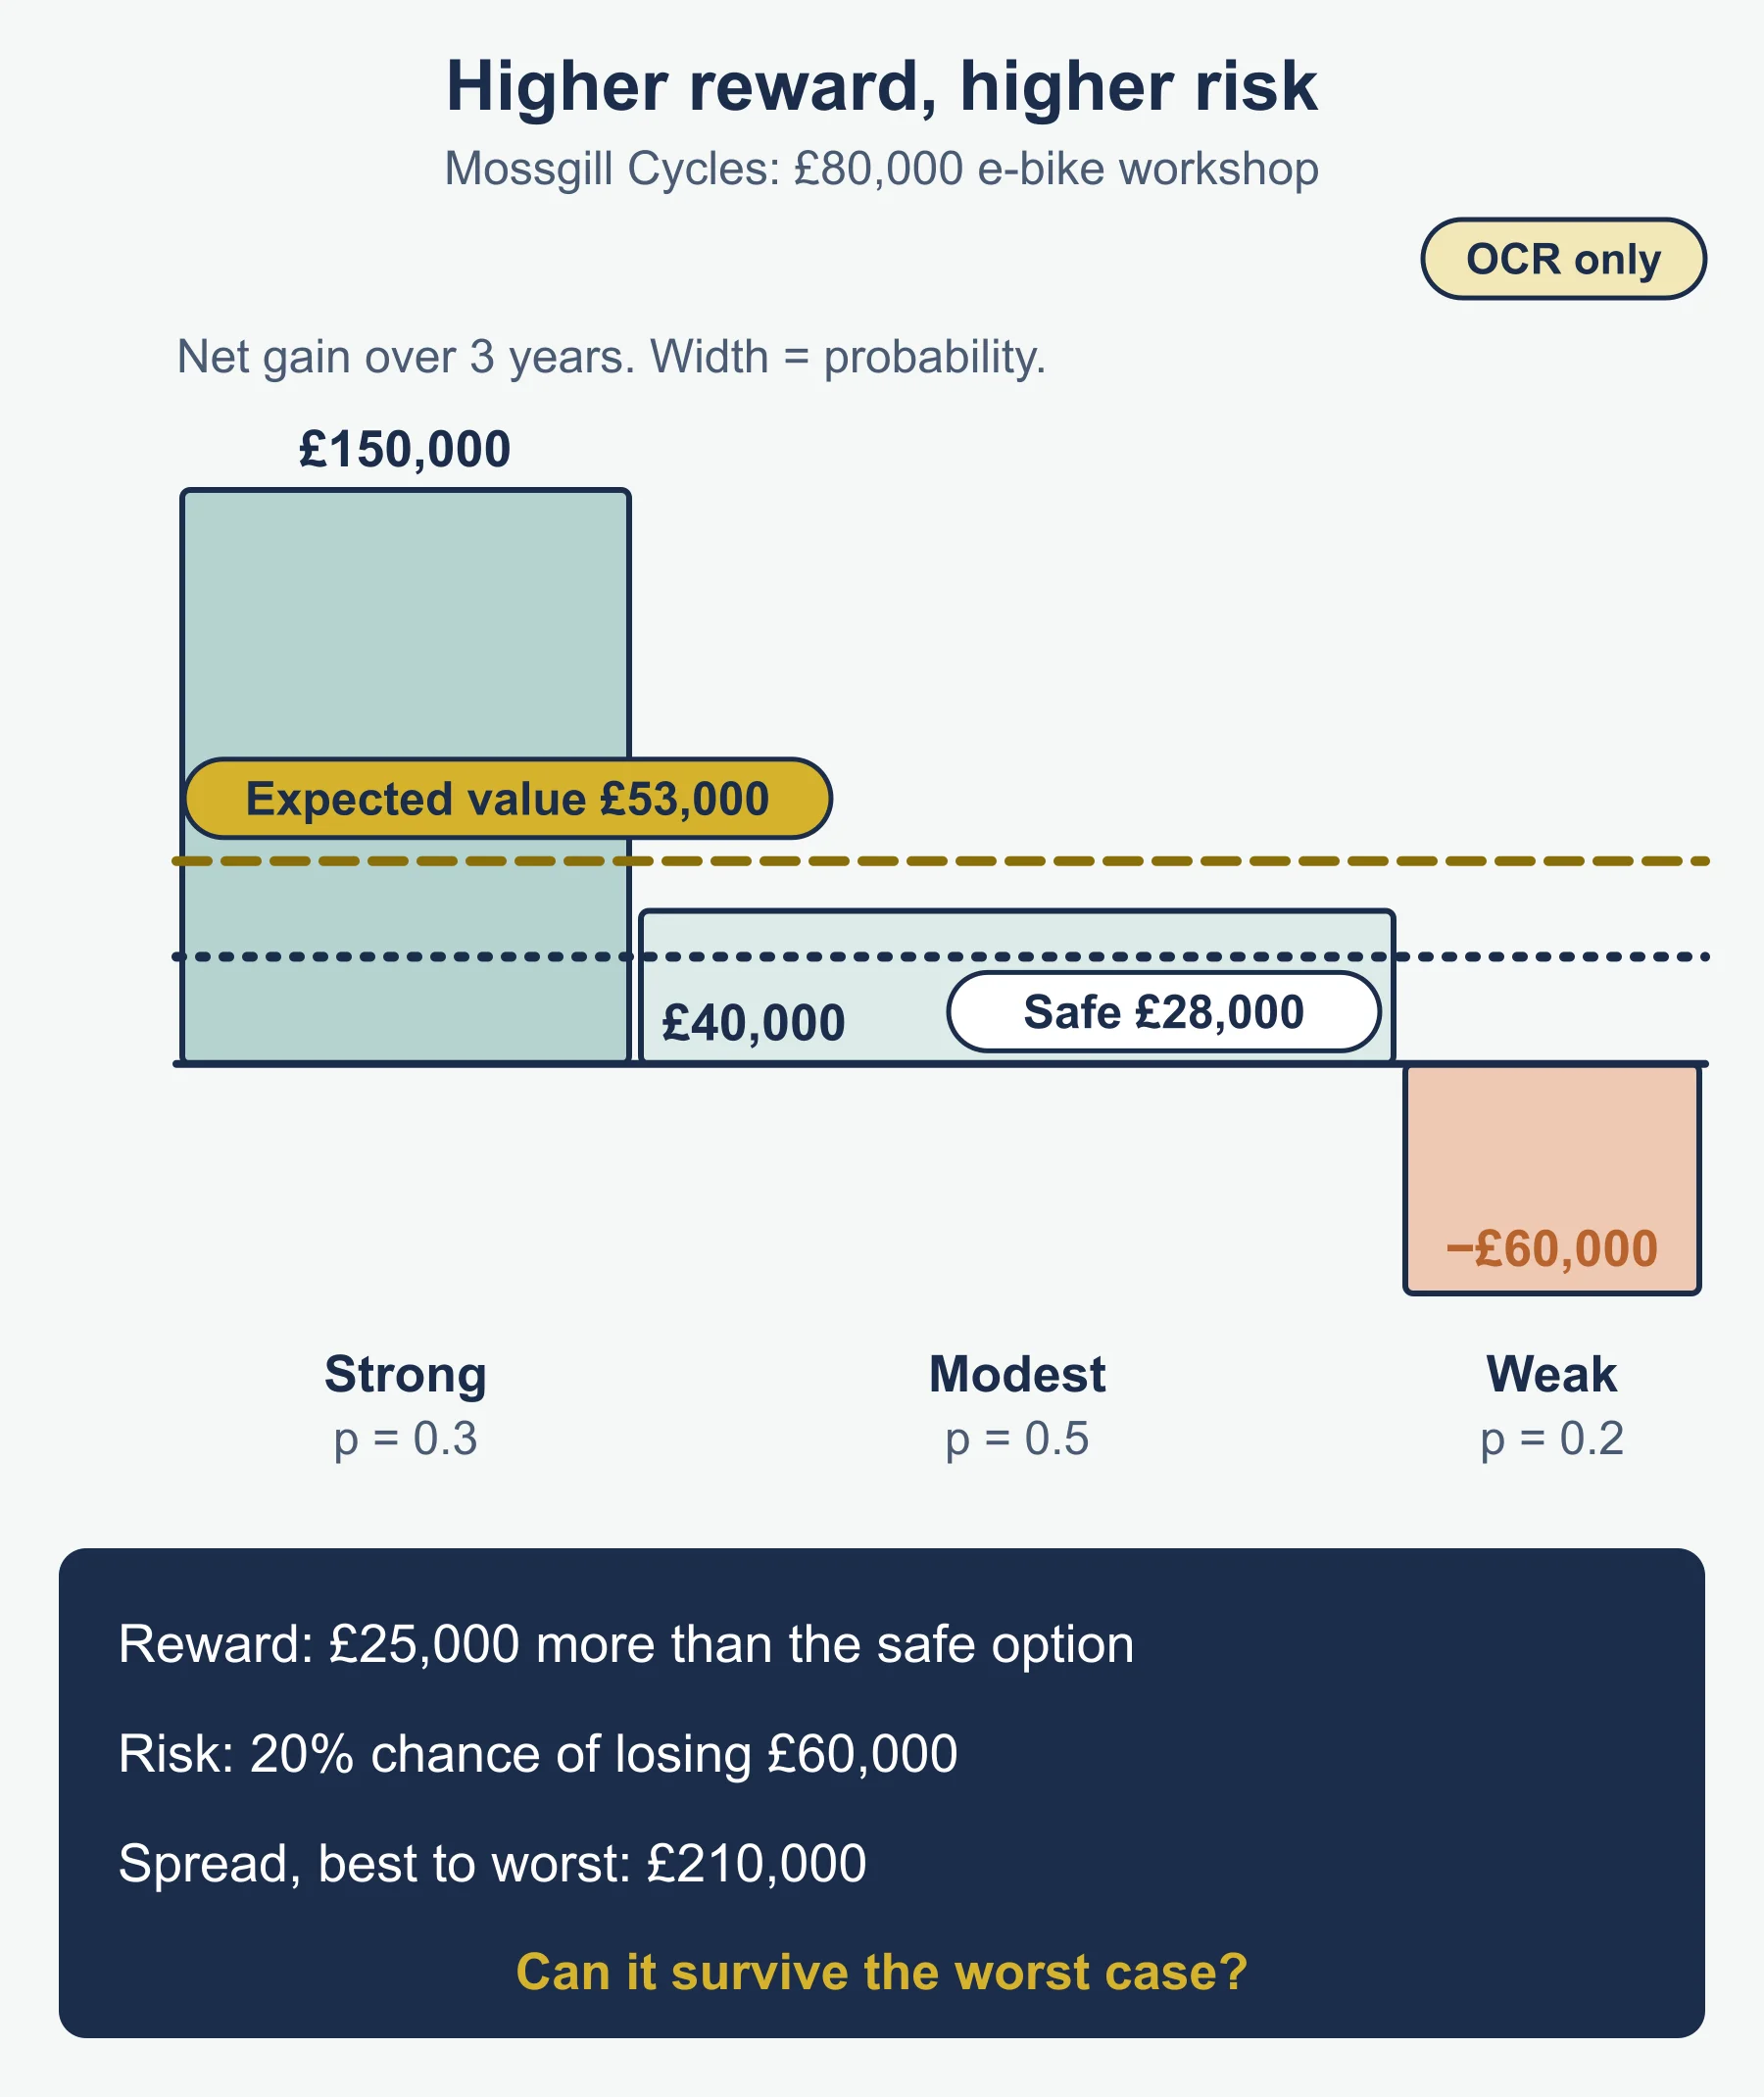
- Higher potential reward usually goes with higher risk. This is a tendency, not a rule.
- Evaluate it: is the extra reward worth the extra risk? Could the business survive the worst case? What are its objectives (survival or growth)? Who bears the loss?
- Compare options on both expected reward and spread of outcomes, not on the average alone.
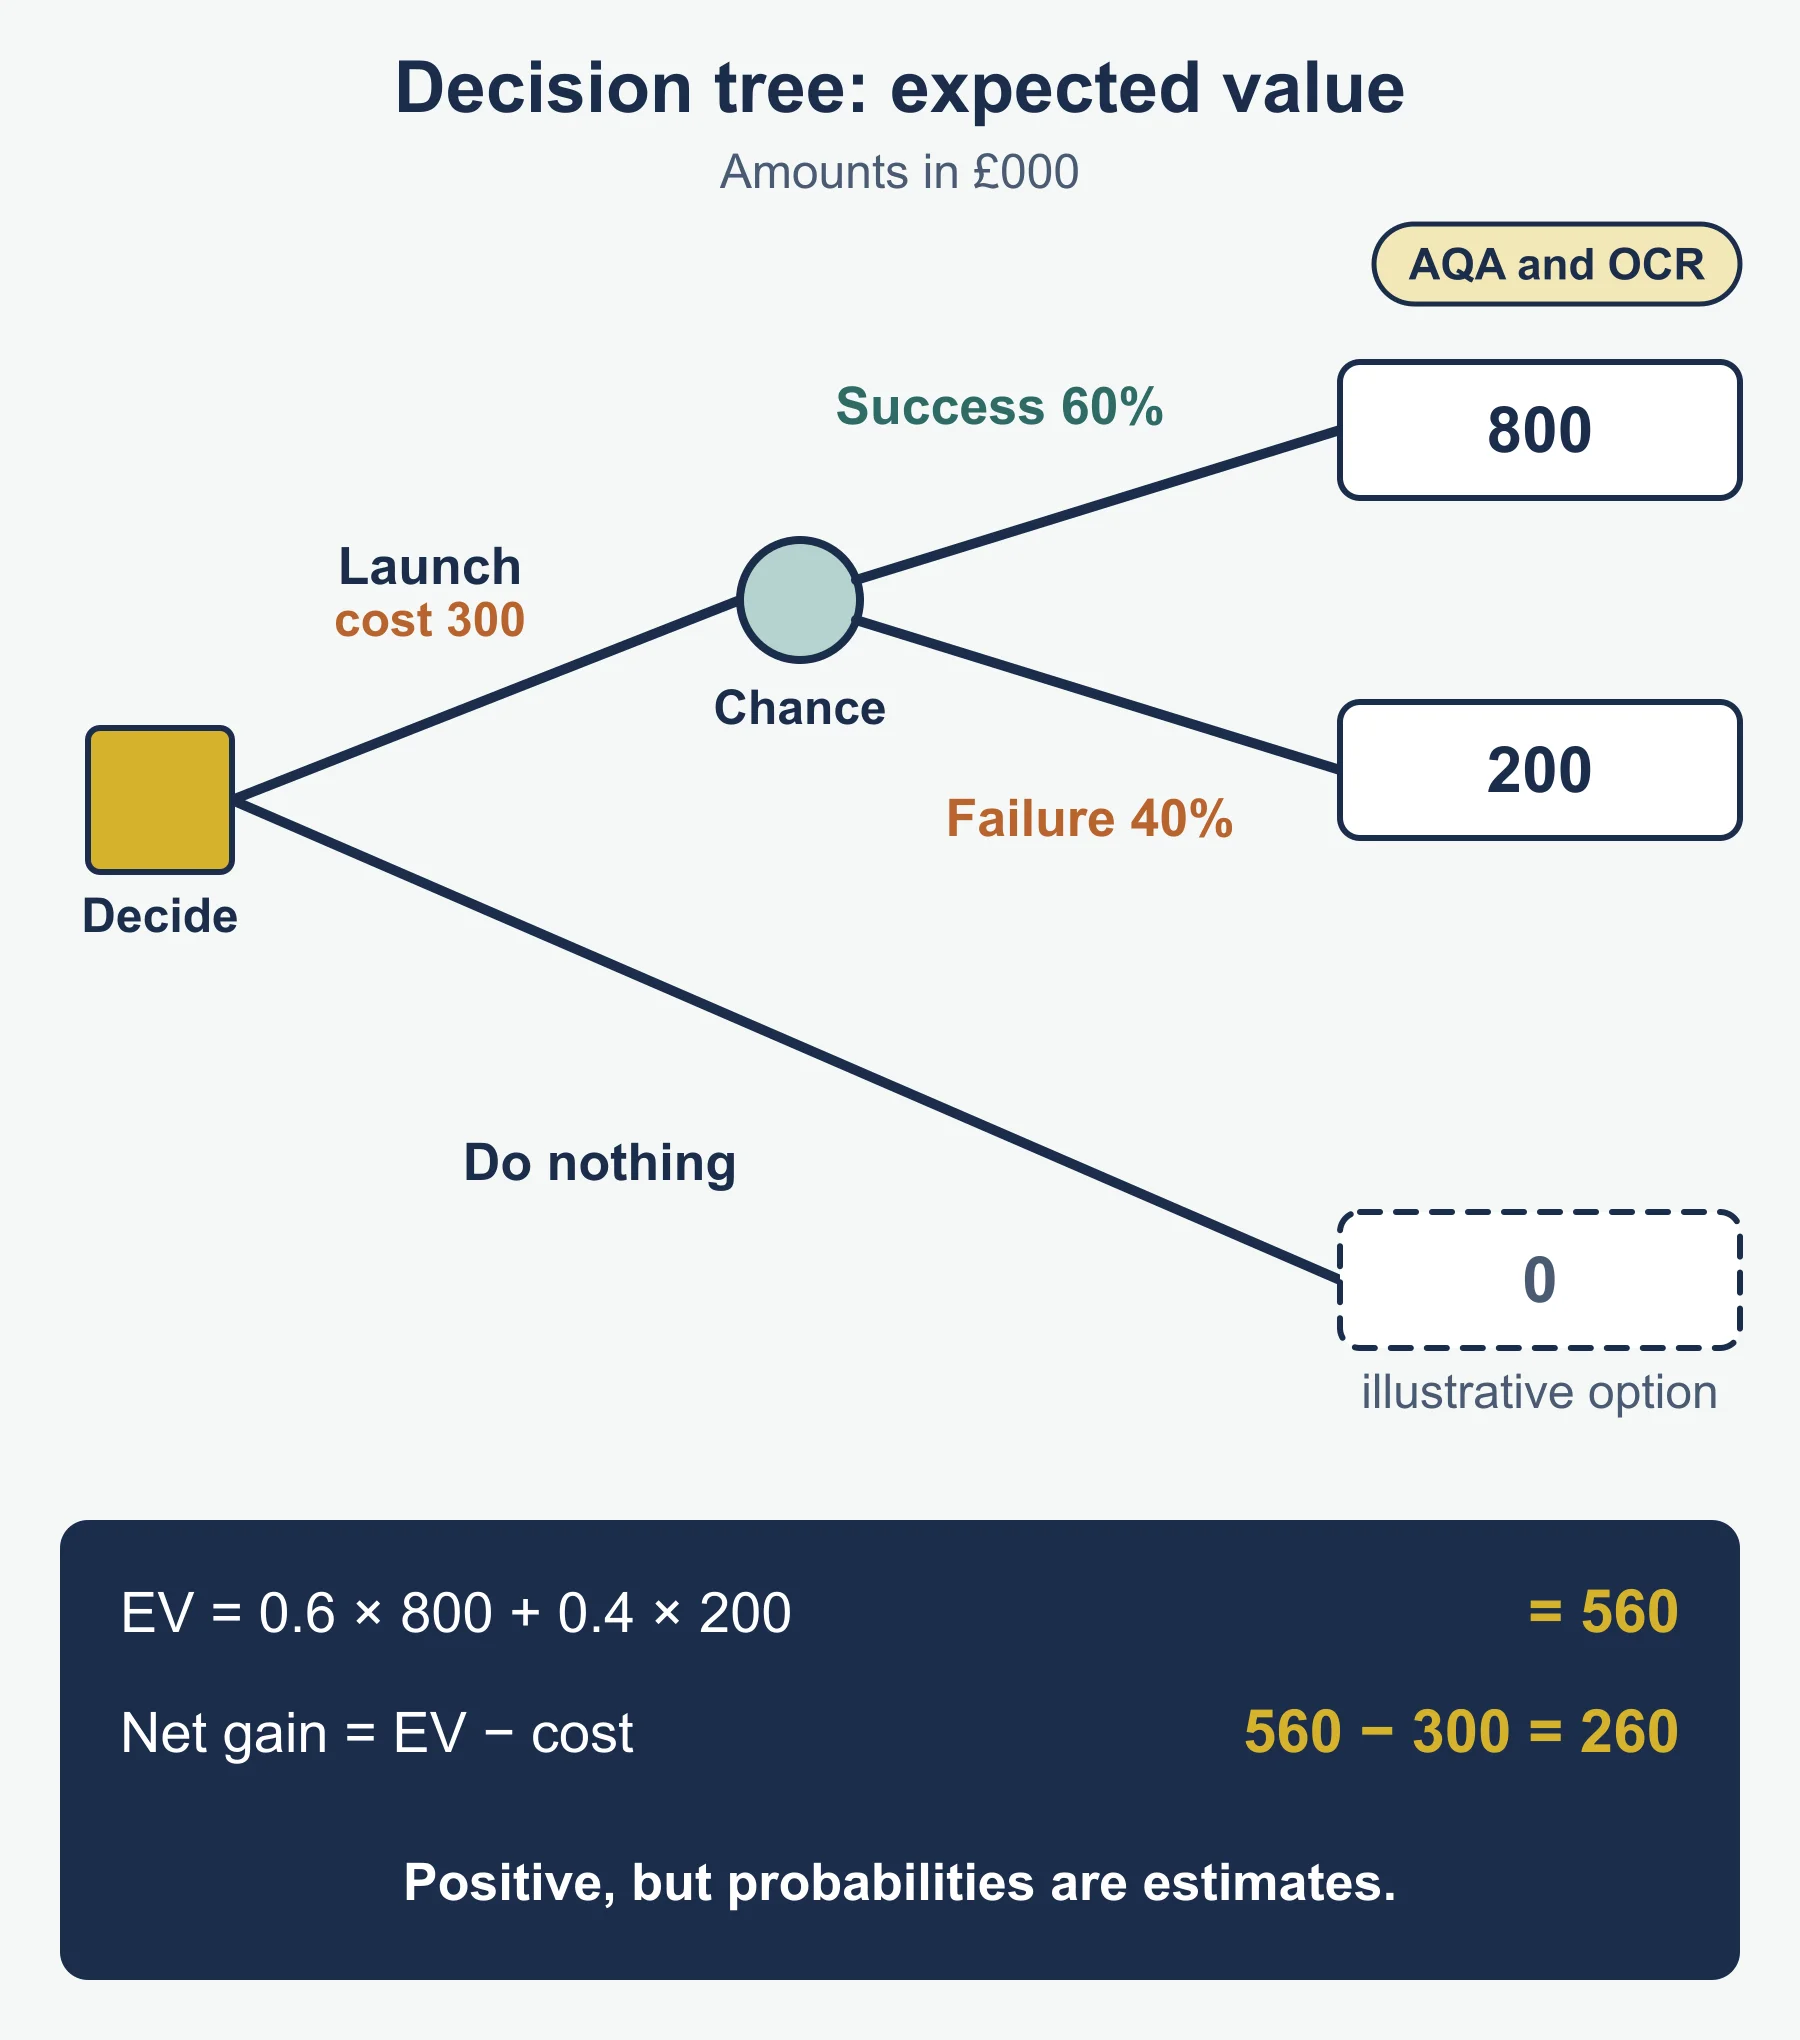
Method: expected value
- List each outcome as a net figure.
- Multiply each by its probability.
- Add the results. Probabilities must total 1.
- Compare with the alternatives, then comment on risk, the worst case and the reliability of the probabilities.
Worked reminder: Axtell Joinery, a small furniture maker, may launch a new range. A hit gives +£50,000 (probability 0.6) and a flop gives -£20,000 (probability 0.4). Expected value = 0.6 × 50,000 + 0.4 × -20,000 = 30,000 - 8,000 = £22,000. The worst case is a £20,000 loss, so the question is whether Axtell could bear it.
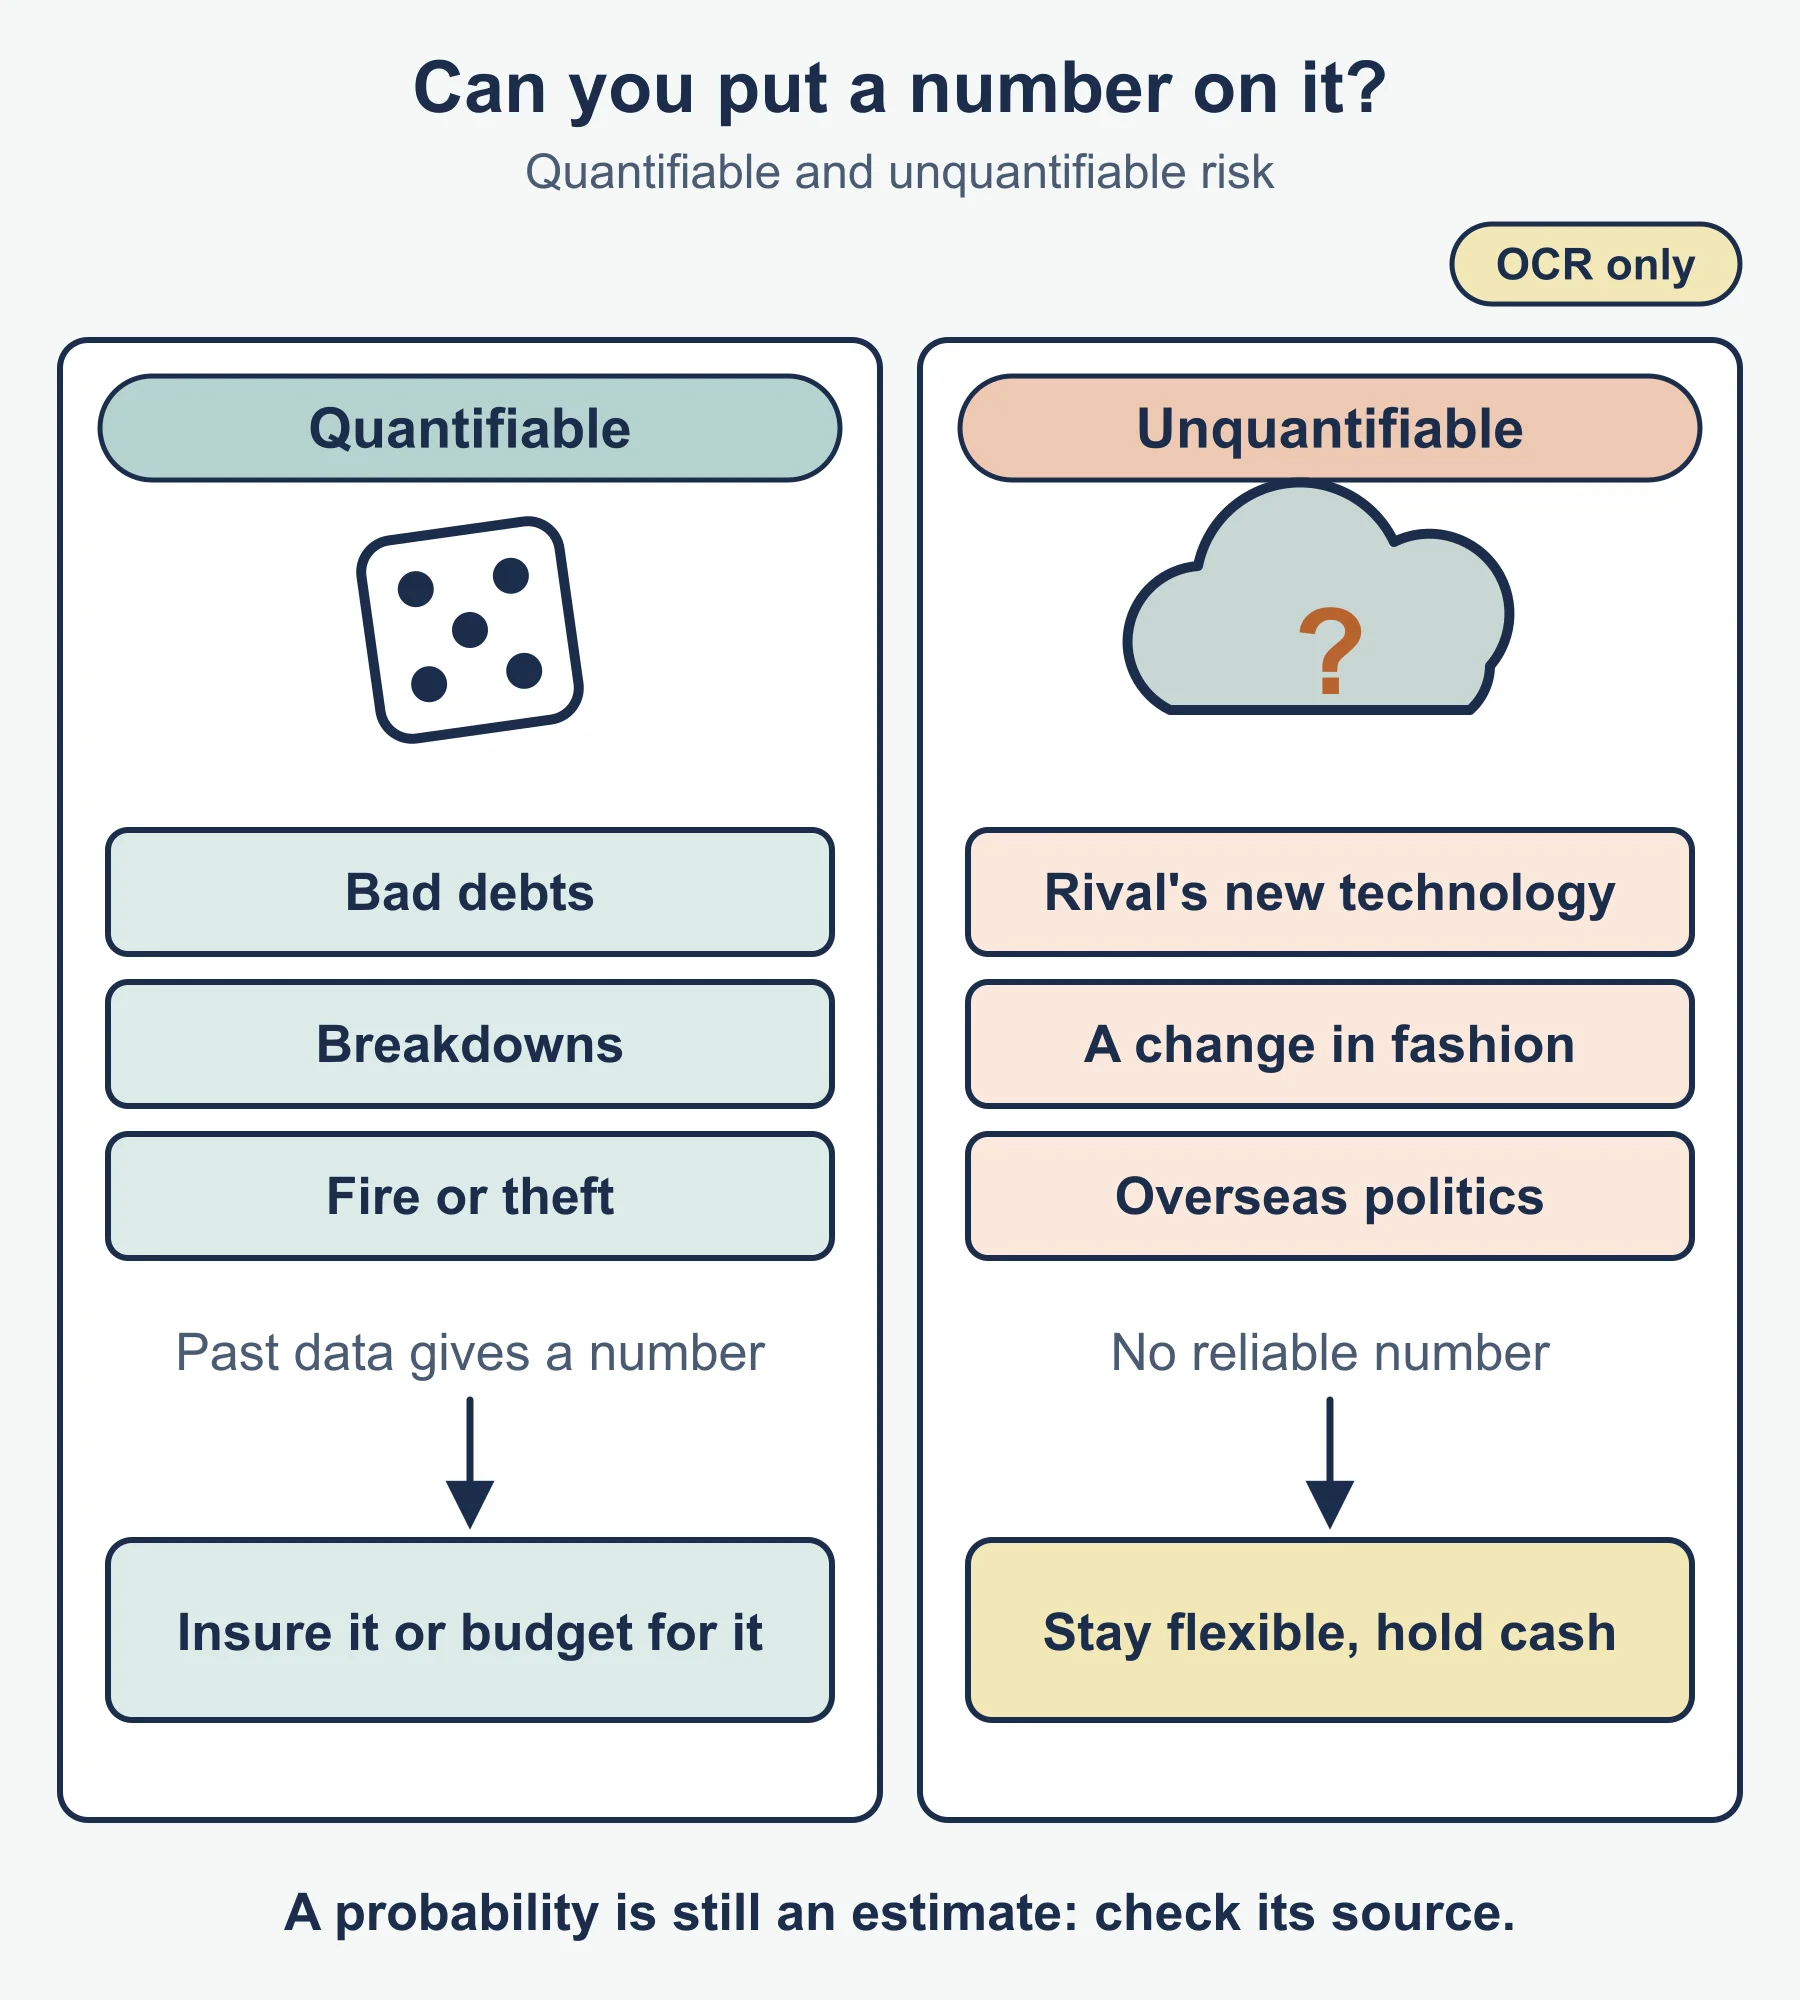
Quantifiable and unquantifiable risk
| Quantifiable | Unquantifiable | |
|---|---|---|
| Basis | Past data, records, research | Judgement, no reliable data |
| Examples | Bad debts, machine breakdowns, insured events | A rival’s new technology, a fashion shift, overseas politics |
| Tools | Expected value, insurance, provisions, budgets | Scenarios, flexibility, cash reserves, contingency plans |
| Weakness | False precision; the past may not repeat | Nothing to compare; may be ignored or cause delay |
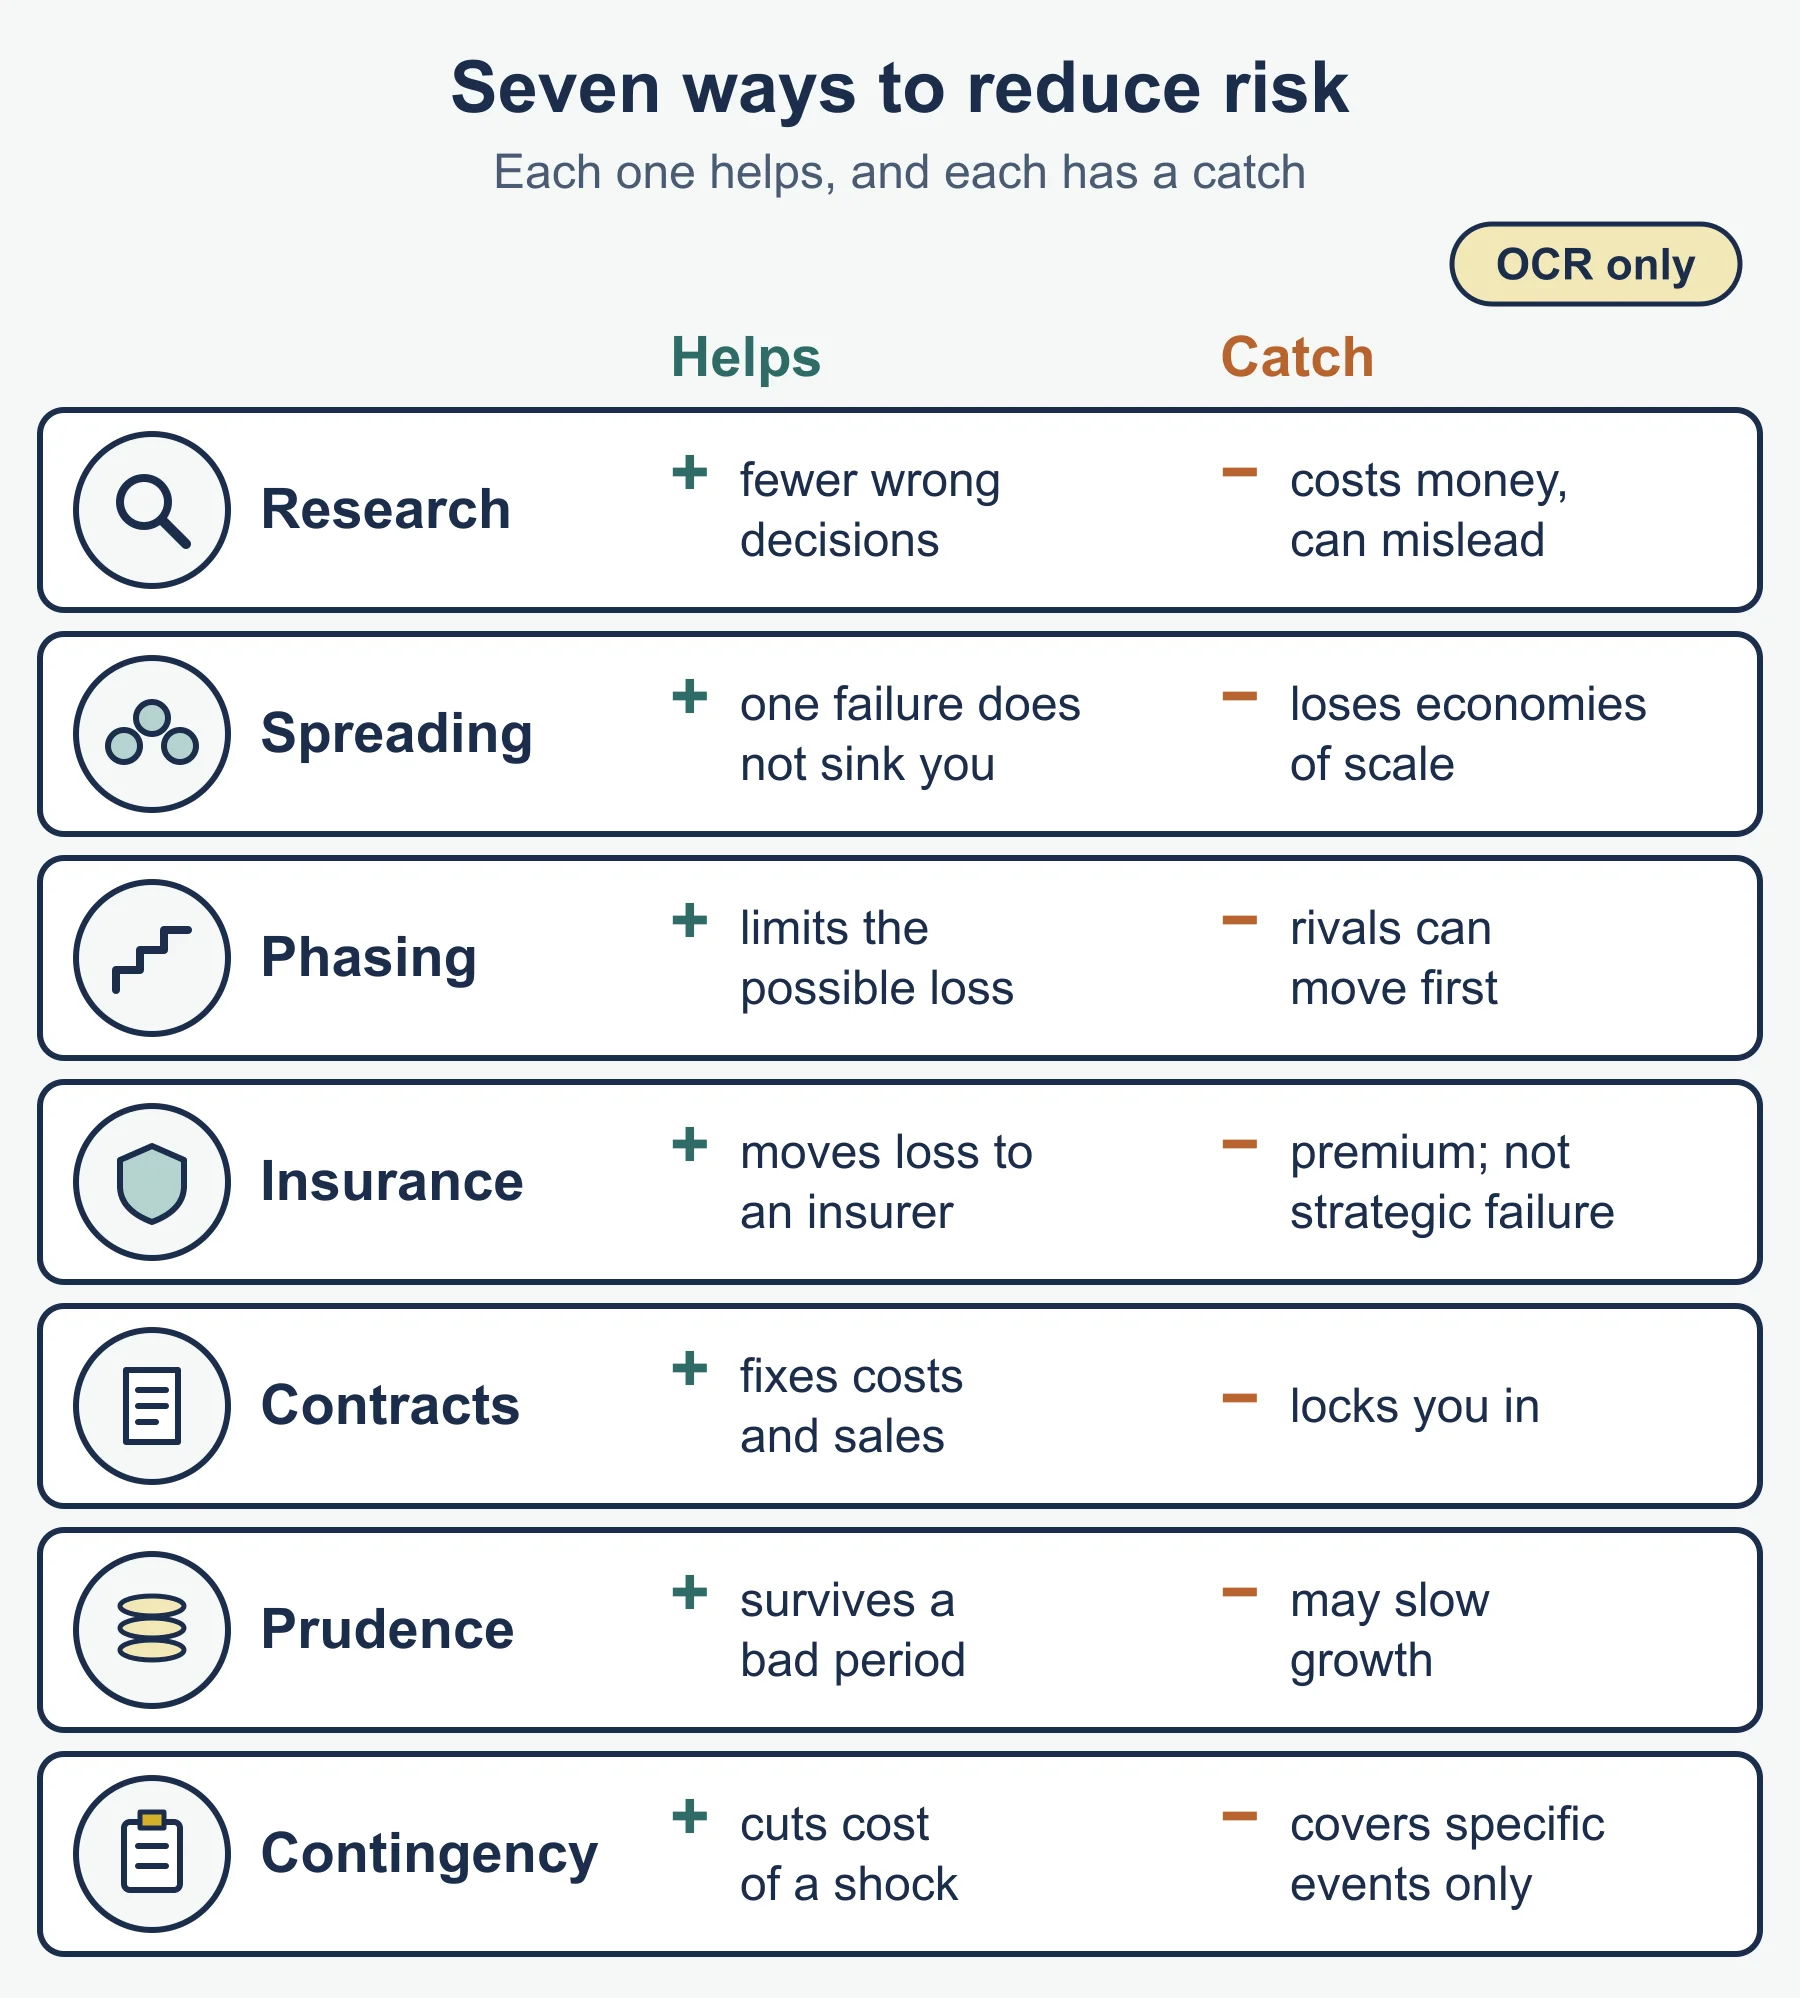
Reducing risk
| Method | Benefit | Limit |
|---|---|---|
| Research and forecasting | Fewer wrong decisions | Cost; results can mislead |
| Spreading (markets, suppliers, products) | One failure does not sink the business | Lost economies of scale; management strain |
| Phasing or piloting | Caps the possible loss | Rivals may move first |
| Insurance | Transfers insurable losses | Premium; does not cover strategic failure |
| Contracts | Fixes costs or sales | Locks the business in |
| Financial prudence | Survives a bad period | May slow growth |
| Contingency plans | Cuts the cost of a shock | Time and cost; cannot cover every event |
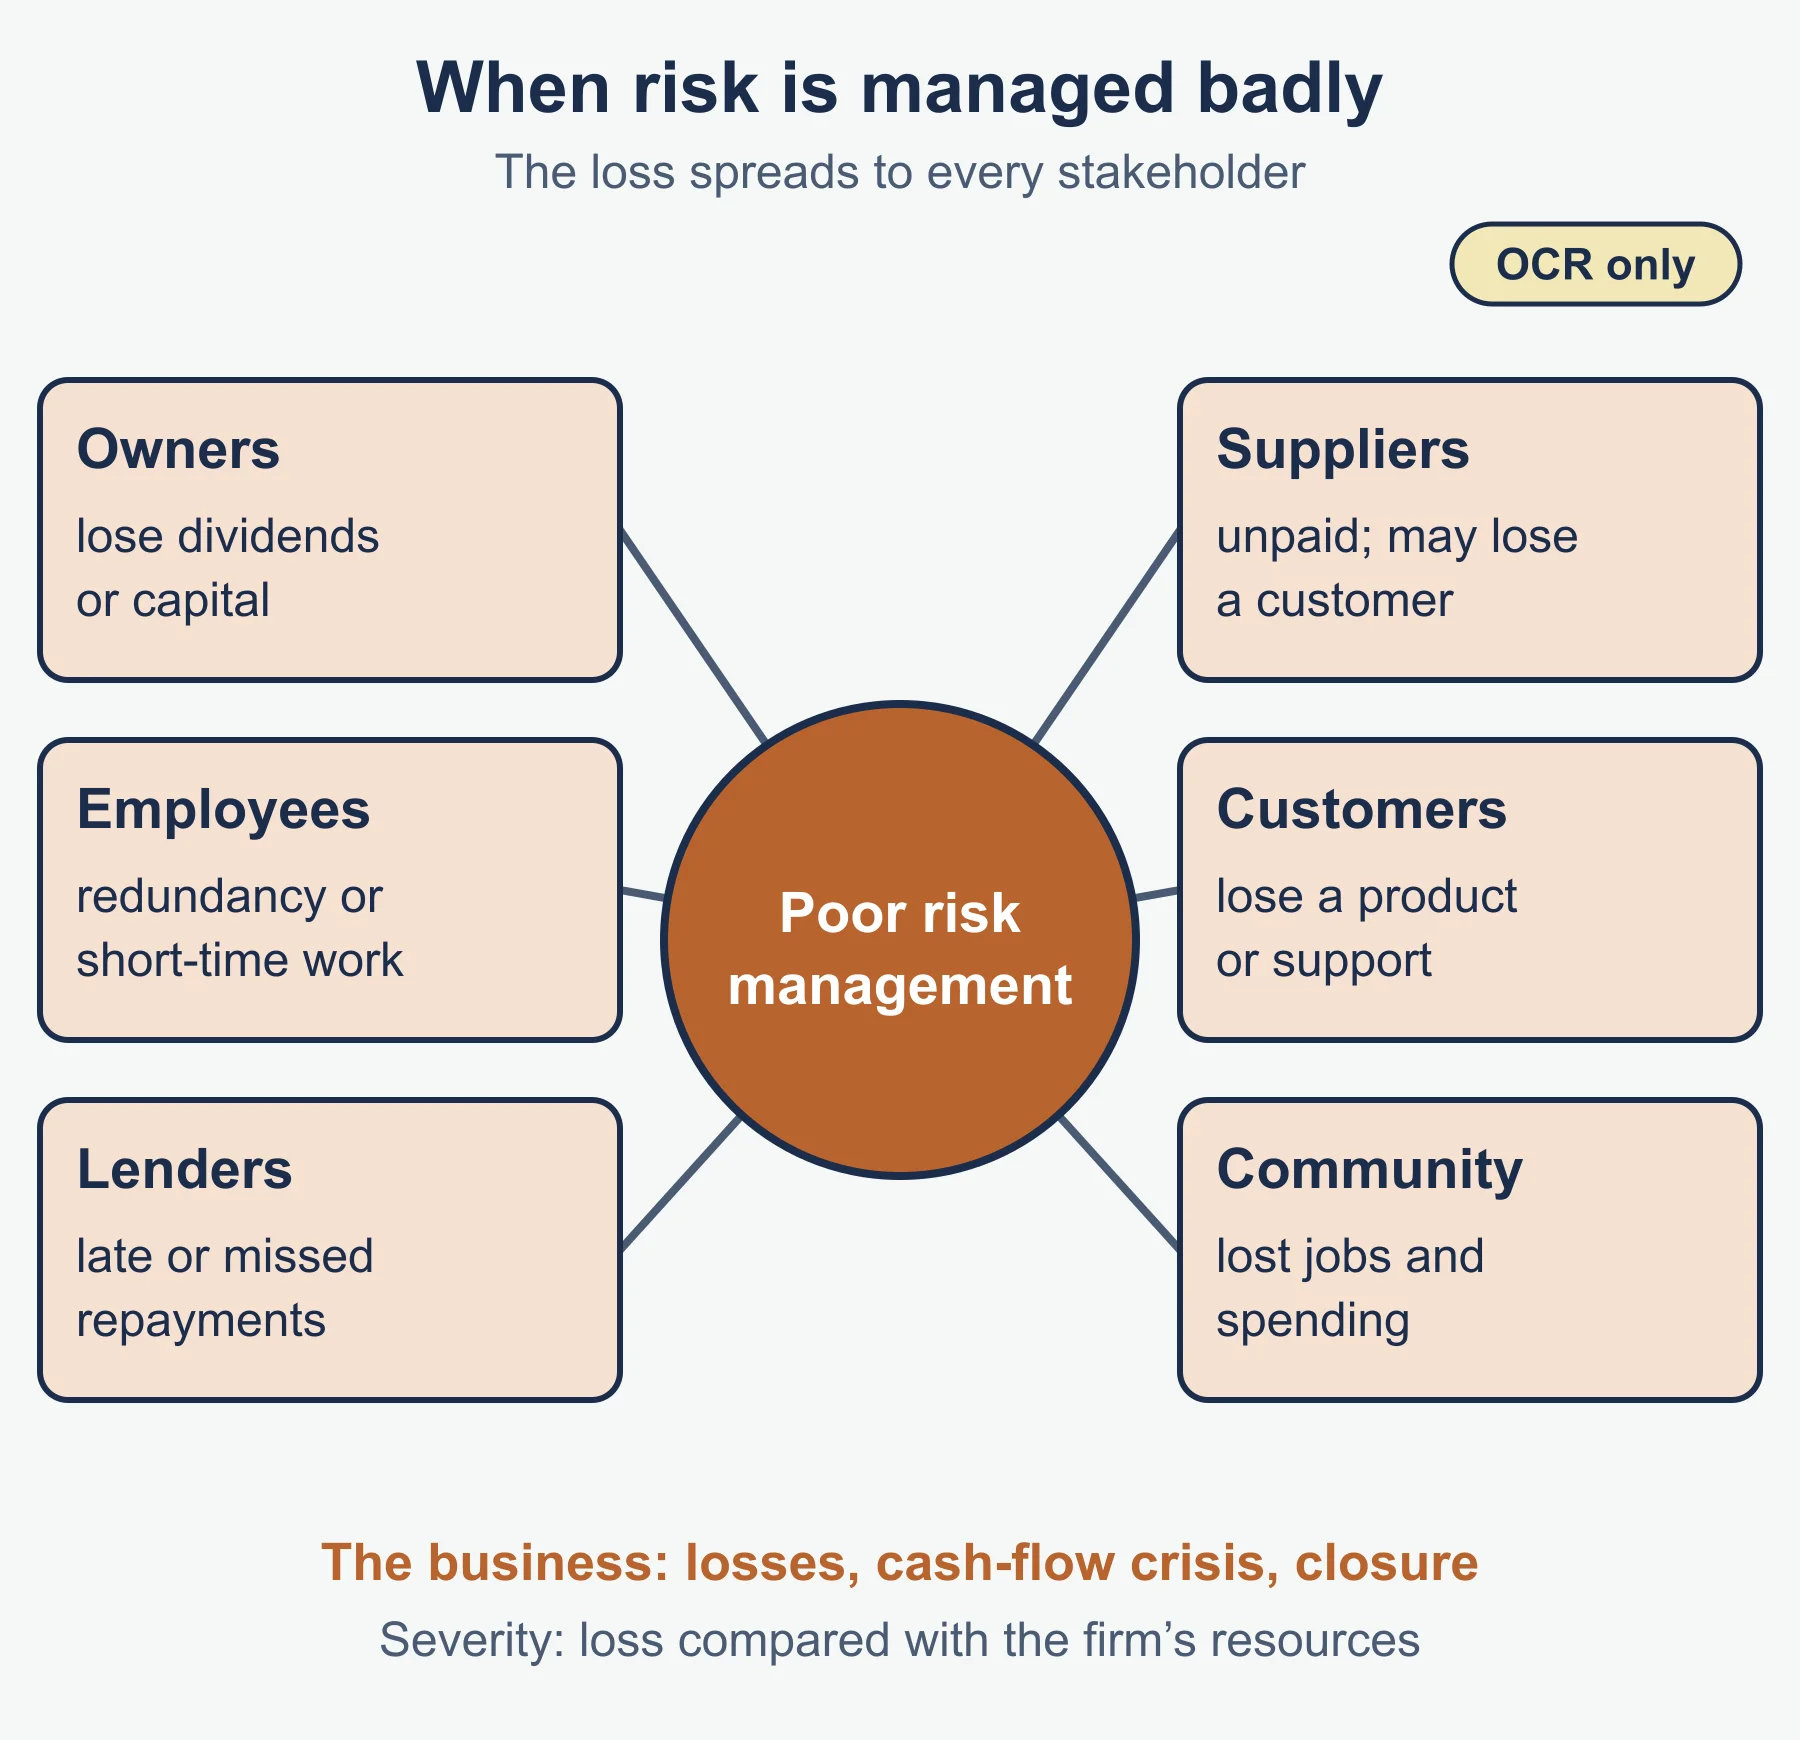
Consequences of poor risk management
- Business: losses, cash-flow crisis, lost sales, reputation damage, higher borrowing costs, closure.
- Owners and shareholders: lost dividends and capital. Employees: redundancy or short-time work. Lenders: late repayment. Suppliers: unpaid bills and lost custom. Customers: lost product or support. Community: lost jobs and spending.
- Judge severity by the loss compared with the firm’s resources.
Risks faced by an entrepreneur
- Loss of savings; personal assets at risk if liability is unlimited.
- No guaranteed income.
- Opportunity cost of the salary and security given up.
- Business failure and its effect on family and reputation.
- Weigh these against the reward and the entrepreneur’s savings, experience and support.
Uncertainty
| Internal causes | External causes |
|---|---|
| Key staff leaving | Economic change, interest and exchange rates |
| Success of a new product | Competitor action |
| Reliability of equipment | Technology and regulation |
| Accuracy of own cost estimates | Tastes, weather, politics |
Effects of uncertainty on a business:
| Area | Effect |
|---|---|
| Aims and objectives | Targets become ranges; survival may outrank growth |
| Planning | Shorter horizons, flexible budgets, scenario plans |
| Decision making | Delay, lower-risk choices, decision trees and sensitivity analysis |
| Business analysis | SWOT and PESTLE inputs may change quickly |
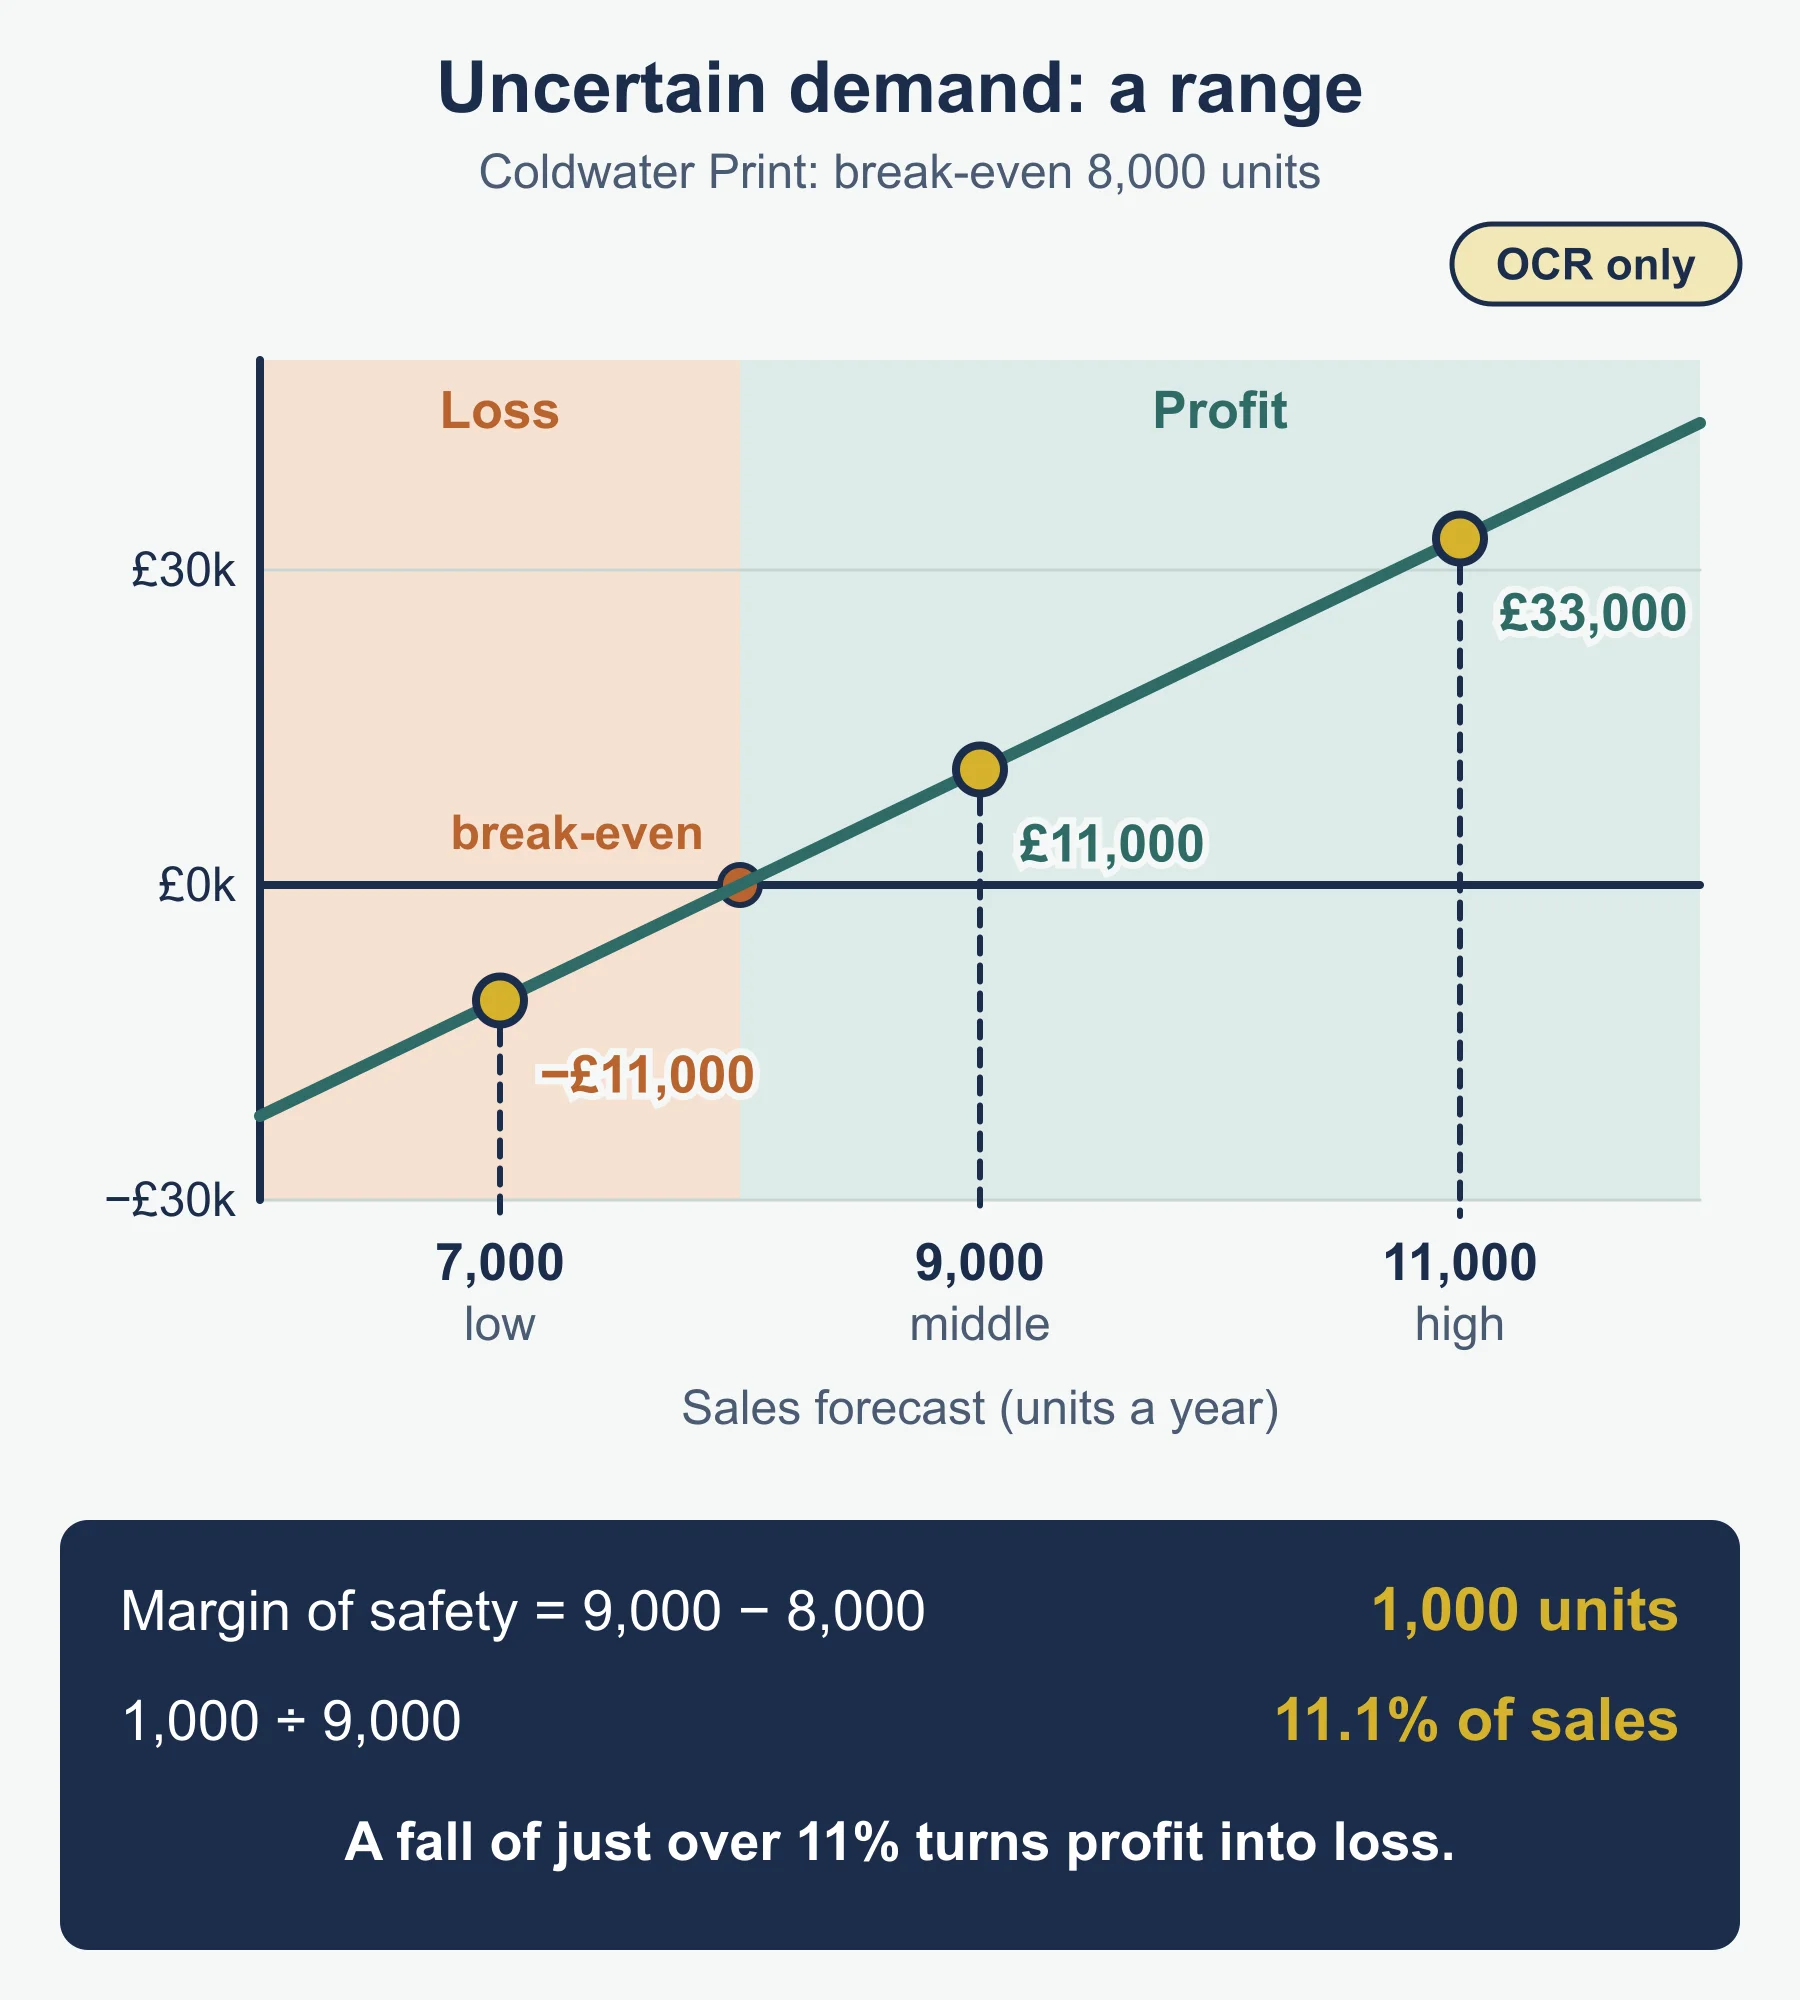
| Forecasting | Ranges and several scenarios replace single figures |
Evaluate the impact by asking how large the uncertainty is, how soon it resolves, and who bears the effect.
Opportunity cost
Method in steps
- List the realistic alternatives for the same resource.
- Value each one.
- Rank them and note which was chosen.
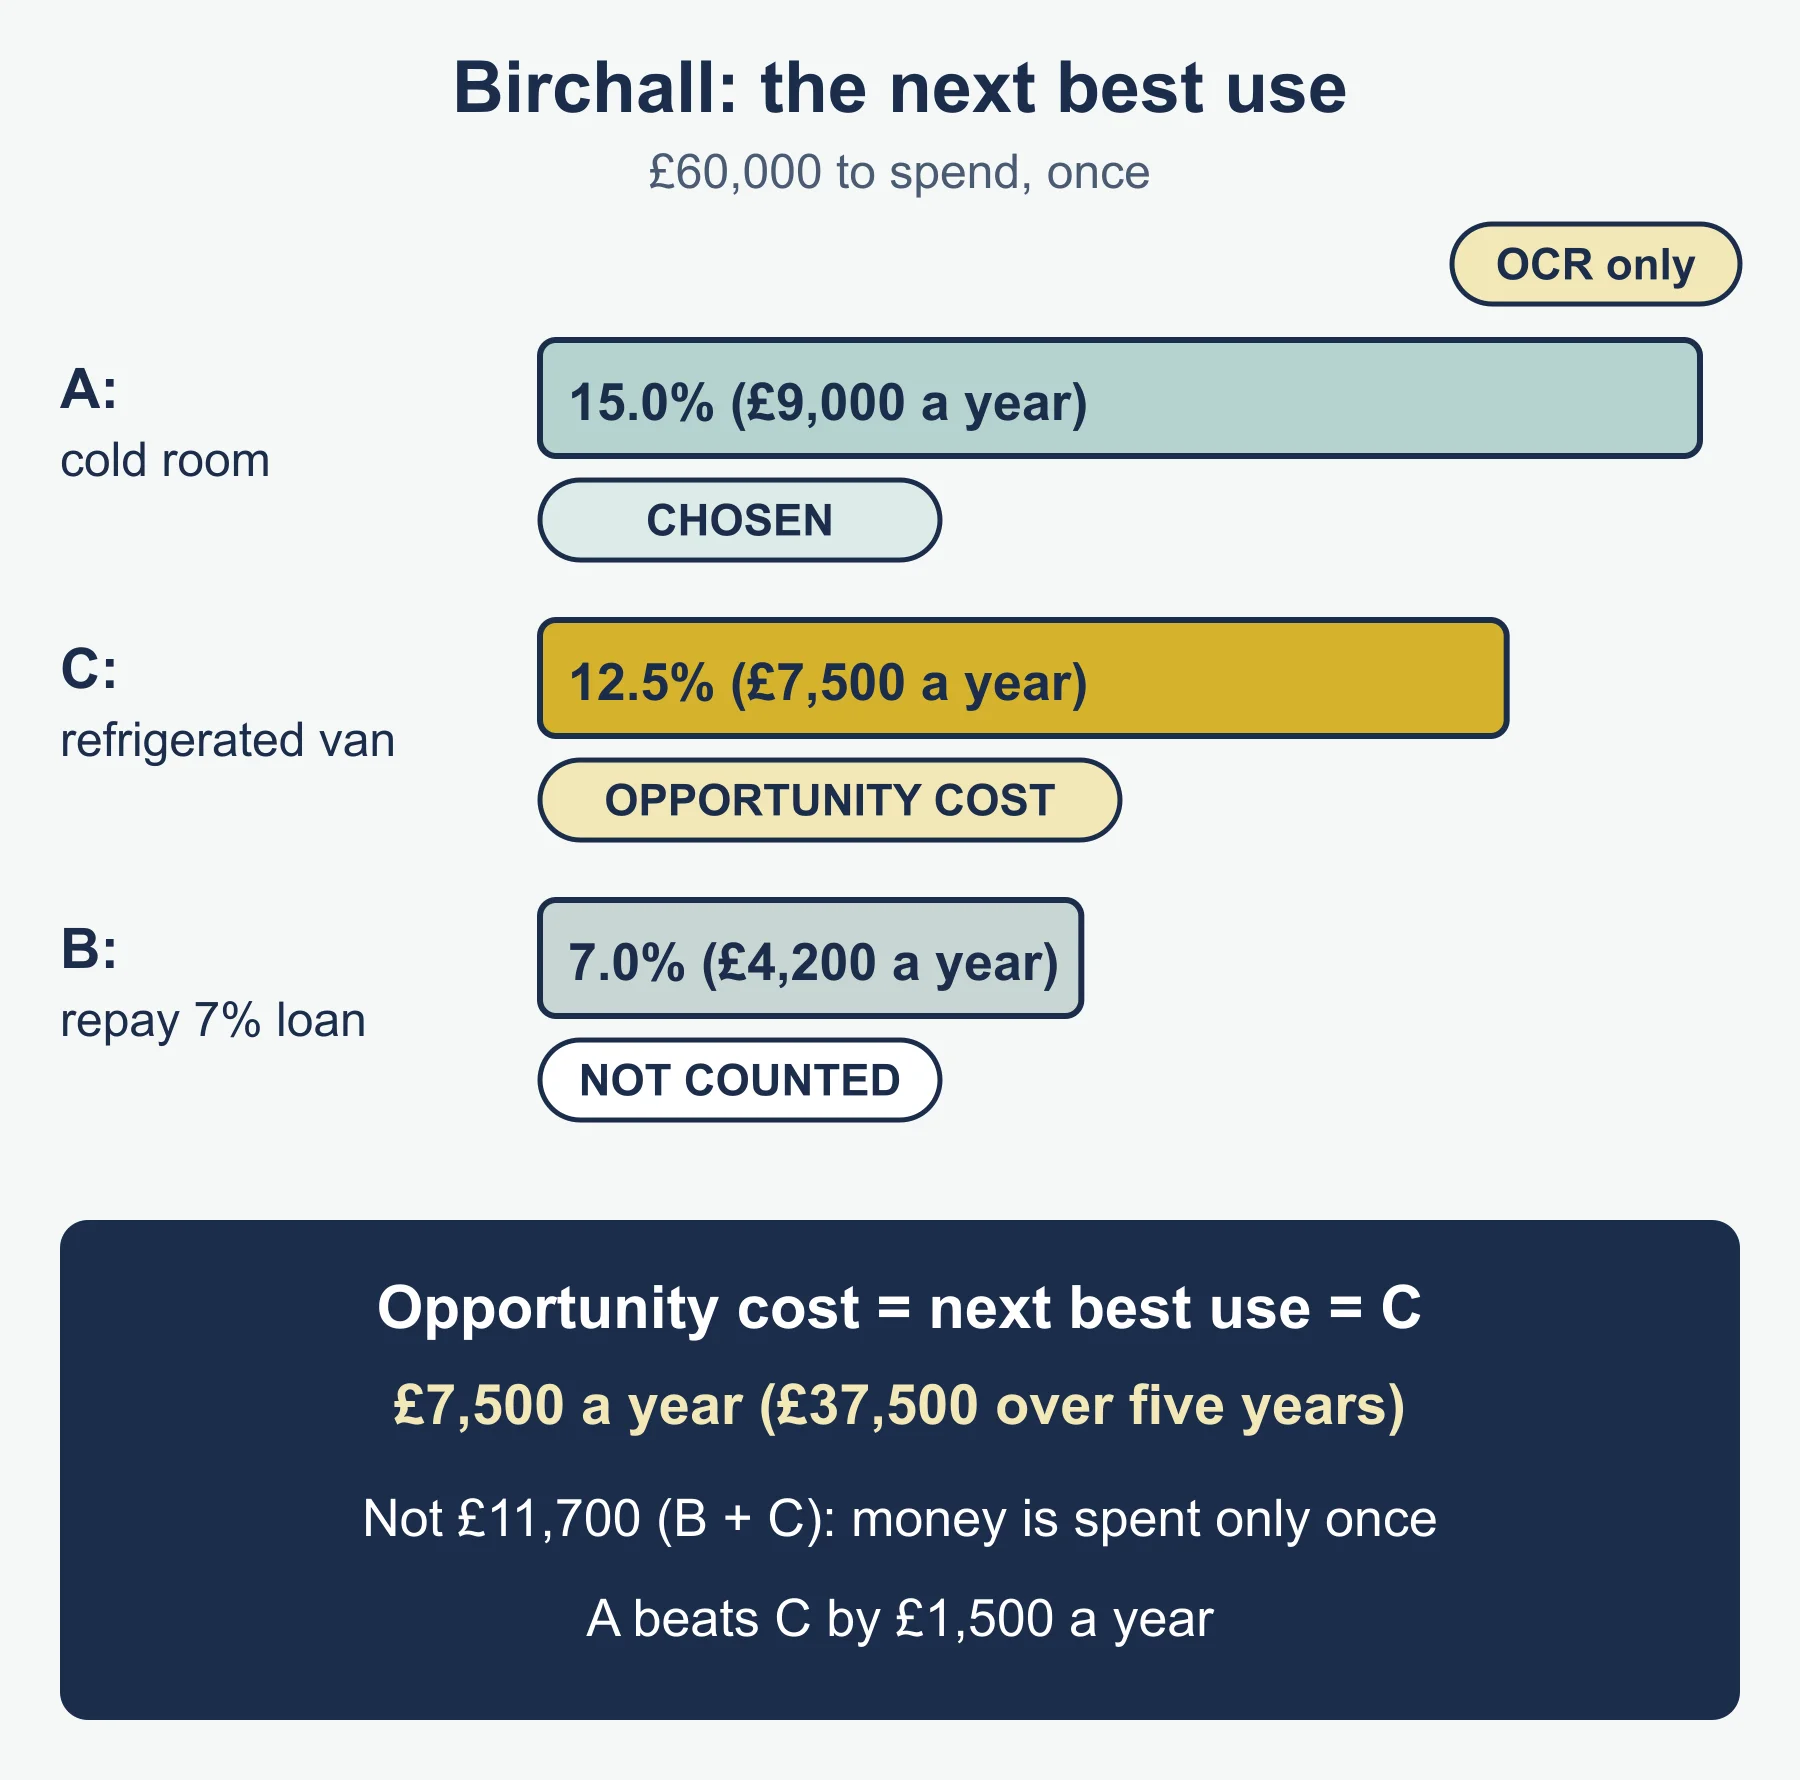
- Opportunity cost = the next best alternative only, not all those rejected.
Worked reminder: Axtell has £40,000 and chooses a kiln worth £5,200 a year (13.0%). The alternatives are staff training worth £4,600 a year (11.5%) and a deposit worth £800 (2.0%). The opportunity cost is £4,600 a year, the training. The kiln wins by £600 a year on these figures.
Impact on decision making: it forces comparison of options, shows that a positive return can still be a poor choice, applies to time as well as money, interacts with risk (the next best option may be safer), and relies on estimates.
Answering “evaluate”, “analyse” and “identify”
- Identify: name the item and give its value if the data allows. For opportunity cost, name one alternative.
- Analyse: make a point, show the cause and effect, and apply it to the business in the case. Calculations help only when you say what they show.
- Evaluate: set arguments for against arguments against, then conclude in a way that depends on the facts, such as the size of the loss compared with the firm’s resources, or the time frame.
- Explain: give the meaning, then a reason or an example drawn from the case.
Must-know distinctions
- Risk and uncertainty: risk can be measured, uncertainty cannot. Decision trees and expected value handle the first better than the second.
- Risk and reward: the pair of ideas to weigh against each other, never one alone.
- Quantifiable and unquantifiable: whether a number can be defended, not whether the risk is large.
- Internal and external causes: whether the business controls the source.
- Opportunity cost and total cost: opportunity cost is the best forgone use, not the money spent.
Quick self-test
- Define opportunity cost.
- Axtell expects a hit with probability 0.6 (+£50,000) or a flop (-£20,000). Calculate expected value.
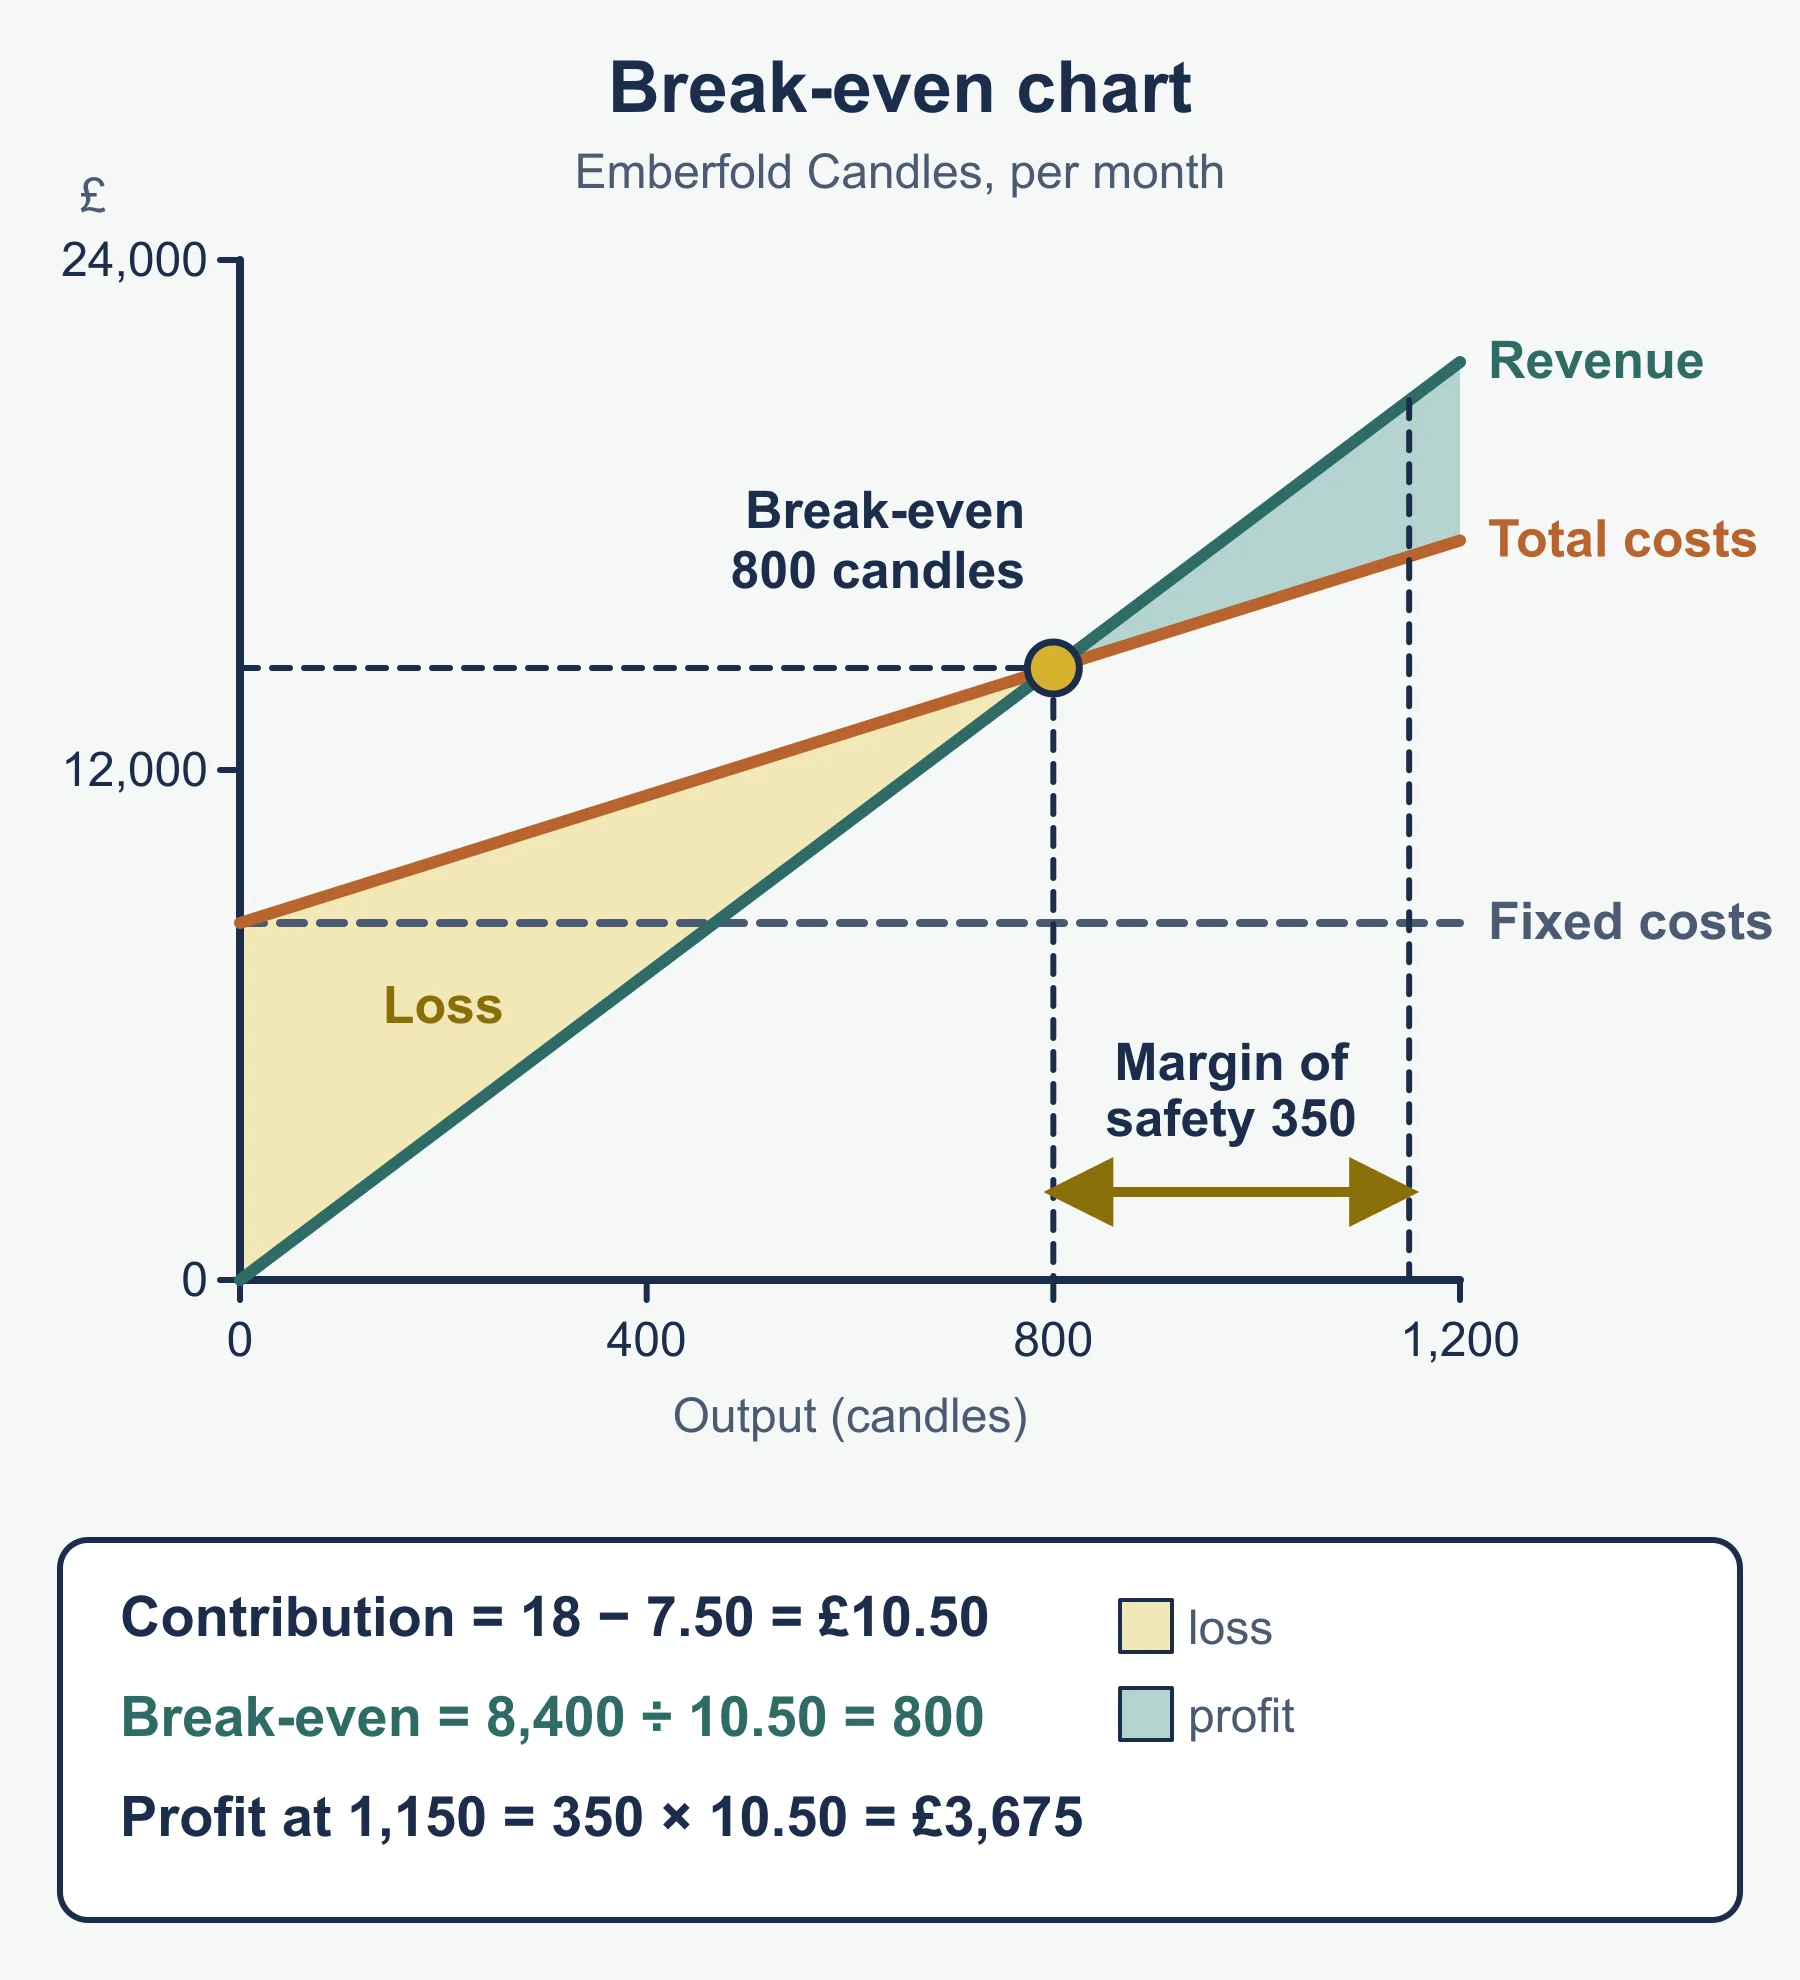
- Axtell’s unit price is £12 and variable cost is £7. Fixed costs are £30,000. Calculate break-even output, then the margin of safety as a percentage of forecast sales of 6,800 units.
- Axtell has £40,000. A kiln earns £5,200 a year, training £4,600 and a deposit £800. State the opportunity cost of choosing the kiln and the percentage return on the deposit.
- Classify as quantifiable or unquantifiable: (a) bad debts based on five years of records, (b) a new rival with unknown technology.
- Classify as internal or external: (a) a key joiner resigns, (b) interest rates rise.
- Give three ways of reducing risk.
- Name the five business activities the specification says uncertainty affects.
- Give two specific risks faced by an entrepreneur.
- Give two reasons expected value can mislead.
Answers
- What the second-best use of the same resources was worth, lost by choosing another use.
- 0.6 × 50,000 = 30,000; 0.4 × -20,000 = -8,000; total £22,000.
- Contribution = 12 - 7 = £5; break-even = 30,000 ÷ 5 = 6,000 units. Margin of safety = 6,800 - 6,000 = 800 units, so 800 ÷ 6,800 = 11.8% (to 1 decimal place).
- £4,600 a year (training, the next best). Deposit return = 800 ÷ 40,000 = 2.0%.
- (a) Quantifiable. (b) Unquantifiable.
- (a) Internal. (b) External.
- Any three: research, spreading, phasing or piloting, insurance, contracts, financial prudence, contingency planning.
- Aims and objectives, planning, decision making, business analysis, forecasting.
- Any two: loss of savings, no guaranteed income, opportunity cost of salary given up, business failure.
- Probabilities are estimates; it is an average, not a likely single result; it ignores non-financial effects and the size of the worst case.
Where marks are usually lost
- Equating opportunity cost with the sum spent, or with every option rejected.
- Using the same example for risk and for uncertainty without showing the difference.
- Stating that risk and reward rise together without evaluating whether the reward is worth it.
- Calculating expected value and stopping, with no comment on reliability or the worst case.
- Naming stakeholders without saying how each is affected by poor risk management.
- Listing ways to reduce risk without judging which suits this business.
- Mixing up internal and external causes of uncertainty.
- Writing generic points on uncertainty that are not tied to the business in the case.
- Giving a final judgement that restates the points without weighing them.
Frequently asked questions
What is the difference between risk and uncertainty? Risk can be measured, for example with probabilities from past data, while uncertainty cannot be given reliable probabilities. Decision trees and expected value handle risk, but uncertainty is managed through flexibility, scenario planning and cash reserves.
How does uncertainty affect business objectives? Under uncertainty, targets may become unrealistic or need to be set as ranges, and survival may take priority over growth. Planning and investment decisions may also be delayed until the situation is clearer.
Does a higher reward always mean a higher risk? Higher potential reward usually goes with higher risk, but this is a tendency rather than a rule. An evaluation should ask whether the extra reward justifies the extra risk and whether the business could survive the worst outcome.
Official syllabus
Source: OCR, Advanced GCE in Business (H431), Version 2.1, January 2026, for first assessment in 2017 with final assessment in summer 2027, area of study Business objectives and strategy, the Risk and uncertainty and Opportunity cost content (numbered 1.7 and 1.8 on this site, not in the specification).
Get free revision emails (optional)
Occasional emails with practice questions, worked explanations and links to free resources for the qualification and subjects you choose. No spam, and you can unsubscribe from any email. The free tools on this site never need an email.
Related resources
-
Study guides
OCR A Level Business: Strategy and implementation and Business plan (H431)
Study guide to strategy, implementation, business plans, Plan-Do-Review and strategic review for OCR A Level Business H431, with worked examples.
Business · OCR · A Level
Read guide -
Practice questions
OCR A Level Business: Strategy and implementation and Business plan (H431) – Practice Questions
Twelve original questions with worked answers on strategy, implementation, business plans, Plan-Do-Review and strategic review for OCR A Level Business.
Business · OCR · A Level
Try questions -
Revision notes
OCR A Level Business: Strategy and implementation and Business plan (H431) – Revision Notes
Condensed revision notes on strategy, implementation, the business plan, Plan-Do-Review and strategic review for OCR A Level Business H431.
Business · OCR · A Level
Revise topic
Related articles
-
teaching
A Level tuition in Dubai: Cambridge or Pearson Edexcel International A Level?
Schools in Dubai and Abu Dhabi teach either Cambridge International AS & A Level or Pearson Edexcel International A Level. How the two are structured, why it matters for tuition, and how online classes from Lahore work.
9 October 2026
-
curriculum guides
Choosing subjects at IGCSE and A Level
How subject choices at 14 and 16 affect university options later, and how to keep pathways open without overloading a timetable.
28 July 2026
Studying this with a teacher
Working through Business A LEVELS?
This page is free and stays free. If you would rather be taught it, Marlbridge runs Business classes one-to-one, online in your own time zone. One-to-one only for this course: Rs 6,000 per class in Pakistan, with other currencies on the fees page. The first trial class is free. WhatsApp replies within an hour (8am–11pm Pakistan time, every day); email the same day.
OCR Business teachers at Marlbridge
