
Study Guides
OCR GCSE Business: Finance (J204)
Study guide to Finance in OCR GCSE (9-1) Business J204: sources of finance, profit, ratios, ARR, break-even and cash flow forecasts, with worked examples.
- Subject
- Business
- Level
- GCSE
- Topic
- Operations, finance and influences on business
- Author
- Marlbridge Academic Team
- Updated
- Reviewed by
- Salman Ahmad (what this means)
Aligned to OCR GCSE Business (J204), Version 2.0 (January 2026), for first assessment in 2019. Official specification .
Syllabus page (what it covers and how it is assessed): OCR GCSE Business.
Syllabus points this page covers
J204
- 5 Finance
Found an error? Report a correction.
Need help with this topic? Request a free trial class for GCSE Business (J204).
This guide covers section 5, Finance, of the OCR GCSE (9-1) Business (J204) specification, Version 2.0 (January 2026): topics 5.1 to 5.5. Finance sits in Business 2: operations, finance and influences on business (J204/02). The specification says at least 10% of the total marks for the qualification reward quantitative skills, so the calculations below matter. Work through each example with a calculator and cover the answer before you read it.
Related pages: the revision notes and practice questions for this topic, the wider Business 2 study guide, the Business 2 revision notes and the Business 2 practice set. Course hub: OCR GCSE Business. Tick things off on the checklist. To find weak spots first, try the free diagnostics.
What the topic covers
| Ref | Content |
|---|---|
| 5.1 | The role of the finance function: its purpose and its influence on business activity |
| 5.2 | Sources of finance: why businesses need it, ways of raising it, and which suits new or established businesses |
| 5.3 | Revenue, costs, profit and loss; fixed, variable and total costs; gross and net profit; gross and net profit margin; average rate of return |
| 5.4 | Break-even: the concept, simple calculation of break-even quantity, usefulness |
| 5.5 | Cash and cash flow: importance of cash, cash versus profit, cash flow forecasts and completing them |
5.1 The role of the finance function
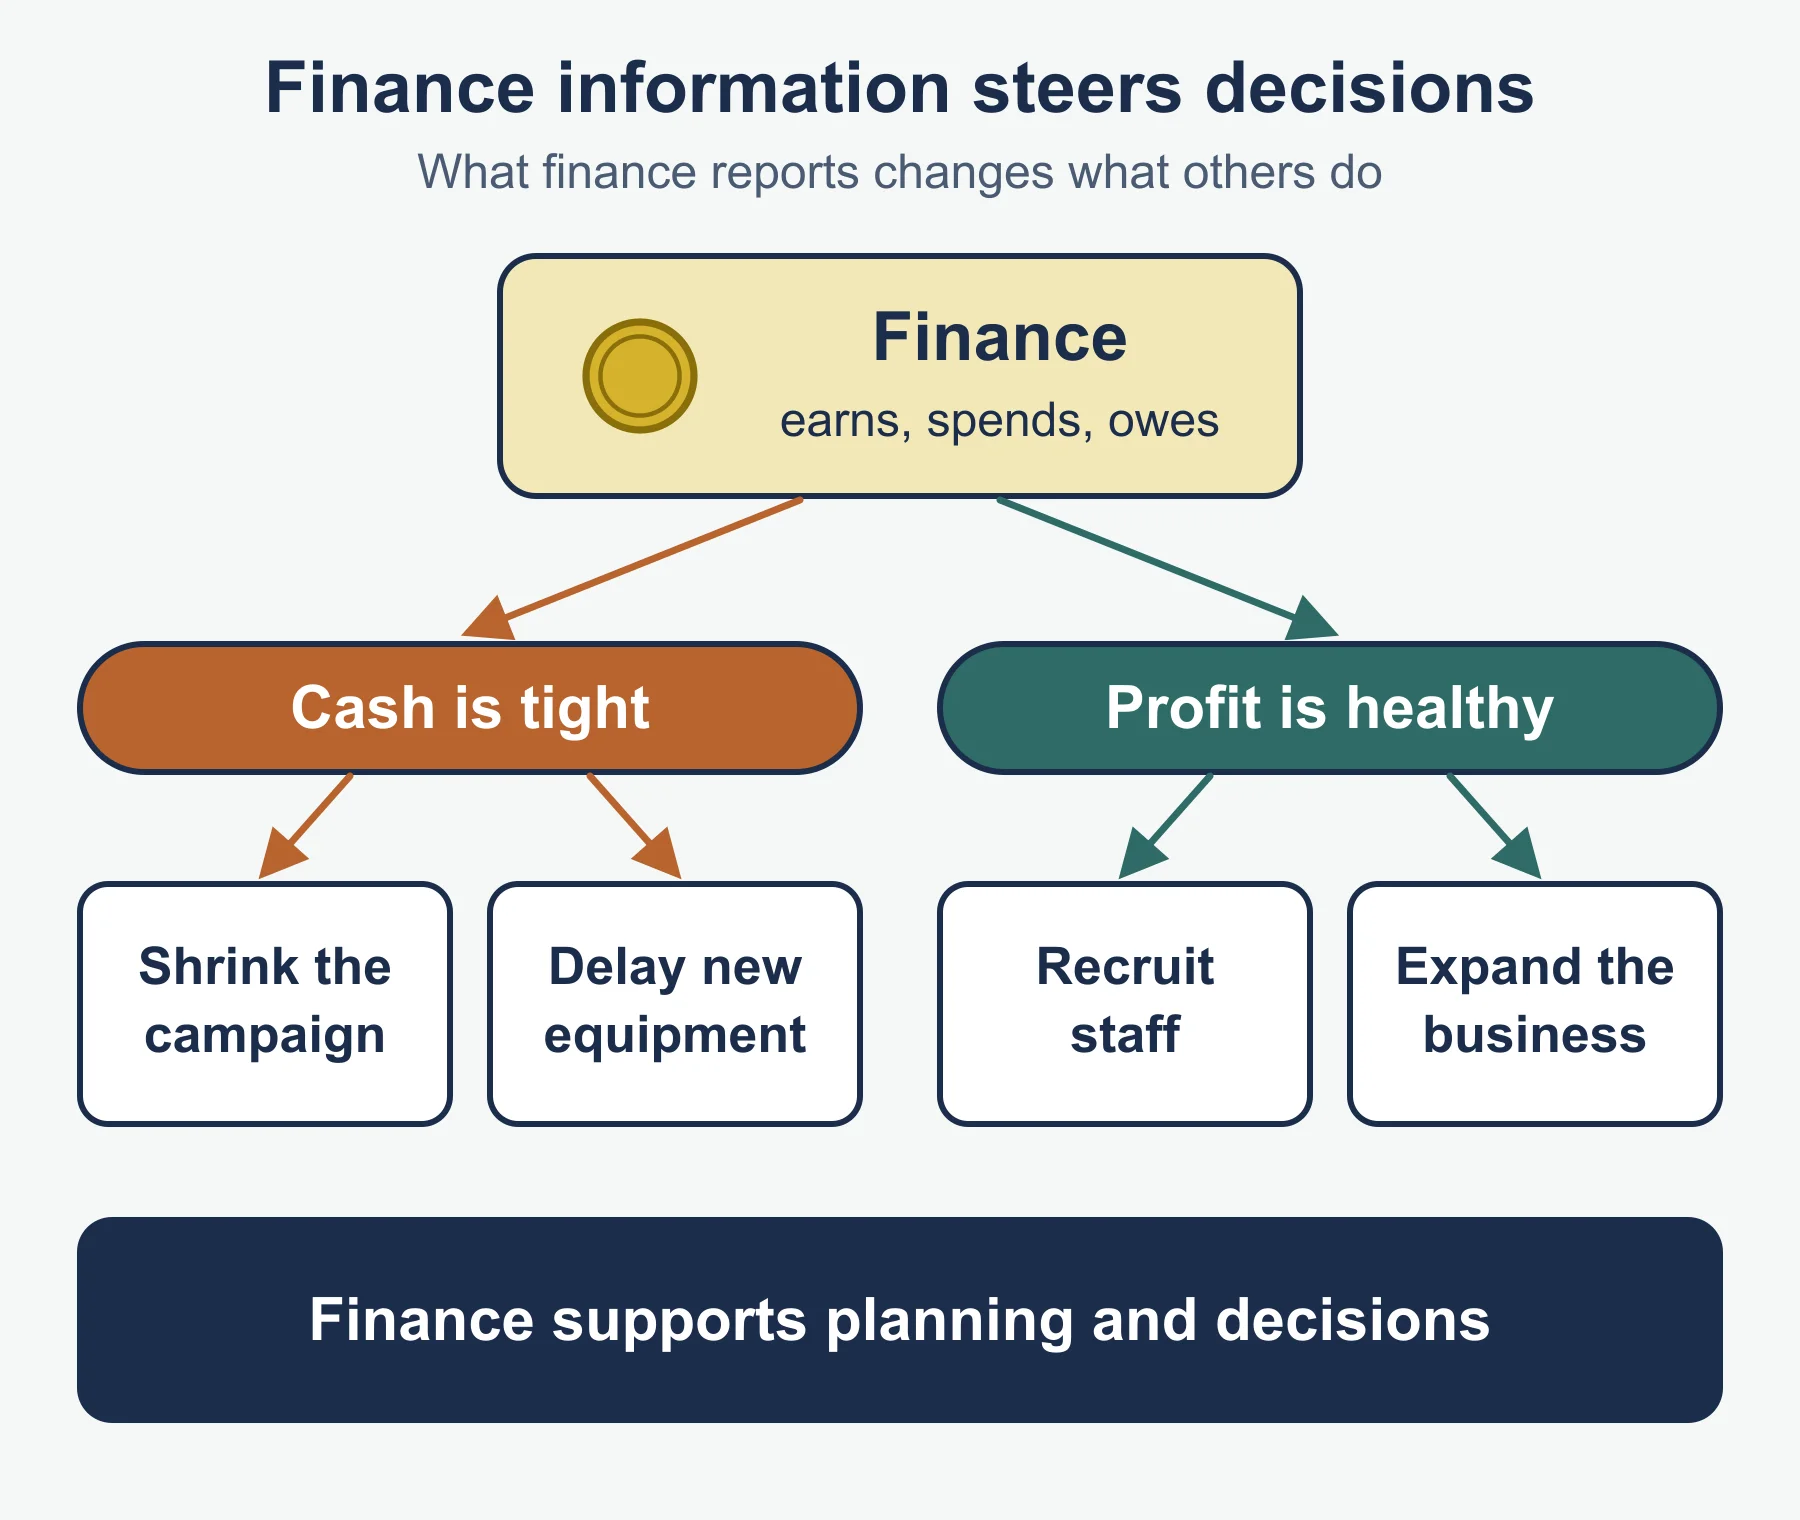
The finance function is the part of a business that handles its money. Its purpose is to provide financial information and to support business planning and decision making. Managers cannot decide sensibly about hiring, buying equipment or launching a product without knowing what the business earns, spends and owes.
Its influence on business activity shows in the decisions it shapes. If finance reports that cash is tight, marketing may have to shrink a campaign and operations may delay new equipment. If it reports healthy profit, the business may recruit or expand. Finance does not work alone: its figures affect every other function, and their needs shape what finance has to report.
5.2 Sources of finance
Why businesses need finance
The specification lists these reasons: establishing a new business, funding expansion, to run the business, recruitment and marketing. Each is a different kind of need. Start-up money buys premises and stock before any sales arrive. Expansion money pays for a bigger workshop or a second shop. Running money covers wages and bills while customers have not yet paid. Recruitment costs cover advertising, training and wages for new staff. Marketing needs money before it brings in sales.
Ways of raising finance
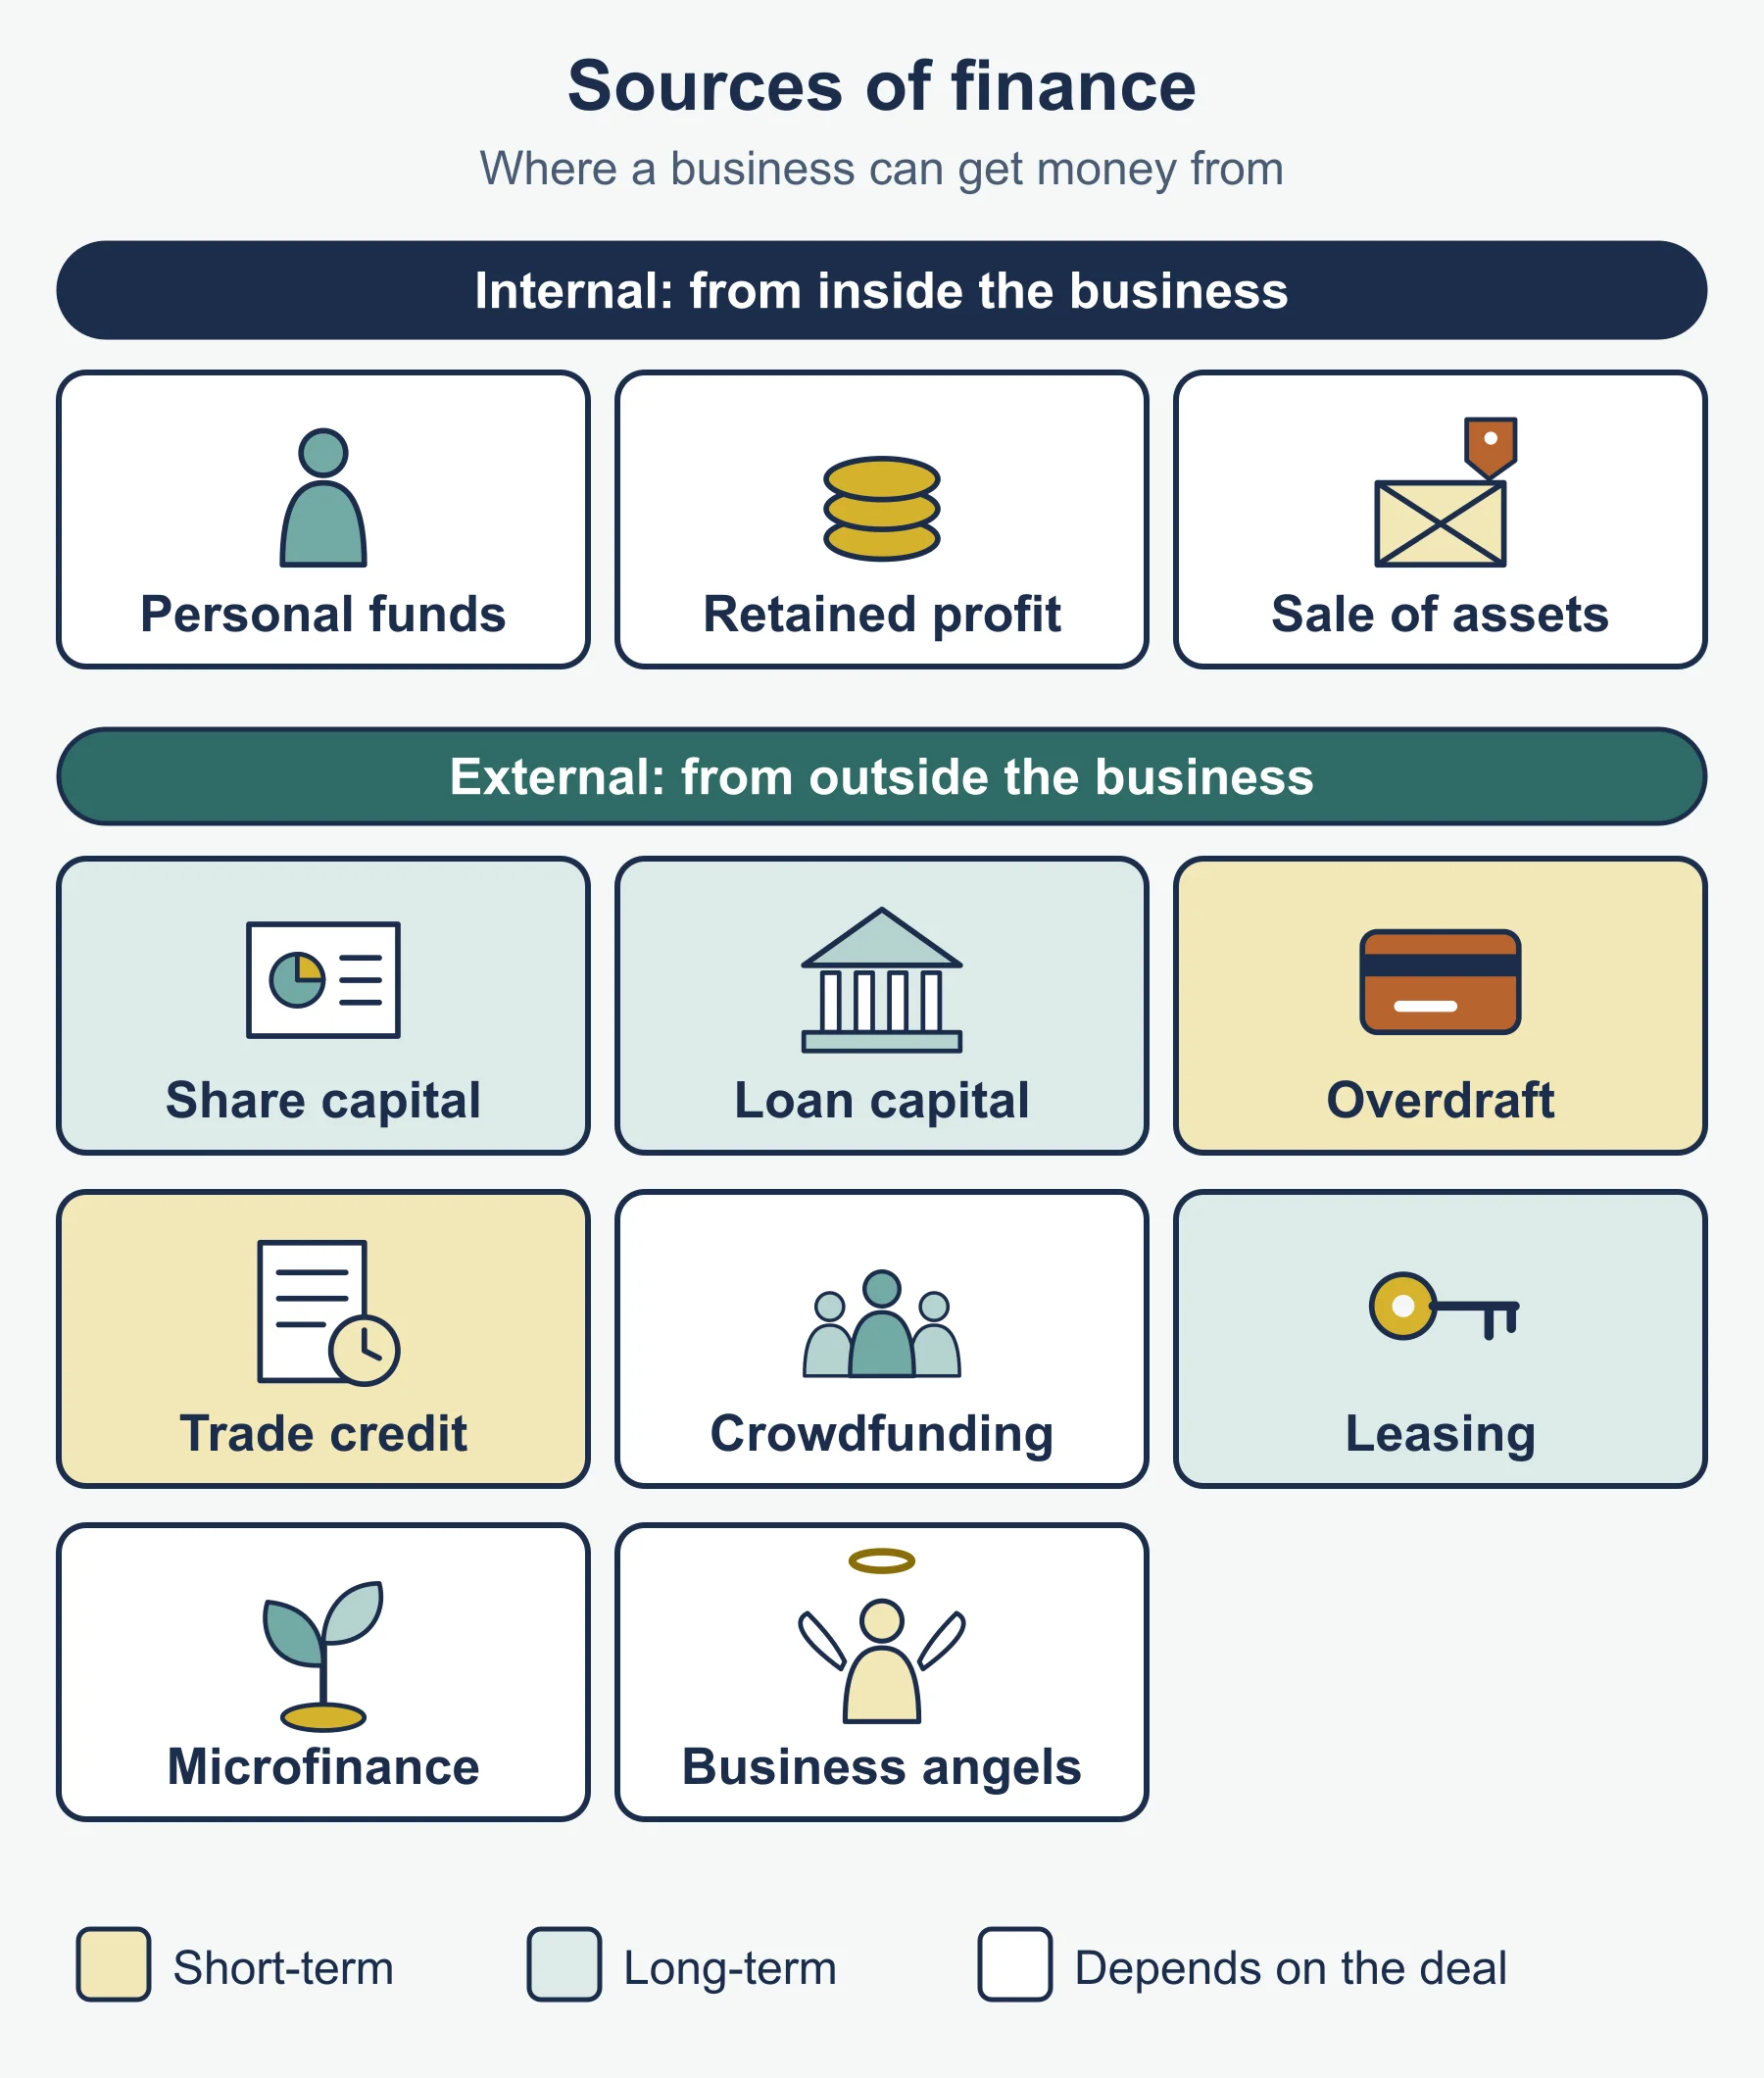
| Source | What it is | Points to weigh |
|---|---|---|
| Loan | A sum borrowed and repaid, with interest, over an agreed period | Large sums for long-term needs; repayments and interest must be met |
| Overdraft | Spending more than is in the bank account, up to an agreed limit | Flexible and quick for short-term gaps; usually costly if used for long |
| Trade credit | Receiving goods or services now and paying the supplier later | No borrowing as such; delays cash leaving, but depends on supplier agreement |
| Retained profit | Profit kept in the business rather than paid out | No interest and no outsiders; only possible once the business has made profit |
| Sale of assets | Selling items the business owns, such as a van or machine | Raises cash without borrowing; the asset is lost |
| Owners’ capital | Money the owner puts in from personal savings | Quick, no interest; limited by what the owner has and puts personal money at risk |
| New partner | A new part-owner joins and brings money | Extra funds and skills; ownership and decisions are shared |
| Share issue | A company sells shares to investors | Can raise large sums; ownership is spread (in general, a route for companies) |
| Crowdfunding | Many people each put in a small amount, often online | Suits ideas that appeal to the public; needs a convincing pitch and may not reach its target |
Suitability: new and established businesses
A new business has no profit history, so retained profit is not available and lenders may hesitate. It tends to rely on owners’ capital, family and friends, crowdfunding or a small loan. An established business has trading records, assets and retained profit, so it can borrow more easily, use retained profit, sell spare assets or, if a company, issue shares.
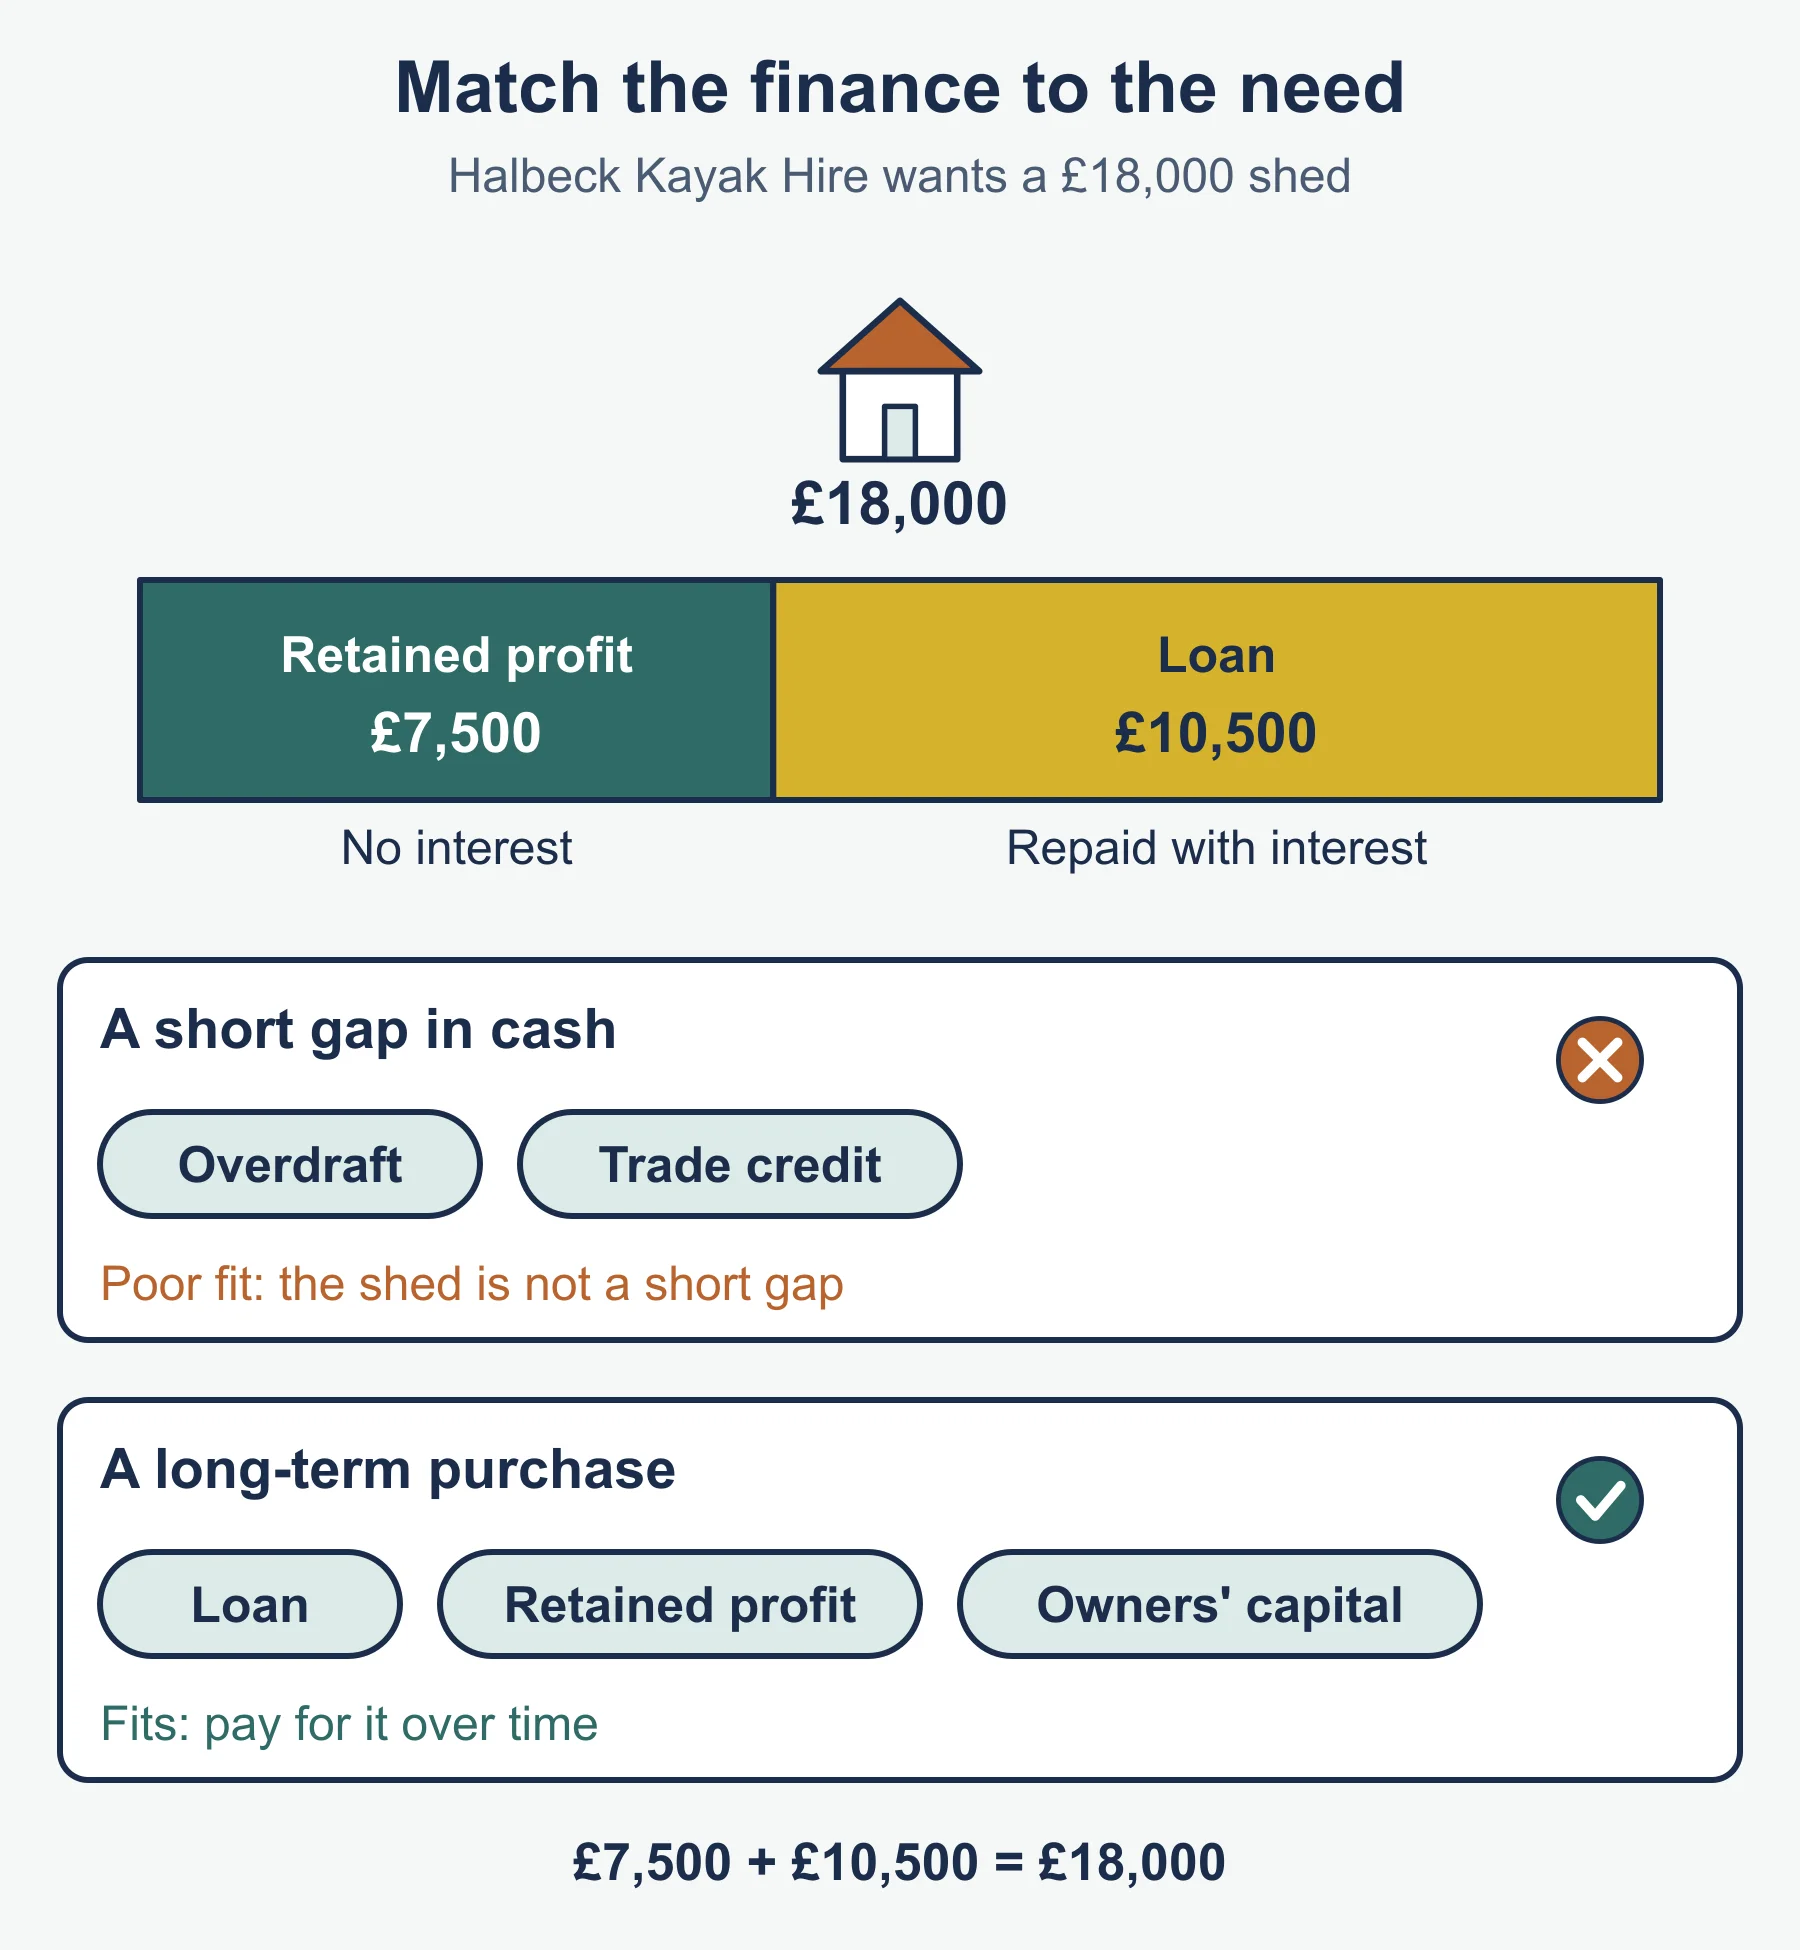
Match the source to the need and the time span. Short gaps in cash suit an overdraft or trade credit. Long-term purchases suit a loan, retained profit or capital.
Example. Halbeck Kayak Hire has traded for six years. It wants a new storage shed costing £18,000 and has £7,500 of retained profit. Retained profit covers part of the cost without interest. A loan could cover the remaining £10,500. An overdraft would be a poor fit because the need is long-term, not a short gap.
5.3 Revenue, costs, profit and loss
Revenue and costs
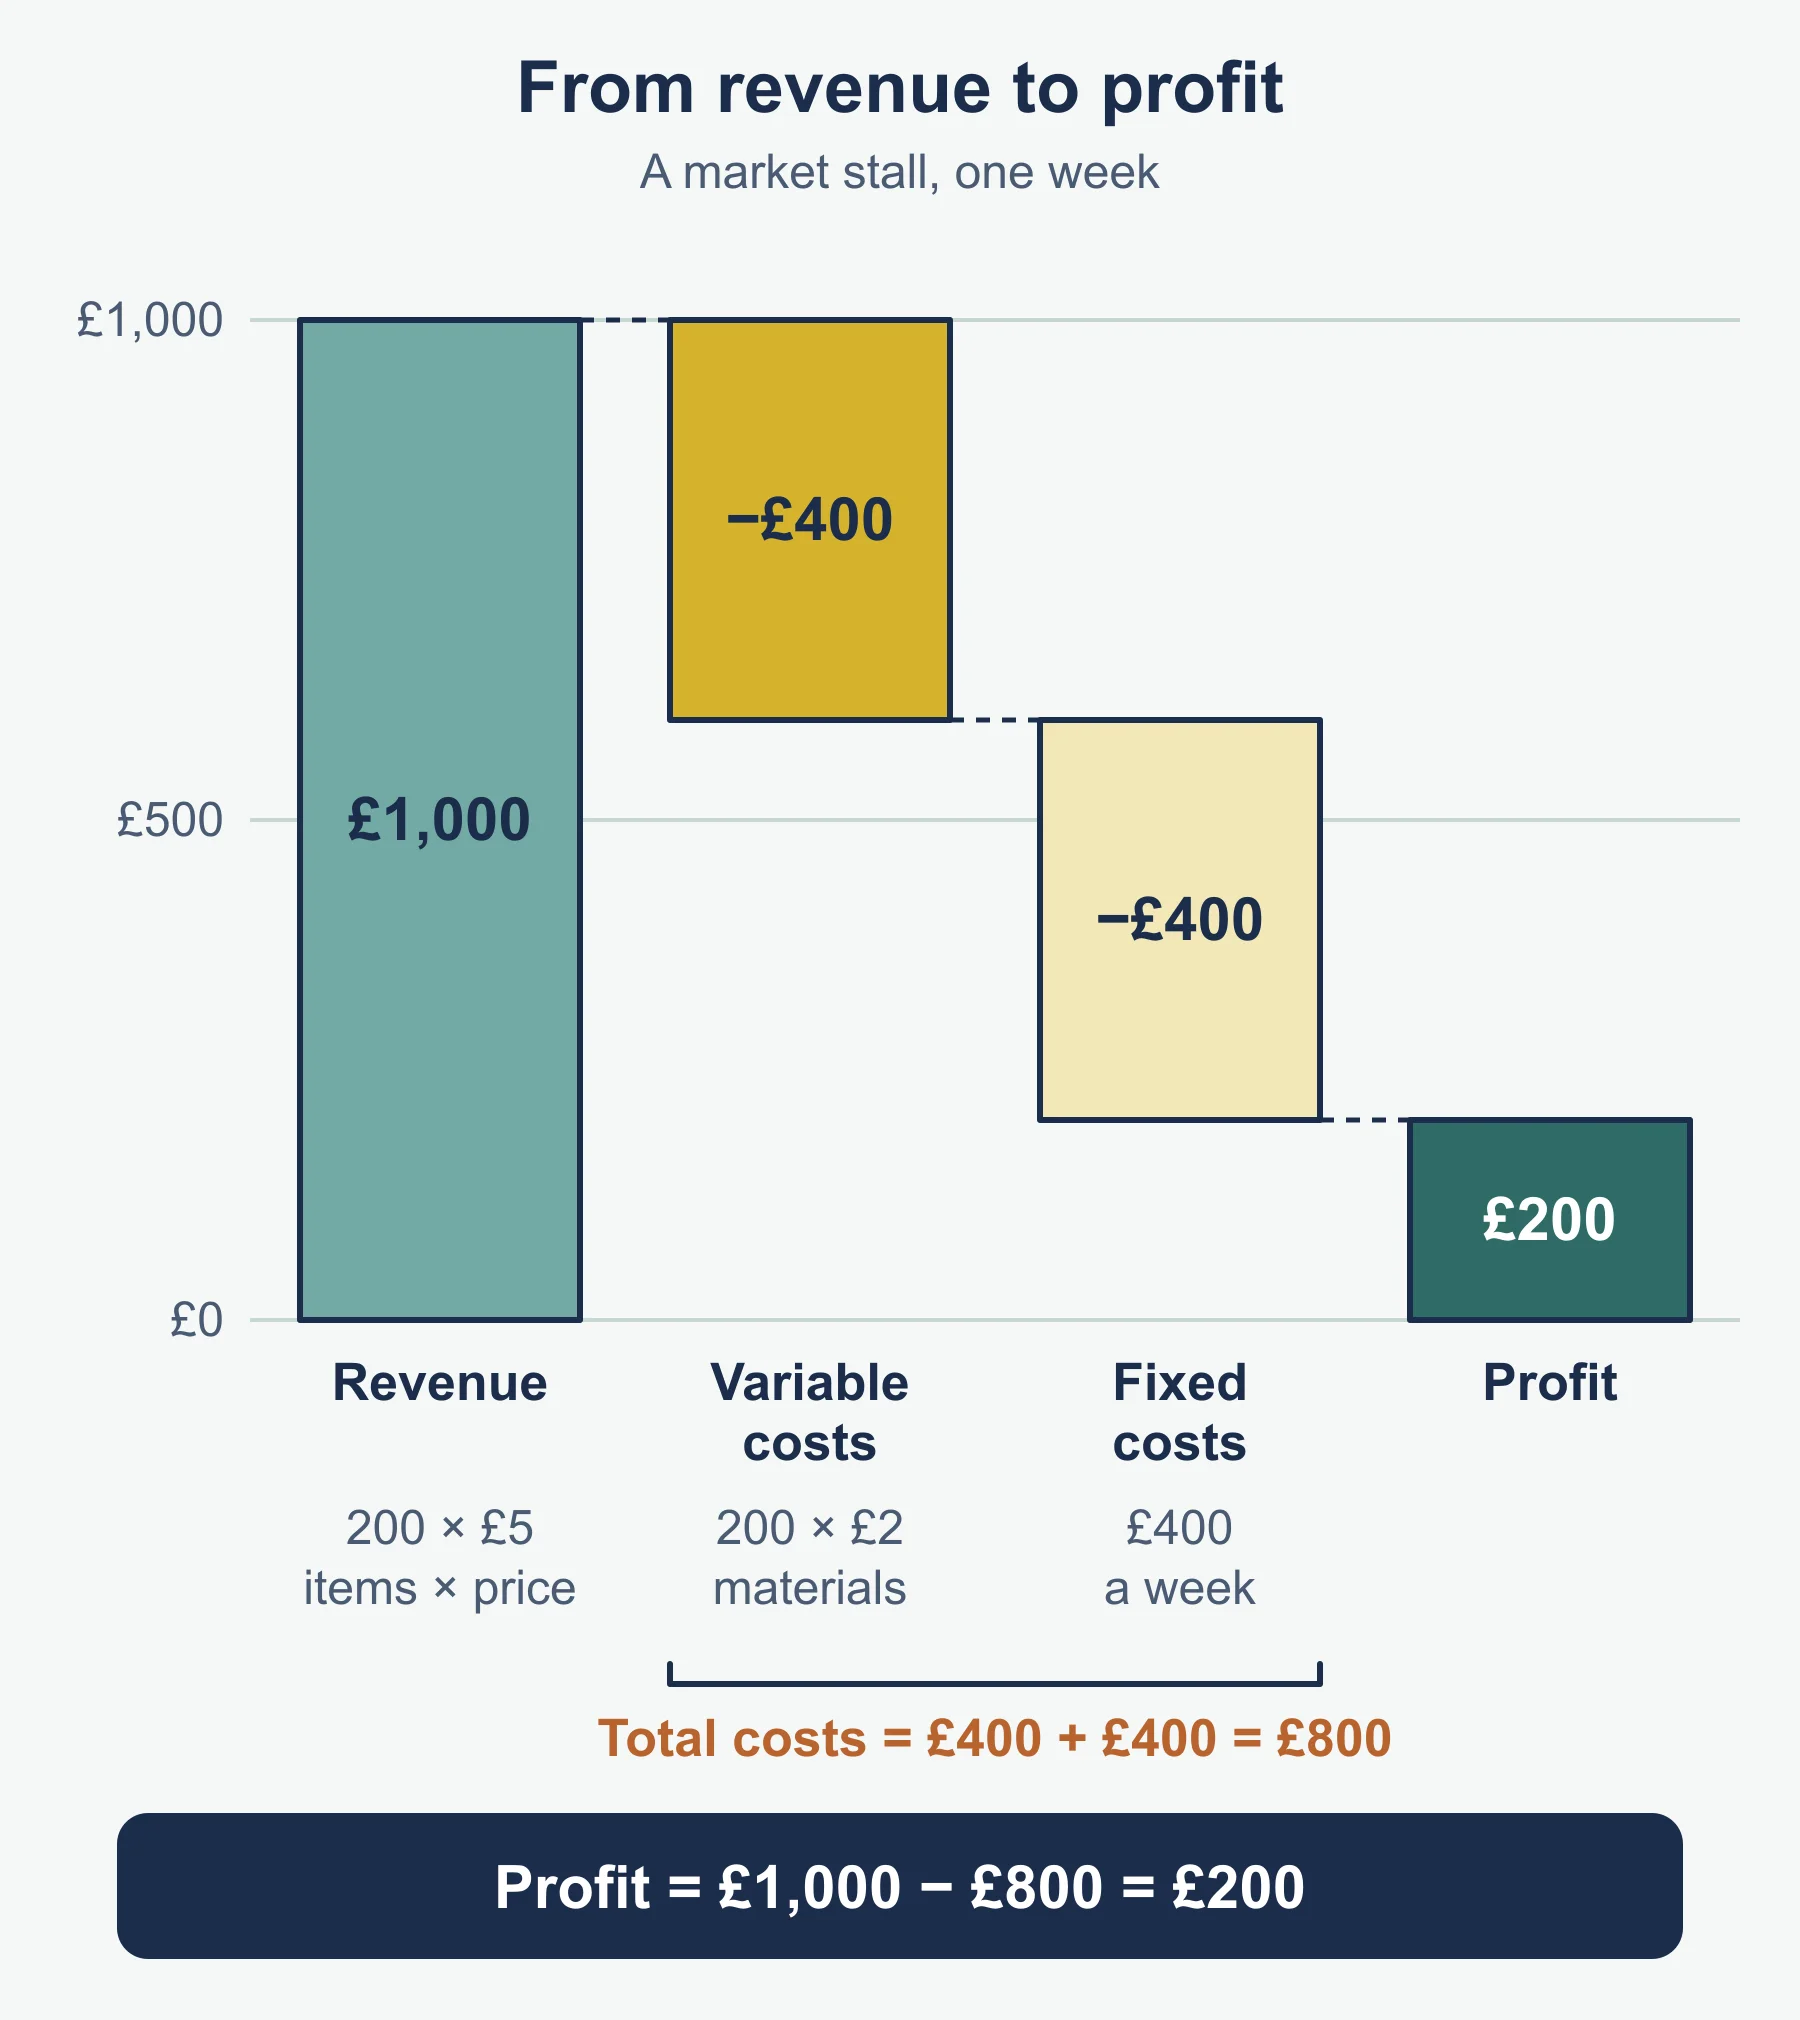
Revenue is the money a business receives from sales: revenue = selling price × quantity sold. Costs are what it pays out.
- Fixed costs do not change as output changes in the short term, such as rent.
- Variable costs rise and fall with output, such as ingredients.
- Total costs = fixed costs + variable costs.
Worked example. Stonewick Bakery sells 3,500 cakes in a month at £4.20 each. Fixed costs are £6,300. Variable cost is £1.40 per cake.
- Revenue = 3,500 × £4.20 = £14,700
- Variable costs = 3,500 × £1.40 = £4,900
- Total costs = £6,300 + £4,900 = £11,200
- Profit = revenue − total costs = £14,700 − £11,200 = £3,500
If total costs are higher than revenue, the result is a loss. These figures matter in decisions because they show whether a plan, price or product can pay its way.
Gross profit and net profit
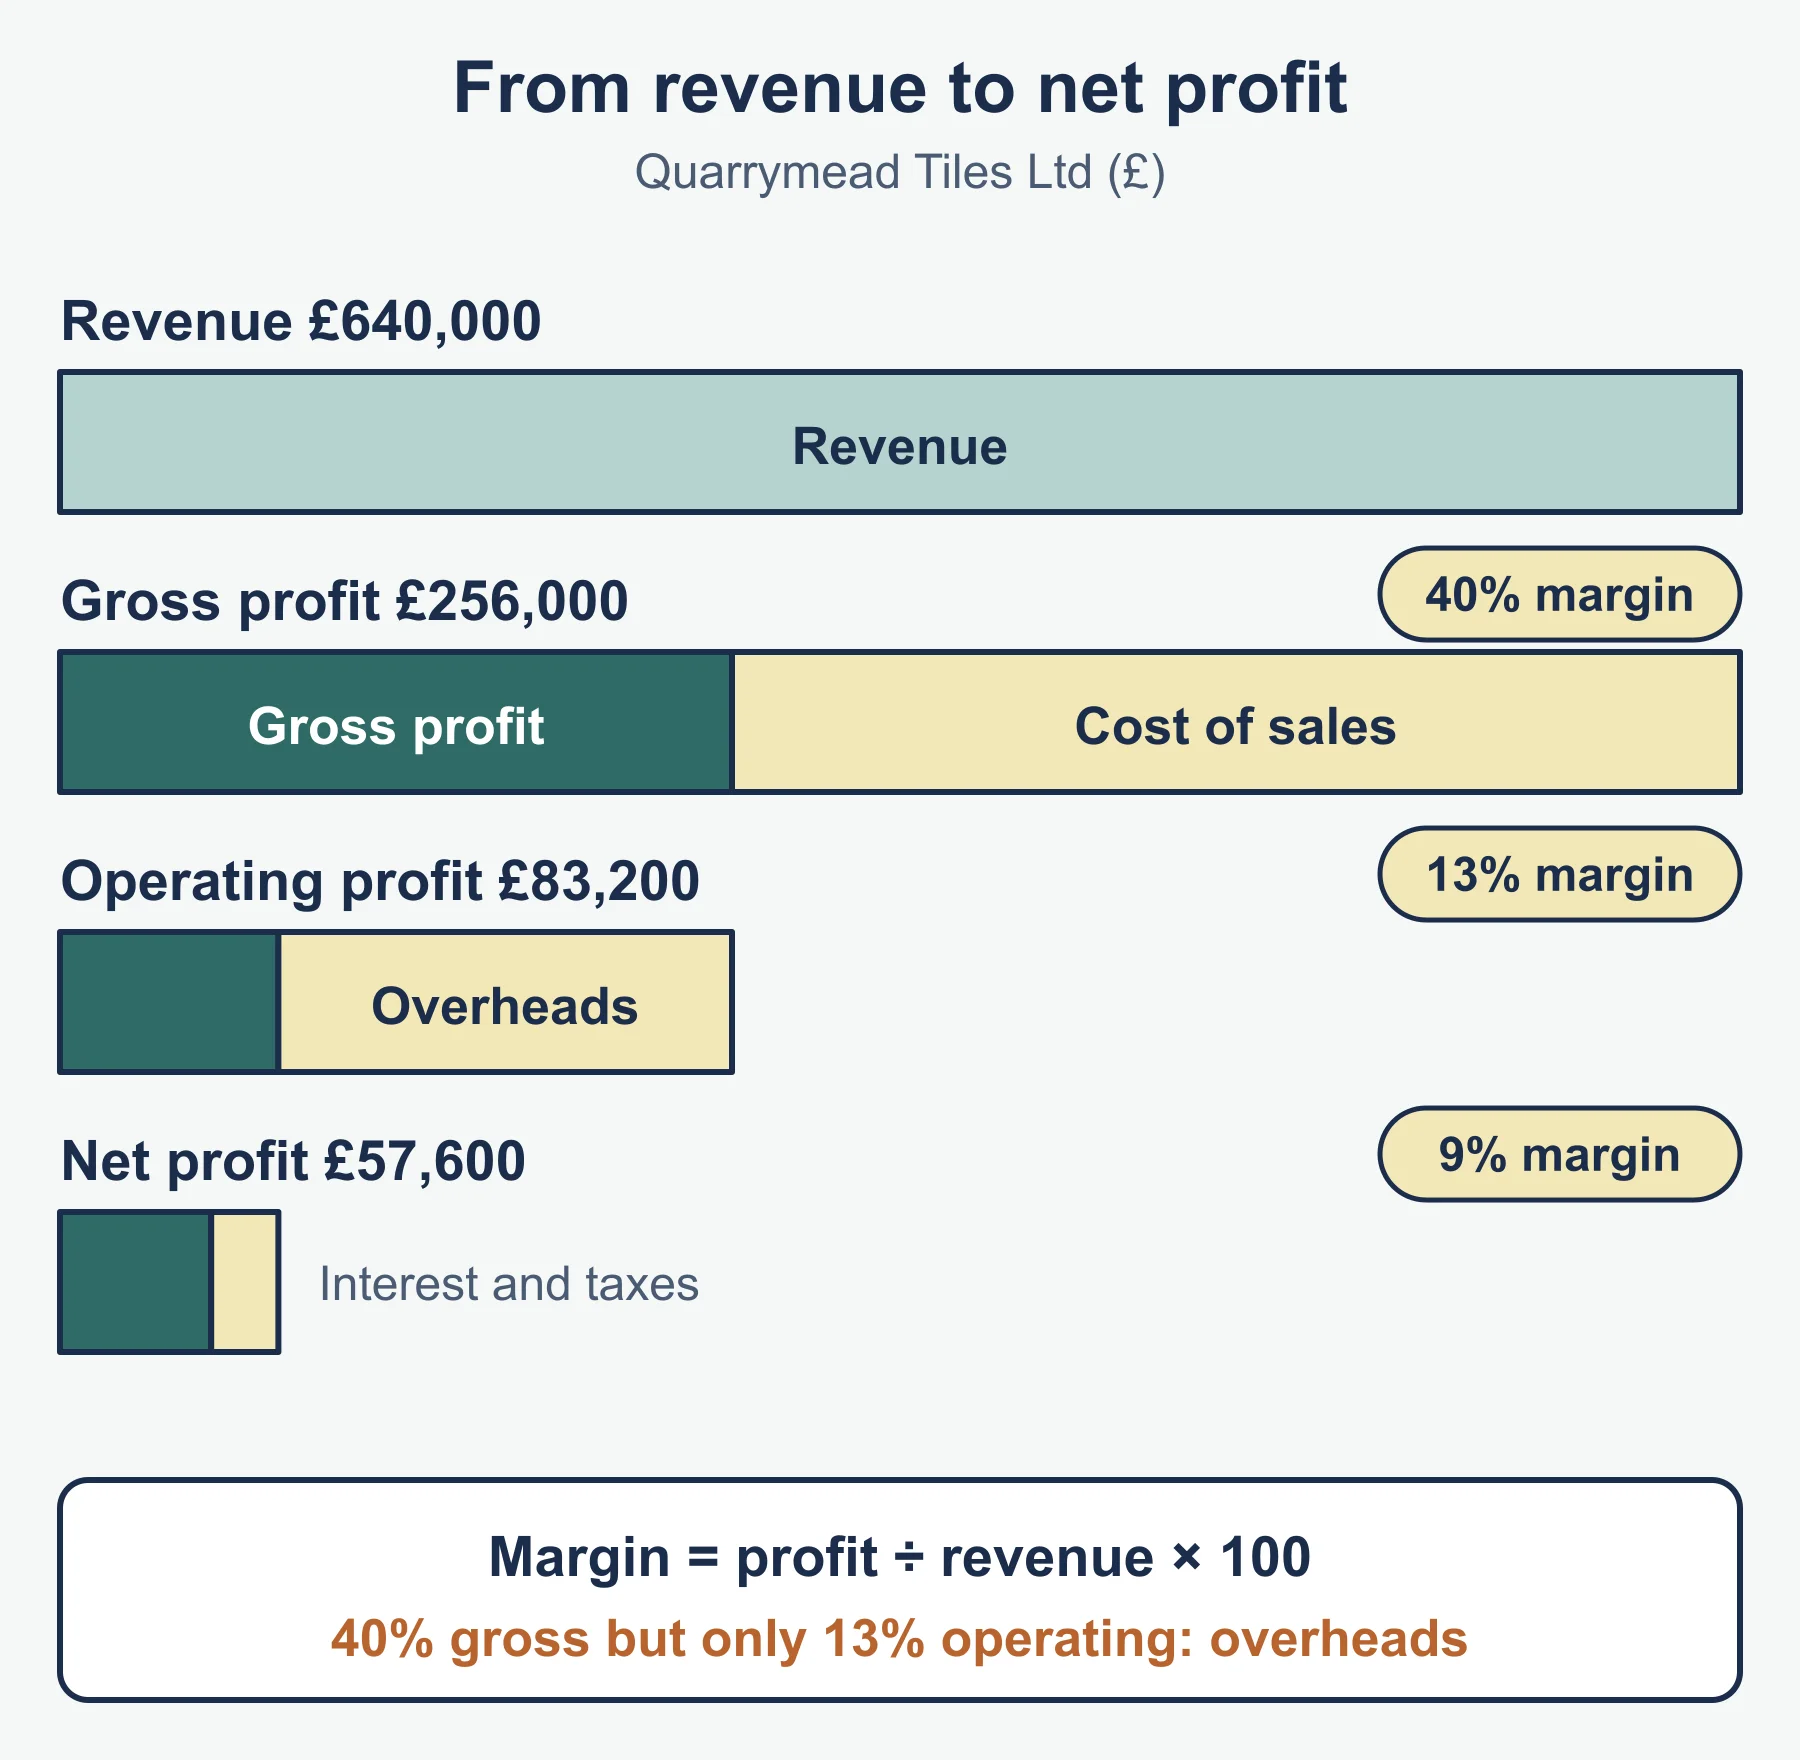
- Gross profit = revenue − cost of sales (what it cost to buy or make the goods sold). The specification names gross profit but does not define cost of sales; this is the standard form.
- Net profit = gross profit − other business expenses (rent, wages, utilities and so on)
Profitability ratios
The specification names the gross profit margin and net profit margin. The standard forms are:
- Gross profit margin (%) = (gross profit ÷ revenue) × 100
- Net profit margin (%) = (net profit ÷ revenue) × 100
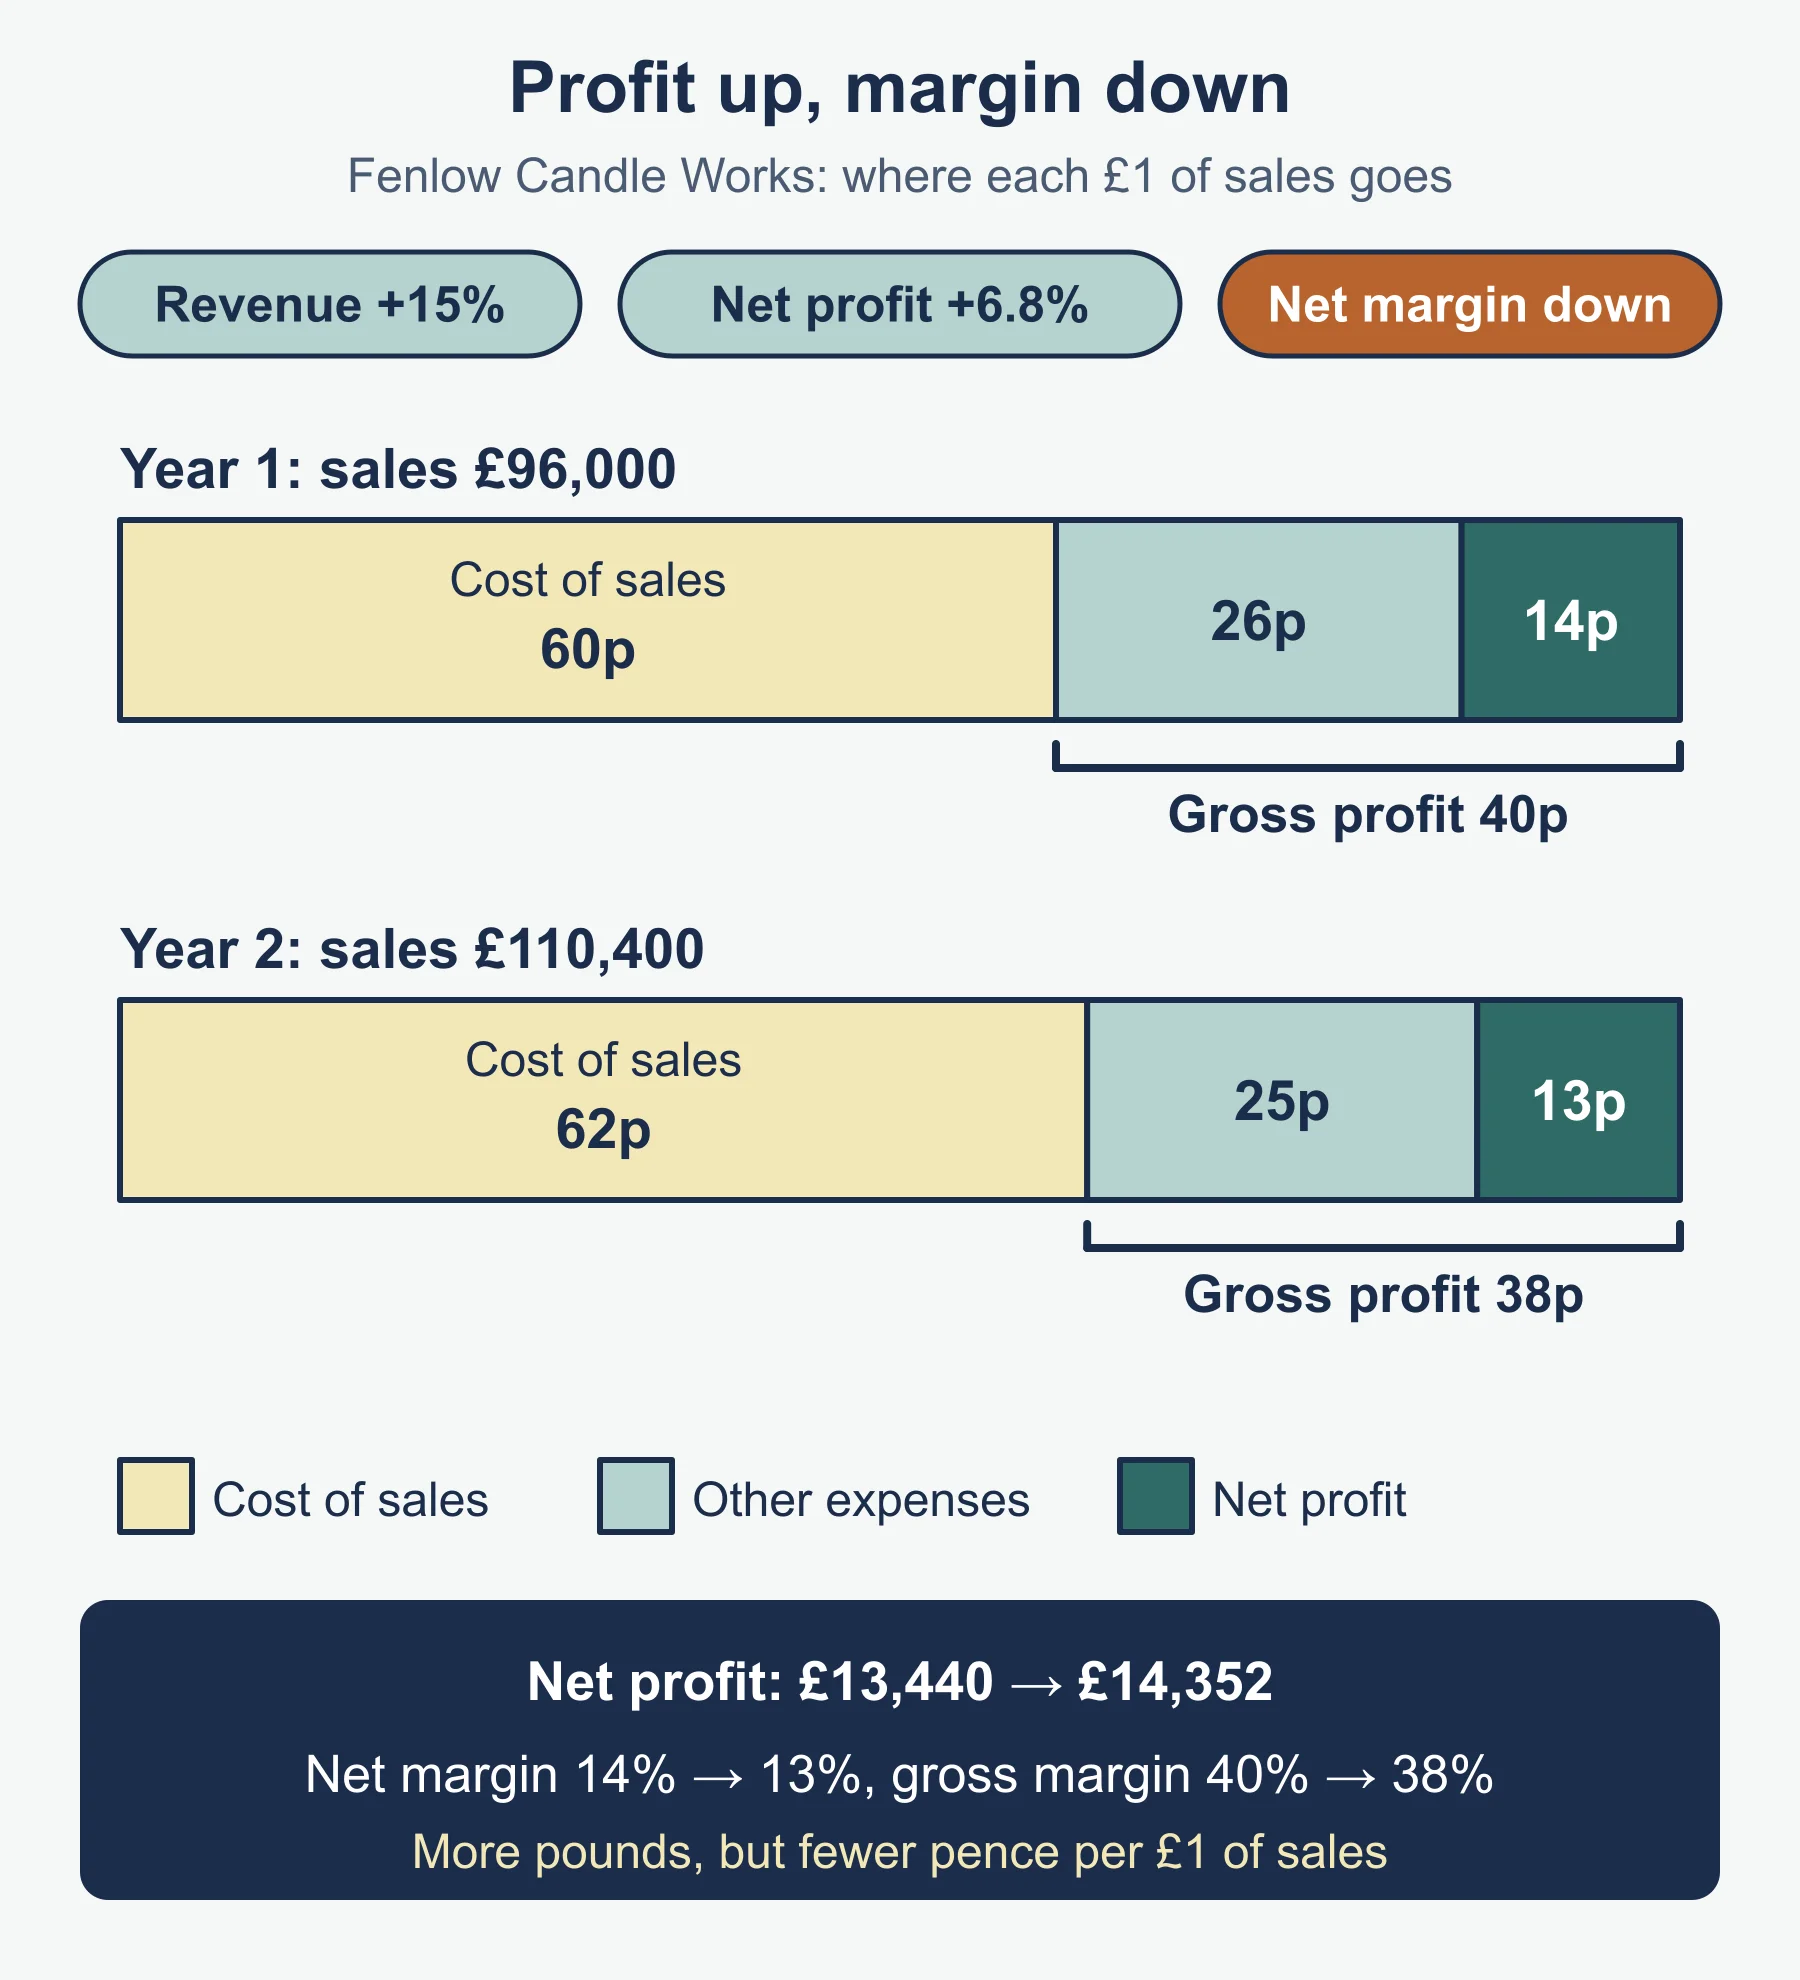
Worked example. Fenlow Candle Works sold 4,000 candles at £24 in its first year.
| Year 1 | Year 2 | |
|---|---|---|
| Revenue | £96,000 | £110,400 |
| Cost of sales | £57,600 | £68,448 |
| Gross profit | £38,400 | £41,952 |
| Other expenses | £24,960 | £27,600 |
| Net profit | £13,440 | £14,352 |
| Gross profit margin | 40% | 38% |
| Net profit margin | 14% | 13% |
Revenue rose by about 14.4% (£13,800 ÷ £96,000 × 100). Net profit rose in pounds, by about 6.8%, but both margins fell. That means the business kept fewer pence of profit from each pound of sales. Possible causes are dearer materials (cost of sales rose faster than revenue) and higher running costs. Interpretation matters as much as the calculation: a rising profit figure can hide a weakening margin.
Average rate of return
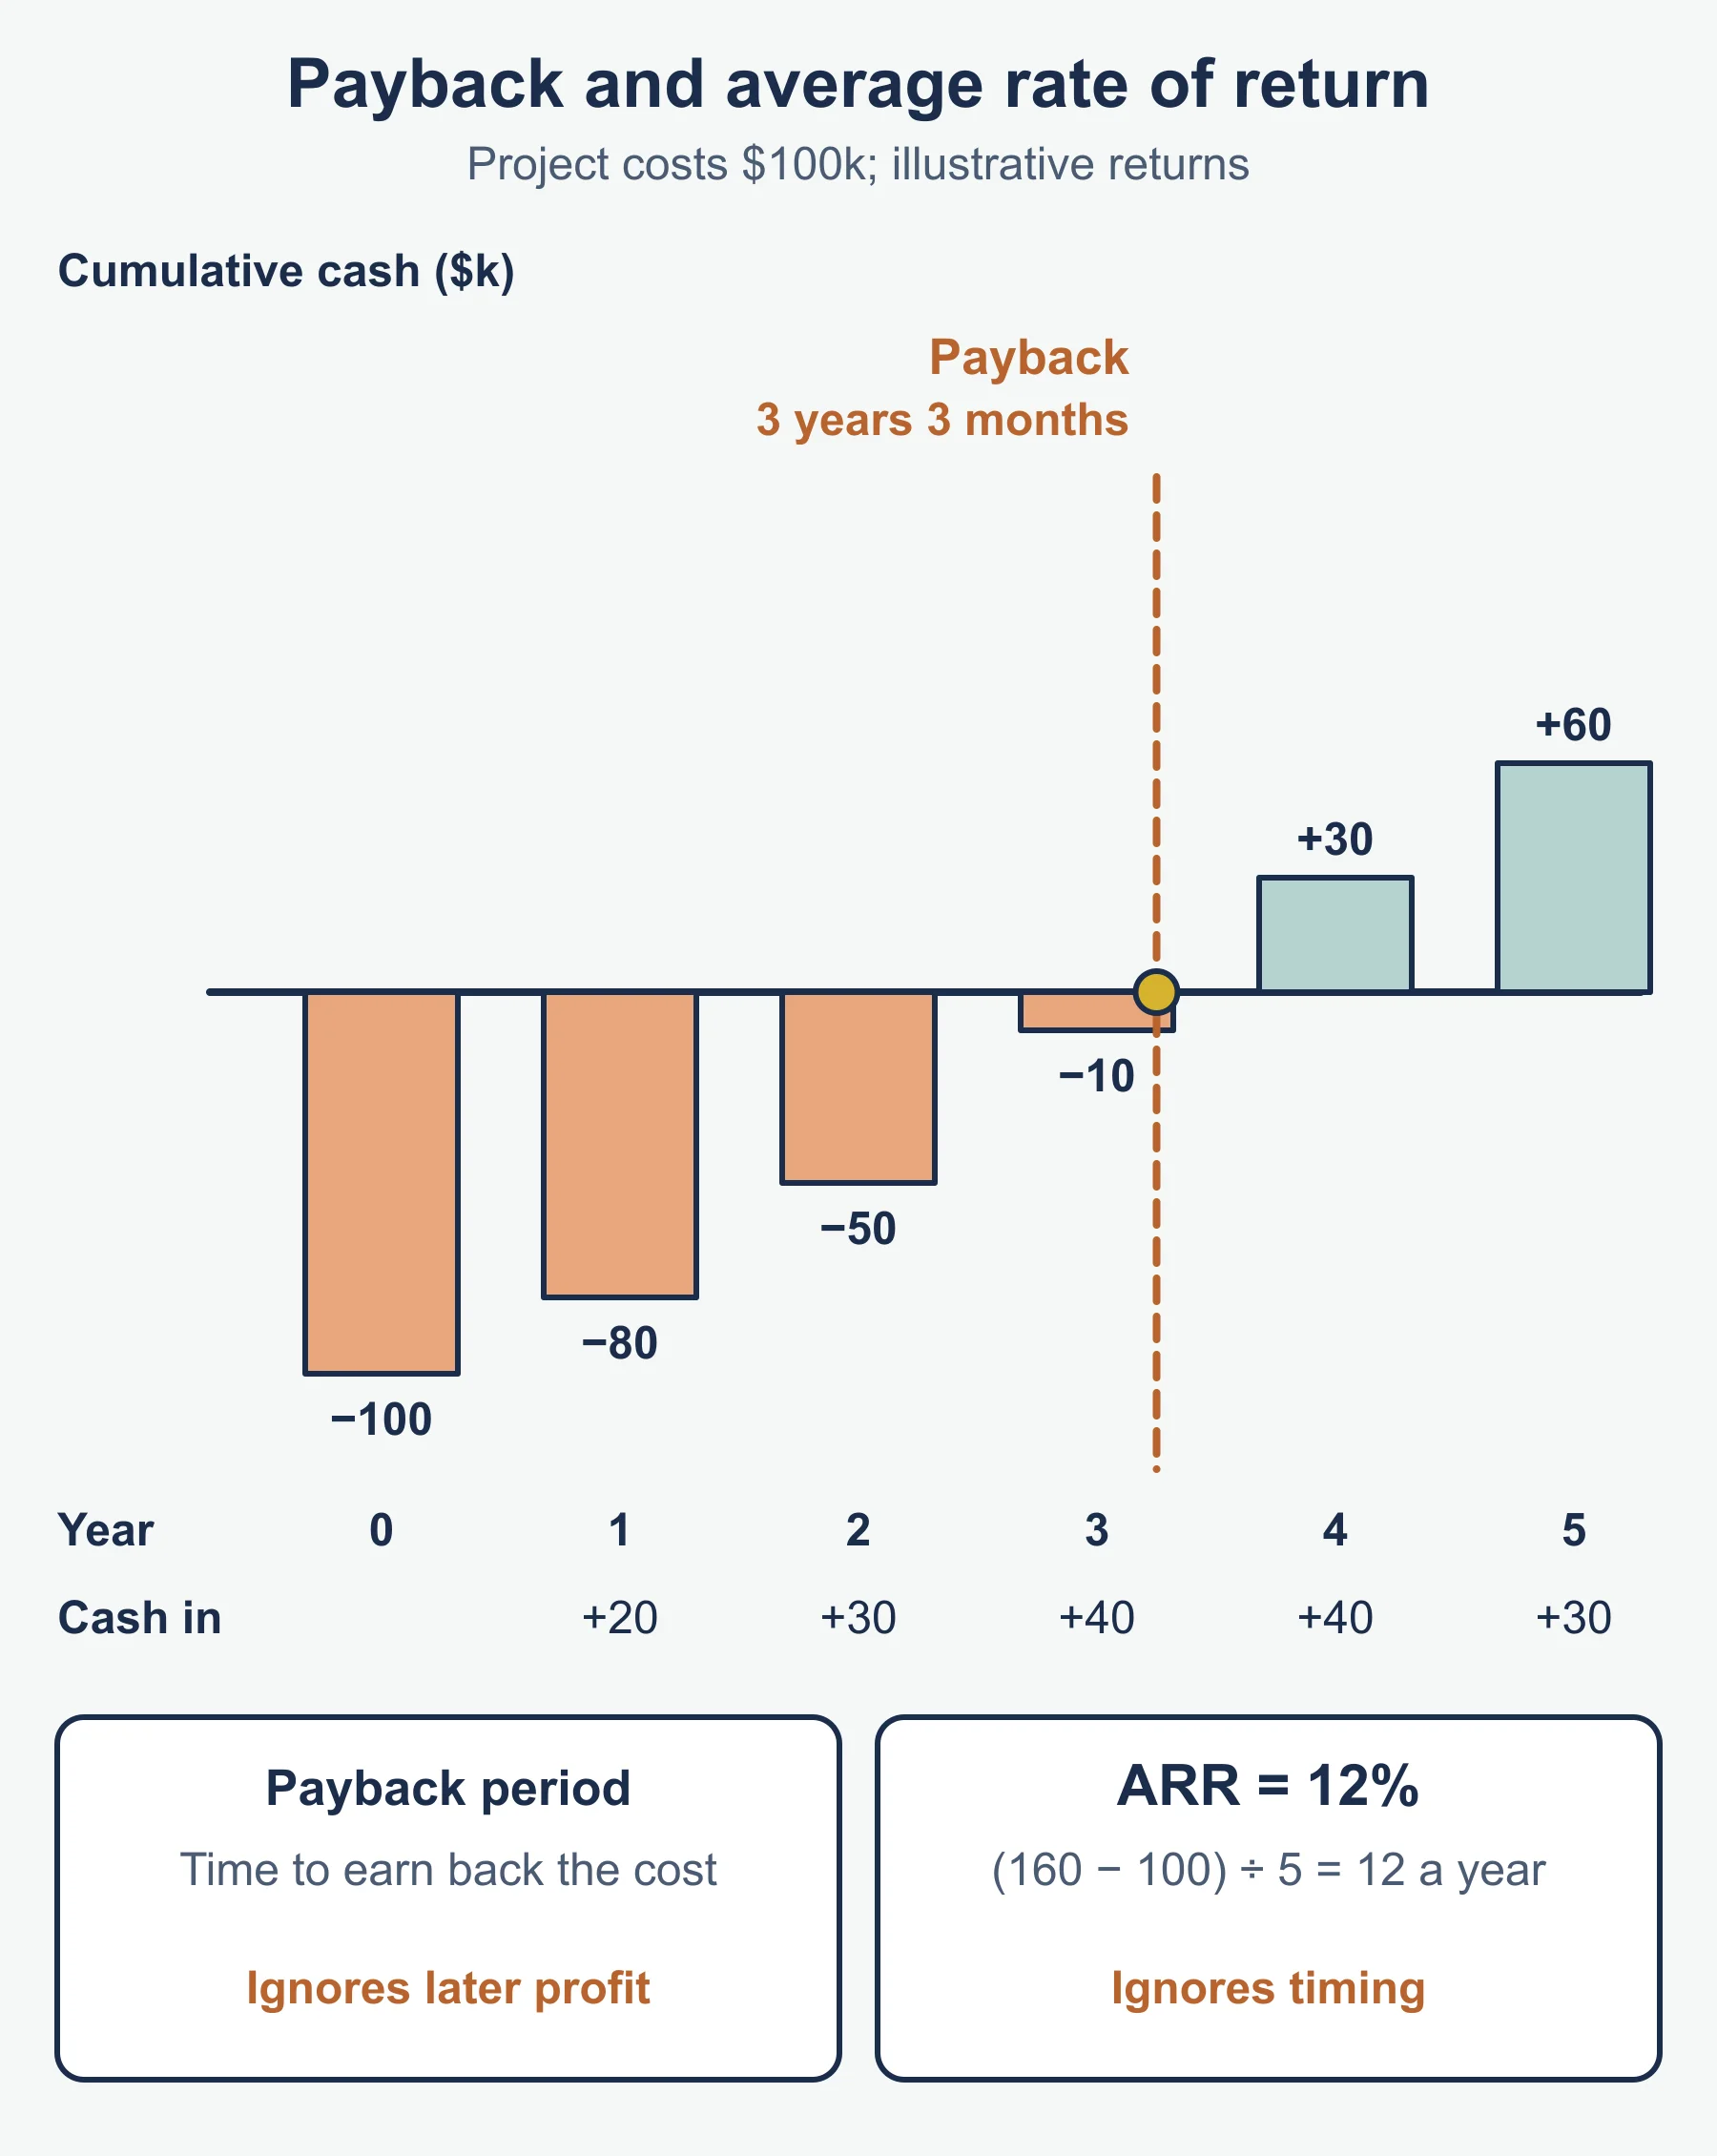
Average rate of return (ARR) compares the profit an investment earns with what it cost. The specification does not print a formula, so this is the standard form:
ARR (%) = (average annual profit ÷ cost of the investment) × 100
Where you are given yearly profits, average annual profit = total profit ÷ number of years. Where you are given total returns instead, subtract the cost first to find the total profit.
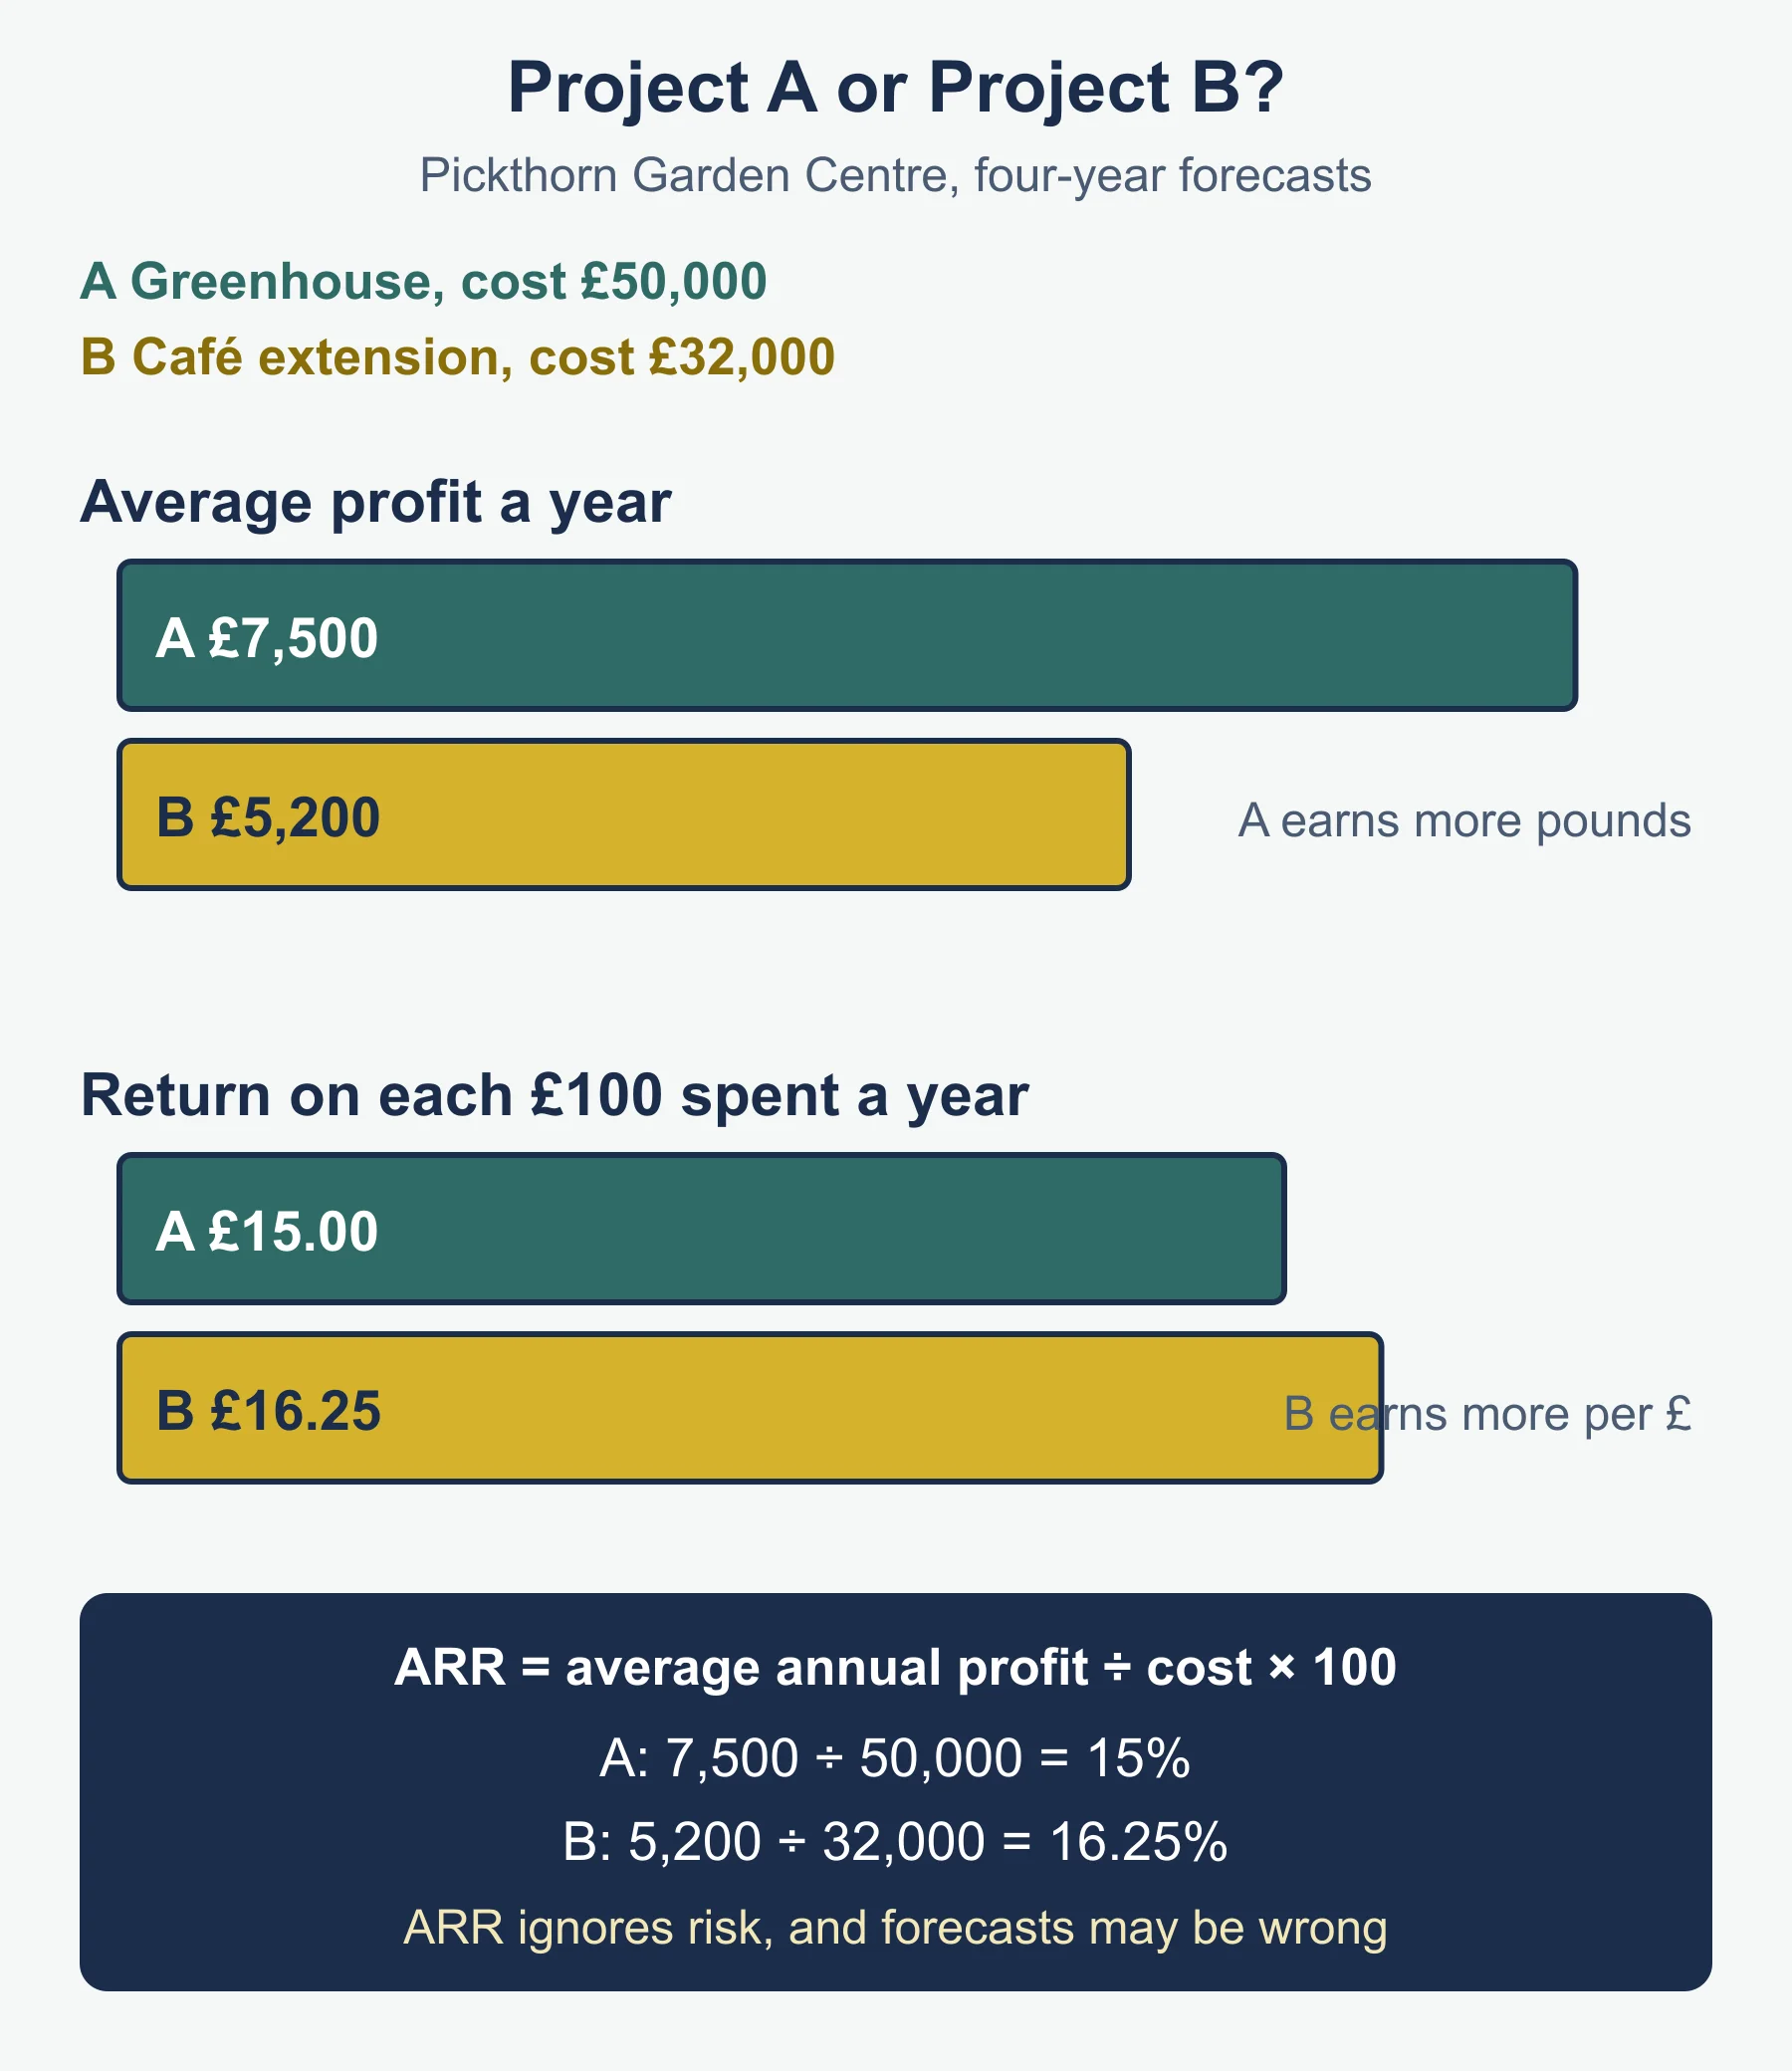
Worked example. Pickthorn Garden Centre is choosing between two projects.
- Project A, a greenhouse costing £50,000, is forecast to add profit of £5,200, £7,400, £9,000 and £8,400 over four years. Total = £30,000. Average = £7,500. ARR = 7,500 ÷ 50,000 × 100 = 15%.
- Project B, a café extension costing £32,000, is forecast to add £20,800 in total over four years. Average = £5,200. ARR = 5,200 ÷ 32,000 × 100 = 16.25%.
Project A earns more pounds, but Project B earns more for each pound spent. A good answer says so, then adds what ARR leaves out: it ignores risk, and the forecasts may be wrong.
5.4 Break-even
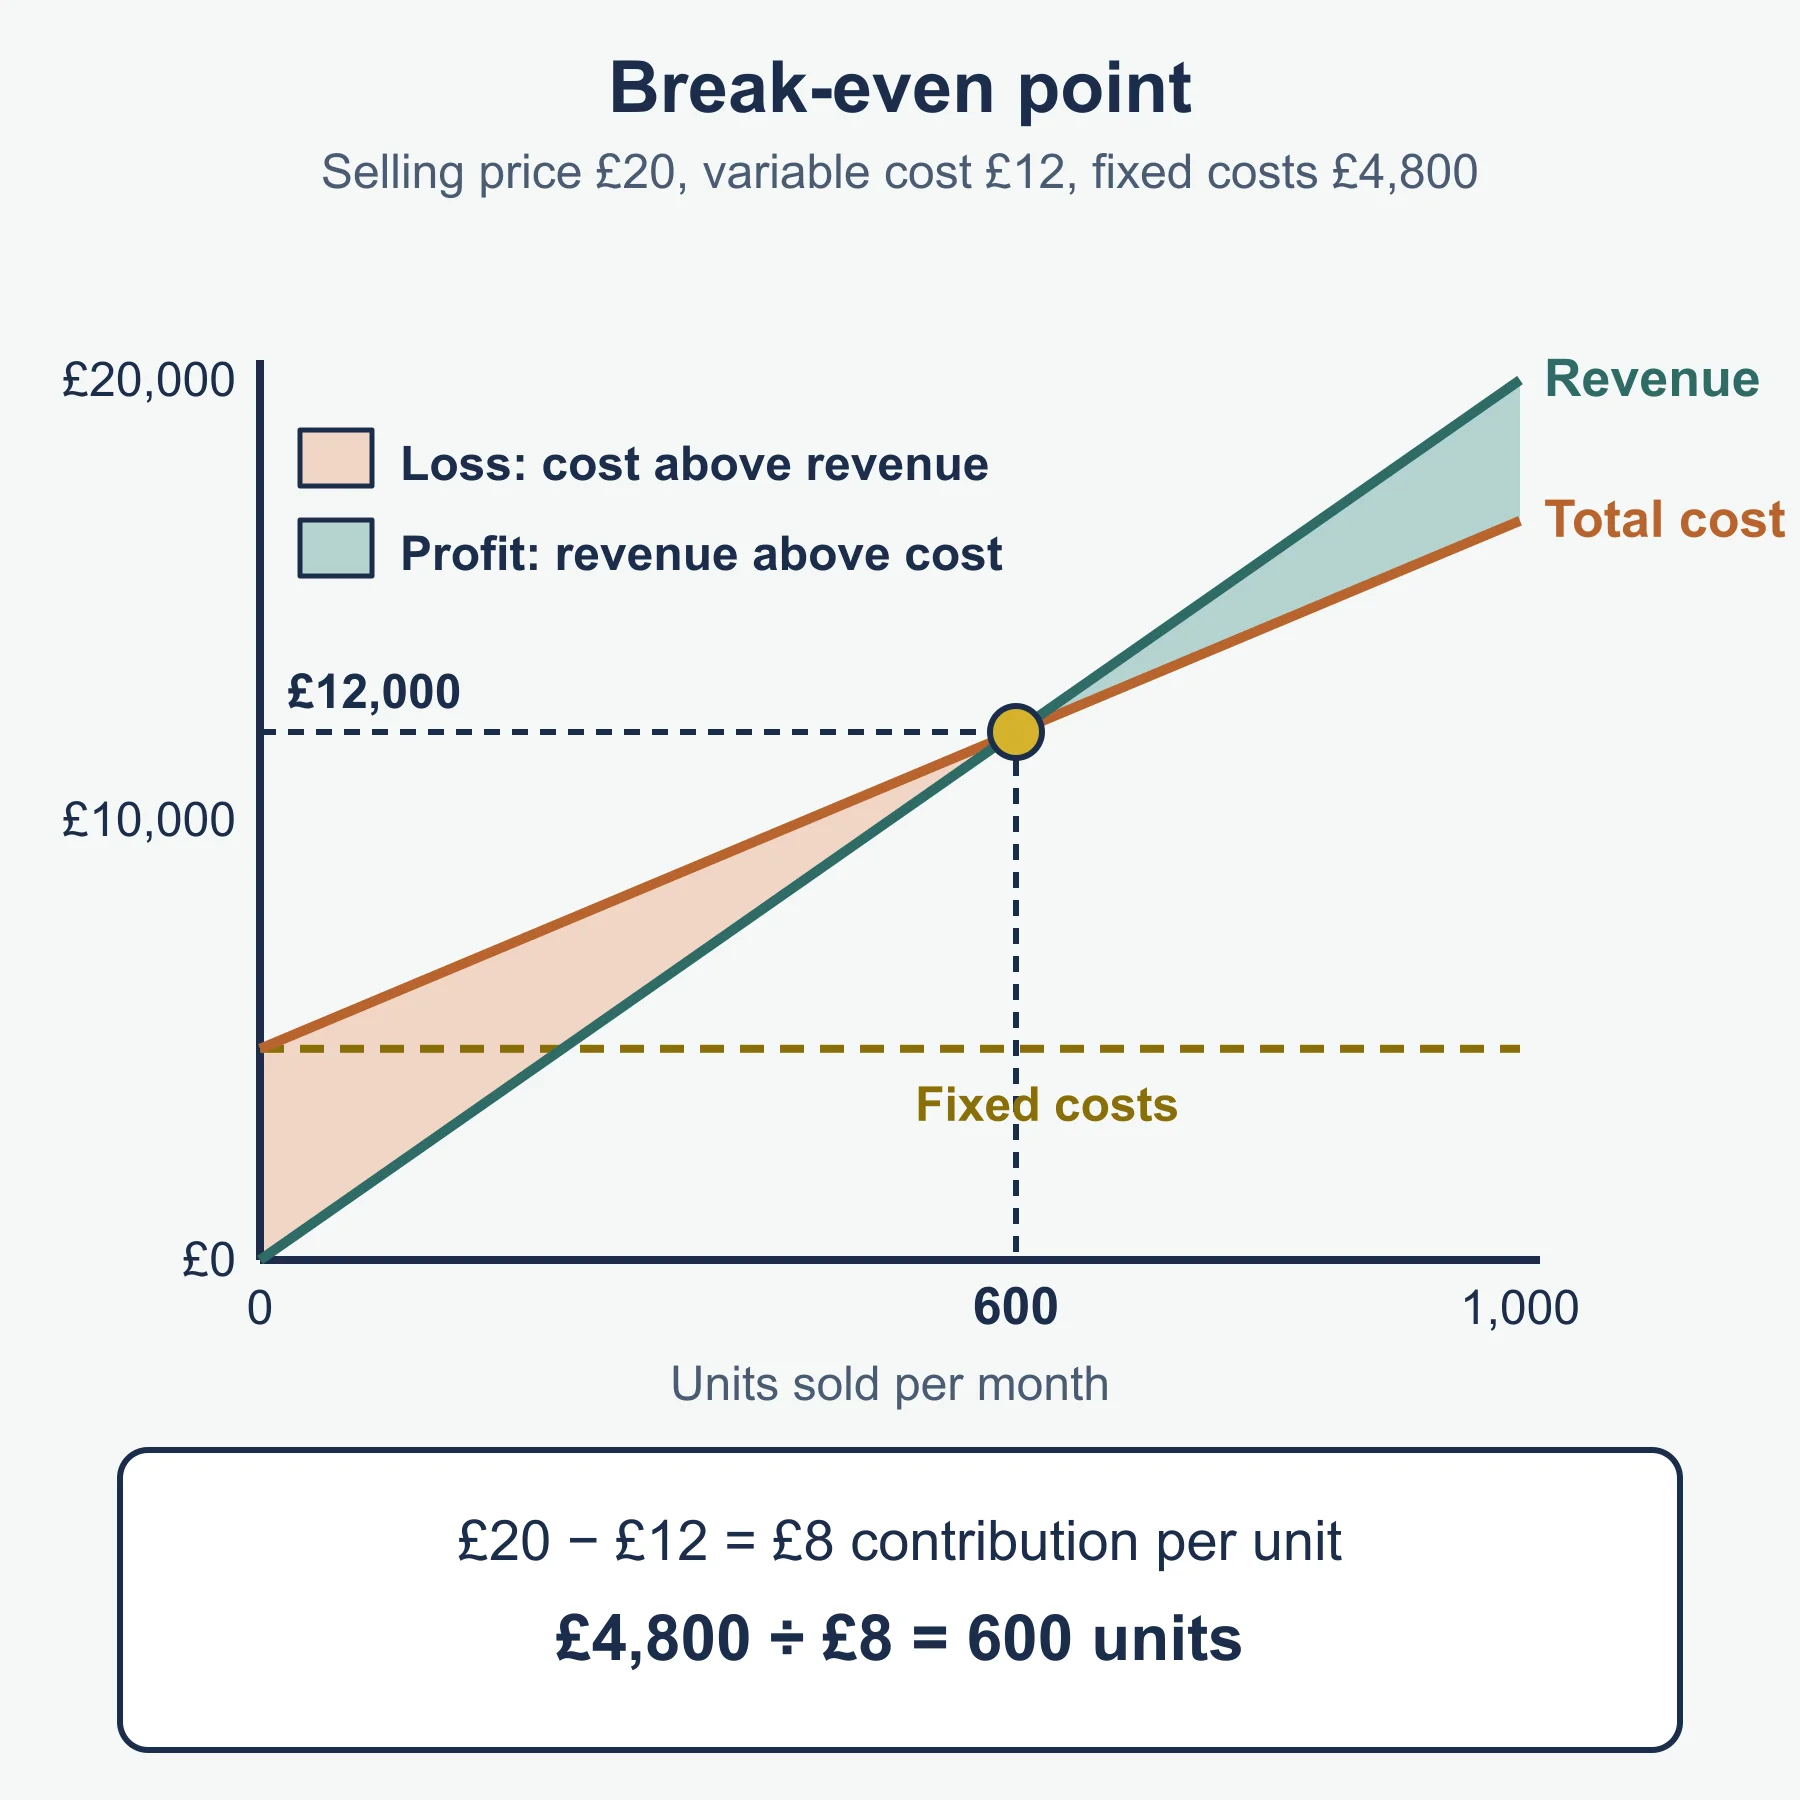
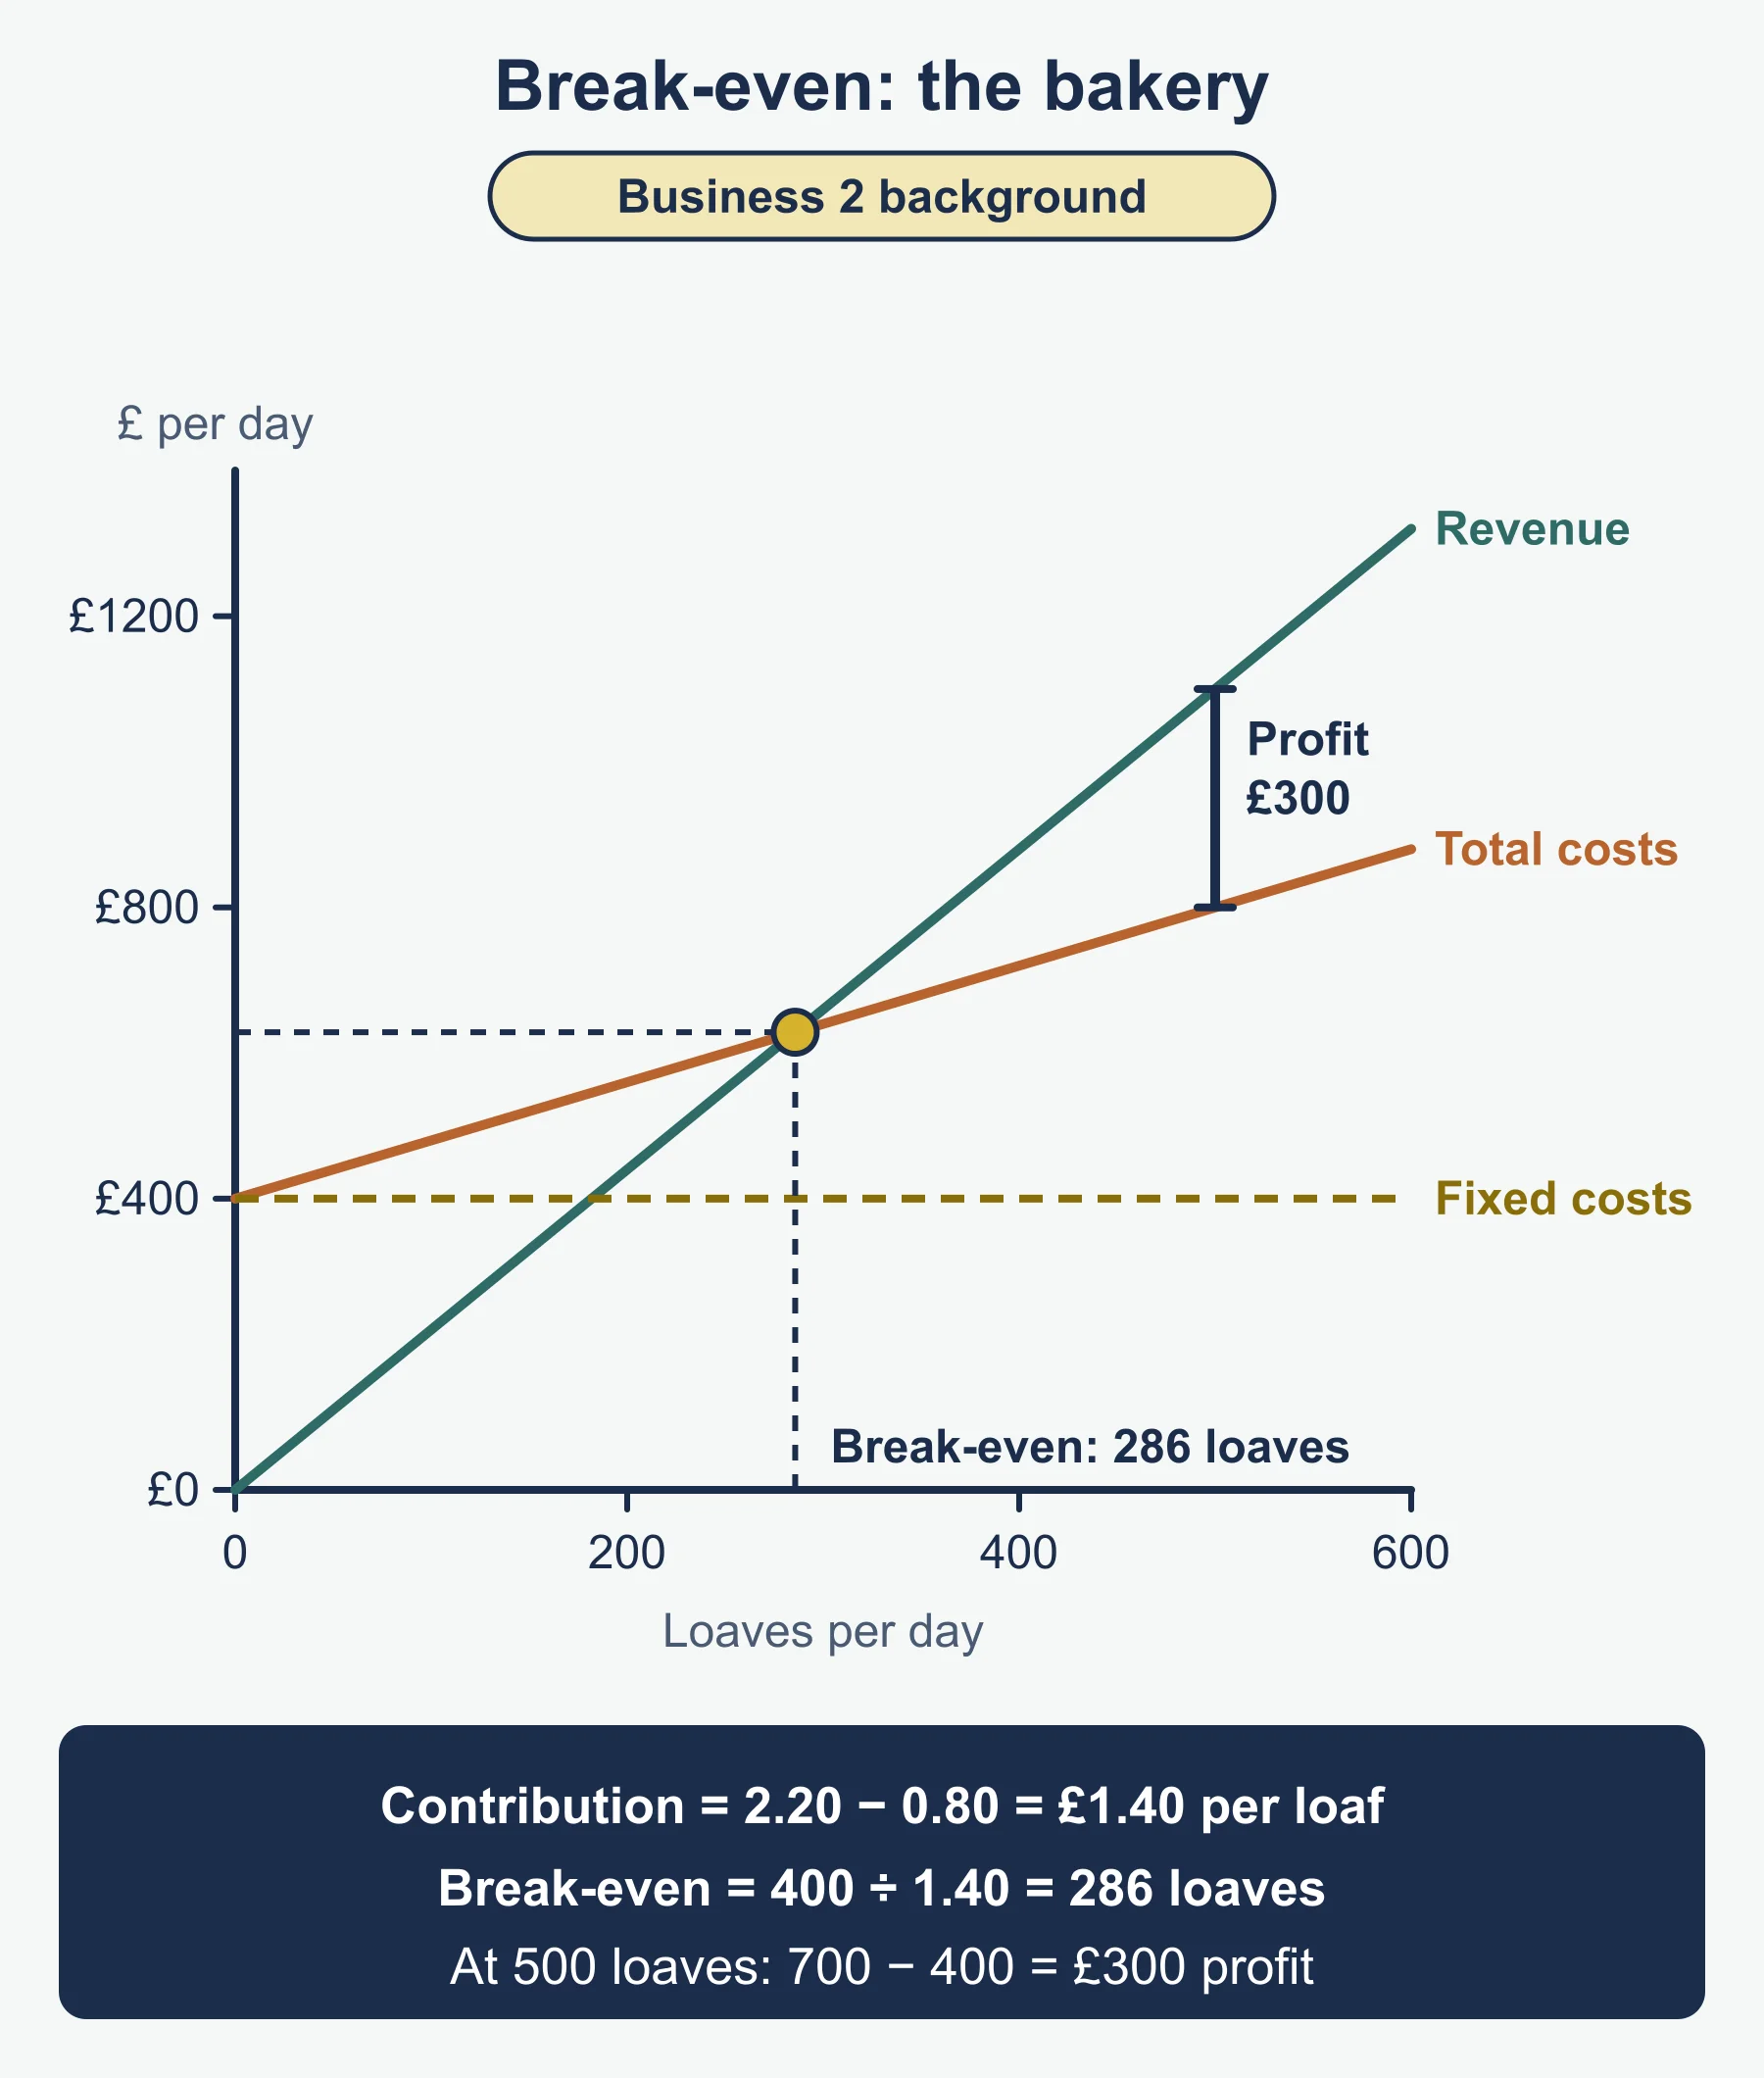
Break-even is the level of sales at which total costs equal total revenue, so the business makes neither profit nor loss. Below it there is a loss; above it, a profit.
Standard form for the simple calculation:
- Contribution per unit = selling price − variable cost per unit
- Break-even quantity = fixed costs ÷ contribution per unit
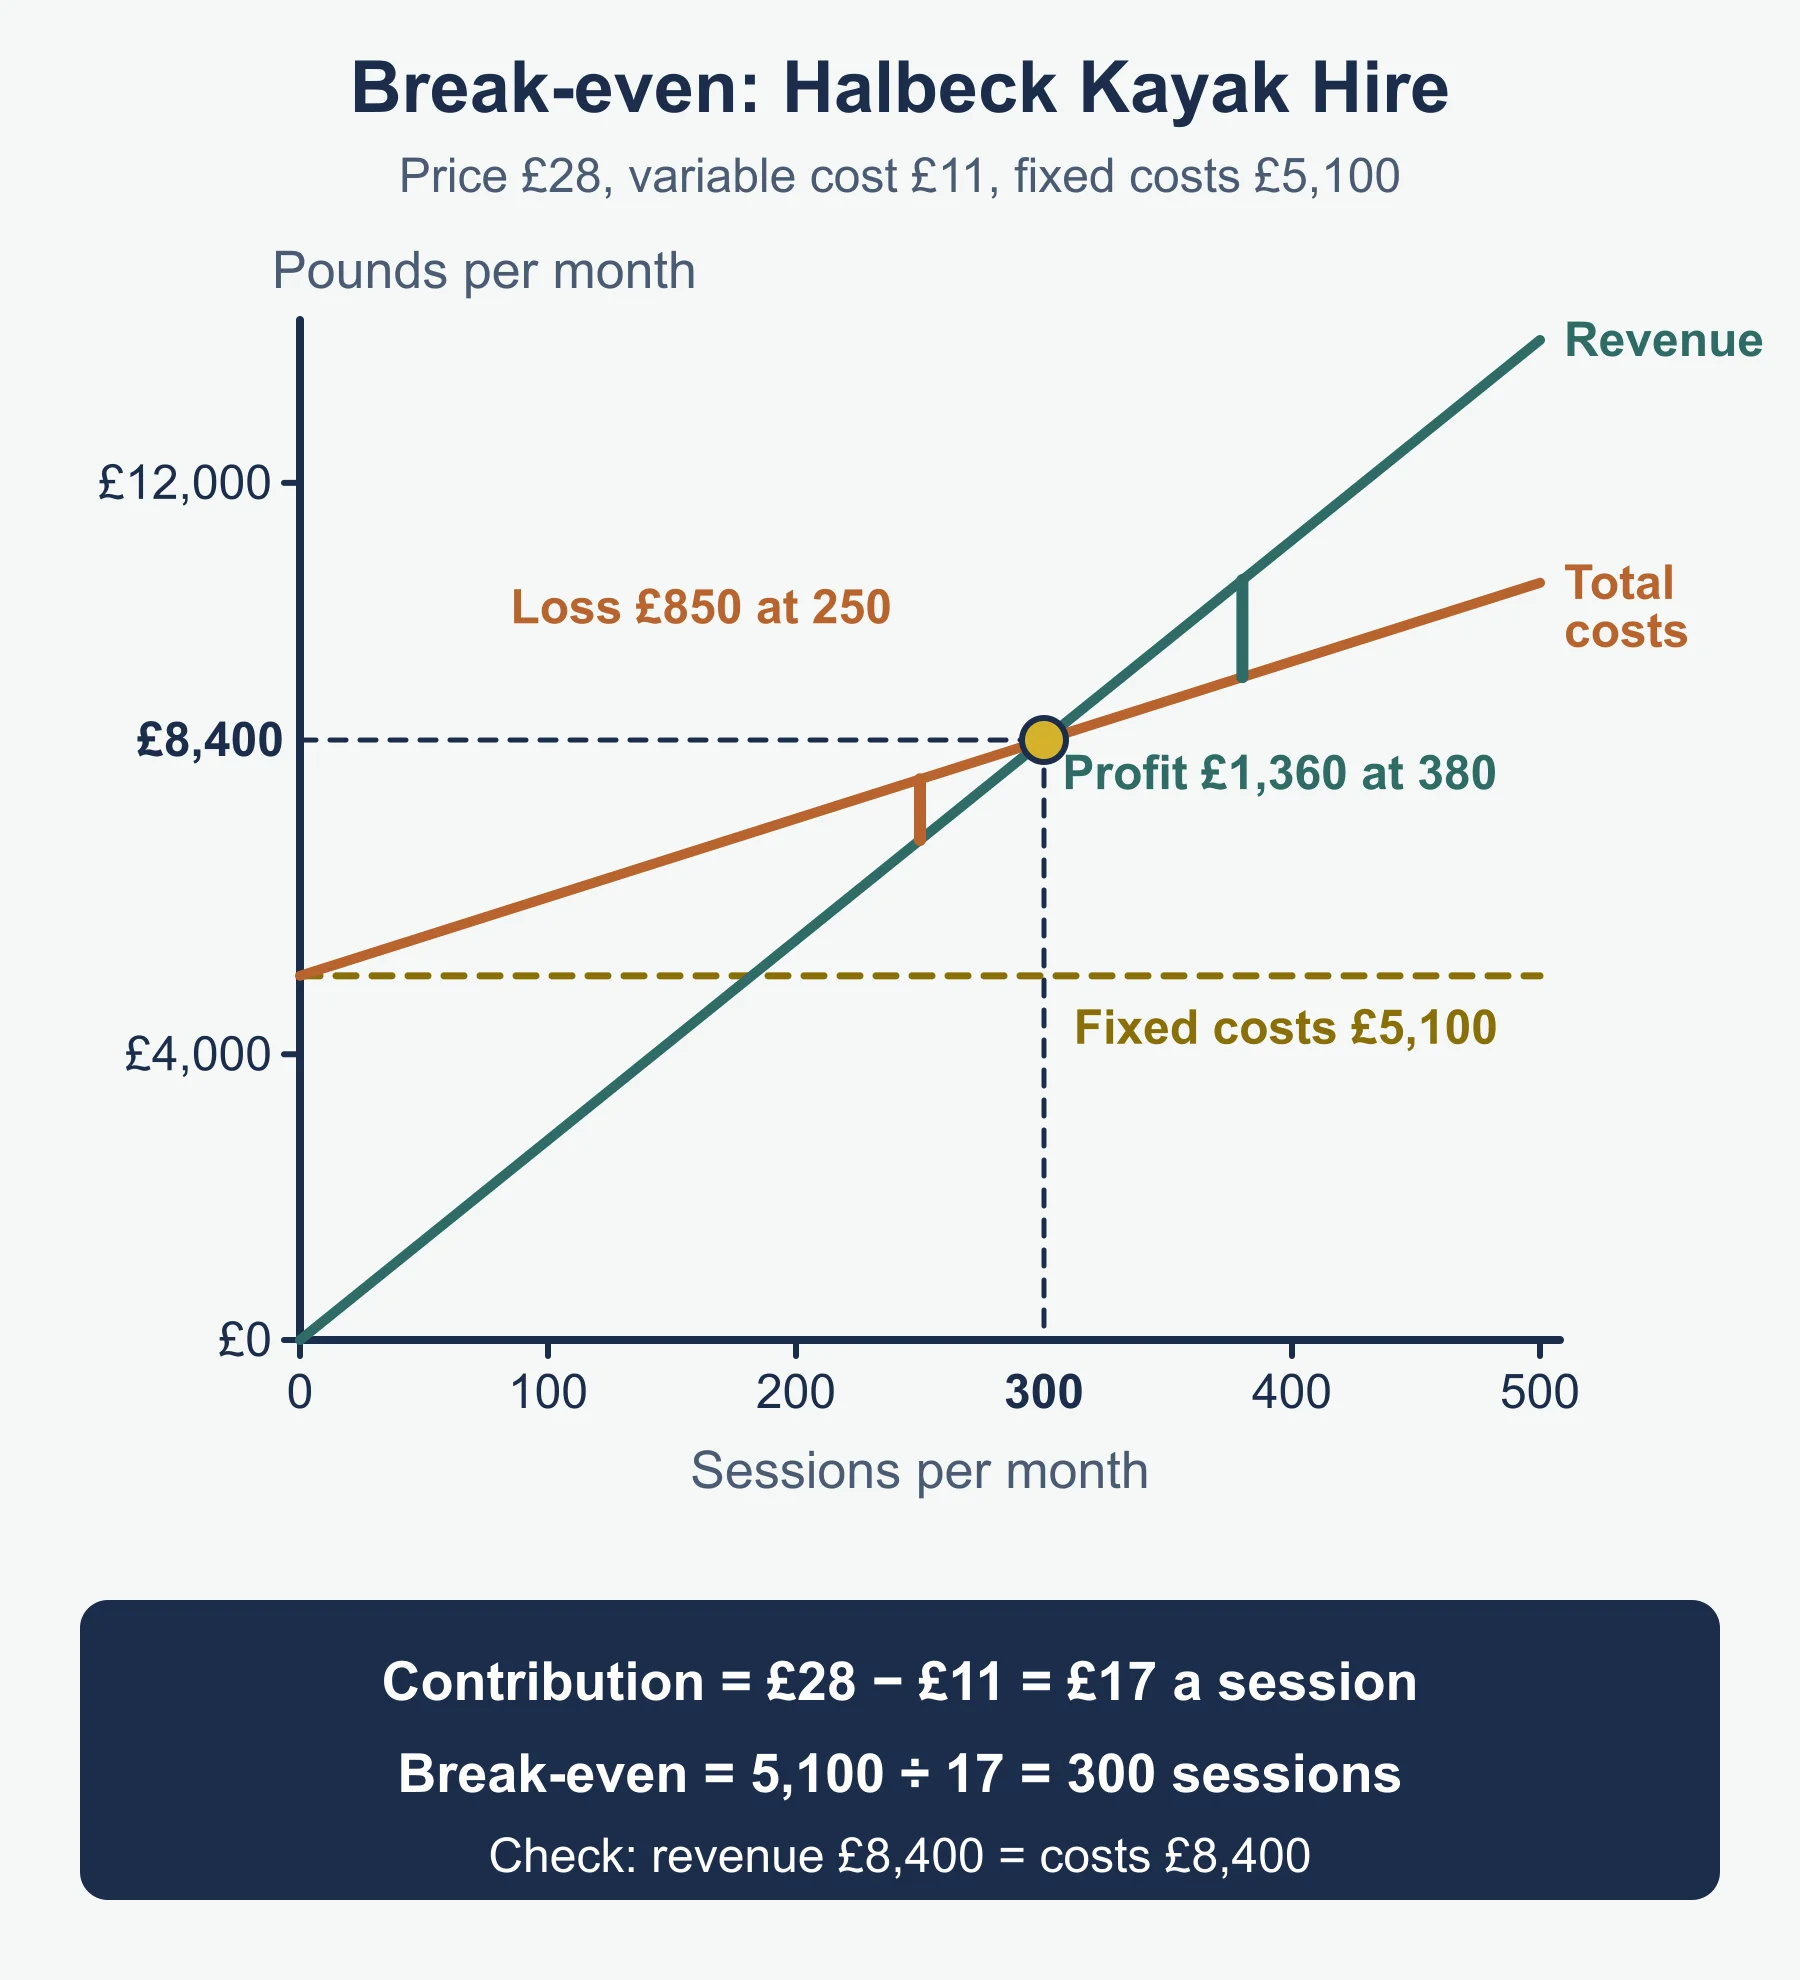
Worked example. Halbeck Kayak Hire charges £28 per session. Variable cost is £11 per session and fixed costs are £5,100 per month.
- Contribution = £28 − £11 = £17
- Break-even quantity = 5,100 ÷ 17 = 300 sessions
- Check: revenue = 300 × £28 = £8,400; total costs = £5,100 + (300 × £11) = £8,400
If Halbeck sells 380 sessions, profit = (380 − 300) × £17 = £1,360. At 250 sessions the loss is 50 × £17 = £850.
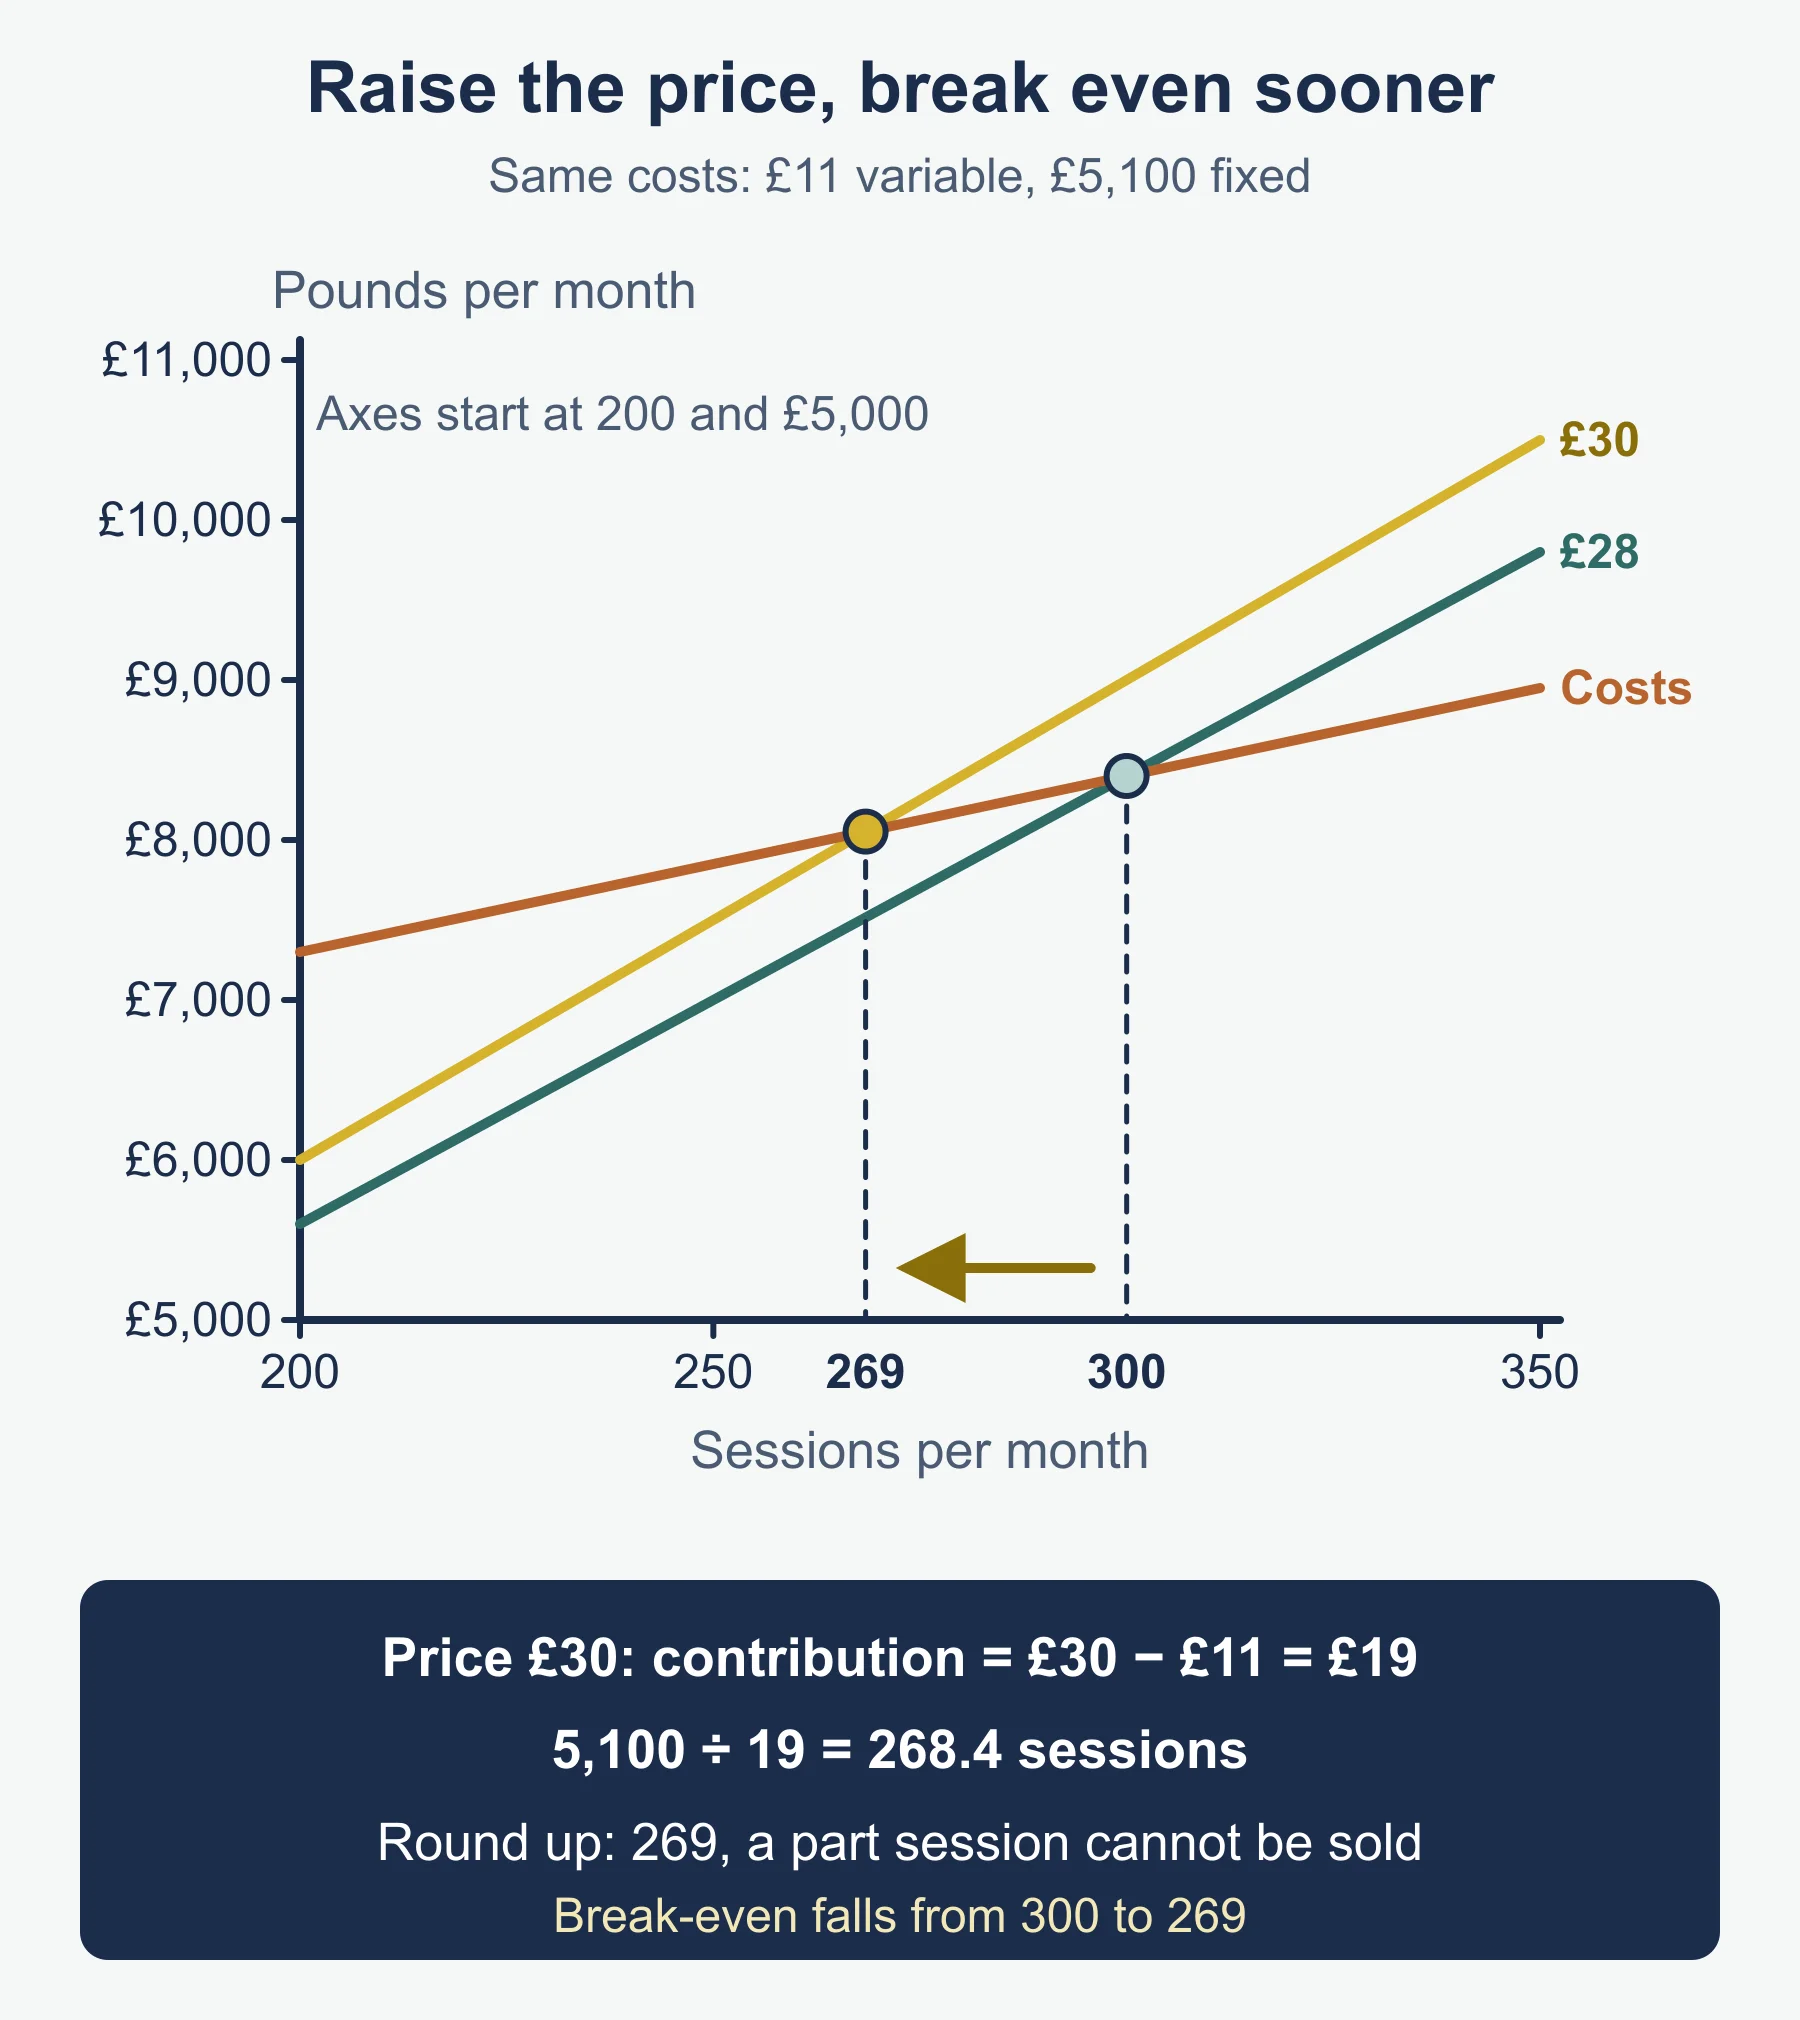
If a result is not a whole number, round up, because part of a session cannot be sold. Raising the price to £30 gives contribution £19 and 5,100 ÷ 19 = 268.4, so 269 sessions.
Usefulness. Break-even informs marketing and planning decisions. It shows whether a price is realistic, whether expected sales are enough, and how a price change shifts the sales needed. General limits (not listed in the specification): it assumes all output is sold, and costs and prices stay constant, which real businesses rarely manage.
5.5 Cash and cash flow
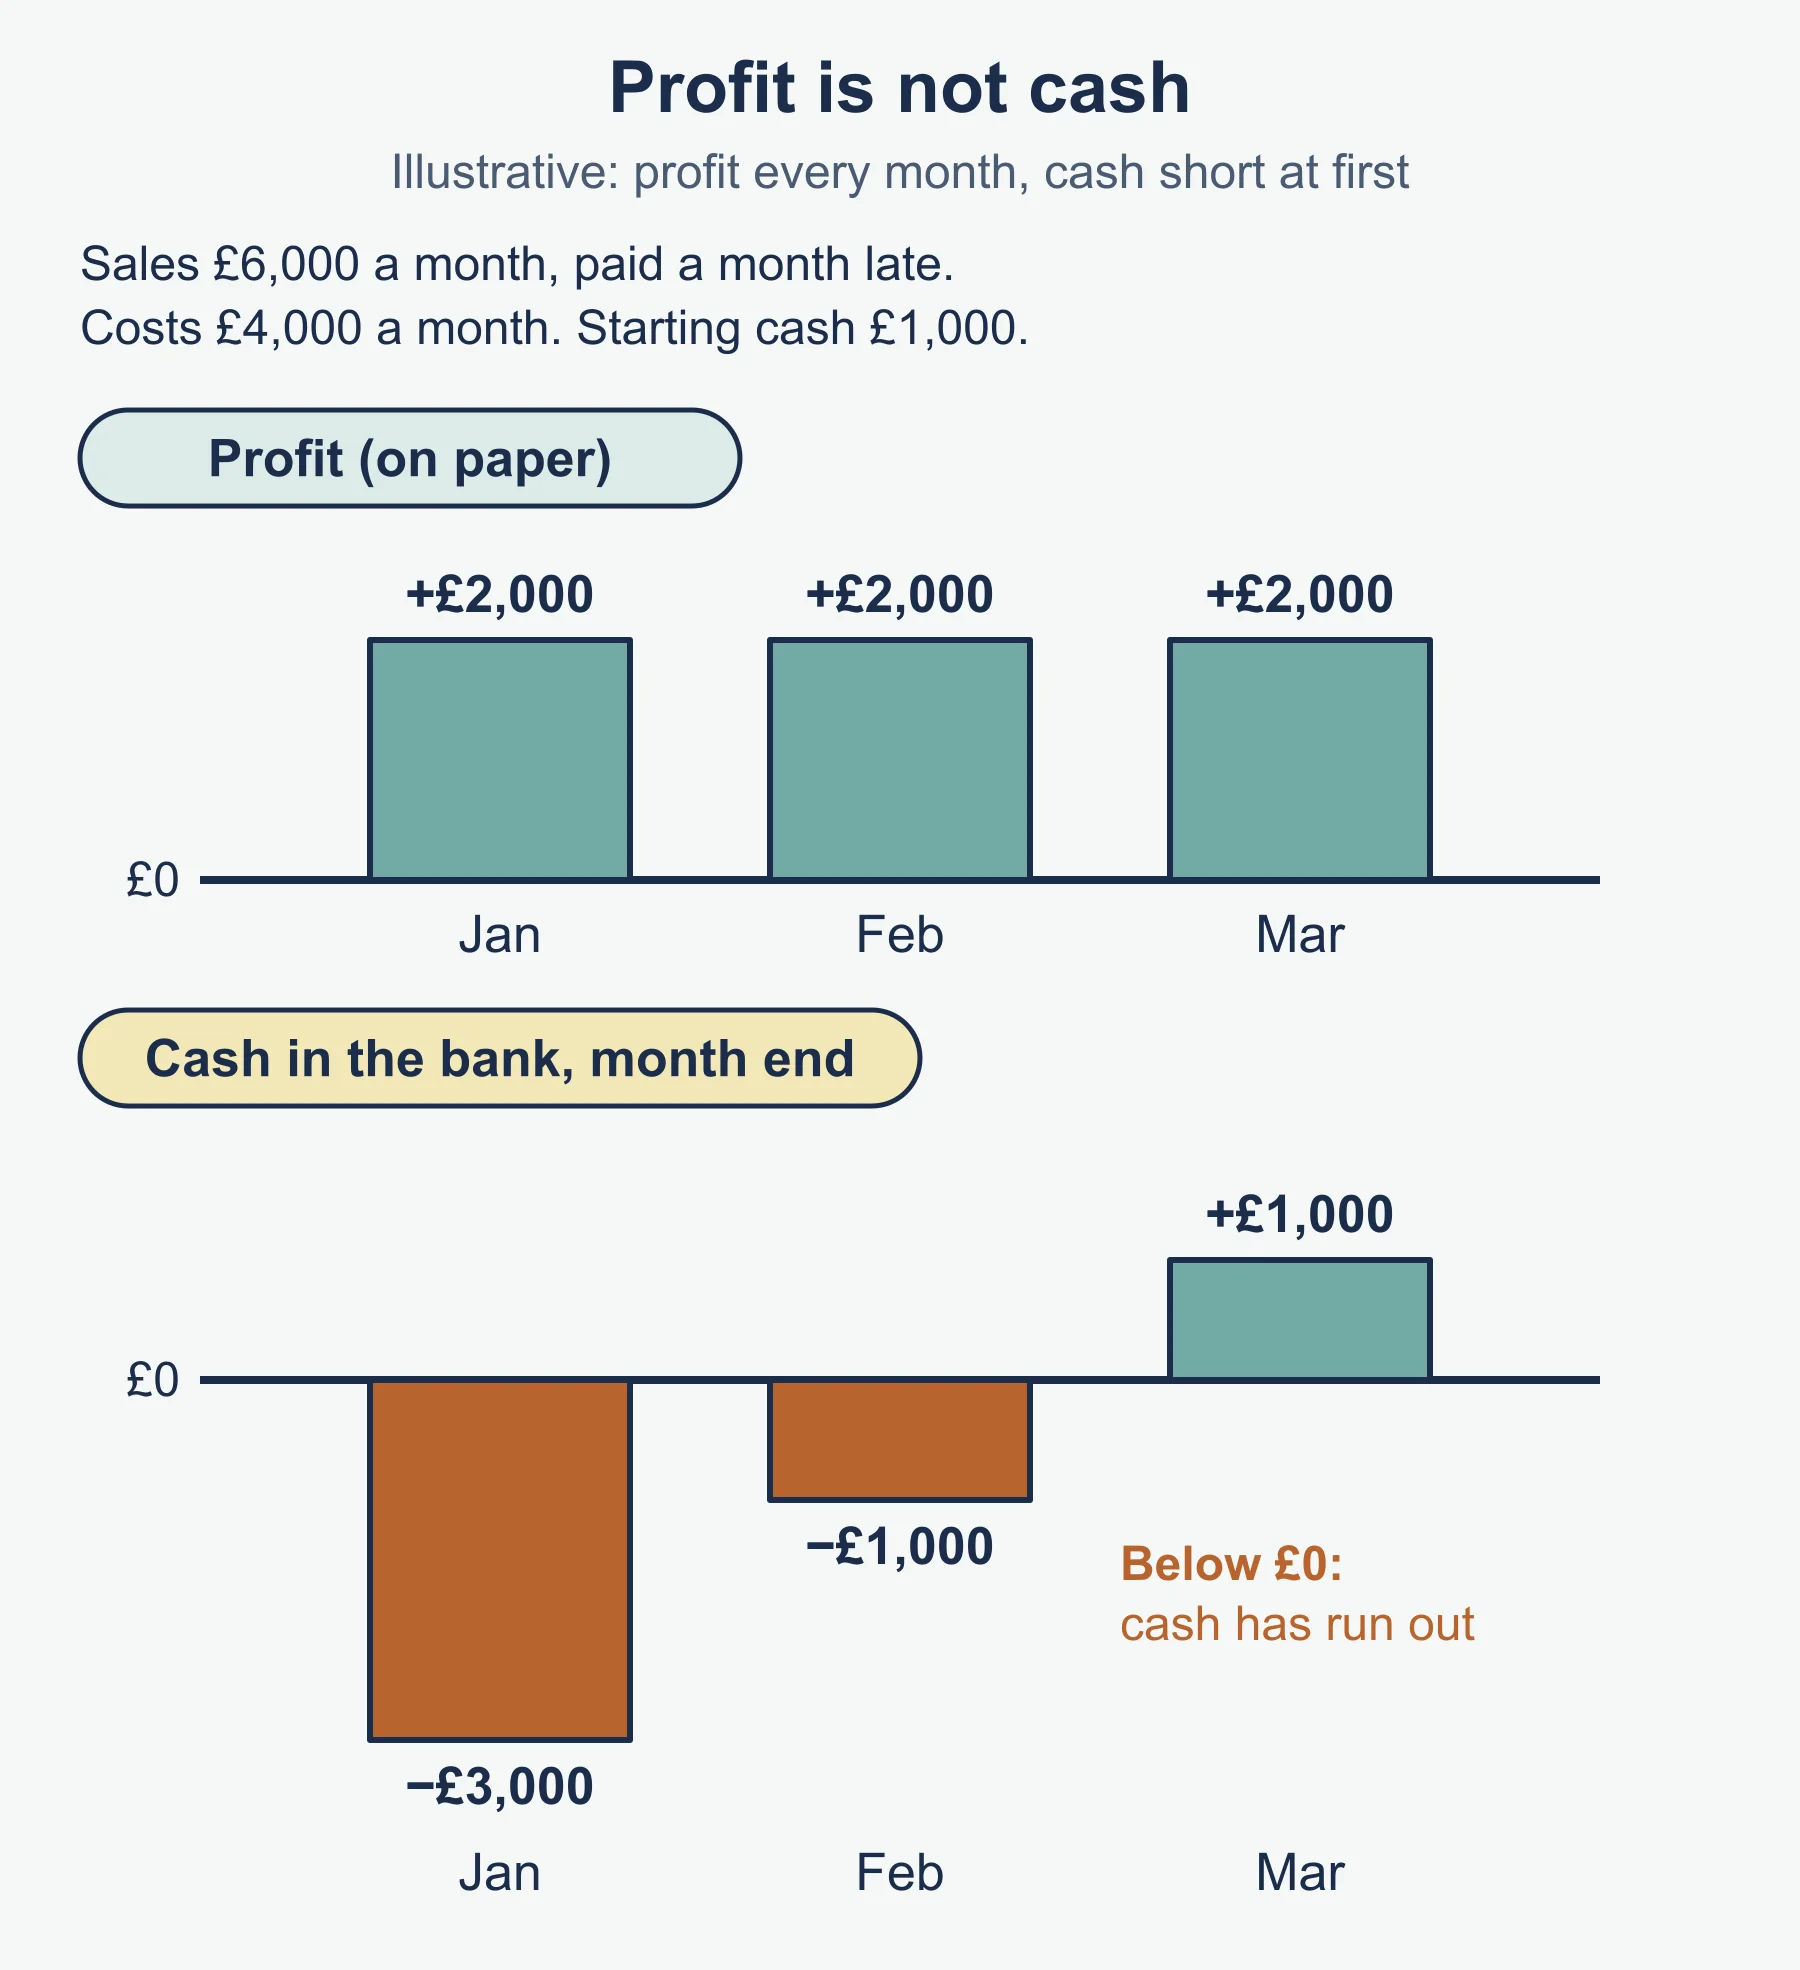
Cash is the money a business has available to spend. It provides liquidity: the ability to meet short-term debts and expenses such as wages, suppliers and bills. A business with profit on paper but no cash cannot pay these.
Cash versus profit
Profit is revenue minus costs over a period. Cash is the actual money moving in and out. They differ because of timing. A sale on credit counts as revenue when made, but the cash arrives later. Buying stock or equipment takes cash out at once, though its effect on profit is spread out.
Cash flow forecasts
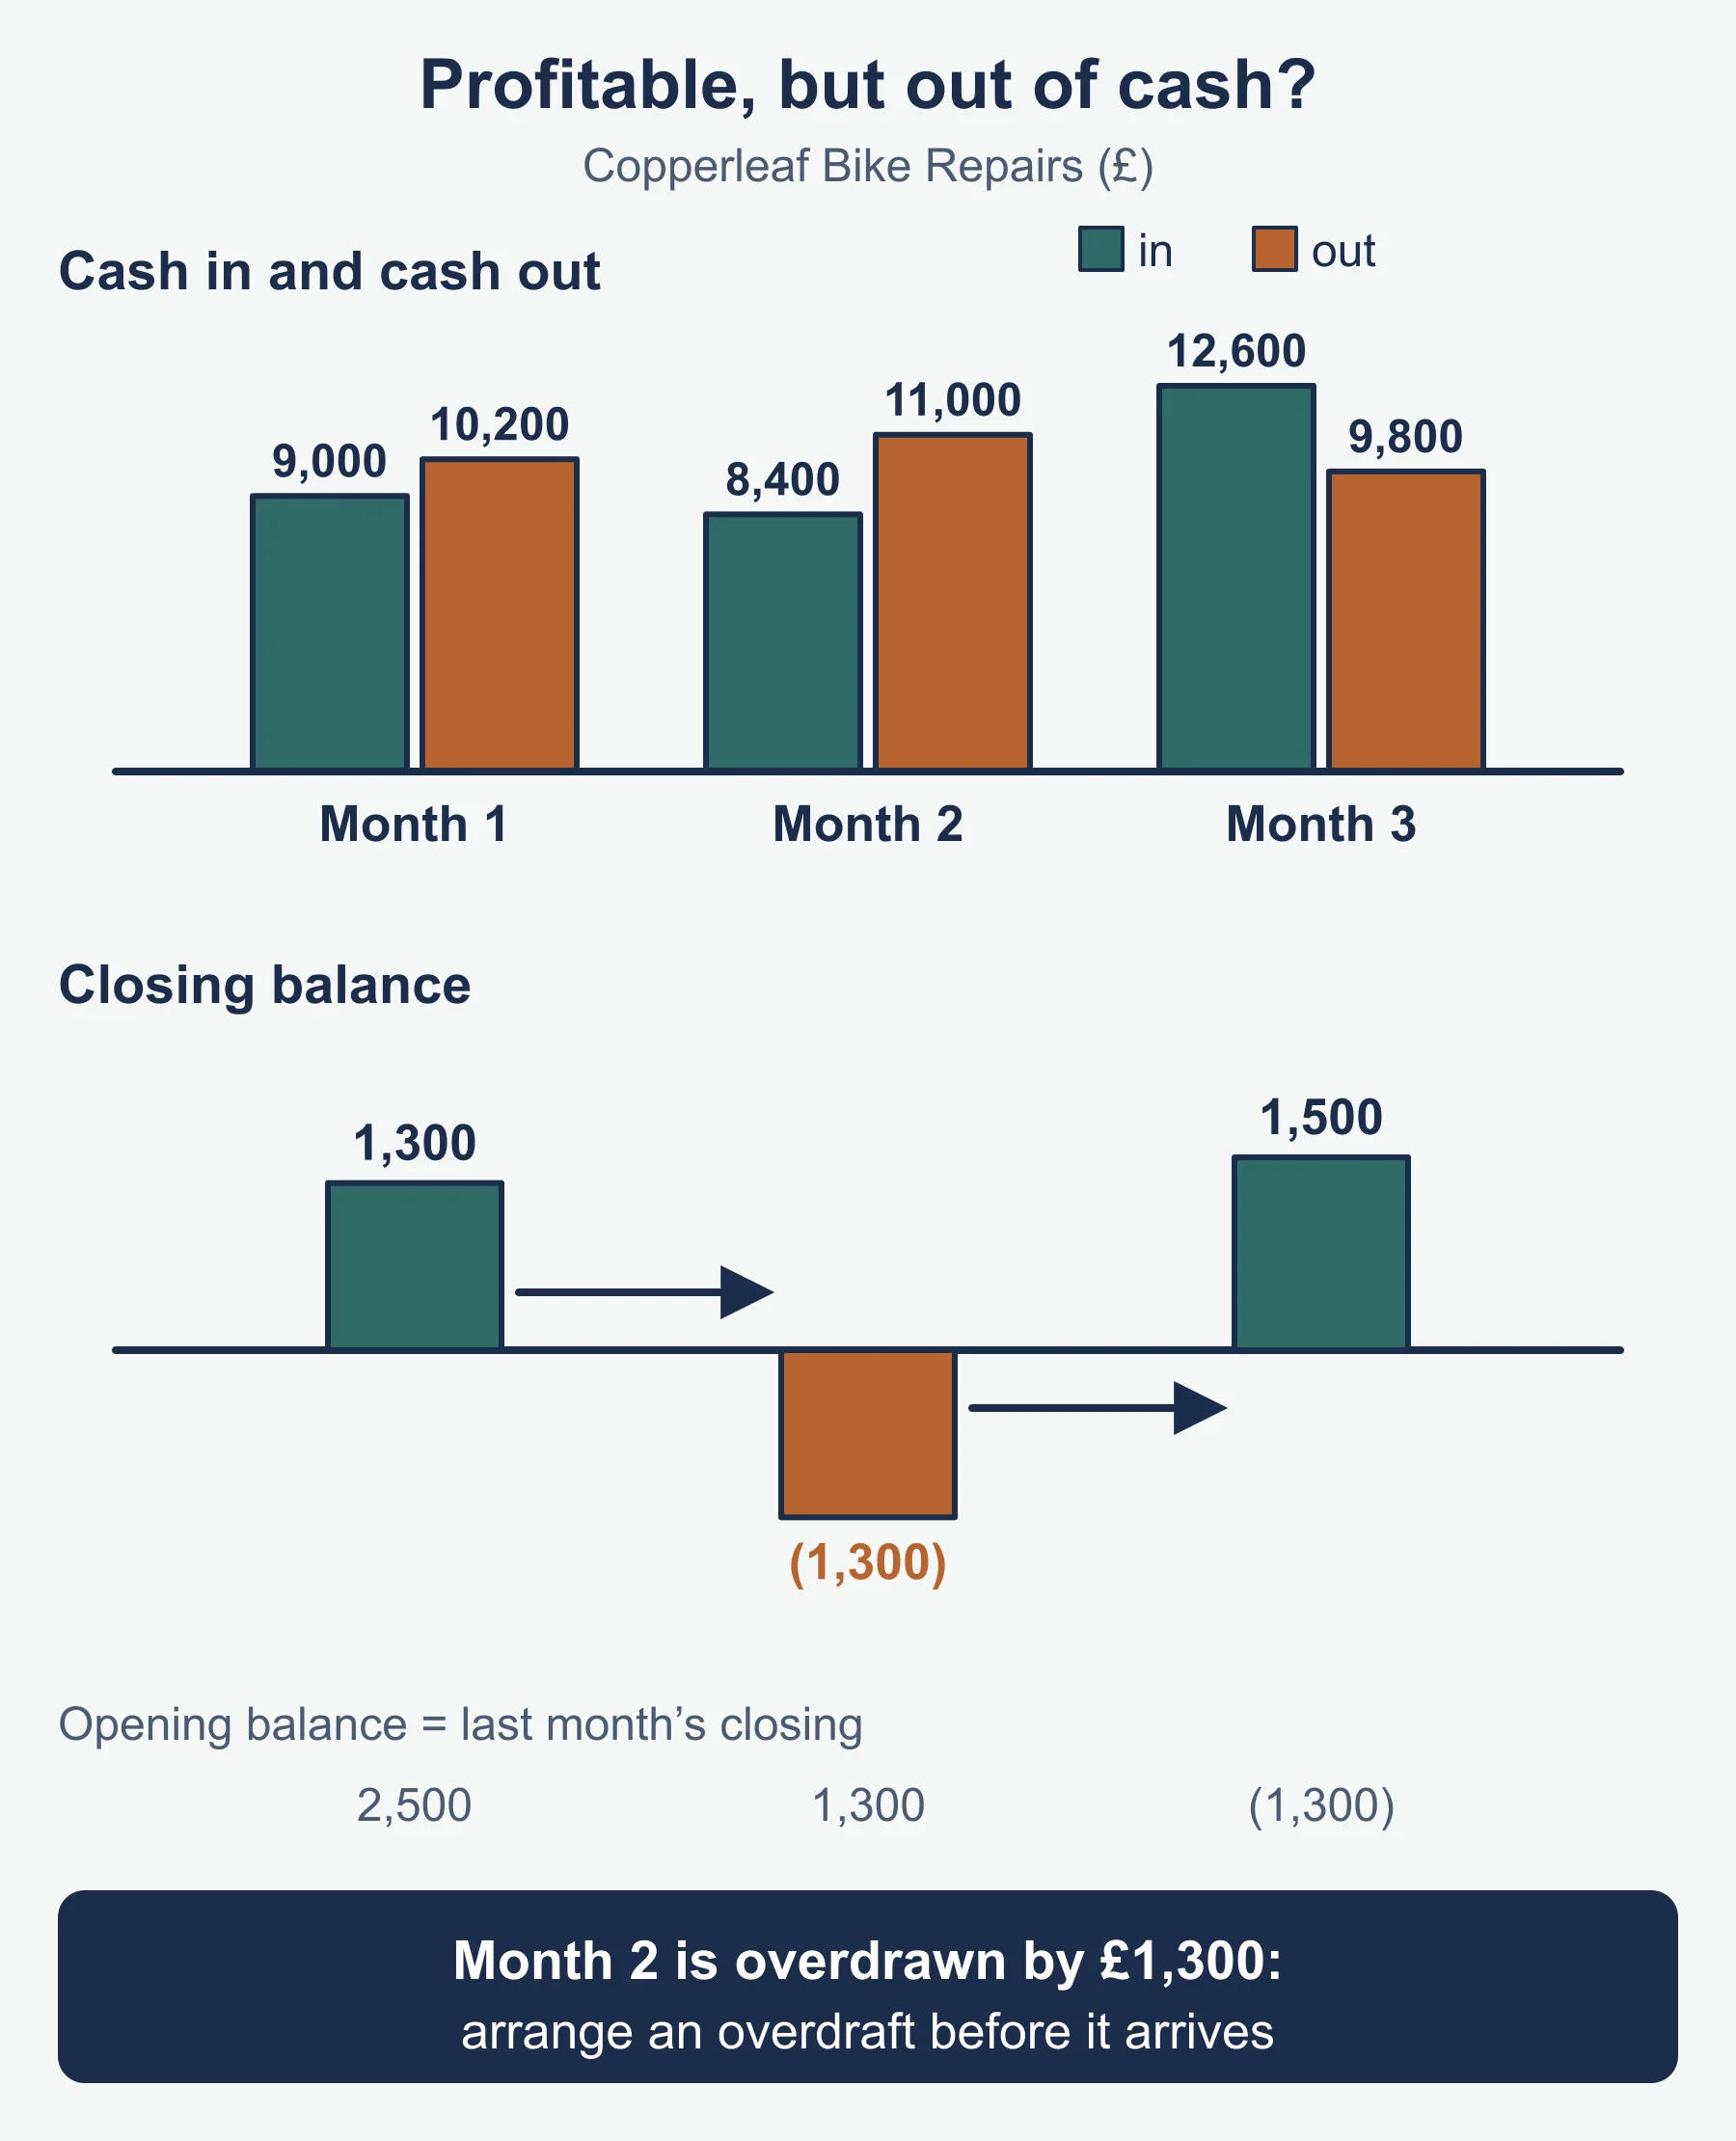
A cash flow forecast predicts money coming in and going out, usually month by month. Its usefulness: it is a planning tool, it anticipates periods of cash shortage, it enables remedies to be put in place for shortages, and it provides targets.
Layout, month by month:
- Total cash in (receipts) and total cash out (payments)
- Net cash flow = cash in − cash out
- Closing balance = opening balance + net cash flow
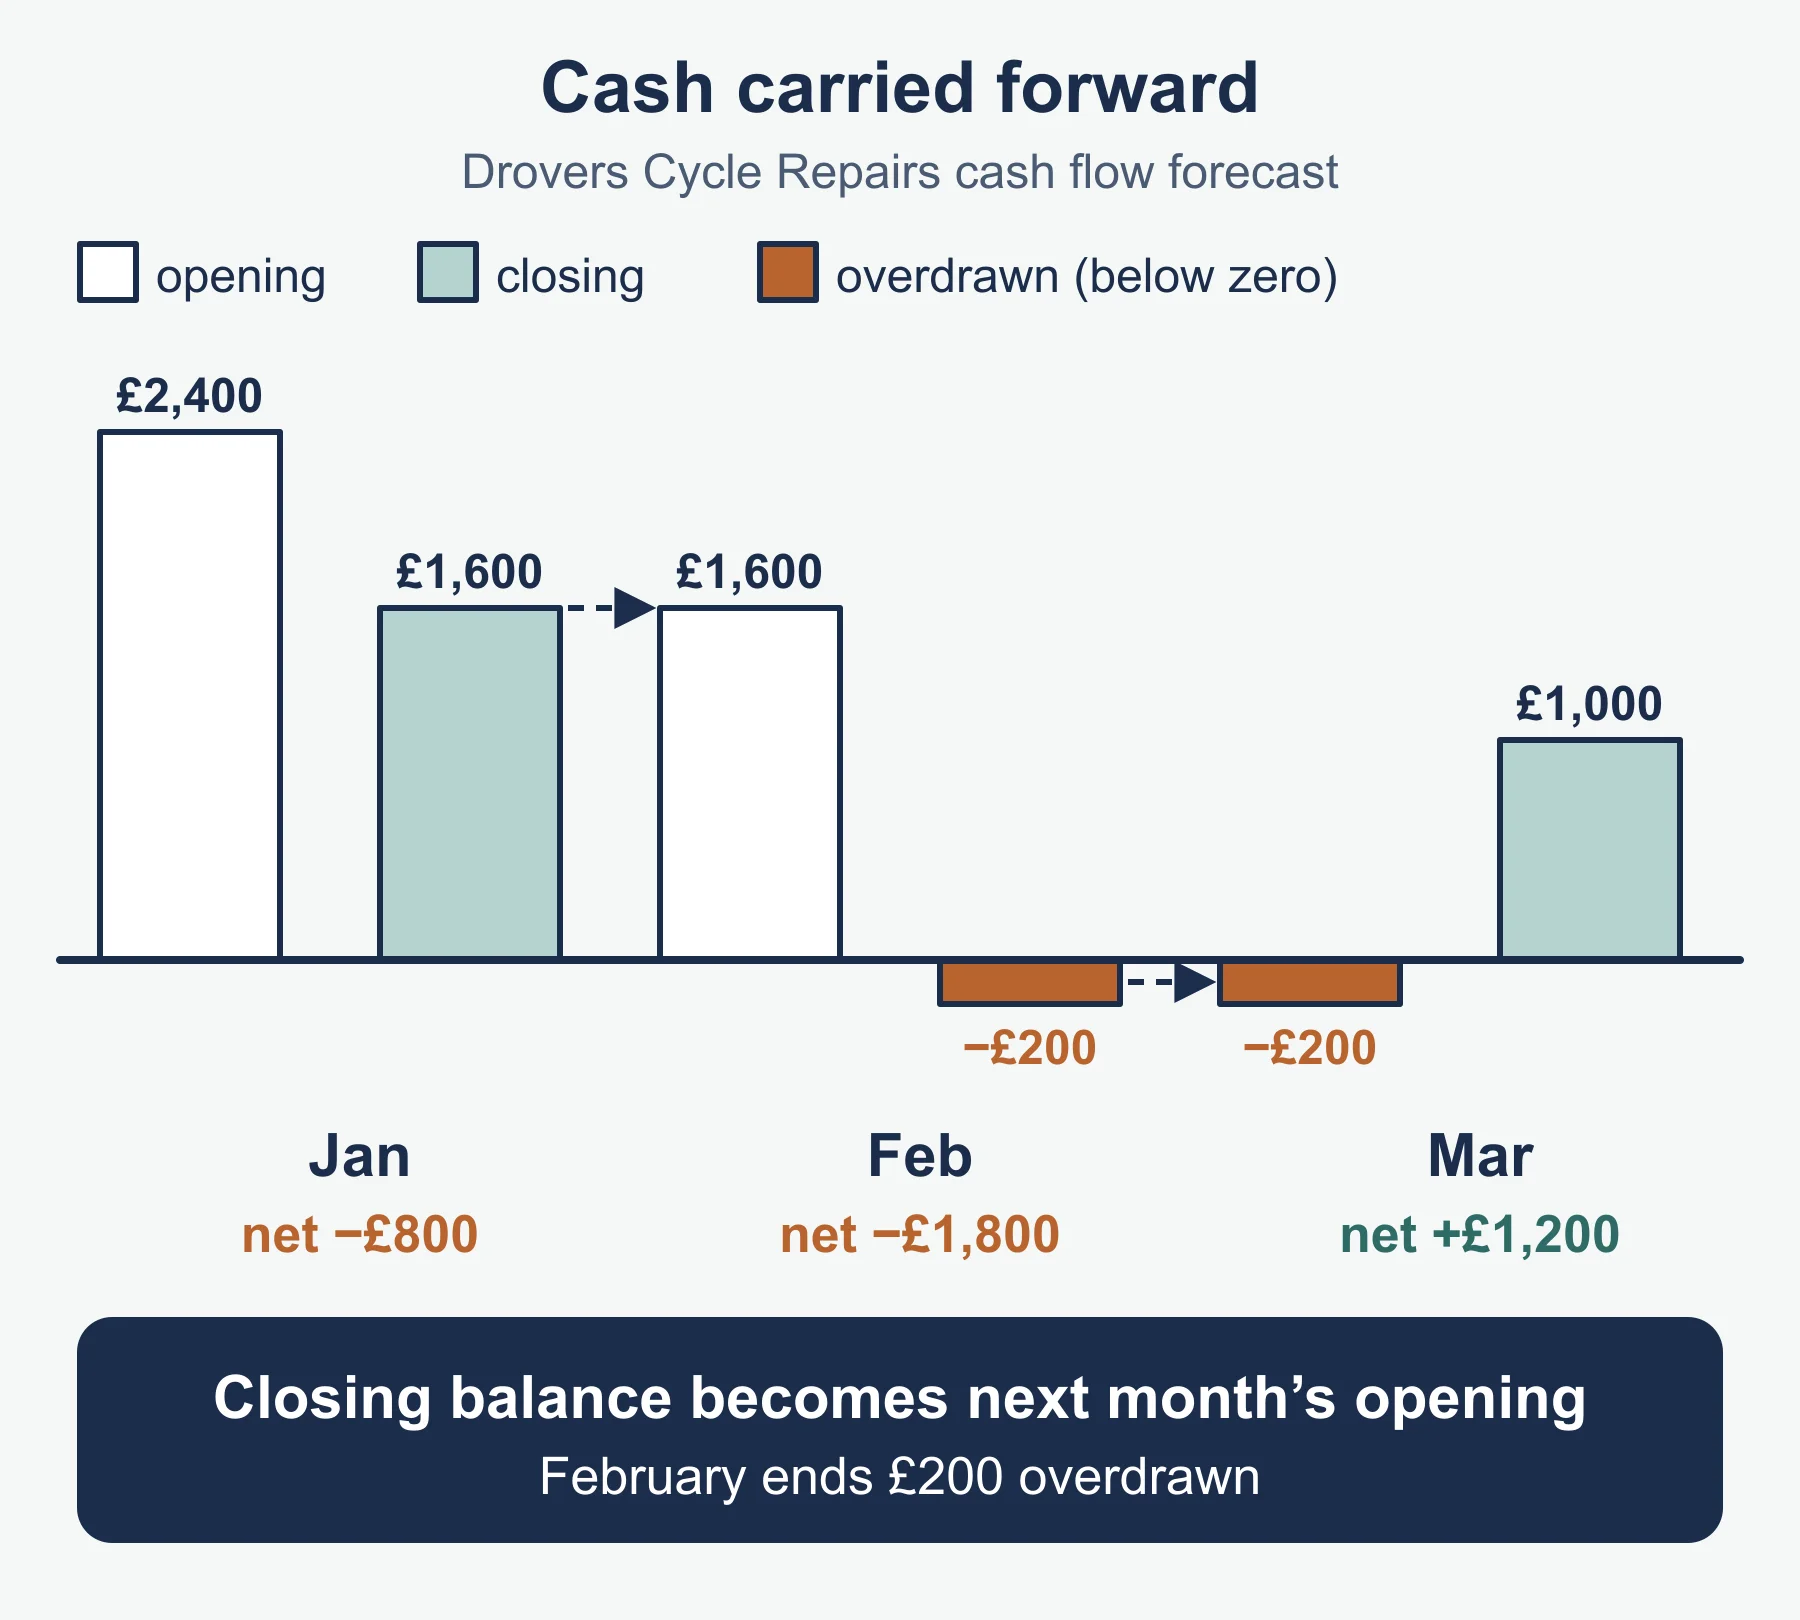
- This month’s closing balance becomes next month’s opening balance
Worked example. Drovers Cycle Repairs starts January with £2,400.
| Jan | Feb | Mar | |
|---|---|---|---|
| Opening balance | £2,400 | £1,600 | −£200 |
| Cash in | £7,800 | £6,900 | £9,500 |
| Parts and stock | £3,200 | £3,100 | £3,300 |
| Wages | £3,400 | £3,600 | £3,000 |
| Rent and bills | £2,000 | £2,000 | £2,000 |
| Total cash out | £8,600 | £8,700 | £8,300 |
| Net cash flow | −£800 | −£1,800 | £1,200 |
| Closing balance | £1,600 | −£200 | £1,000 |
February ends £200 overdrawn. Remedies include arranging an overdraft, asking suppliers for longer trade credit, chasing customers who owe money, or delaying a purchase. Because the forecast showed the problem in advance, the owner can act in time.
Common errors
- Writing “profit” when the question asks about “cash” (or the other way round).
- Using revenue instead of gross profit in the numerator of a margin.
- Forgetting to carry the closing balance forward as next month’s opening balance.
- Giving a break-even figure with no units, or dividing by selling price instead of contribution.
- Listing sources of finance without matching them to the business and need.
- Quoting ARR as a bare percentage, with no comment on what it means.
Frequently asked questions
What is the difference between fixed and variable costs? Fixed costs, such as rent, do not change as output changes in the short term. Variable costs, such as materials, rise and fall with output.
What does break-even tell a business? Break-even is the level of sales at which total costs equal total revenue, so the business makes neither a profit nor a loss. It informs marketing and planning decisions, such as whether a price or sales target is realistic.
What is liquidity? Liquidity is the ability of a business to meet its short-term debts and expenses. Cash provides liquidity, which is why a business can fail through running out of cash even when it is profitable.
Official syllabus
OCR, GCSE (9-1) in Business (J204) Specification, Version 2.0 (January 2026), section 2c, content of Business 2: operations, finance and influences on business, topic 5 Finance, and Appendix 5c, quantitative skills requirement.
Get free revision emails (optional)
Occasional emails with practice questions, worked explanations and links to free resources for the qualification and subjects you choose. No spam, and you can unsubscribe from any email. The free tools on this site never need an email.
Related resources
-
Practice questions
OCR GCSE Business: Finance (J204) – Practice Questions
Original practice questions with worked answers on Finance for OCR GCSE (9-1) Business J204: sources of finance, margins, ARR, break-even and cash flow.
Business · OCR · GCSE
Try questions -
Revision notes
OCR GCSE Business: Finance (J204) – Revision Notes
Condensed revision notes on Finance for OCR GCSE (9-1) Business J204: formulas, source-of-finance table, method steps, self-test and common errors.
Business · OCR · GCSE
Revise topic -
Study guides
OCR GCSE Business: Influences on business and The interdependent nature of business (J204)
A full study guide to ethical, environmental, economic and global influences and how business functions depend on each other, for OCR GCSE Business.
Business · OCR · GCSE
Read guide
Related articles
-
teaching
A Level tuition in Dubai: Cambridge or Pearson Edexcel International A Level?
Schools in Dubai and Abu Dhabi teach either Cambridge International AS & A Level or Pearson Edexcel International A Level. How the two are structured, why it matters for tuition, and how online classes from Lahore work.
9 October 2026
-
curriculum guides
Choosing subjects at IGCSE and A Level
How subject choices at 14 and 16 affect university options later, and how to keep pathways open without overloading a timetable.
28 July 2026
Studying this with a teacher
Working through Business GCSE?
This page is free and stays free. If you would rather be taught it, Marlbridge runs Business classes one-to-one, online in your own time zone. One-to-one only for this course: Rs 6,000 per class in Pakistan, with other currencies on the fees page. The first trial class is free. WhatsApp replies within an hour (8am–11pm Pakistan time, every day); email the same day.
OCR Business teachers at Marlbridge
