Revision Notes
OxfordAQA IGCSE Accounting: Accounting ratios and financial measures (9215) – Revision Notes
Condensed formulae, method steps, interpretation cues and a ten-question self-test on the nine ratios in OxfordAQA International GCSE Accounting 9215.
- Subject
- Accounting
- Level
- IGCSE
- Topic
- Interpretation, analysis and communication of financial information
- Author
- Marlbridge Academic Team
- Updated
- Reviewed by
- Javaid Iqbal Sabri (what this means)
Aligned to OxfordAQA IGCSE Accounting (9215), First teaching 2024, first examined 2026. Official specification .
Syllabus page (what it covers and how it is assessed): OxfordAQA IGCSE Accounting.
Syllabus points this page covers
9215
- Accounting ratios and financial measures
Found an error? Report a correction.
Need help with this topic? Request a free trial class for IGCSE Accounting (9215).
These notes are aligned to the OxfordAQA International GCSE Accounting (9215) specification, version 1.2, exams from May/June 2026 onwards. They condense the section 3.5 content on the calculation and interpretation of financial measures and ratios, with short reminders on appraisal, cash and profit, and limitations. All amounts are in dollars.
For full explanations and a worked example, read the study guide. To test yourself, use the practice questions. Other links: course hub, checklist and the free diagnostics.
The specification says the formulae are in an OxfordAQA guide, “Formulae for accounting ratios”. The forms below are the standard forms. Learn the board’s own versions from that guide and use them if they differ.
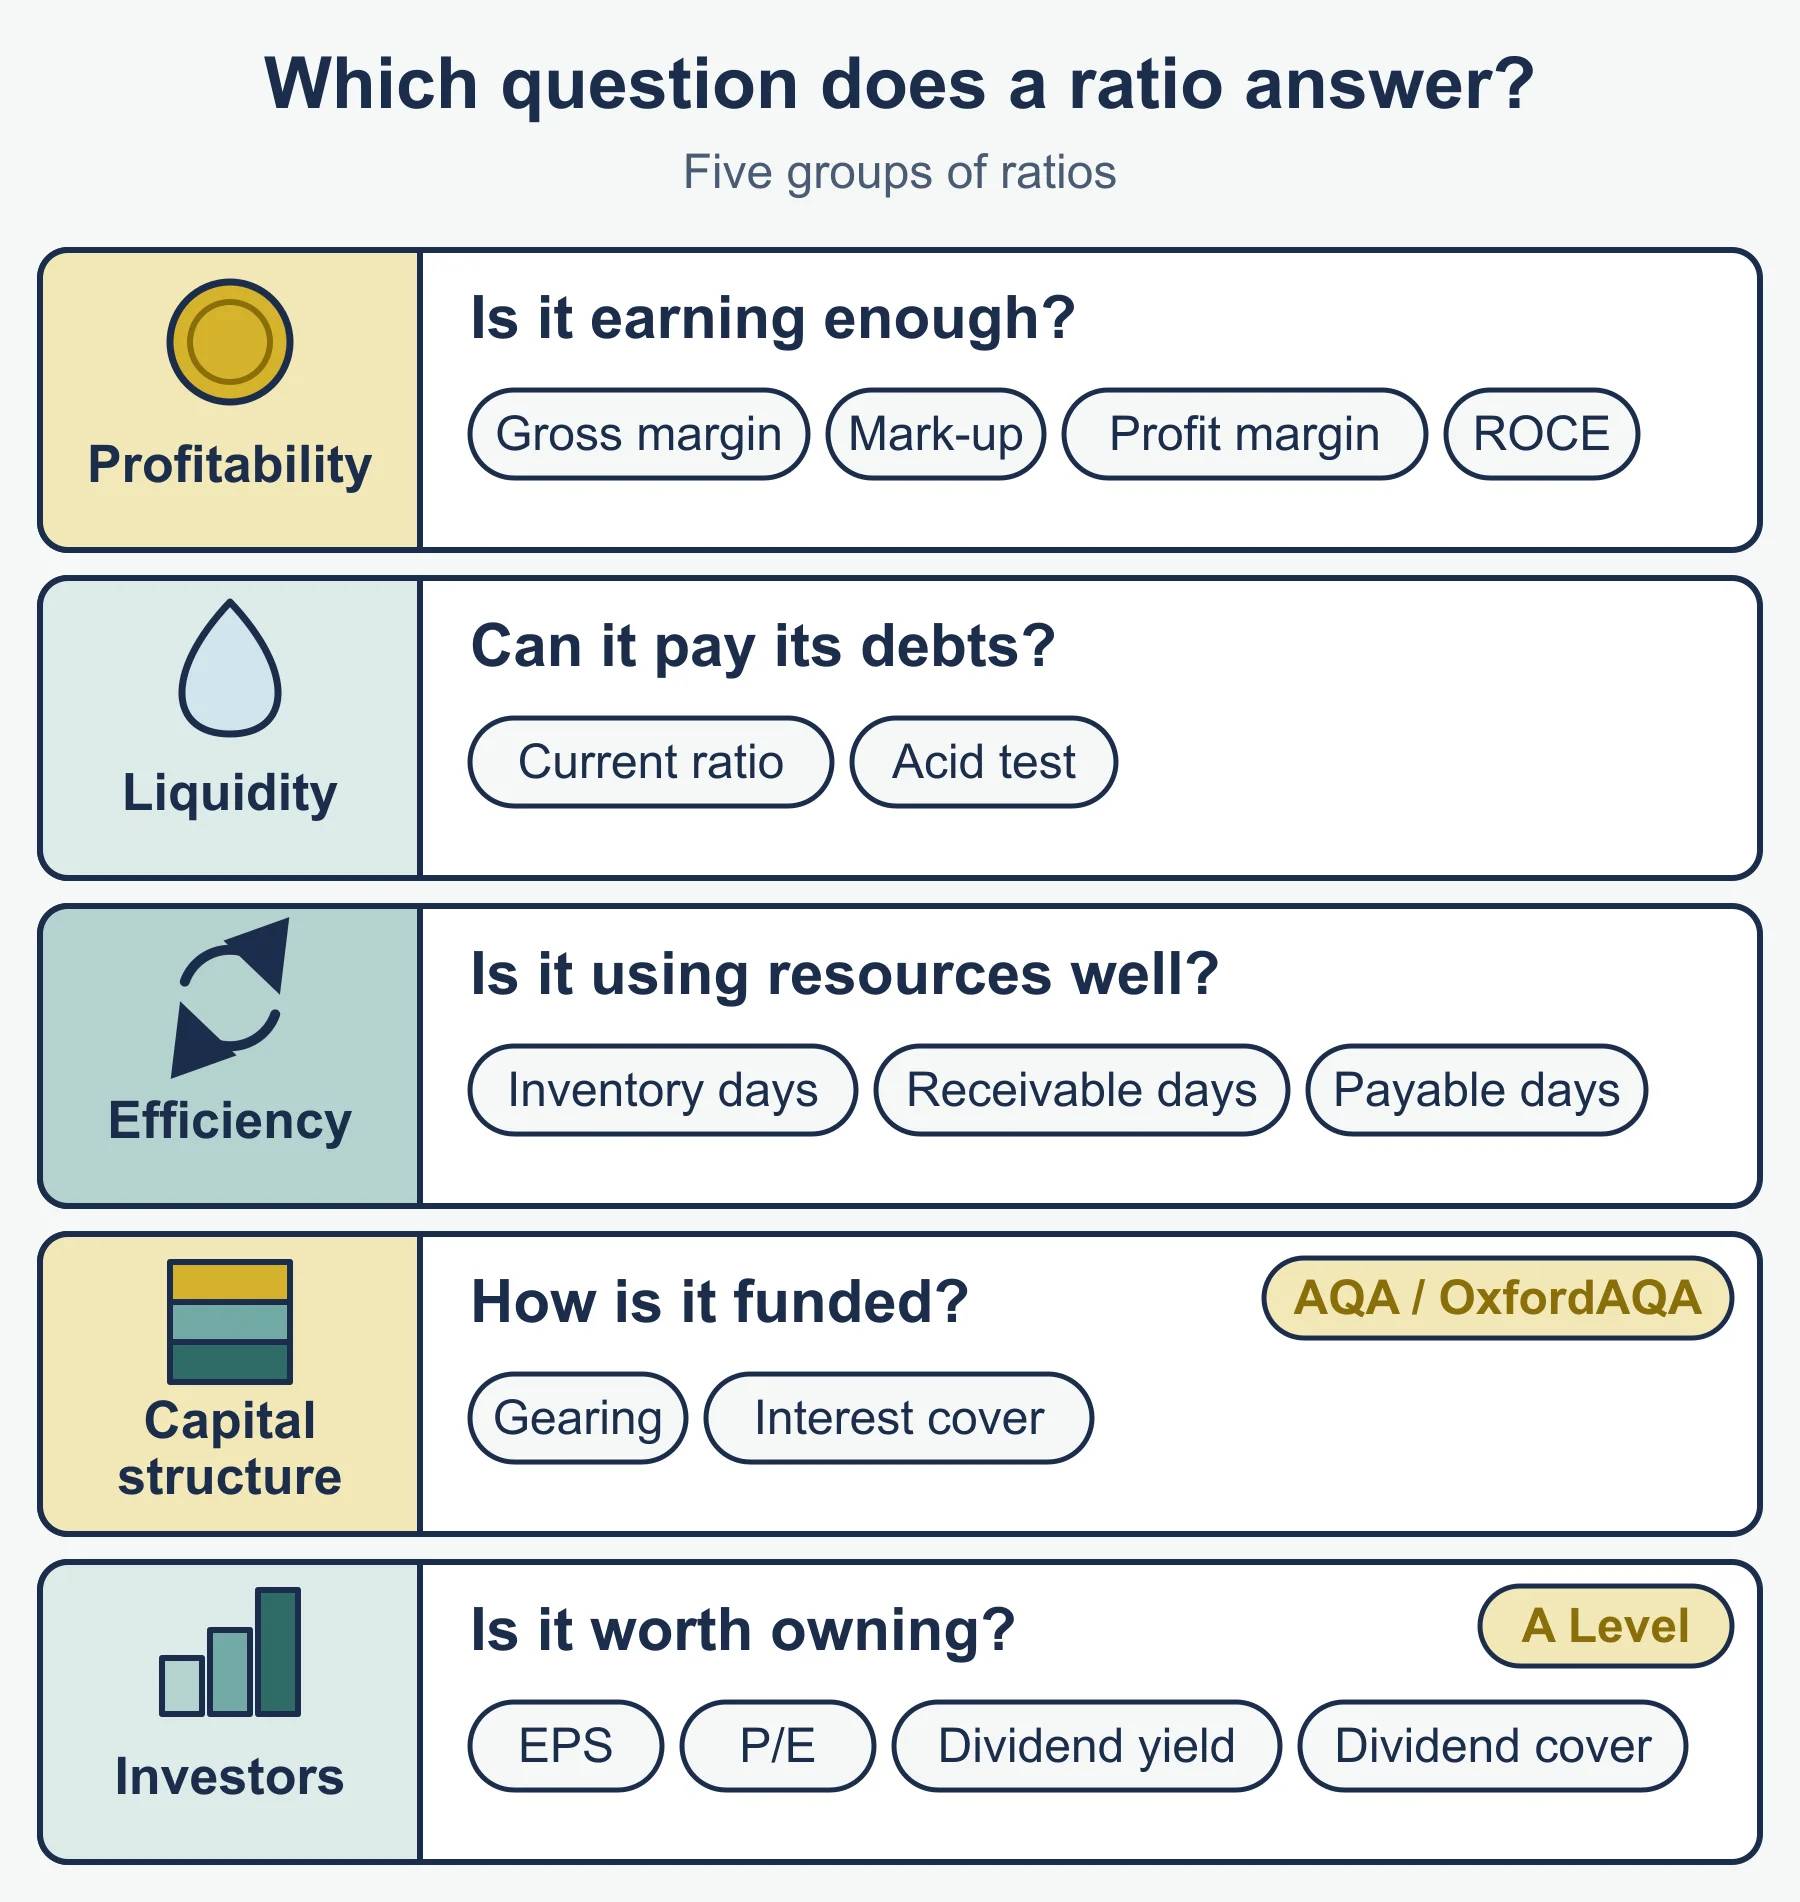
The nine measures: formulae and units
| Measure | Standard form | Answer given as |
|---|---|---|
| Gross profit margin % | gross profit / revenue x 100 | percentage |
| Markup % | gross profit / cost of sales x 100 | percentage |
| Rate of inventory turnover | cost of sales / average inventory | times per year |
| Profit in relation to revenue % | profit from operations / revenue x 100 | percentage |
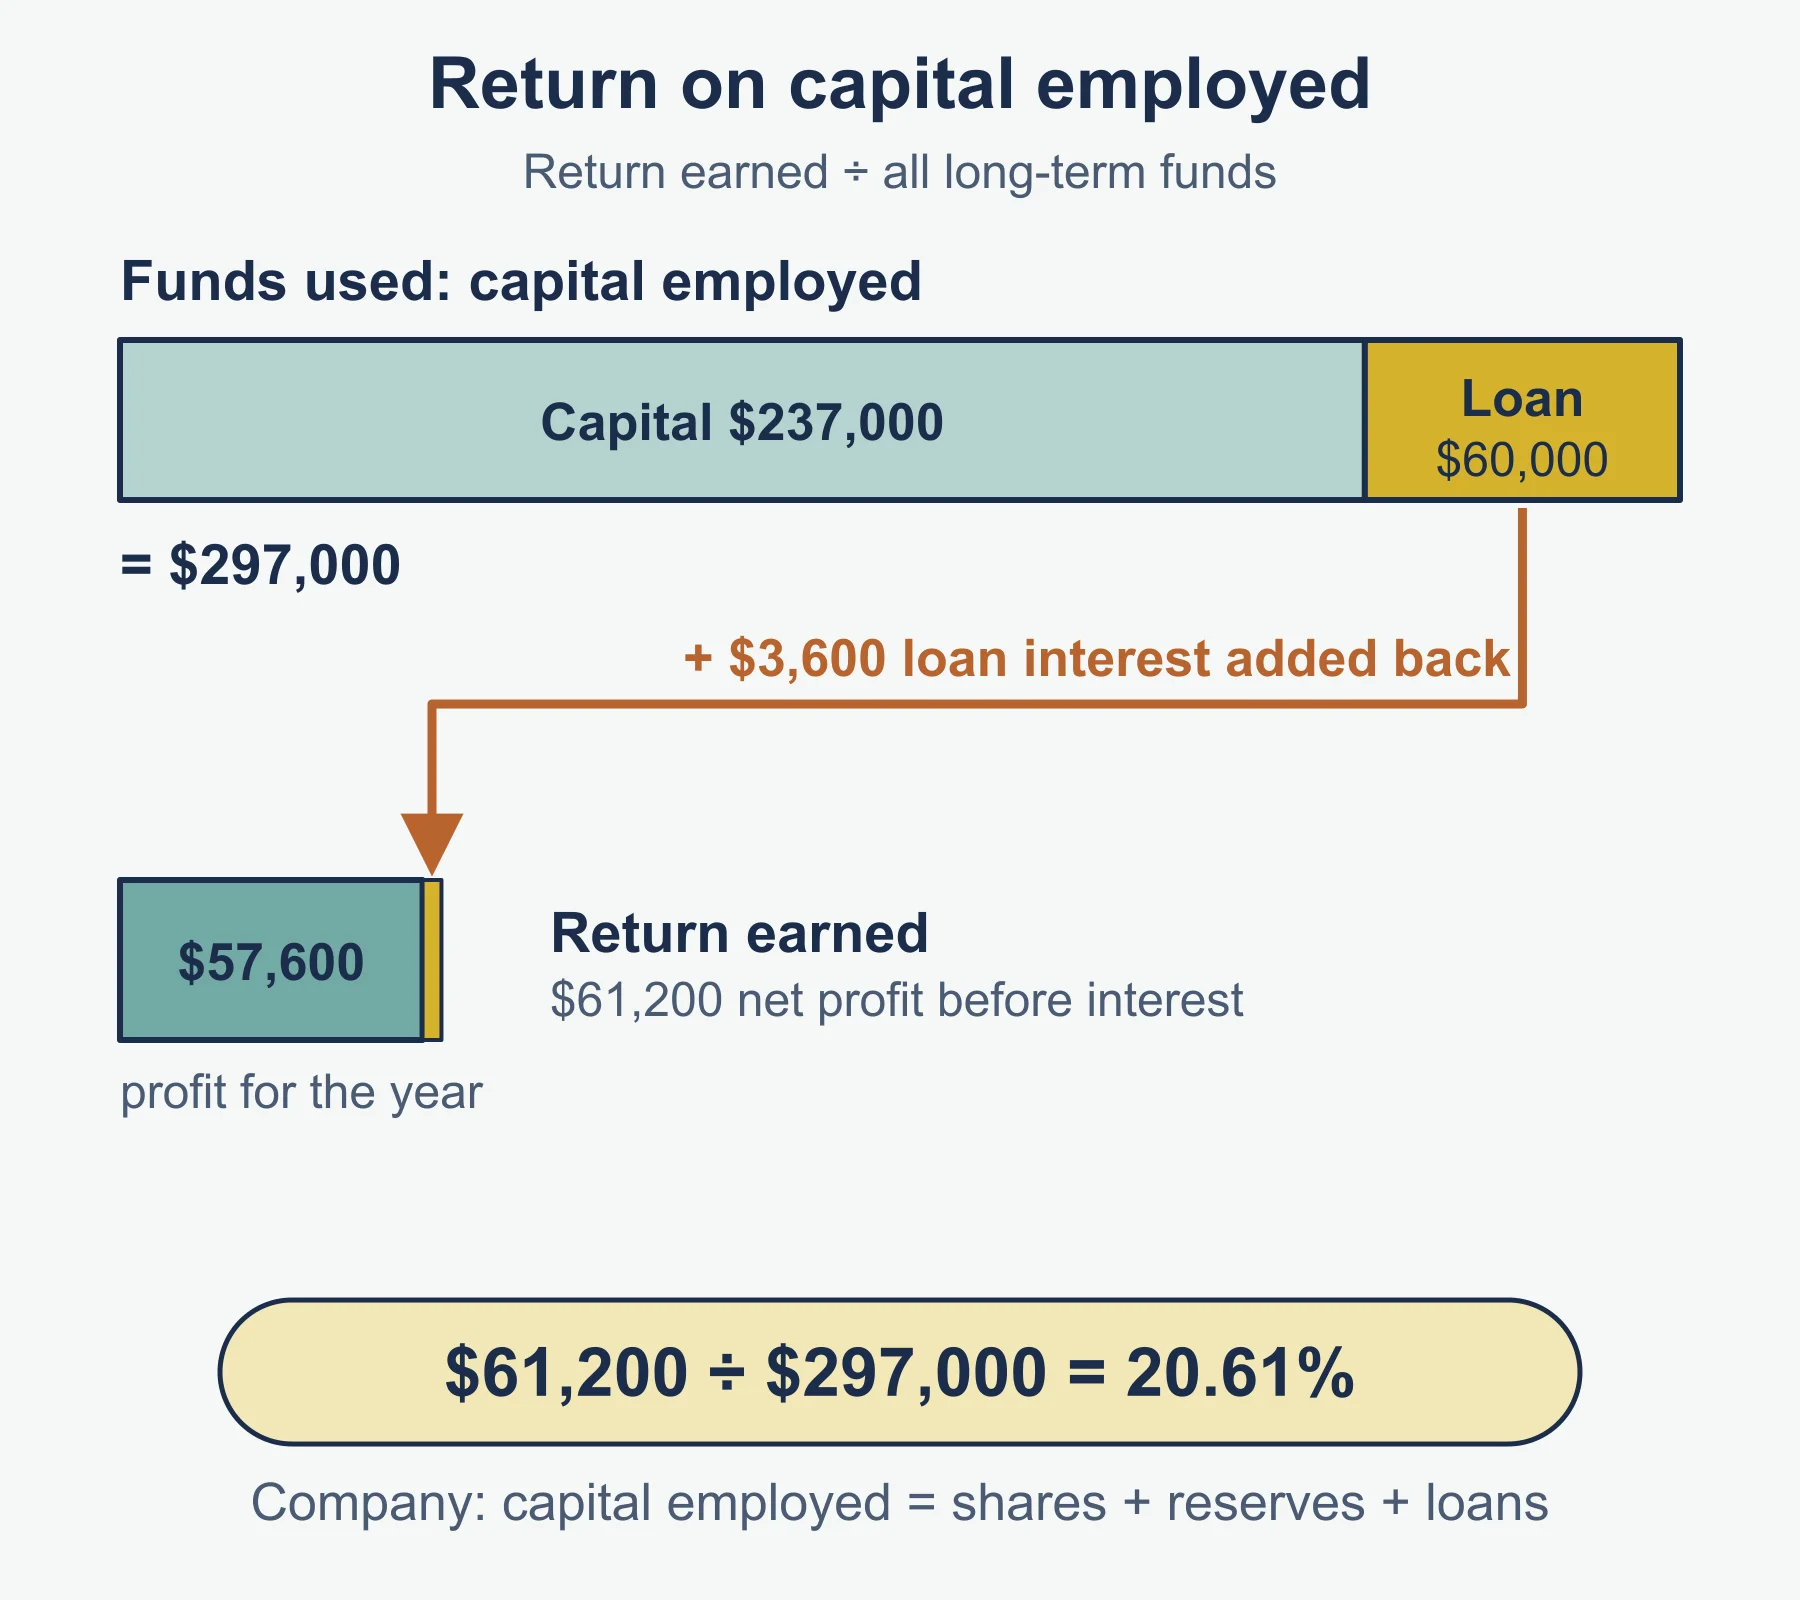
| Return on capital employed % | profit from operations / capital employed x 100 | percentage |
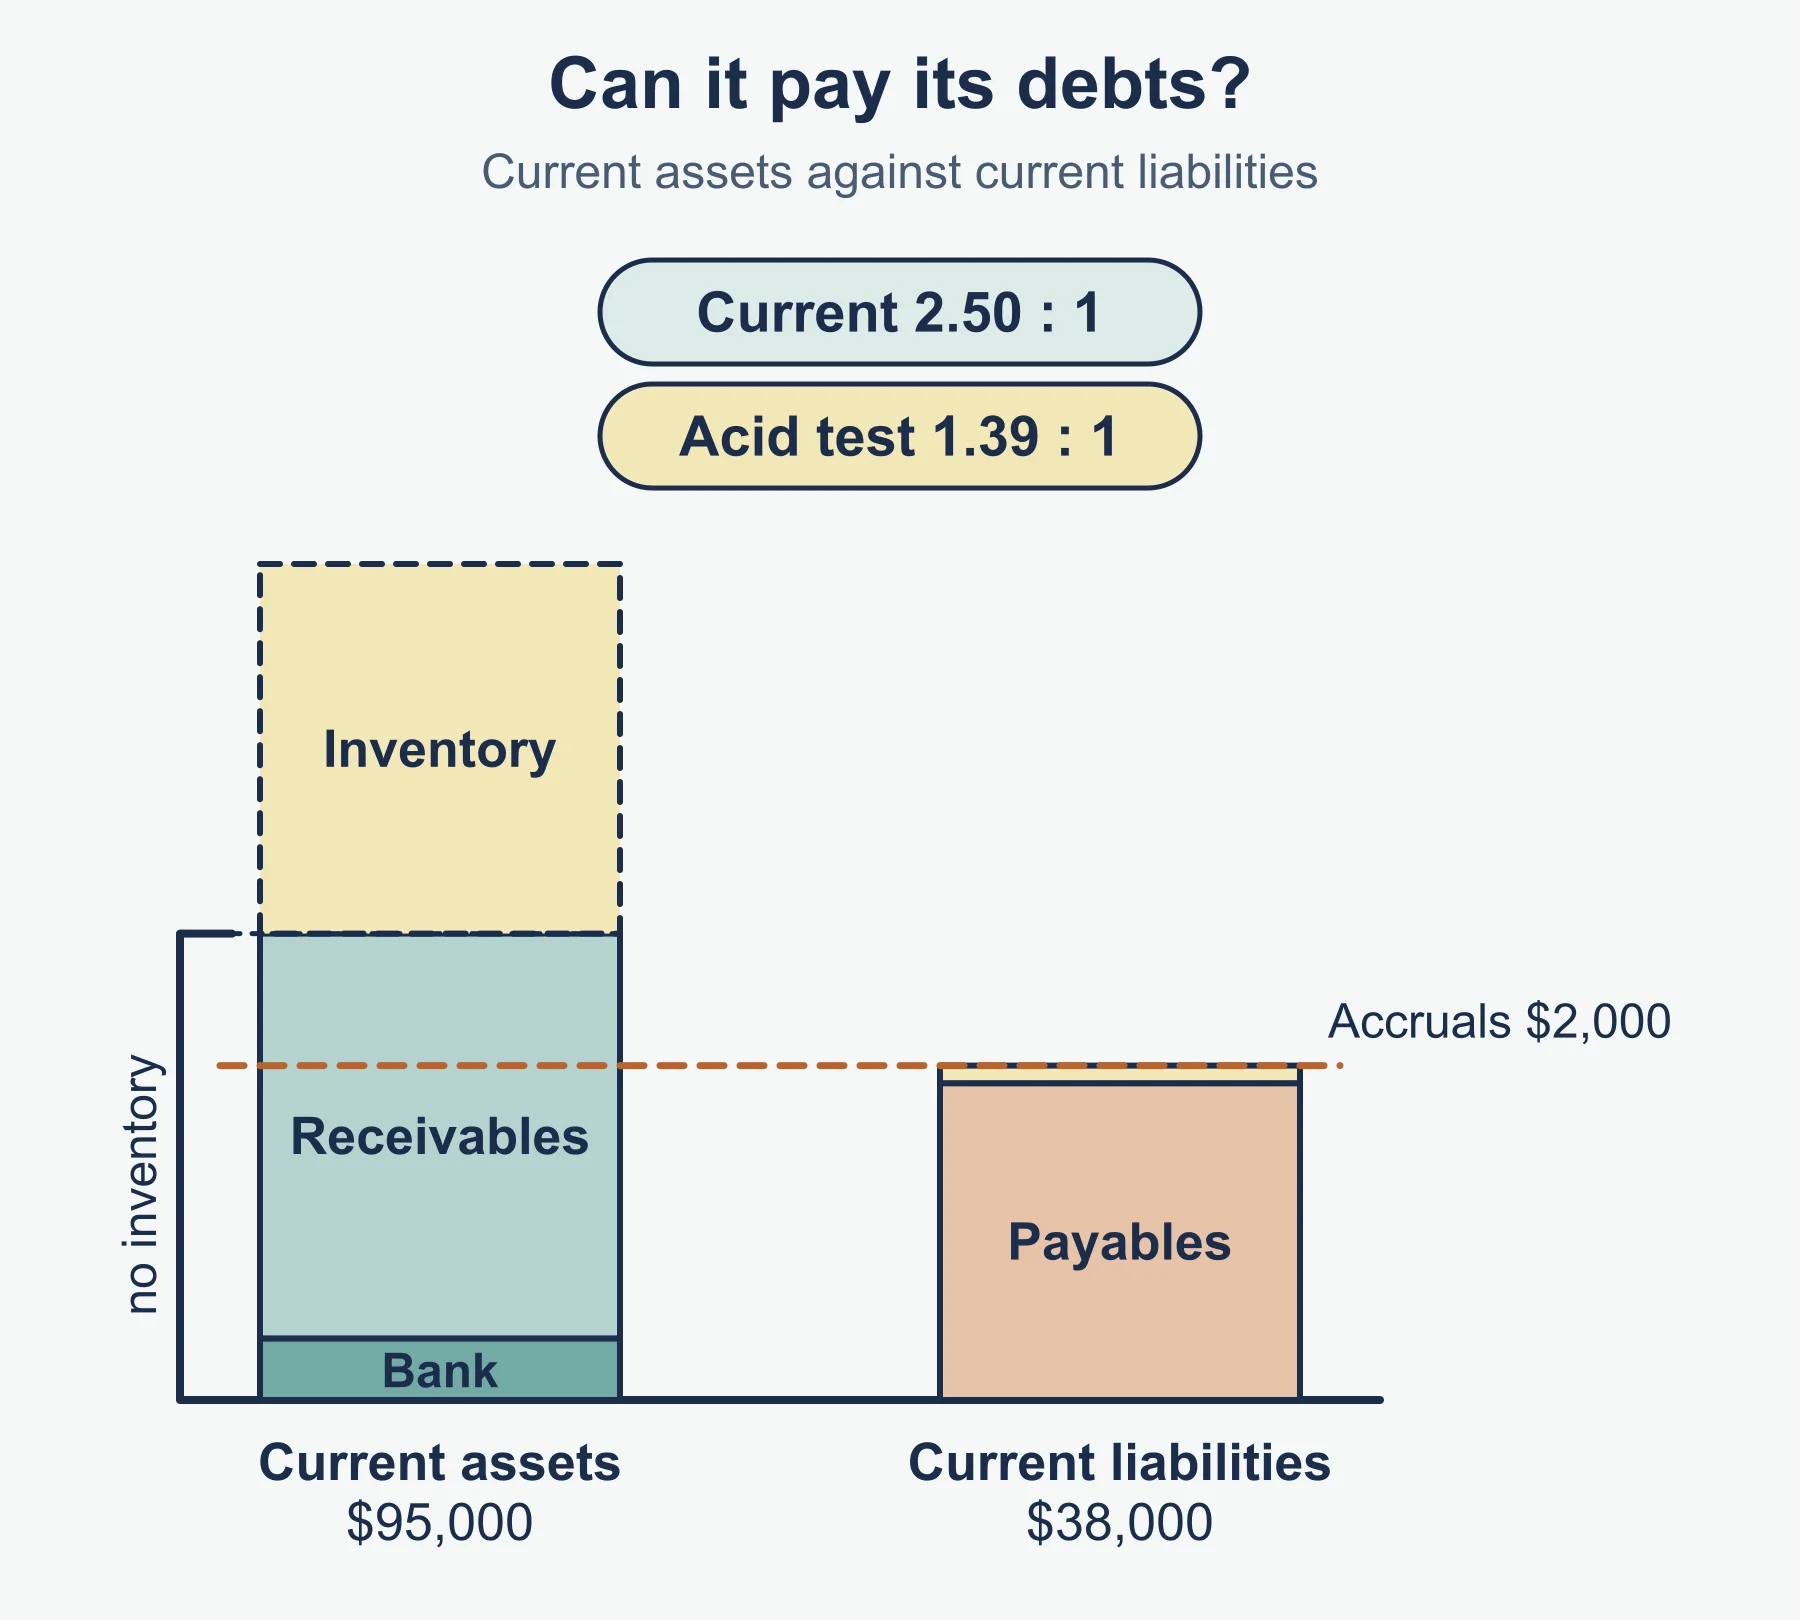
| Current ratio | current assets : current liabilities | ratio, for example 2 : 1 |
| Liquid capital ratio | (current assets - inventory) : current liabilities | ratio |
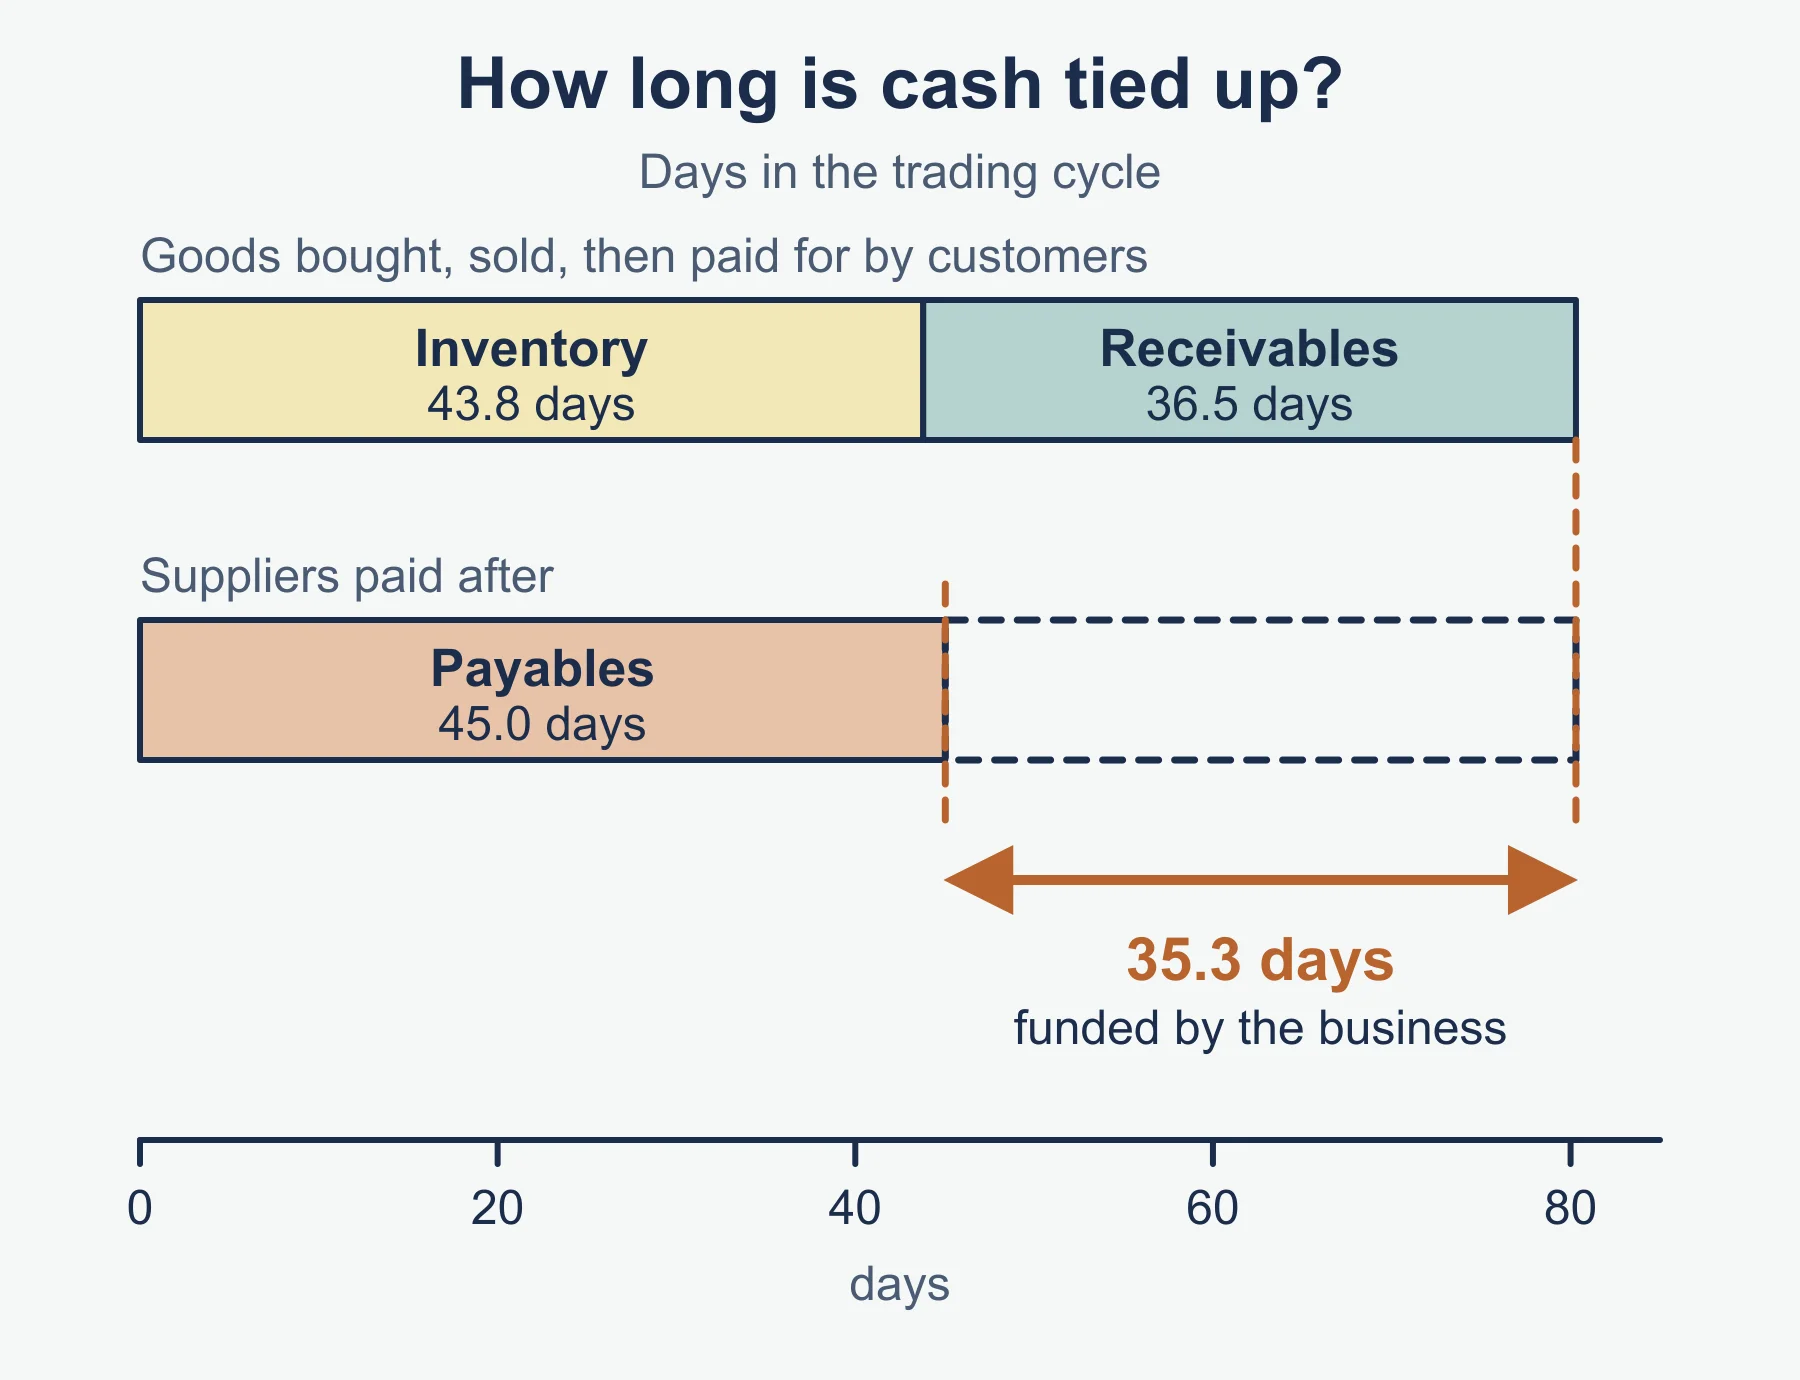
| Trade receivable days | trade receivables / credit revenue x 365 | days |
| Trade payable days | trade payables / credit purchases x 365 | days |
Building blocks
- Cost of sales = opening inventory + purchases - closing inventory.
- Gross profit = revenue - cost of sales.
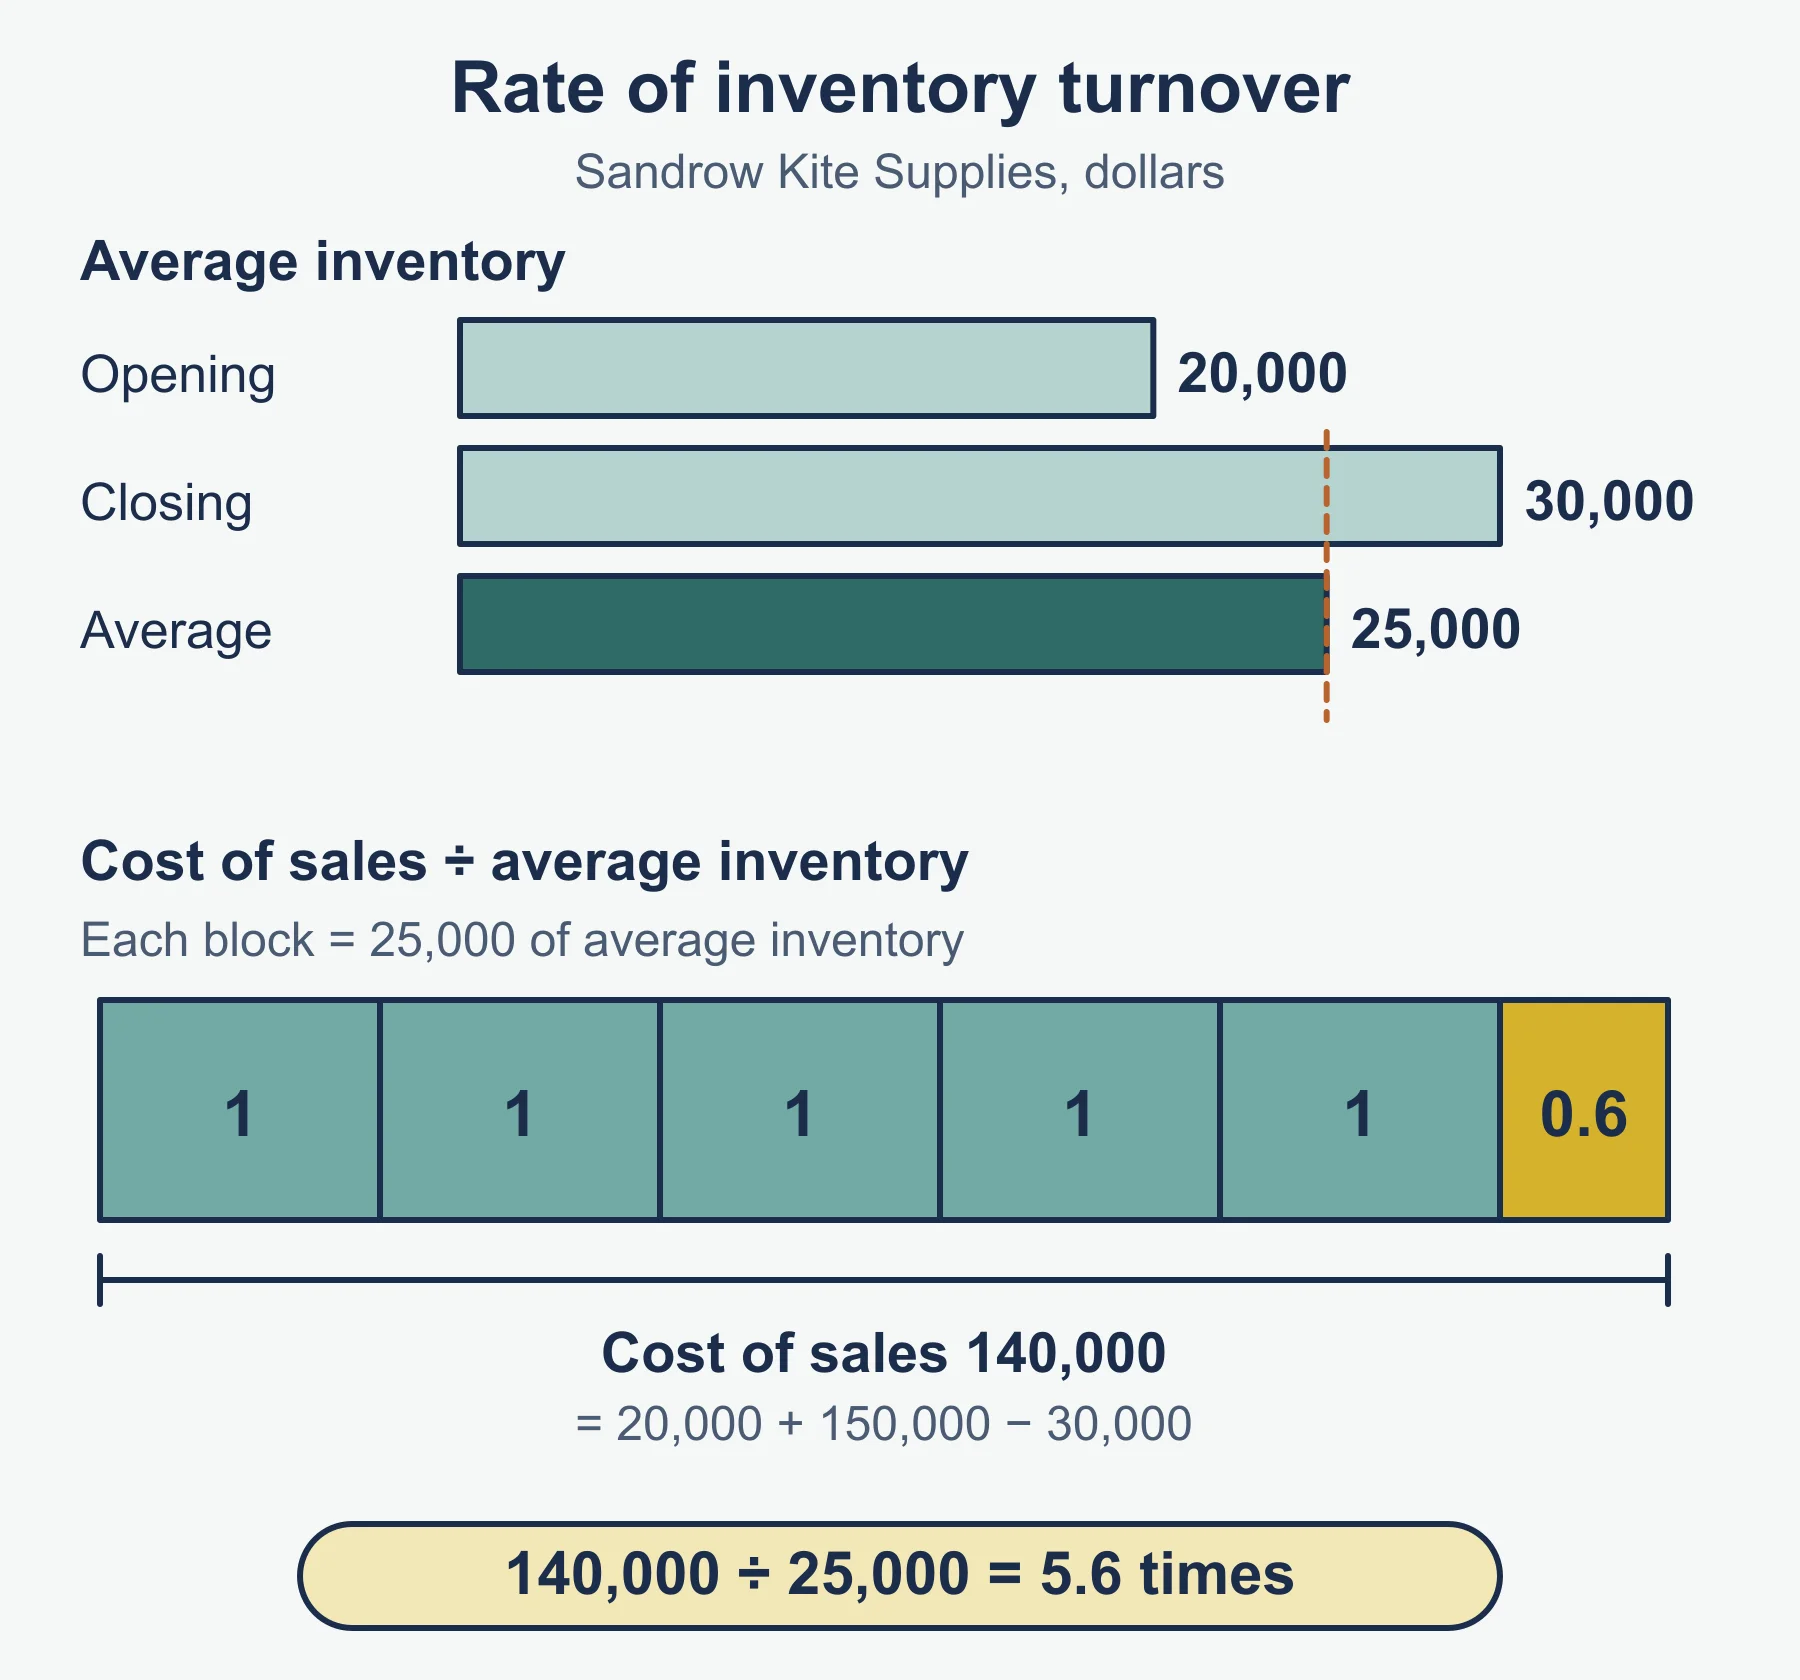
- Average inventory = (opening + closing) / 2.
- Profit from operations = gross profit - operating expenses, before loan interest.
- Profit for the year = profit from operations - loan interest.
- Capital employed = total assets - current liabilities = equity + non-current liabilities.
Method in steps
- Write the formula first.
- Pick the right figures. Mark which are from the income statement and which are from the statement of financial position.
- Work out any building block you need, such as cost of sales or capital employed.
- Substitute and calculate. Show the working.
- Give the unit: percentage, times, days or ratio.
- If asked to comment, compare with something and give a reason.
Worked reminder: Thornsby Stationers
Revenue 96,000 (73,000 on credit). Cost of sales 72,000, from opening inventory 11,000, purchases 74,000 (43,800 on credit) and closing inventory 13,000. Profit from operations 18,500, loan interest 500. Non-current assets 58,000. Current assets: inventory 13,000, trade receivables 15,000, bank 4,000. Current liabilities: trade payables 6,000 and other payables 10,000.
| Measure | Working | Result |
|---|---|---|
| Gross profit | 96,000 - 72,000 | 24,000 |
| Gross profit margin | 24,000 / 96,000 x 100 | 25.0% |
| Markup | 24,000 / 72,000 x 100 | 33.3% |
| Rate of inventory turnover | 72,000 / 12,000 | 6.0 times |
| Profit in relation to revenue | 18,500 / 96,000 x 100 | 19.3% |
| Capital employed | 58,000 + 32,000 - 16,000 | 74,000 |
| Return on capital employed | 18,500 / 74,000 x 100 | 25.0% |
| Current ratio | 32,000 : 16,000 | 2.0 : 1 |
| Liquid capital ratio | 19,000 : 16,000 | 1.19 : 1 |
| Receivable days | 15,000 / 73,000 x 365 | 75 days |
| Payable days | 6,000 / 43,800 x 365 | 50 days |
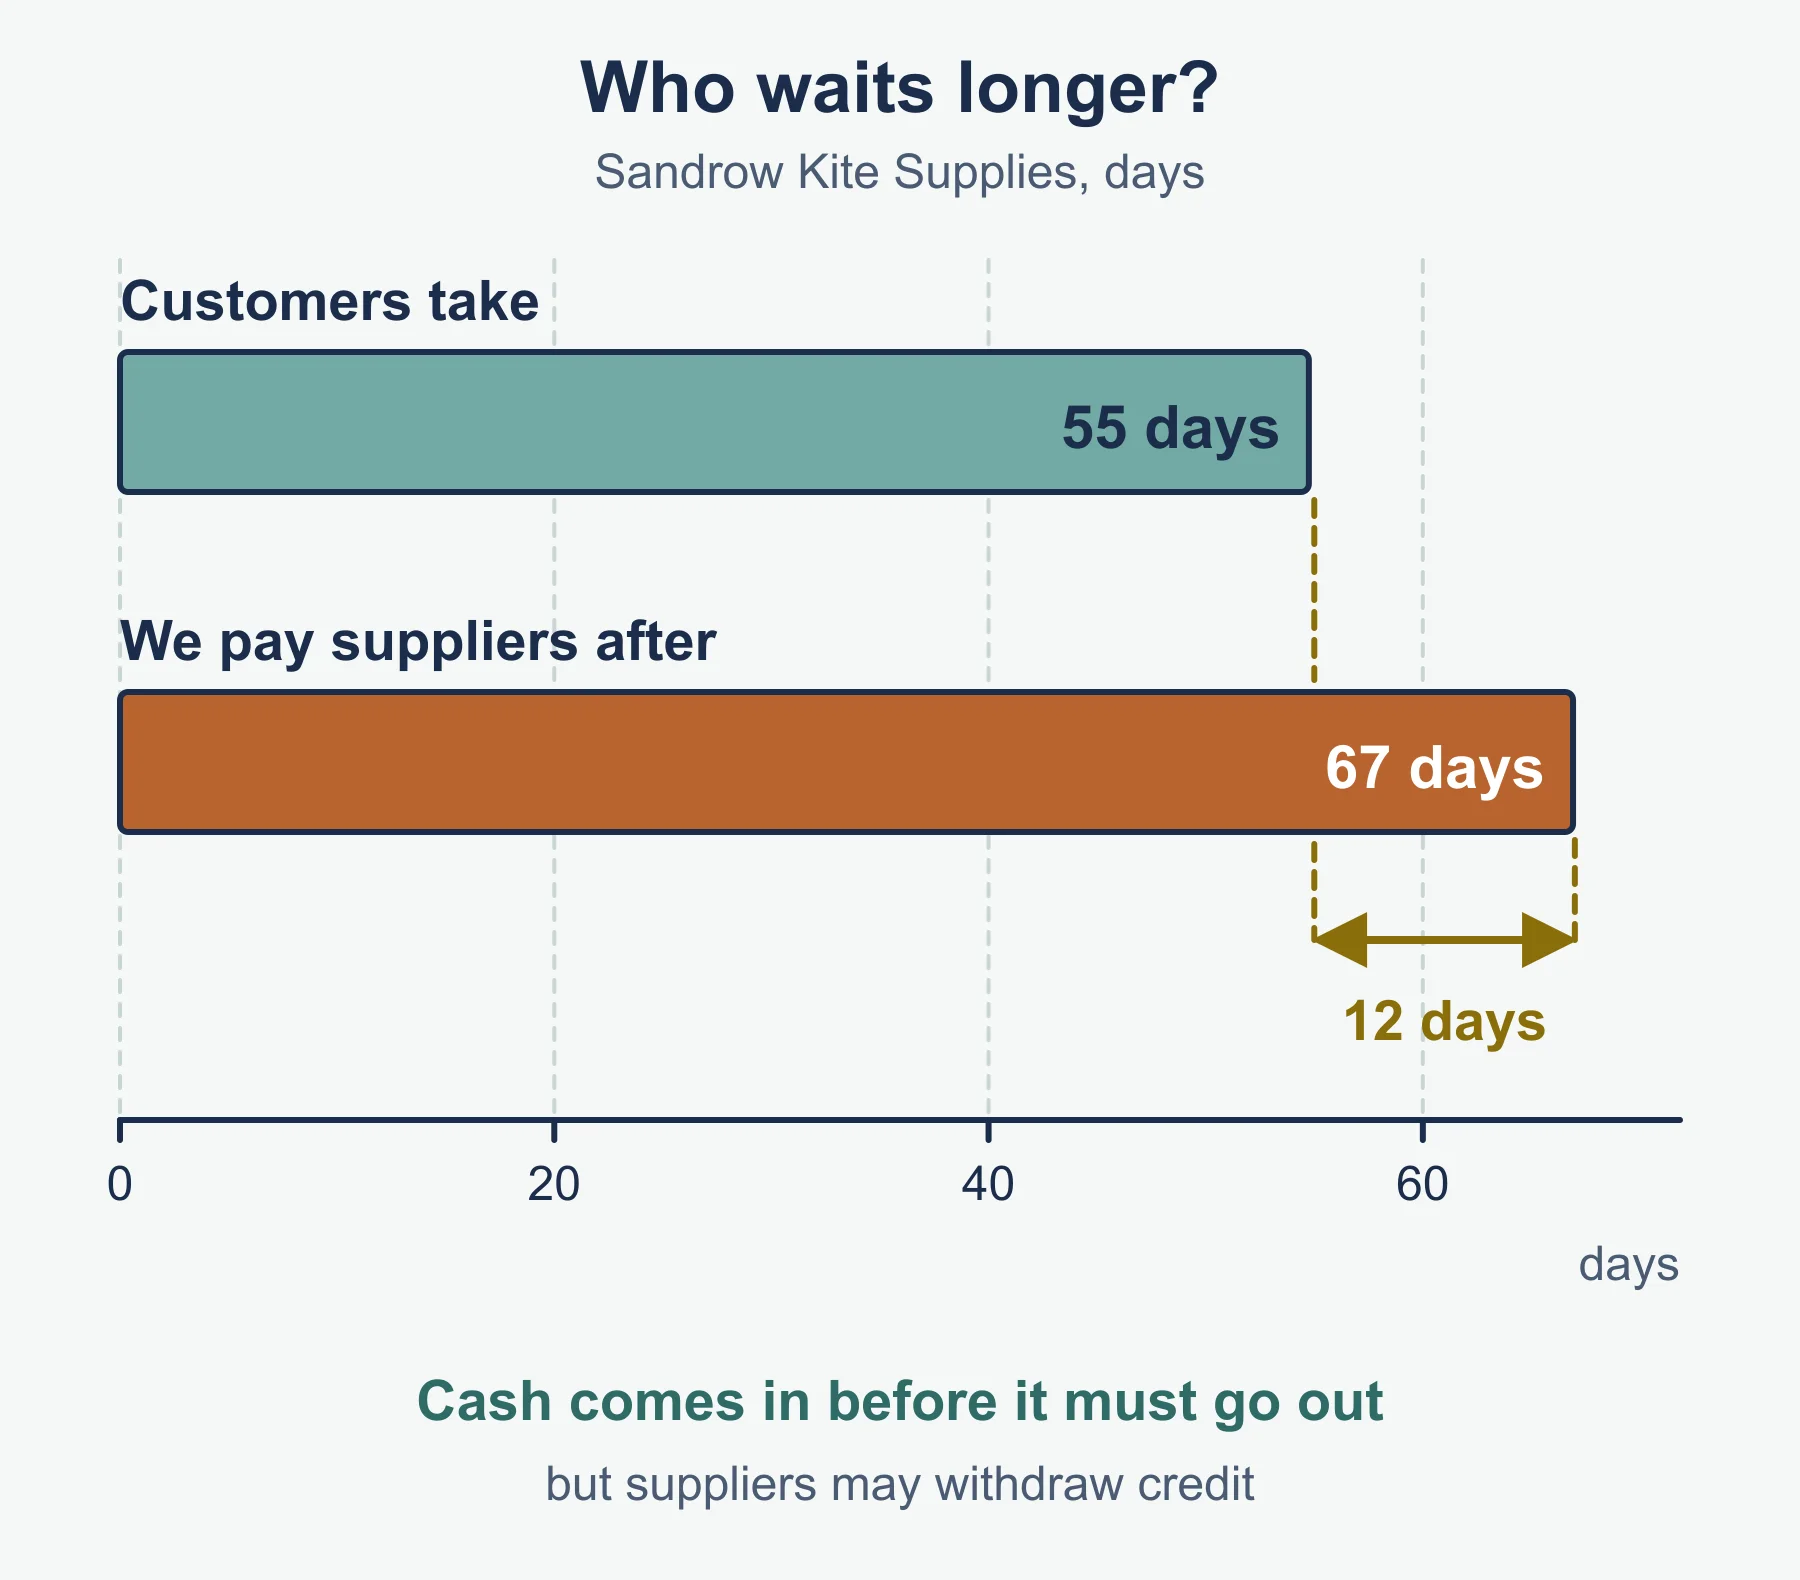
Customers take 75 days to pay but suppliers are paid in 50. That squeezes cash, even though the current ratio of 2.0 : 1 looks healthy.
Interpretation cues
| Measure | Higher | Lower |
|---|---|---|
| Gross profit margin and markup | Better pricing or cheaper buying | Discounts, dearer suppliers, sales mix |
| Profit in relation to revenue | Tight expense control | Expenses growing faster than revenue |
| Return on capital employed | Capital used productively | Falling profit or new capital not yet earning |
| Inventory turnover | Faster selling; less cash tied up | Slow-moving or excess inventory |
| Current ratio | Safer cover, but may mean idle assets | Possible trouble paying short-term debts |
| Liquid capital ratio | Cover without relying on inventory | Below 1 : 1 means reliance on selling inventory |
| Receivable days | Slow collection or generous terms | Quicker cash, tighter credit control |
| Payable days | Cash kept longer, supplier goodwill at risk | Suppliers paid quickly, cash used sooner |
Must-know distinctions
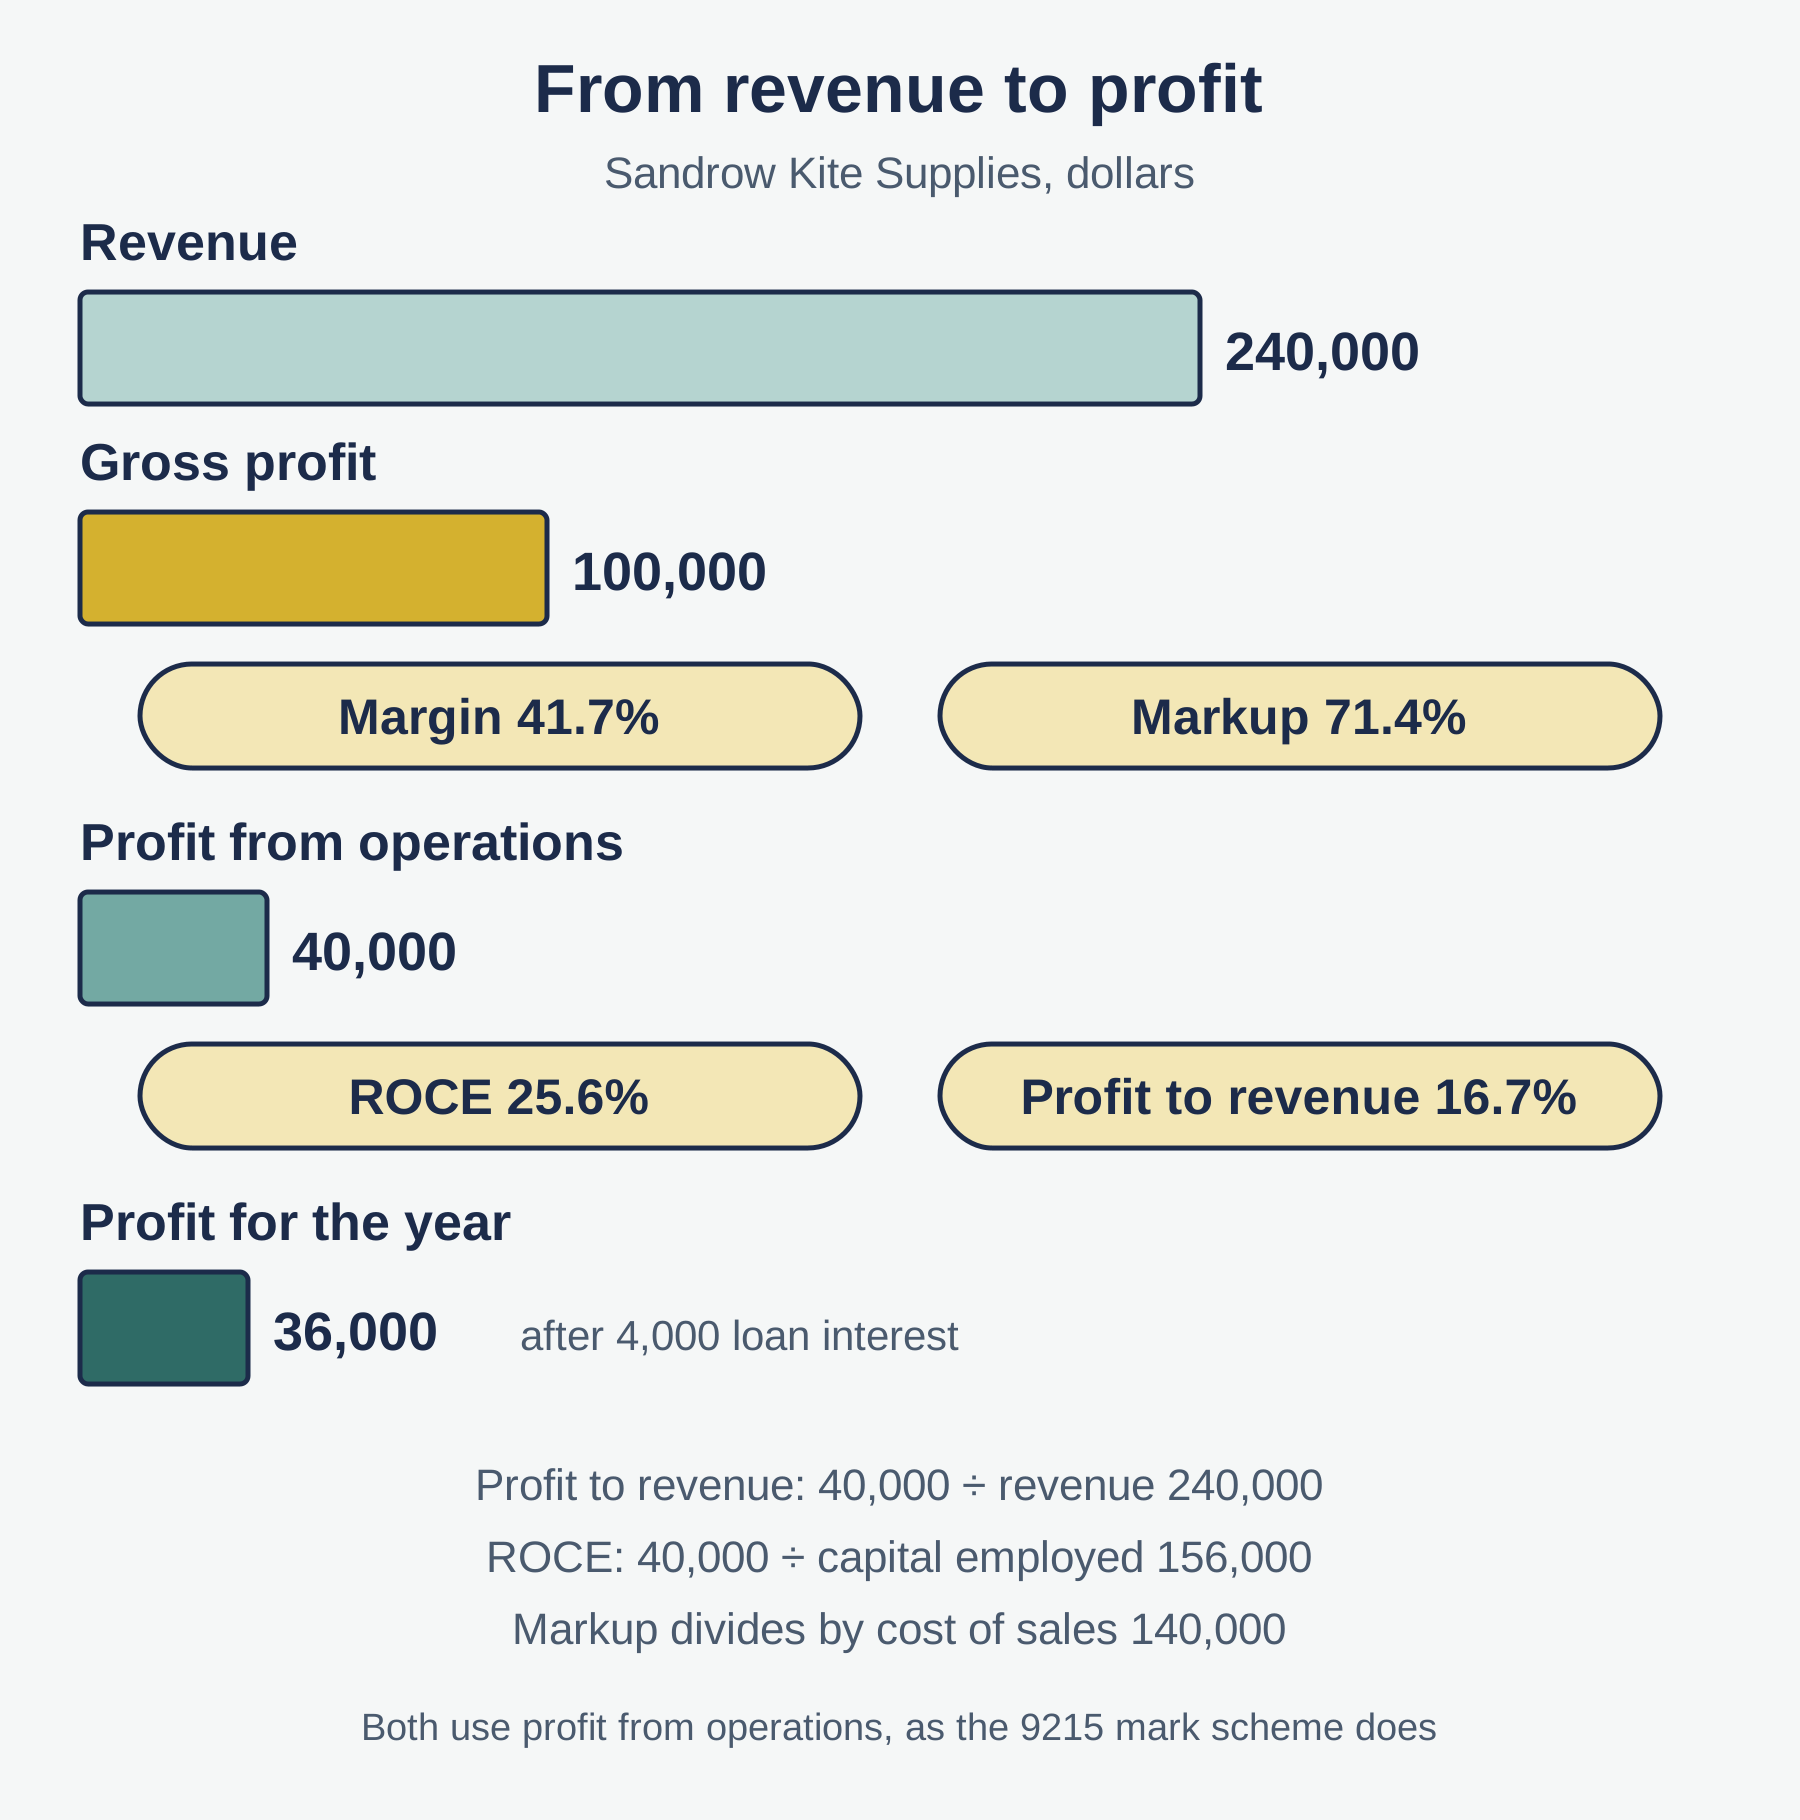
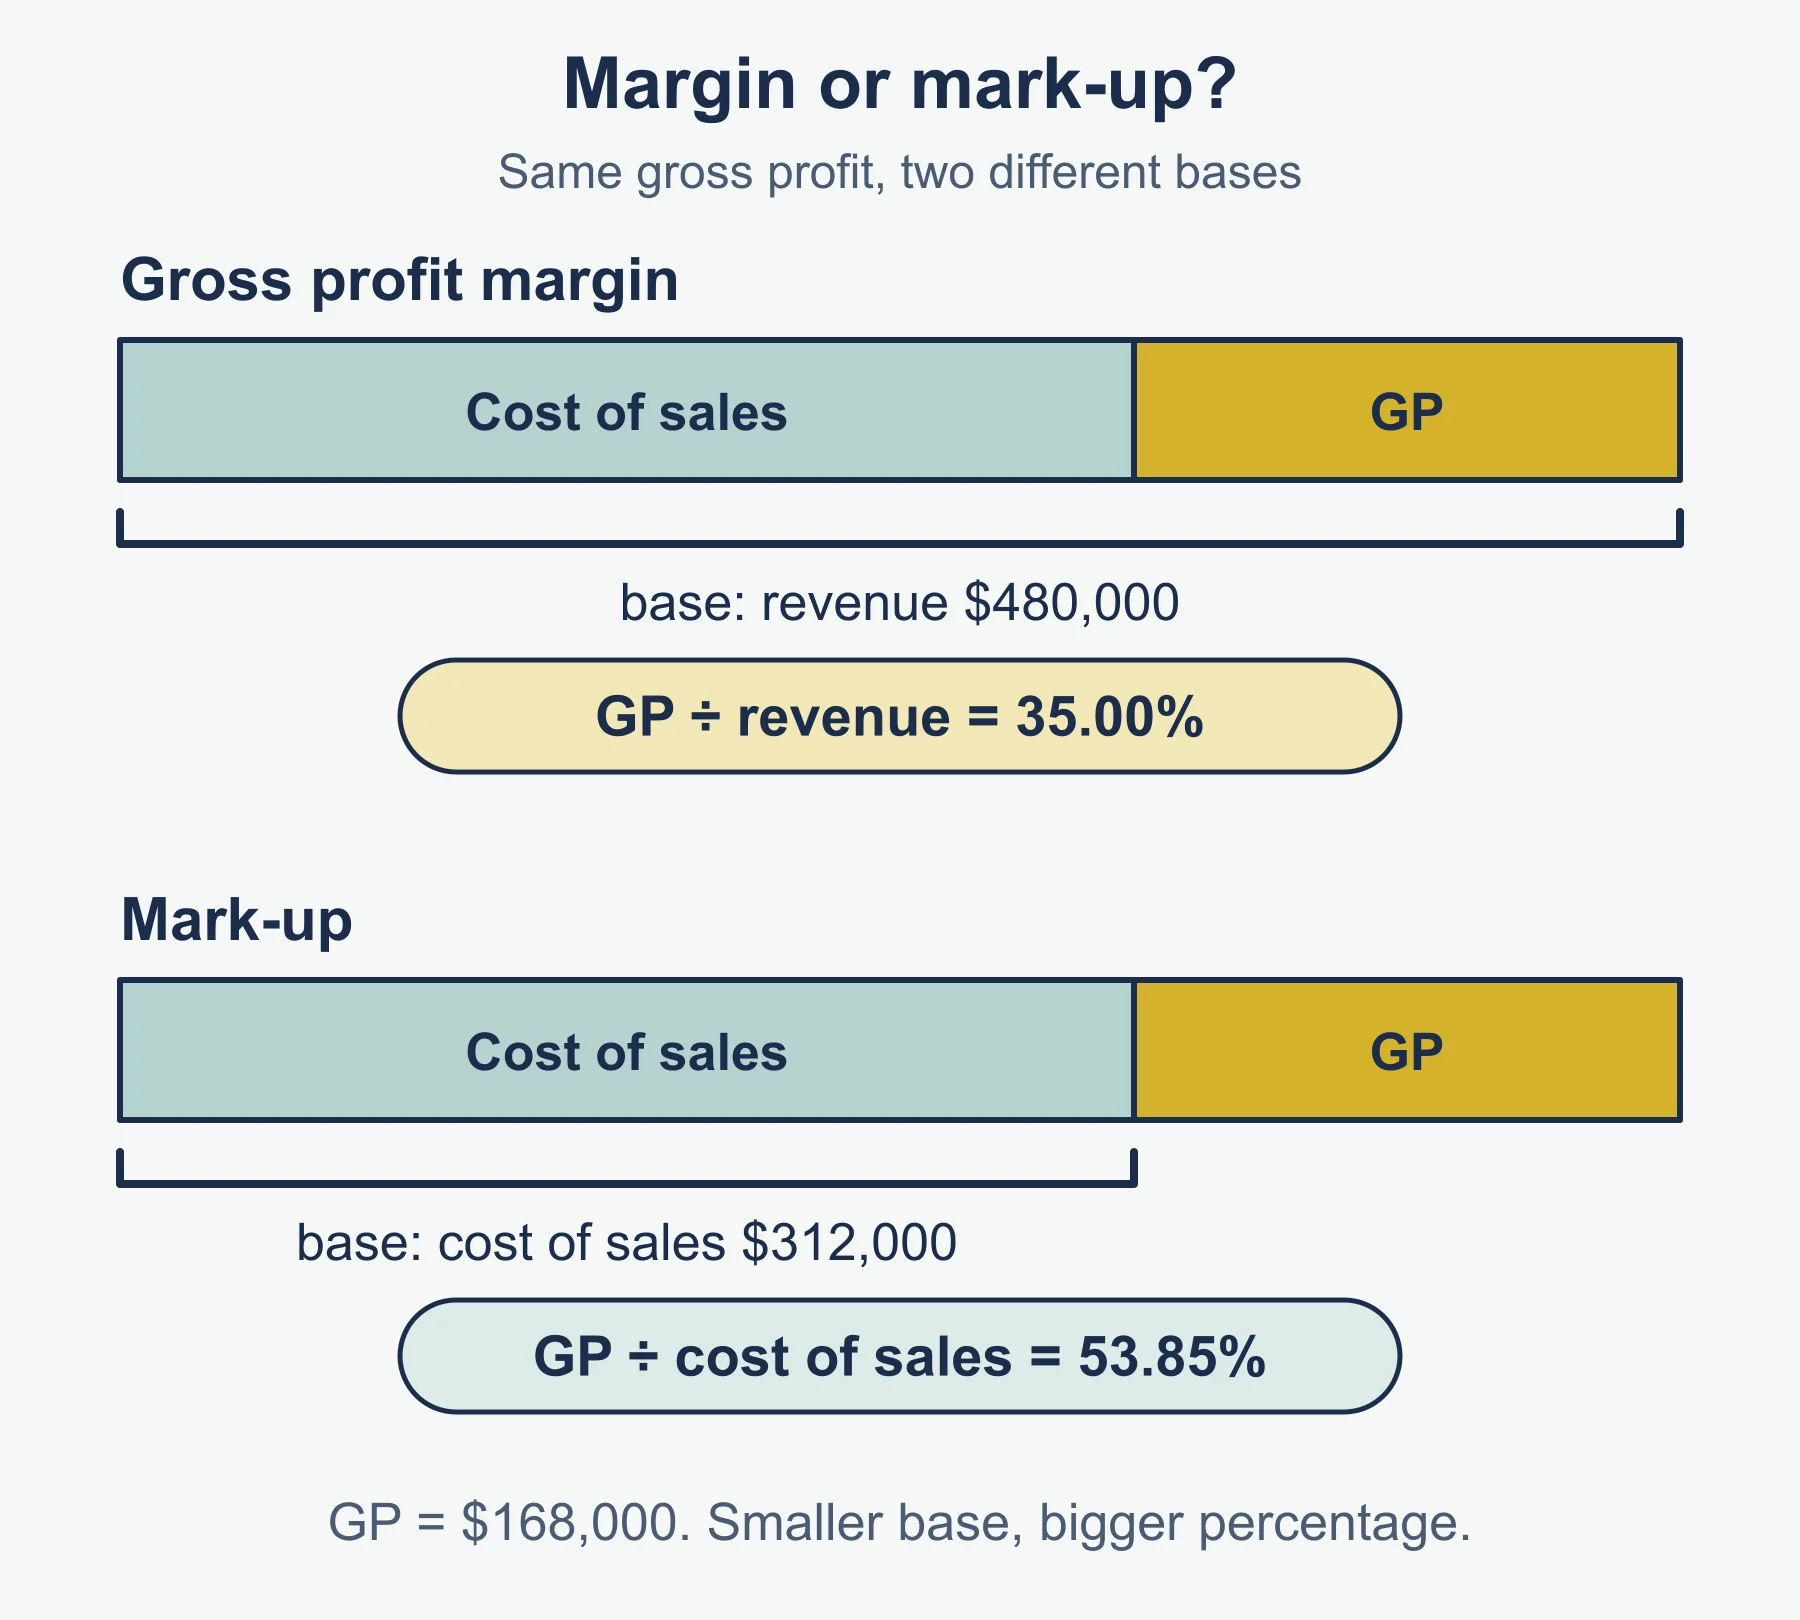
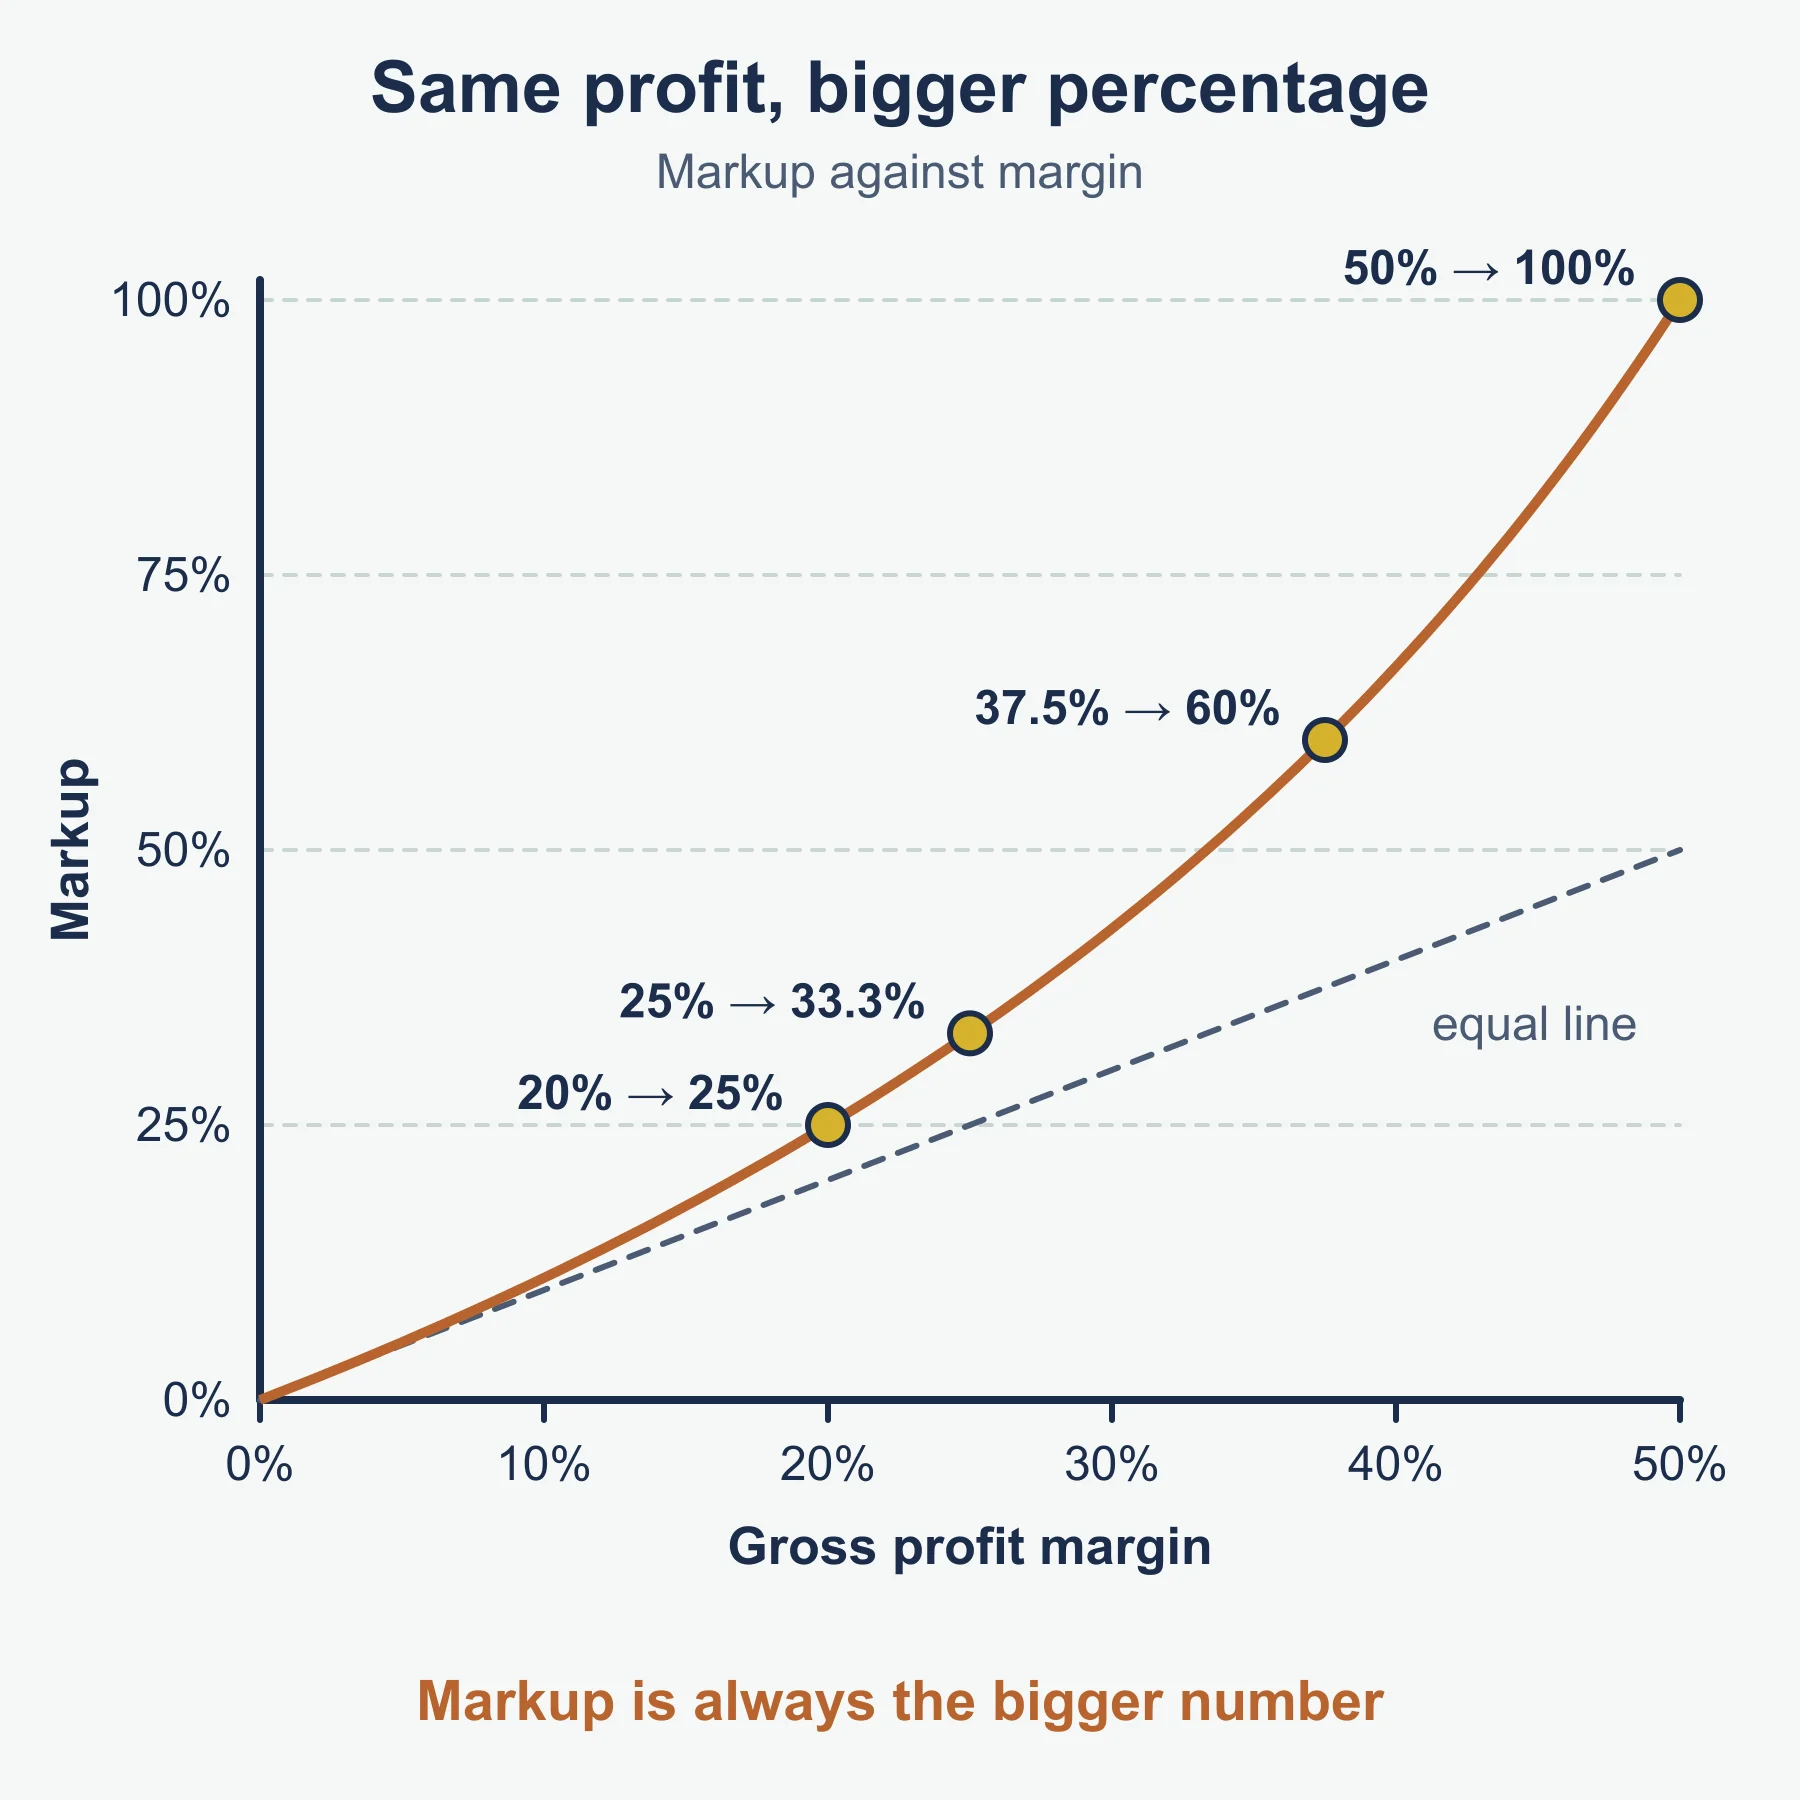
- Margin divides by revenue. Markup divides by cost of sales. Markup is the larger figure for the same trading.
- Margin to markup: margin / (100 - margin) x 100. Markup to margin: markup / (100 + markup) x 100. For example, 40% margin is 66.7% markup, and 80% markup is 44.4% margin.
- Current ratio includes inventory. The liquid capital ratio does not.
- Profit in relation to revenue and ROCE both use profit from operations (before loan interest), as OxfordAQA’s own 9215 mark scheme (Paper 2, May/June 2026) does.
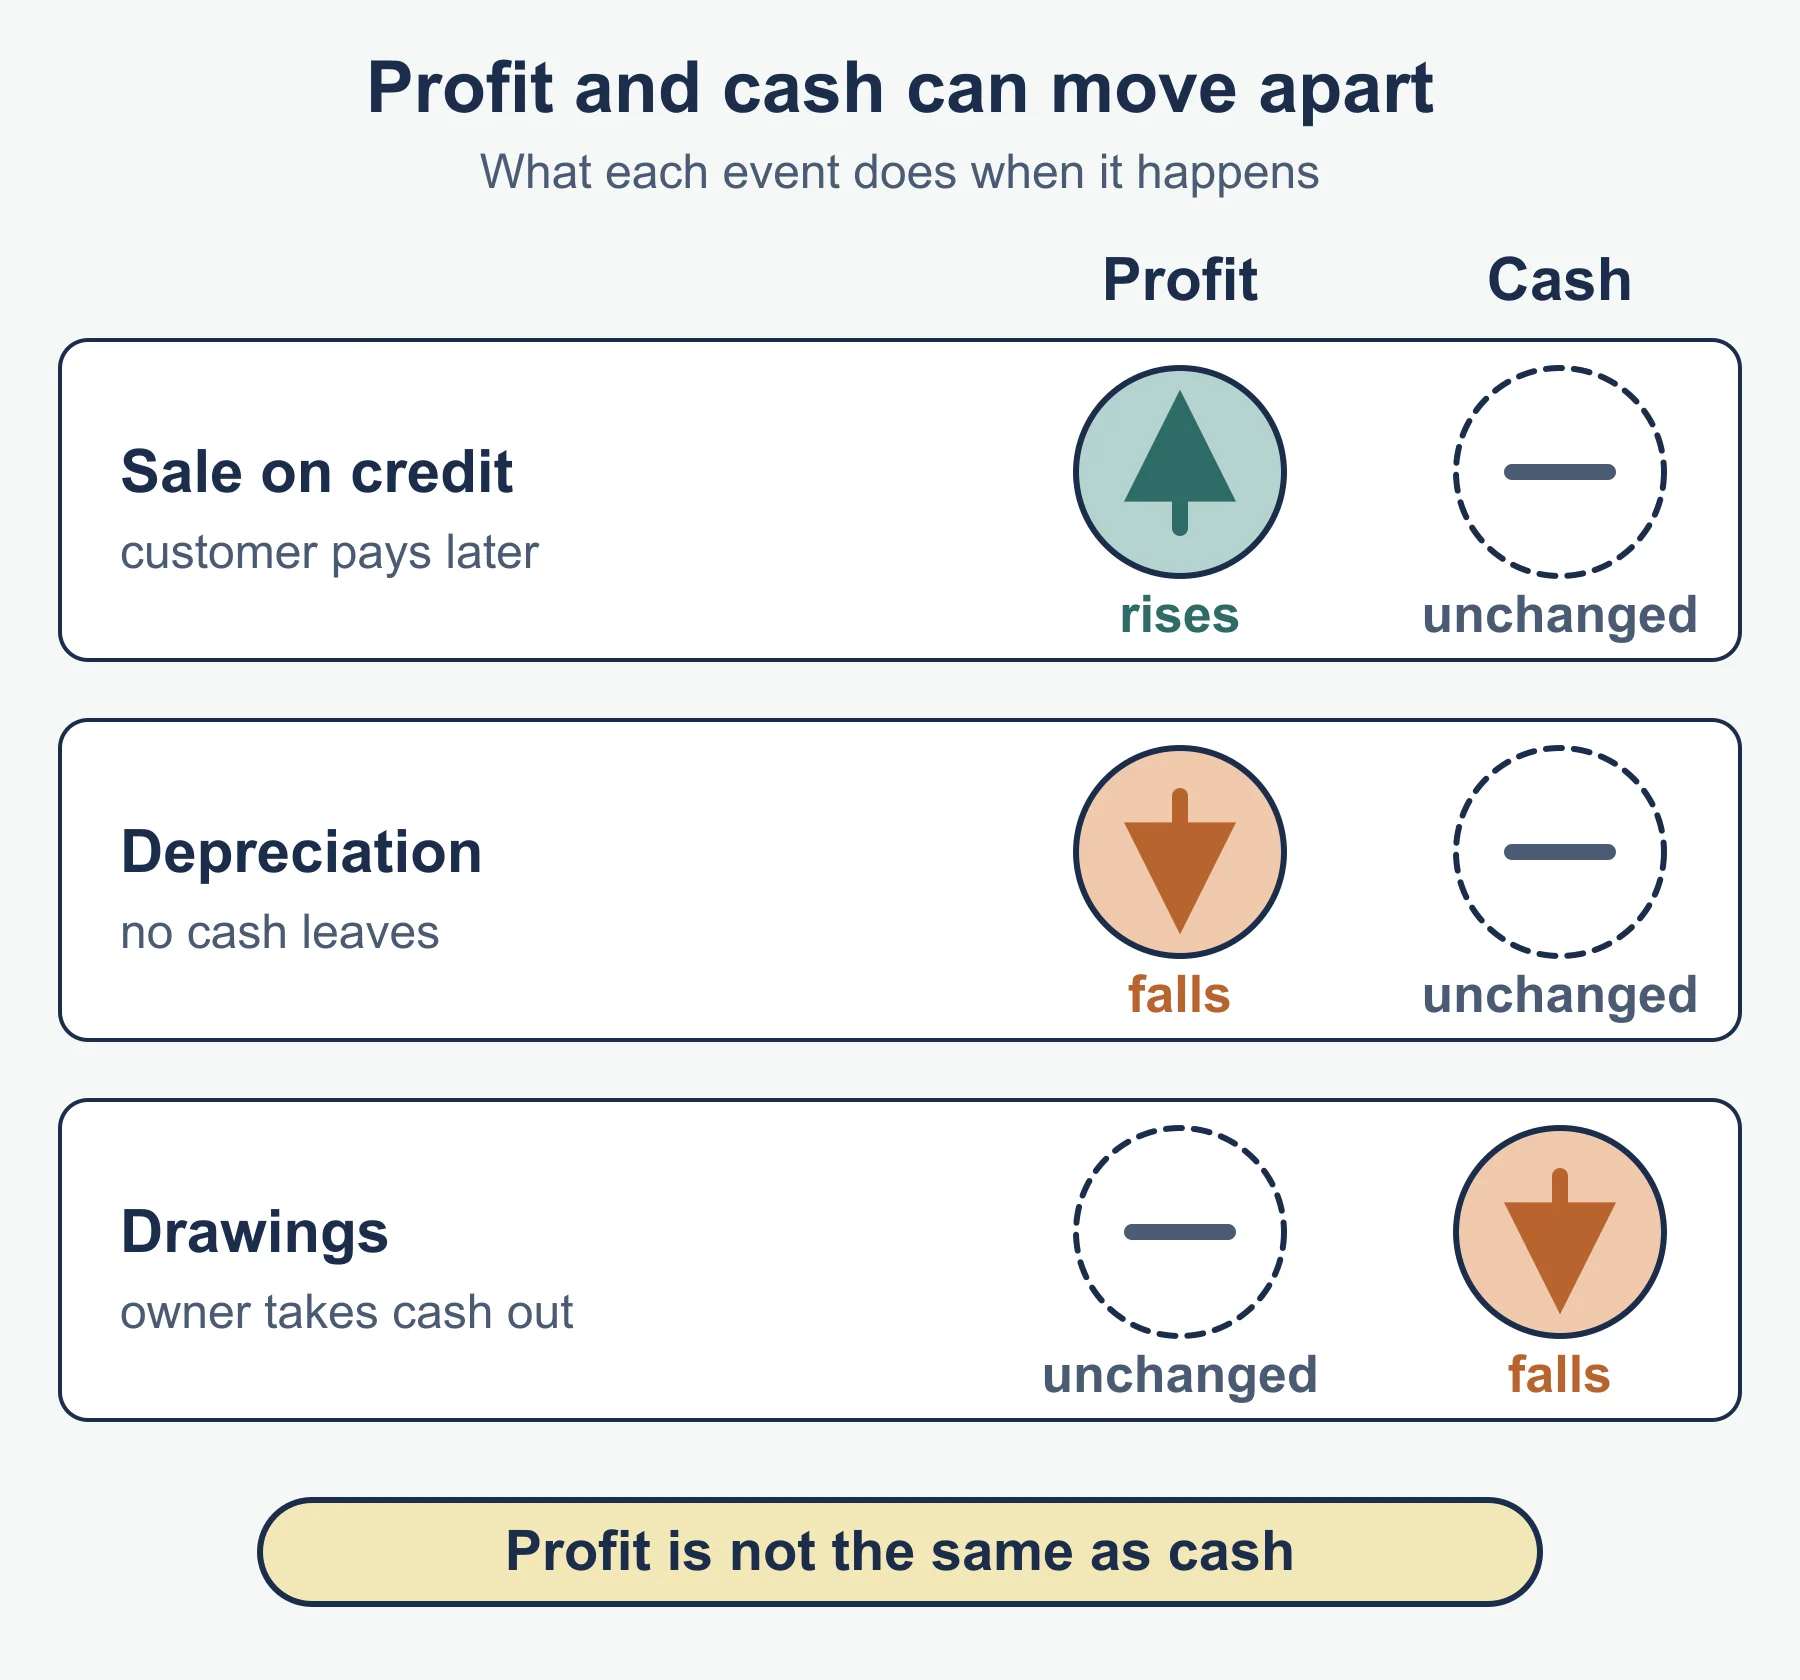
- Profit is not cash. Credit sales raise profit but not cash. Depreciation lowers profit but not cash. Buying equipment, repaying loans and drawings lower cash without lowering profit when they happen.
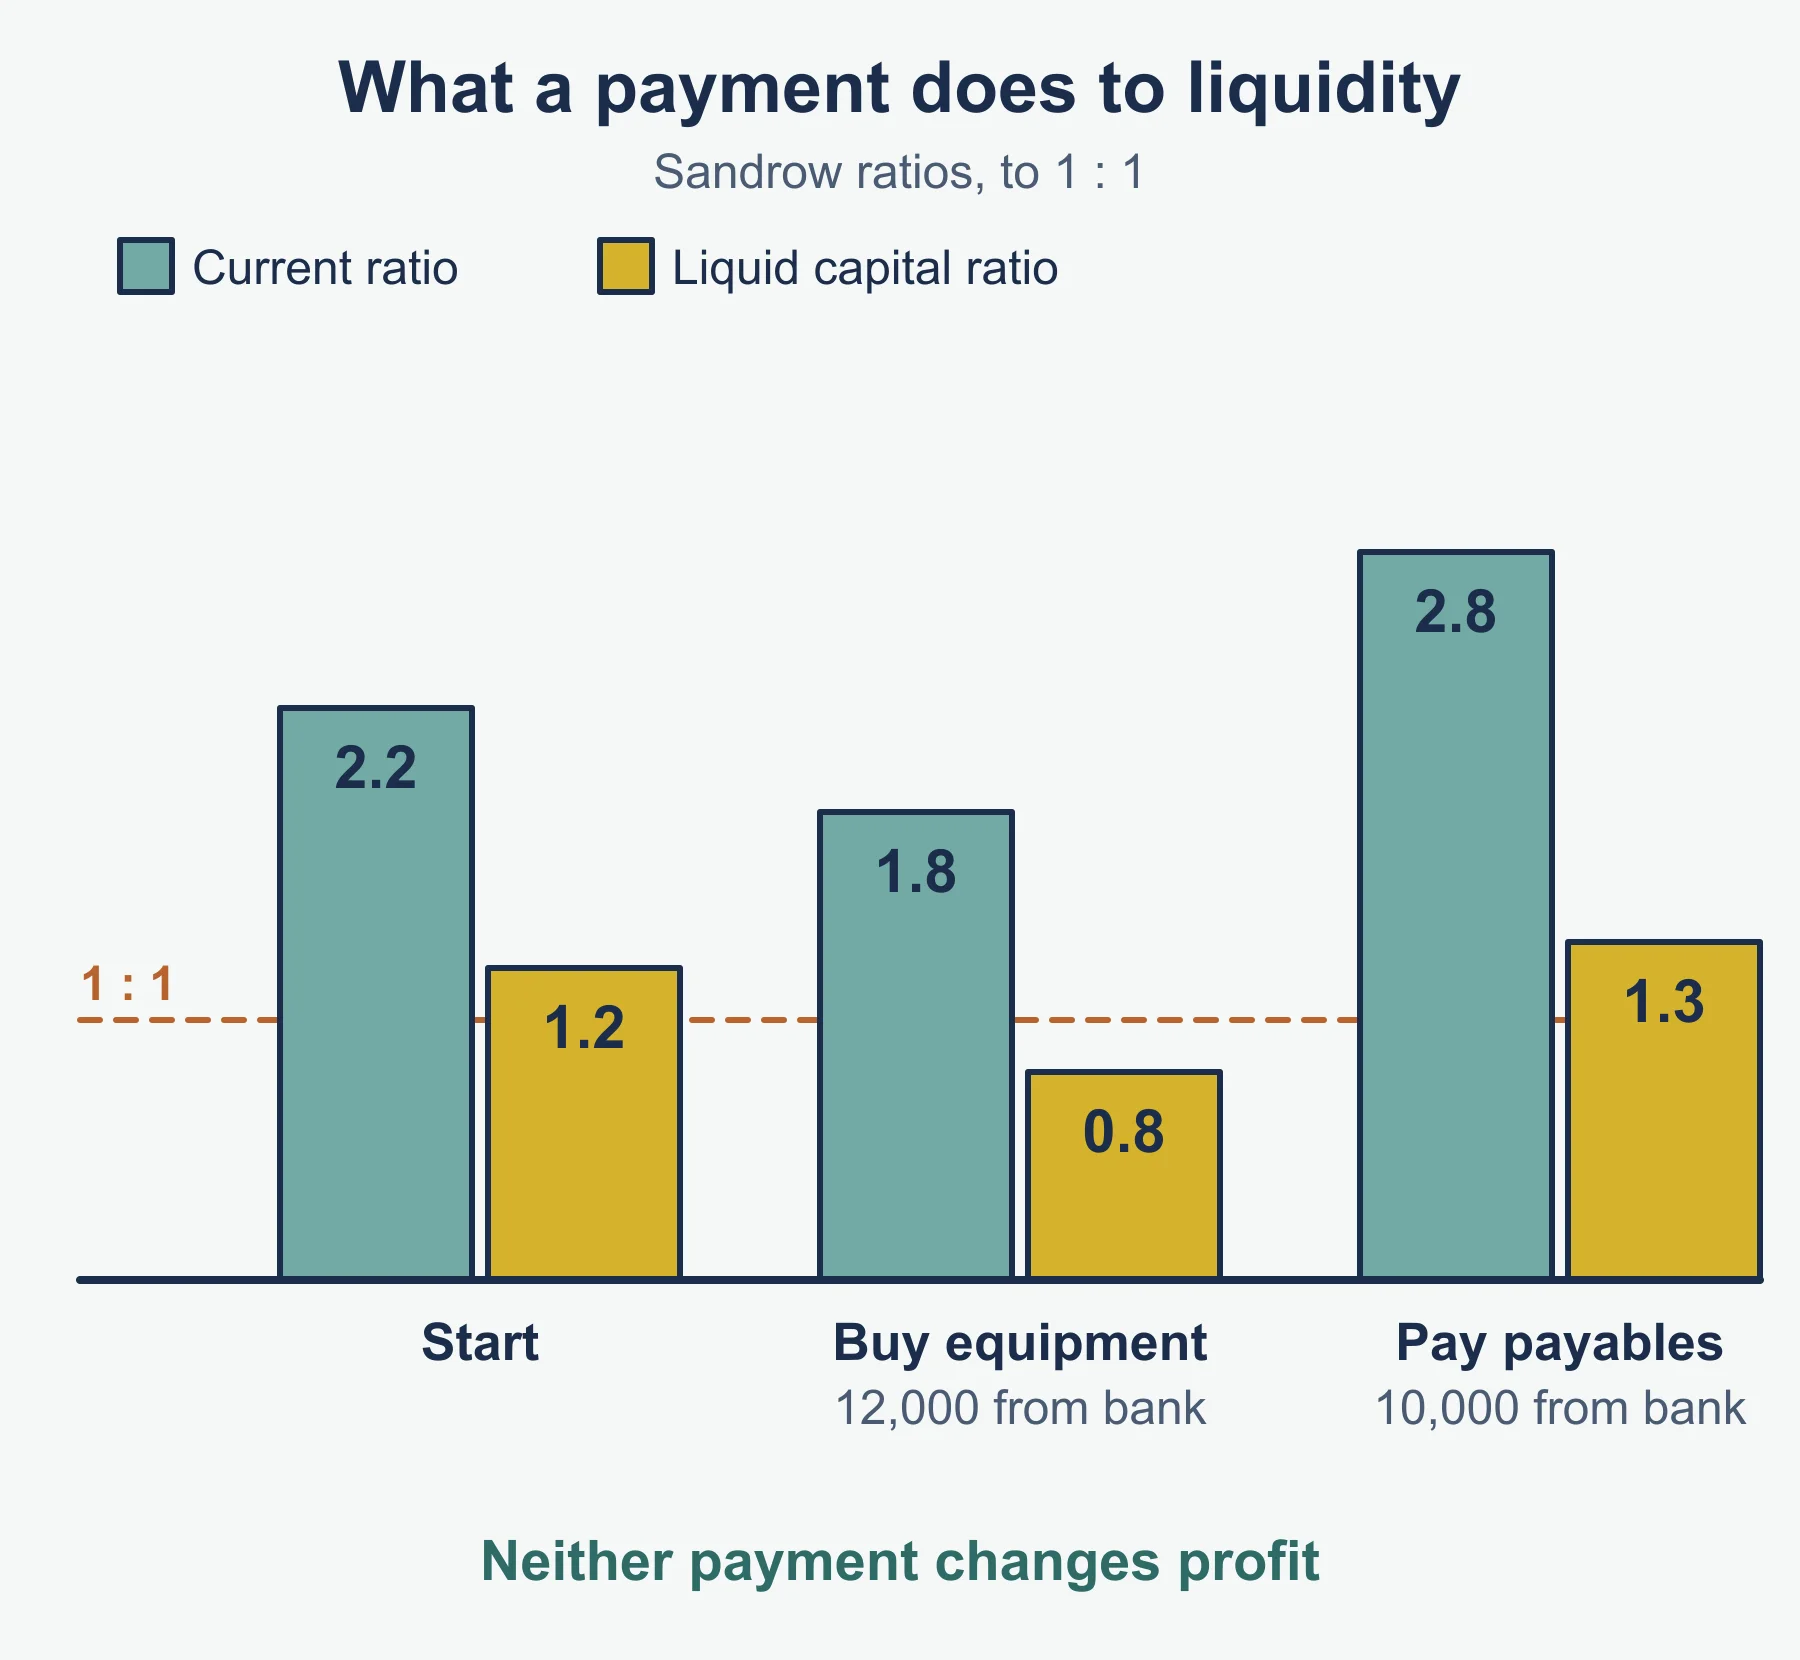
- Paying a trade payable from the bank lowers current assets and current liabilities by the same amount. A current ratio above 1 : 1 then rises. Buying a non-current asset from the bank lowers current assets only, so the ratio falls.
Cash and profit: effect of common transactions
| Transaction | Profit | Cash at bank |
|---|---|---|
| Sale on credit | Rises now | No change until the customer pays |
| Customer pays a trade receivable | No change | Rises |
| Purchase of inventory on credit | No change until sold | No change until paid |
| Depreciation charge | Falls | No change |
| Purchase of equipment from the bank | No change now | Falls |
| Drawings in cash | No change | Falls |
| Payment of an expense | Falls | Falls |
When asked why profit and cash differ, name the transactions in the question and say which of the two each one changes.
Appraisal and limitations in brief
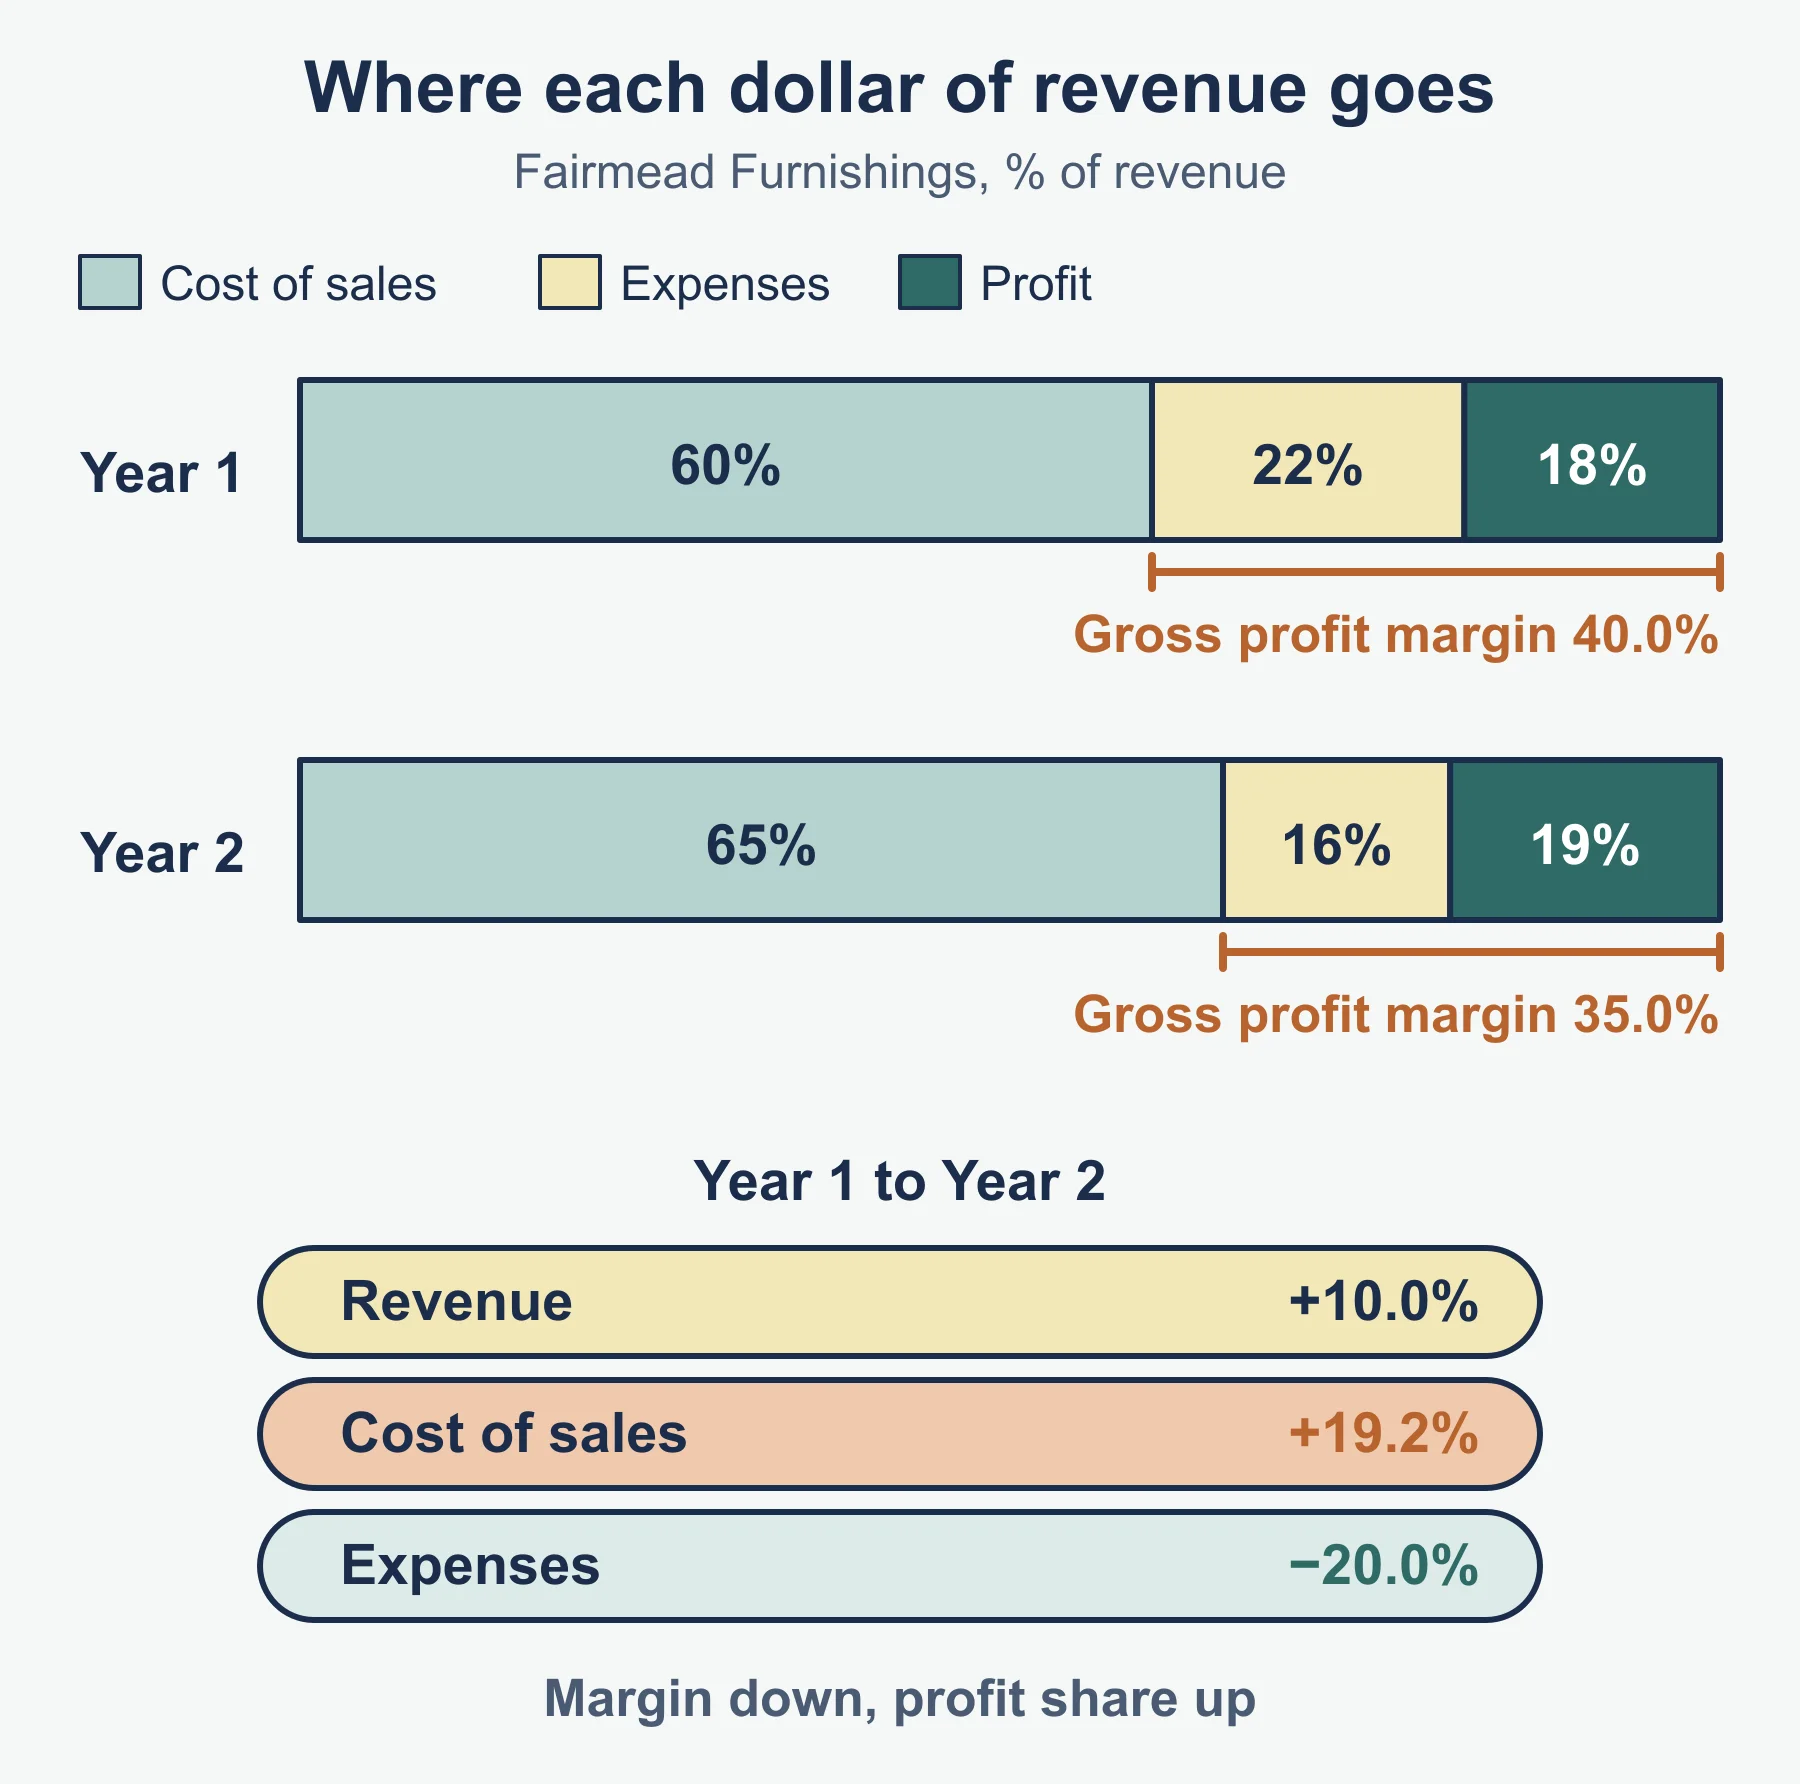
- Profitability appraisal: use the margin, markup, profit in relation to revenue and ROCE. Compare years, state what moved, give a reason, reach a judgement.
- Liquidity appraisal: use the current ratio, liquid capital ratio and the days measures. State whether short-term debts can be met.
- Financial limitations: historic figures, year-end snapshots, differing accounting policies, inflation, ratios do not explain why.
- Non-financial limitations: staff, reputation, customer loyalty, competitors, market conditions, management quality.
Quick self-test
- A trader has revenue of 54,000 and cost of sales of 36,000. Calculate the gross profit margin and the markup.
- Cost of sales is 63,000 and the gross profit margin is 30%. Find revenue.
- An item costing 50 sells for 80. Find the margin and the markup.
- Cost of sales is 84,000 and average inventory is 12,000. Find the rate of inventory turnover.
- Profit from operations is 12,000, equity is 50,000 and a loan is 10,000. Find the return on capital employed.
- Current assets are 45,000, including inventory of 18,000. Current liabilities are 30,000. Find the current ratio and the liquid capital ratio.
- Trade receivables are 9,000 and credit revenue is 54,750. Find trade receivable days.
- Trade payables are 10,950 and credit purchases are 54,750. Find trade payable days.
- Current assets are 20,000 and current liabilities are 10,000. The business pays 5,000 to trade payables from the bank. Find the new current ratio. Does profit change?
- Give two non-financial limitations of ratio analysis.
Answers
- Gross profit 18,000. Margin = 18,000 / 54,000 x 100 = 33.3%. Markup = 18,000 / 36,000 x 100 = 50%.
- Cost of sales is 70% of revenue, so revenue = 63,000 / 0.70 = 90,000.
- Gross profit 30. Margin = 30 / 80 x 100 = 37.5%. Markup = 30 / 50 x 100 = 60%.
- 84,000 / 12,000 = 7 times.
- Capital employed = 50,000 + 10,000 = 60,000. ROCE = 12,000 / 60,000 x 100 = 20%.
- Current ratio = 45,000 : 30,000 = 1.5 : 1. Liquid capital ratio = 27,000 : 30,000 = 0.9 : 1.
- 9,000 / 54,750 x 365 = 60 days.
- 10,950 / 54,750 x 365 = 73 days.
- Current assets become 15,000 and current liabilities 5,000, so the ratio rises from 2 : 1 to 3 : 1. Profit does not change.
- Any two of: staff morale or skills, reputation, customer loyalty, competitor actions, market conditions, quality of management.
Where marks are usually lost
- Using the wrong base for markup, dividing by revenue instead of cost of sales.
- Using closing inventory instead of average inventory for turnover when both are available.
- Leaving out the unit, or writing days as a percentage.
- Using total revenue for receivable days when credit revenue is given.
- Forgetting to remove inventory in the liquid capital ratio.
- Deducting loan interest before ROCE when the formula uses profit from operations.
- Calling a figure good or bad with no comparison and no reason.
- Treating profit and cash as the same thing when explaining a falling bank balance.
- Giving limitations that are generic and not tied to the business in the question.
Frequently asked questions
What is the difference between gross profit margin and markup? Margin divides gross profit by revenue, while markup divides gross profit by cost of sales. For the same trading, markup is always the larger figure.
How do you convert a margin into a markup? Markup = margin / (100 − margin) × 100, and margin = markup / (100 + markup) × 100. For example, a 40% margin is a 66.7% markup.
What is the difference between the current ratio and the liquid capital ratio? The current ratio includes inventory in current assets; the liquid capital ratio leaves it out.
Why can a business make a profit but have less cash? Profit is not cash. Credit sales raise profit before cash arrives, depreciation lowers profit without using cash, and buying equipment, repaying loans and drawings lower cash without lowering profit.
Where are the 9215 ratio formulae published? The specification says the formulae are in an OxfordAQA guide called Formulae for accounting ratios.
Official syllabus
OxfordAQA International GCSE Accounting (9215), specification version 1.2, for exams from May/June 2026 onwards, section 3.5: Interpretation, analysis and communication of financial information.
Get free revision emails (optional)
Occasional emails with practice questions, worked explanations and links to free resources for the qualification and subjects you choose. No spam, and you can unsubscribe from any email. The free tools on this site never need an email.
Related resources
-
Study guides
OxfordAQA IGCSE Accounting: Appraising business performance, cash and profit (9215)
Calculate and interpret profitability and liquidity ratios, then explain how cash differs from profit, for OxfordAQA International GCSE Accounting 9215.
Accounting · OxfordAQA · IGCSE
Read guide -
Practice questions
OxfordAQA IGCSE Accounting: Appraising business performance, cash and profit (9215) – Practice Questions
Eleven original questions with worked answers on profitability and liquidity ratios, appraisal, and cash versus profit for OxfordAQA IGCSE Accounting 9215.
Accounting · OxfordAQA · IGCSE
Try questions -
Revision notes
OxfordAQA IGCSE Accounting: Appraising business performance, cash and profit (9215) – Revision Notes
Condensed formulas, interpretation phrases, cash versus profit grids and a self-test on ratios and appraisal for OxfordAQA IGCSE Accounting 9215.
Accounting · OxfordAQA · IGCSE
Revise topic
Related articles
-
teaching
A Level tuition in Dubai: Cambridge or Pearson Edexcel International A Level?
Schools in Dubai and Abu Dhabi teach either Cambridge International AS & A Level or Pearson Edexcel International A Level. How the two are structured, why it matters for tuition, and how online classes from Lahore work.
9 October 2026
-
curriculum guides
Choosing subjects at IGCSE and A Level
How subject choices at 14 and 16 affect university options later, and how to keep pathways open without overloading a timetable.
28 July 2026
Studying this with a teacher
Working through Accounting IGCSE?
This page is free and stays free. If you would rather be taught it, Marlbridge runs Accounting classes one-to-one and in small groups of up to 15, online in your own time zone. The first trial class is free. WhatsApp replies within an hour (8am–11pm Pakistan time, every day); email the same day.
OxfordAQA Accounting teachers at Marlbridge