Study Guides
OxfordAQA IGCSE Accounting: Appraising business performance, cash and profit (9215)
Calculate and interpret profitability and liquidity ratios, then explain how cash differs from profit, for OxfordAQA International GCSE Accounting 9215.
- Subject
- Accounting
- Level
- IGCSE
- Topic
- Interpretation, analysis and communication of financial information
- Author
- Marlbridge Academic Team
- Updated
- Reviewed by
- Javaid Iqbal Sabri (what this means)
Aligned to OxfordAQA IGCSE Accounting (9215), First teaching 2024, first examined 2026. Official specification .
Syllabus page (what it covers and how it is assessed): OxfordAQA IGCSE Accounting.
Syllabus points this page covers
9215
- Appraising performance, cash and profit
Found an error? Report a correction.
Need help with this topic? Request a free trial class for IGCSE Accounting (9215).
This guide is aligned to the OxfordAQA International GCSE Accounting (9215) specification, version 1.2, for exams from May/June 2026 onwards. It covers the part of specification section 3.5 (topic 5, Interpretation, analysis and communication of financial information) on appraising business performance with financial statements and ratios, and on the difference between cash and profit. The specification says content 3 to 5 is assessed in Paper 2. All amounts on this page are in dollars.
Use it with the revision notes and the practice questions. Check the topic against the course hub, tick it off on the checklist and test yourself with the free diagnostics. The exam preparation guide covers general exam technique.
What you must be able to do
| Specification point | What it means in practice |
|---|---|
| Calculation and interpretation of financial measures and ratios | Work out the nine measures listed below, then say what each result tells you |
| Appraising business performance using financial statements and ratios | Judge profitability and liquidity, using the income statement and statement of financial position |
| The difference between cash and profits | Explain why a business can make a profit yet run short of cash, and the reverse |
| The effect of transactions on profitability and liquidity | Say how a given transaction changes profit, cash and the liquidity ratios |
The specification lists these measures: gross profit margin %, markup %, rate of inventory turnover, profit in relation to revenue %, return on capital employed %, current ratio, liquid capital ratio, trade receivable days and trade payable days. It says the formulae are in OxfordAQA’s guide “Formulae for accounting ratios” and that you are expected to know the formulae and use the results to inform judgements. The forms below are the standard ones. Check them against that guide before the exam, because it decides the exact version.
The measures and what they show
Profitability measures
| Measure | Formula | What it tells you |
|---|---|---|
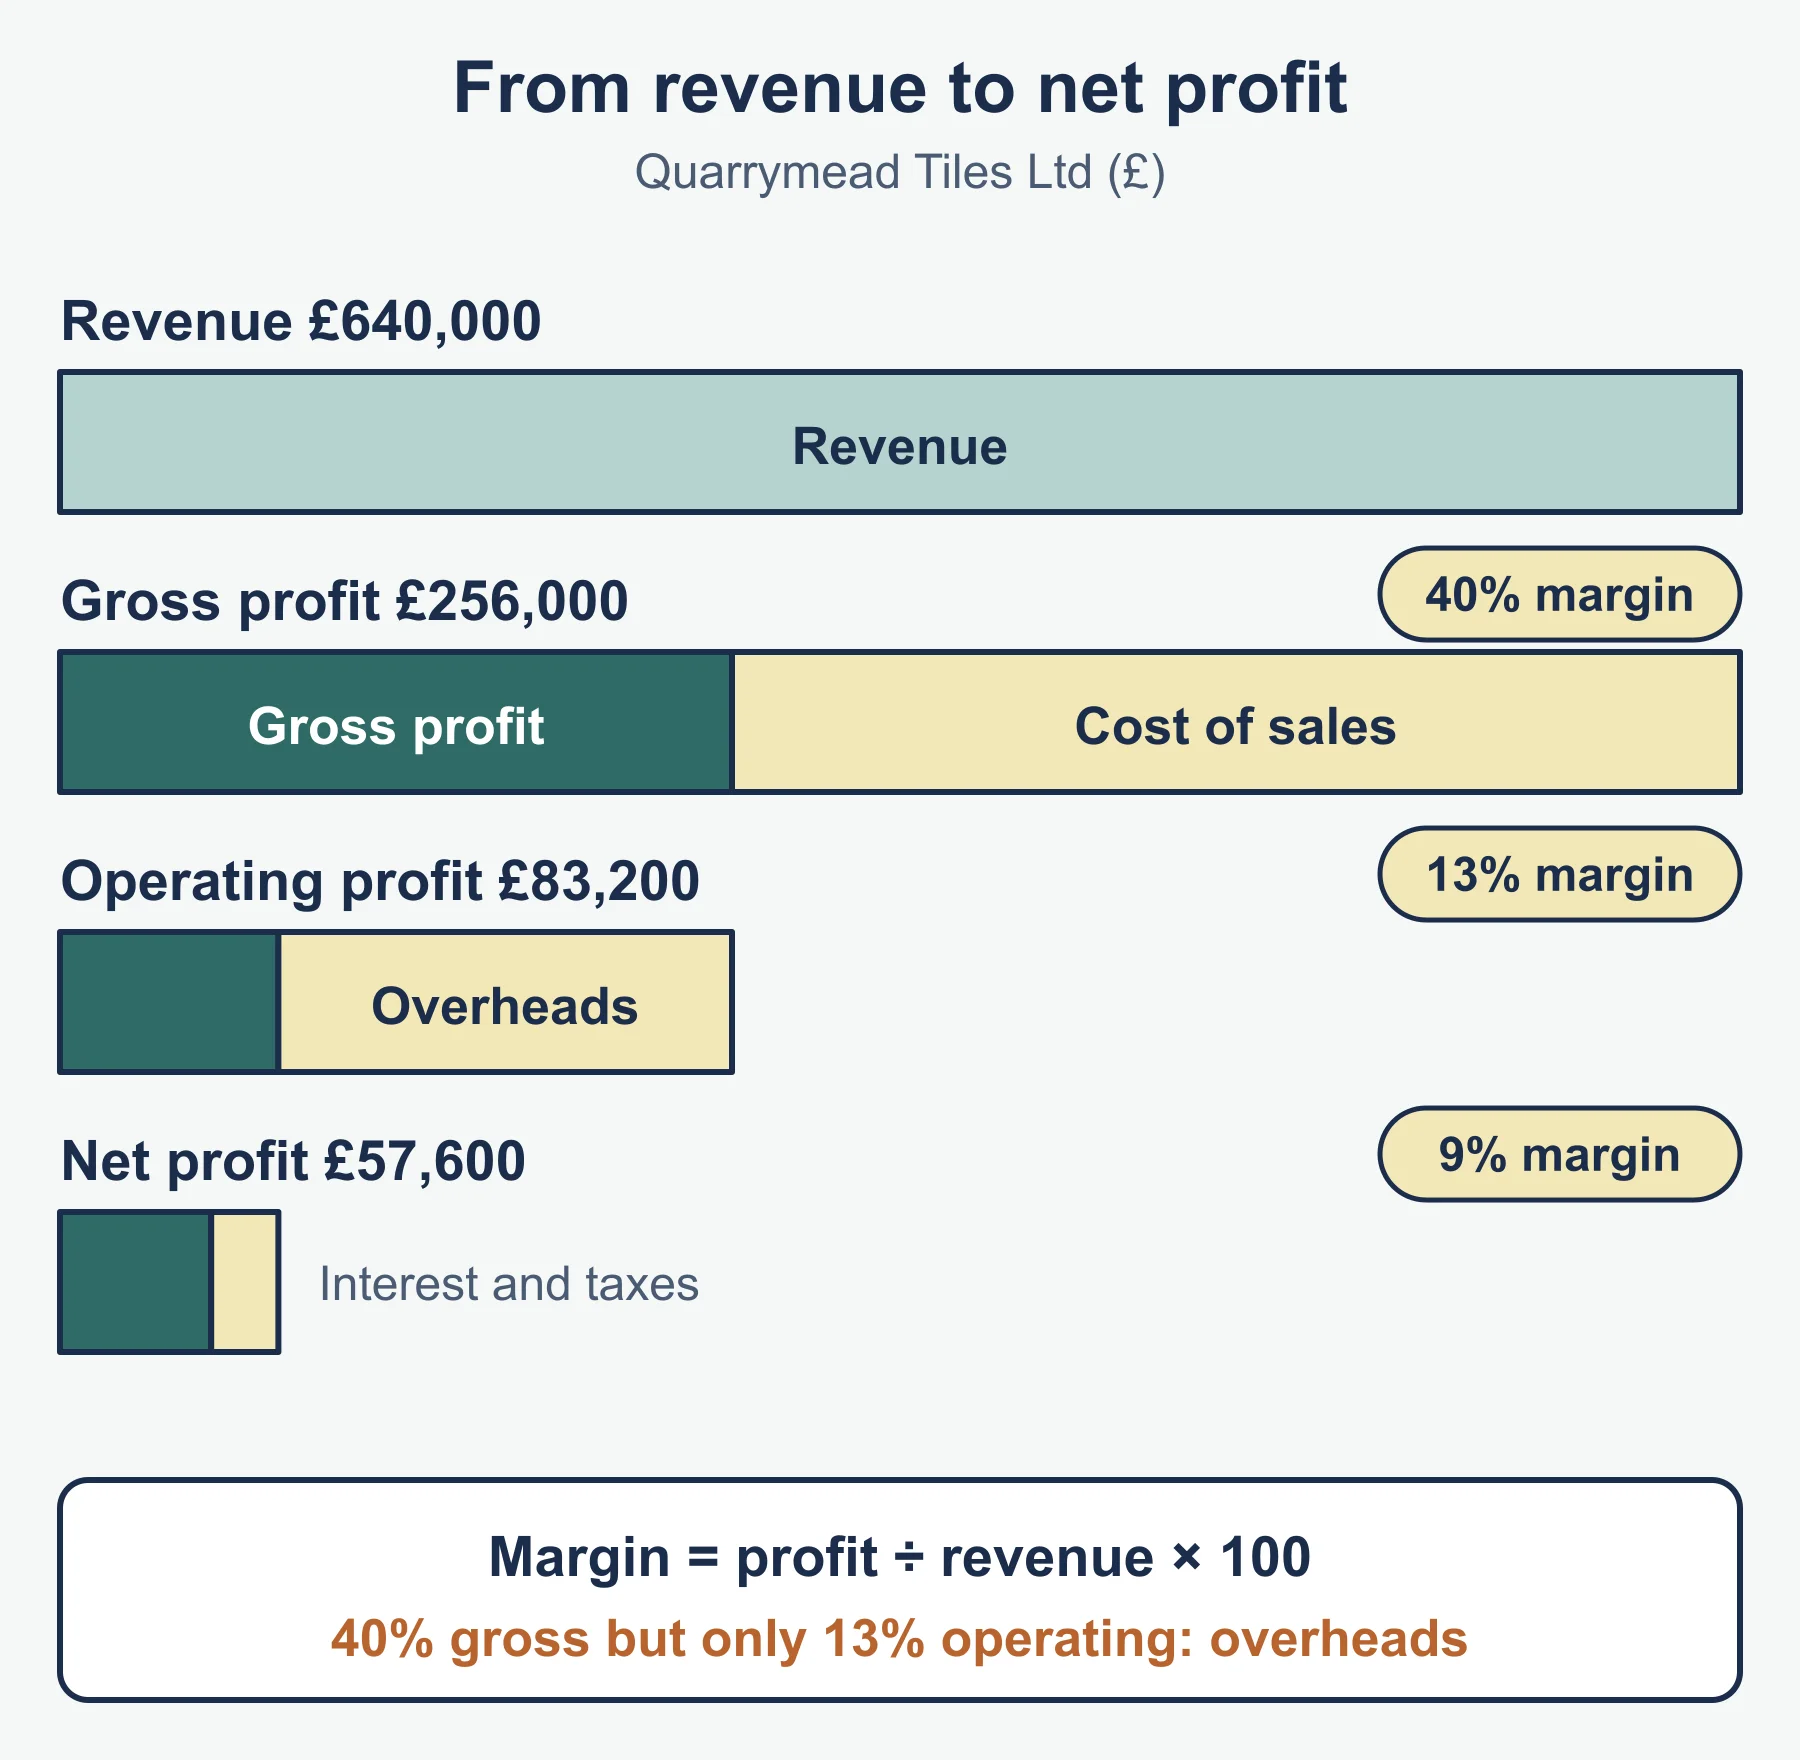
| Gross profit margin % | gross profit / revenue x 100 | Gross profit earned from each 100 of revenue |
| Markup % | gross profit / cost of sales x 100 | Gross profit added on top of cost |
| Profit in relation to revenue % | profit from operations / revenue x 100 | How much of each 100 of revenue is left after operating expenses |
| Return on capital employed % | profit from operations / capital employed x 100 | Profit earned from the money invested in the business |
| Rate of inventory turnover | cost of sales / average inventory (times) | How often inventory is sold and replaced in a year |
Profit in relation to revenue and ROCE both use profit from operations (before loan interest), as OxfordAQA’s own 9215 mark scheme (Paper 2, May/June 2026) does. Where there is no loan interest, as in the examples on this page, profit from operations and profit for the year are the same figure.
Capital employed is non-current assets plus current assets minus current liabilities. It also equals capital plus non-current liabilities. Average inventory is (opening inventory + closing inventory) / 2. If only closing inventory is given, use that and say so.
Liquidity and efficiency measures
| Measure | Formula | What it tells you |
|---|---|---|
| Current ratio | current assets : current liabilities | Ability to meet short-term debts |
| Liquid capital ratio | (current assets - inventory) : current liabilities | The same test, without inventory, which may be slow to turn into cash |
| Trade receivable days | trade receivables / credit sales x 365 | Average days customers take to pay |
| Trade payable days | trade payables / credit purchases x 365 | Average days the business takes to pay suppliers |
Give margins and ROCE as percentages, turnover as “times”, days as a number of days, and the two liquidity ratios as “x : 1” or a decimal. Always show the formula line first.
Worked example 1: two years at Kesterwick Outdoor Supplies
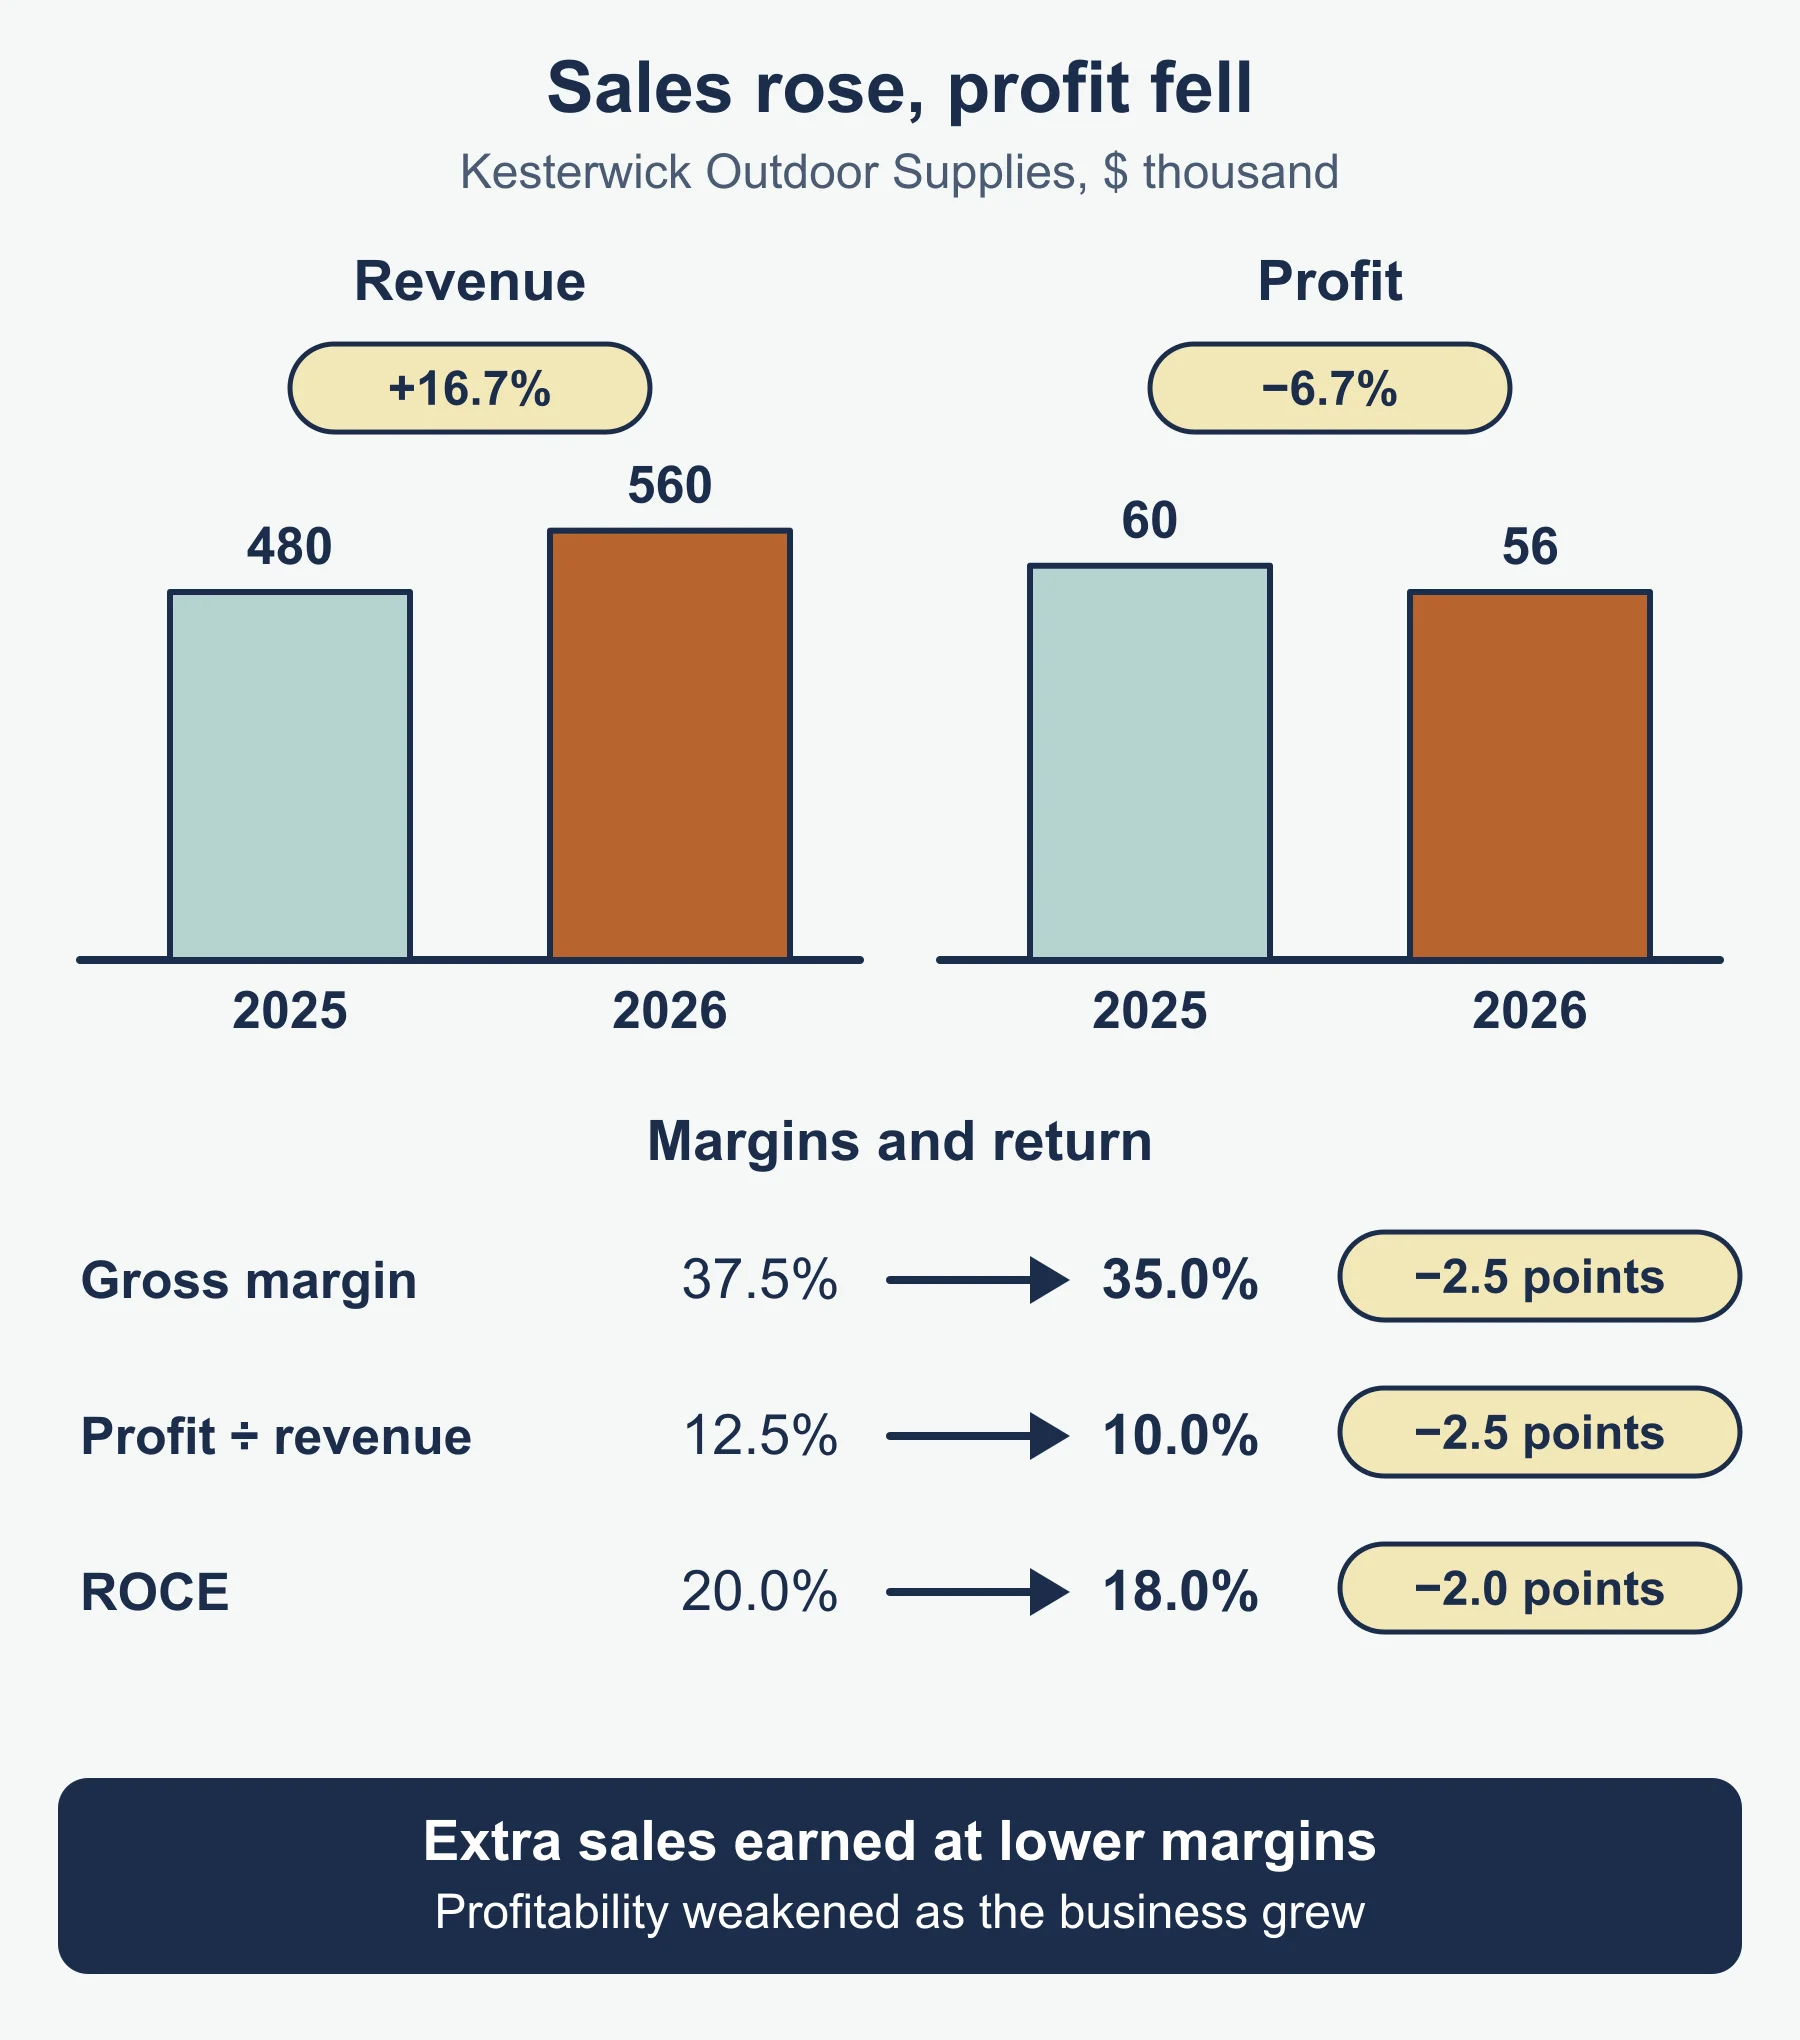
Kesterwick Outdoor Supplies is a sole trader. The figures for the years ended 31 December are below. All purchases and 75% to 80% of sales are on credit, and the credit sales and credit purchases are given.
| 2025 | 2026 | |
|---|---|---|
| Revenue | 480,000 | 560,000 |
| Cost of sales | 300,000 | 364,000 |
| Expenses | 120,000 | 140,000 |
| Opening inventory | 34,000 | 38,000 |
| Closing inventory | 38,000 | 56,000 |
| Credit sales | 360,000 | 448,000 |
| Credit purchases | 304,000 | 382,000 |
| Trade receivables | 38,000 | 72,000 |
| Trade payables | 38,000 | 70,000 |
| Bank (overdraft in 2026) | 12,000 | (9,000) |
| Non-current assets (net) | 250,000 | 262,000 |
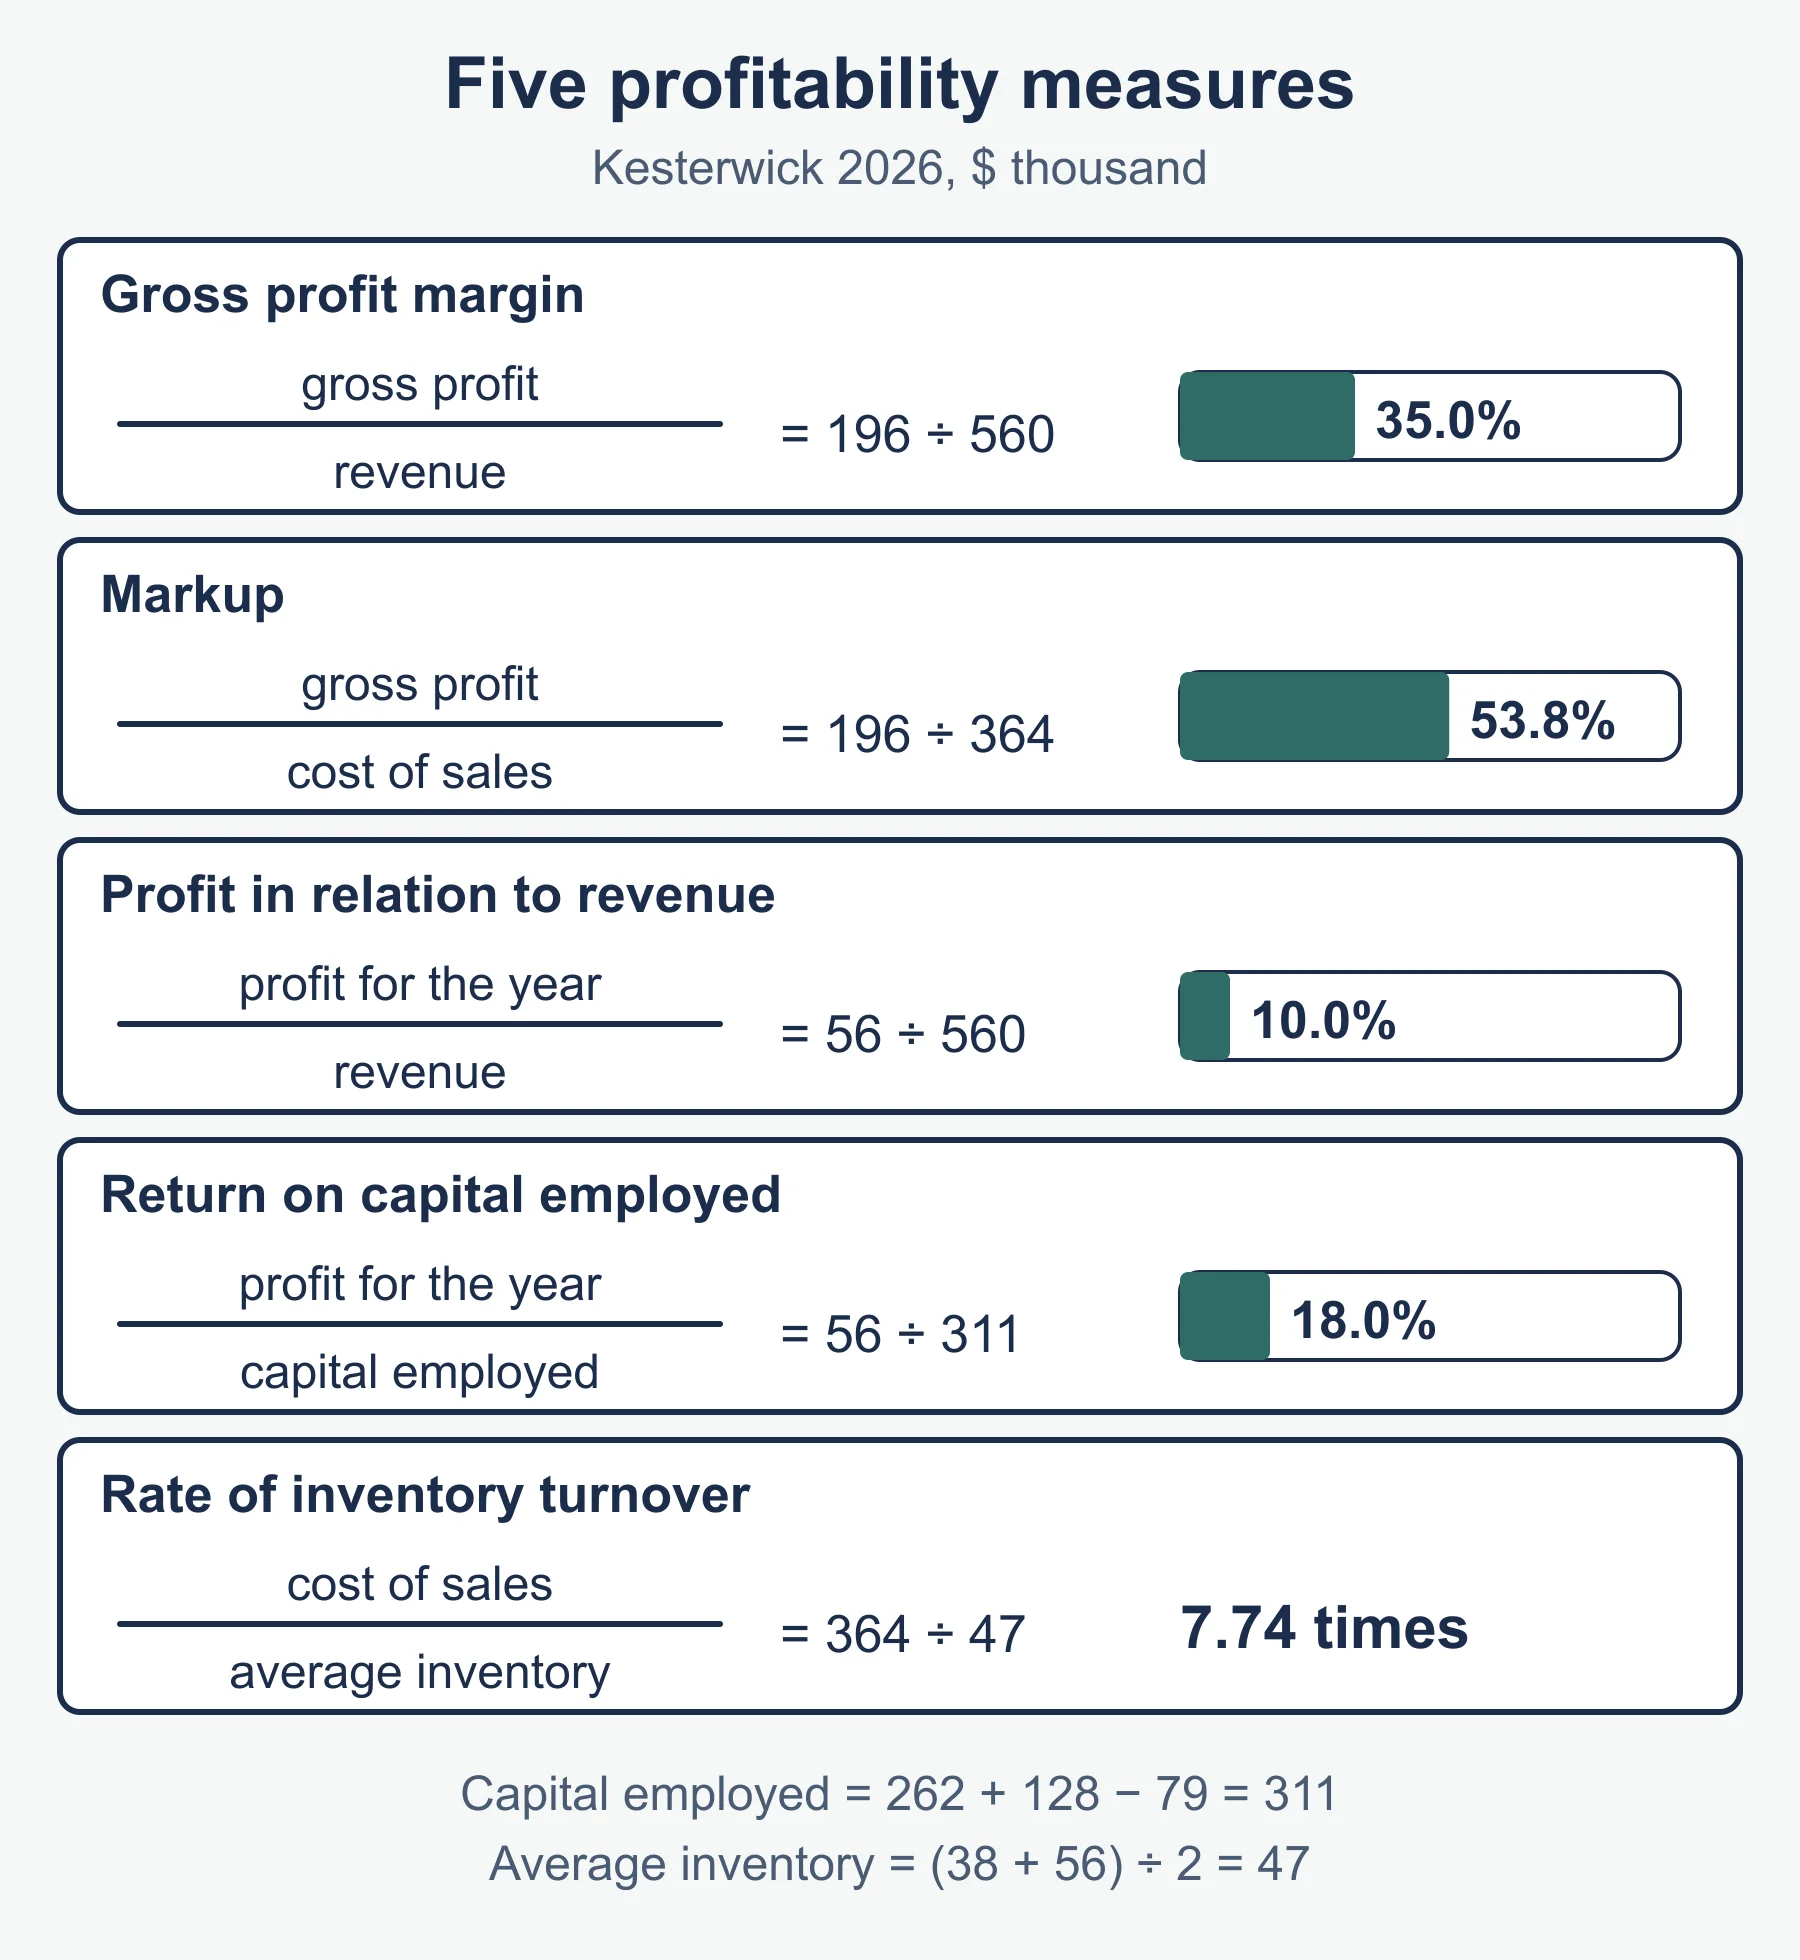
Step 1: profit. Gross profit is 180,000 in 2025 and 196,000 in 2026. Profit for the year is 60,000 and 56,000; with no loan interest, these are also the profits from operations used for profit in relation to revenue and ROCE.
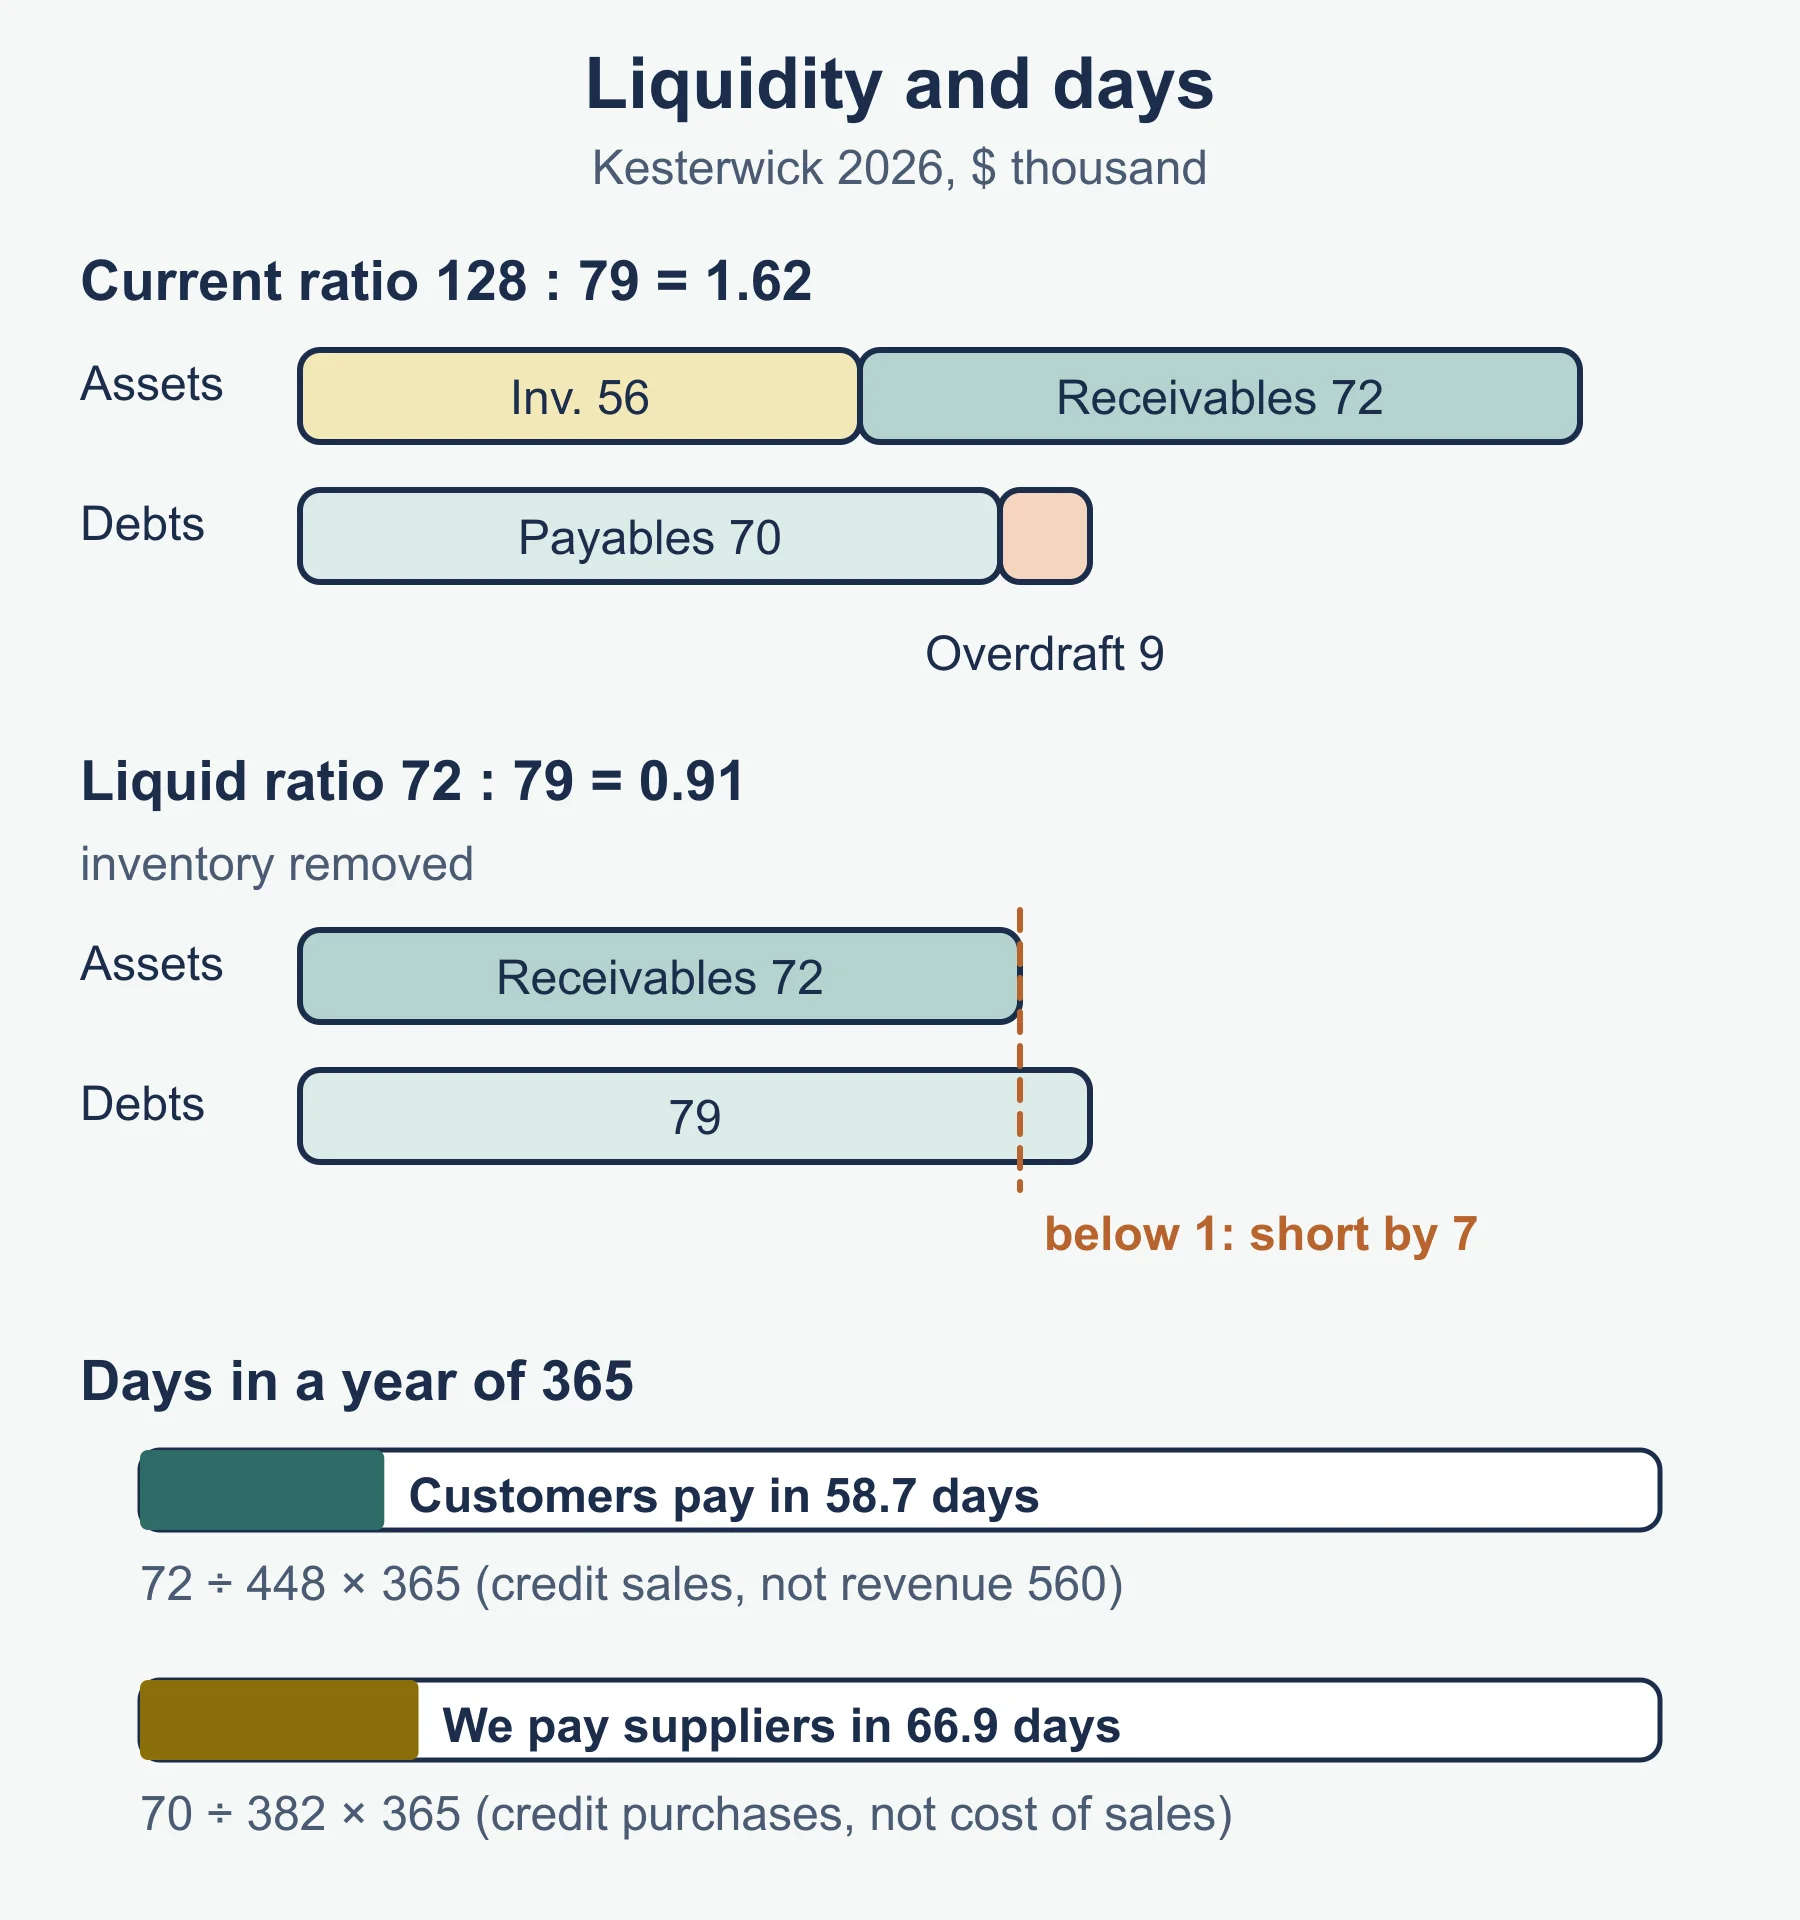
Step 2: current assets and liabilities. In 2025, current assets are 38,000 + 38,000 + 12,000 = 88,000 and current liabilities are 38,000. In 2026, current assets are 56,000 + 72,000 = 128,000 and current liabilities are 70,000 + 9,000 overdraft = 79,000. Capital employed is 250,000 + 88,000 - 38,000 = 300,000 in 2025 and 262,000 + 128,000 - 79,000 = 311,000 in 2026.
Step 3: the ratios.
| Measure | 2025 | 2026 |
|---|---|---|
| Gross profit margin | 37.5% | 35.0% |
| Markup | 60.0% | 53.8% |
| Profit in relation to revenue | 12.5% | 10.0% |
| Return on capital employed | 20.0% | 18.0% |
| Rate of inventory turnover | 8.33 times | 7.74 times |
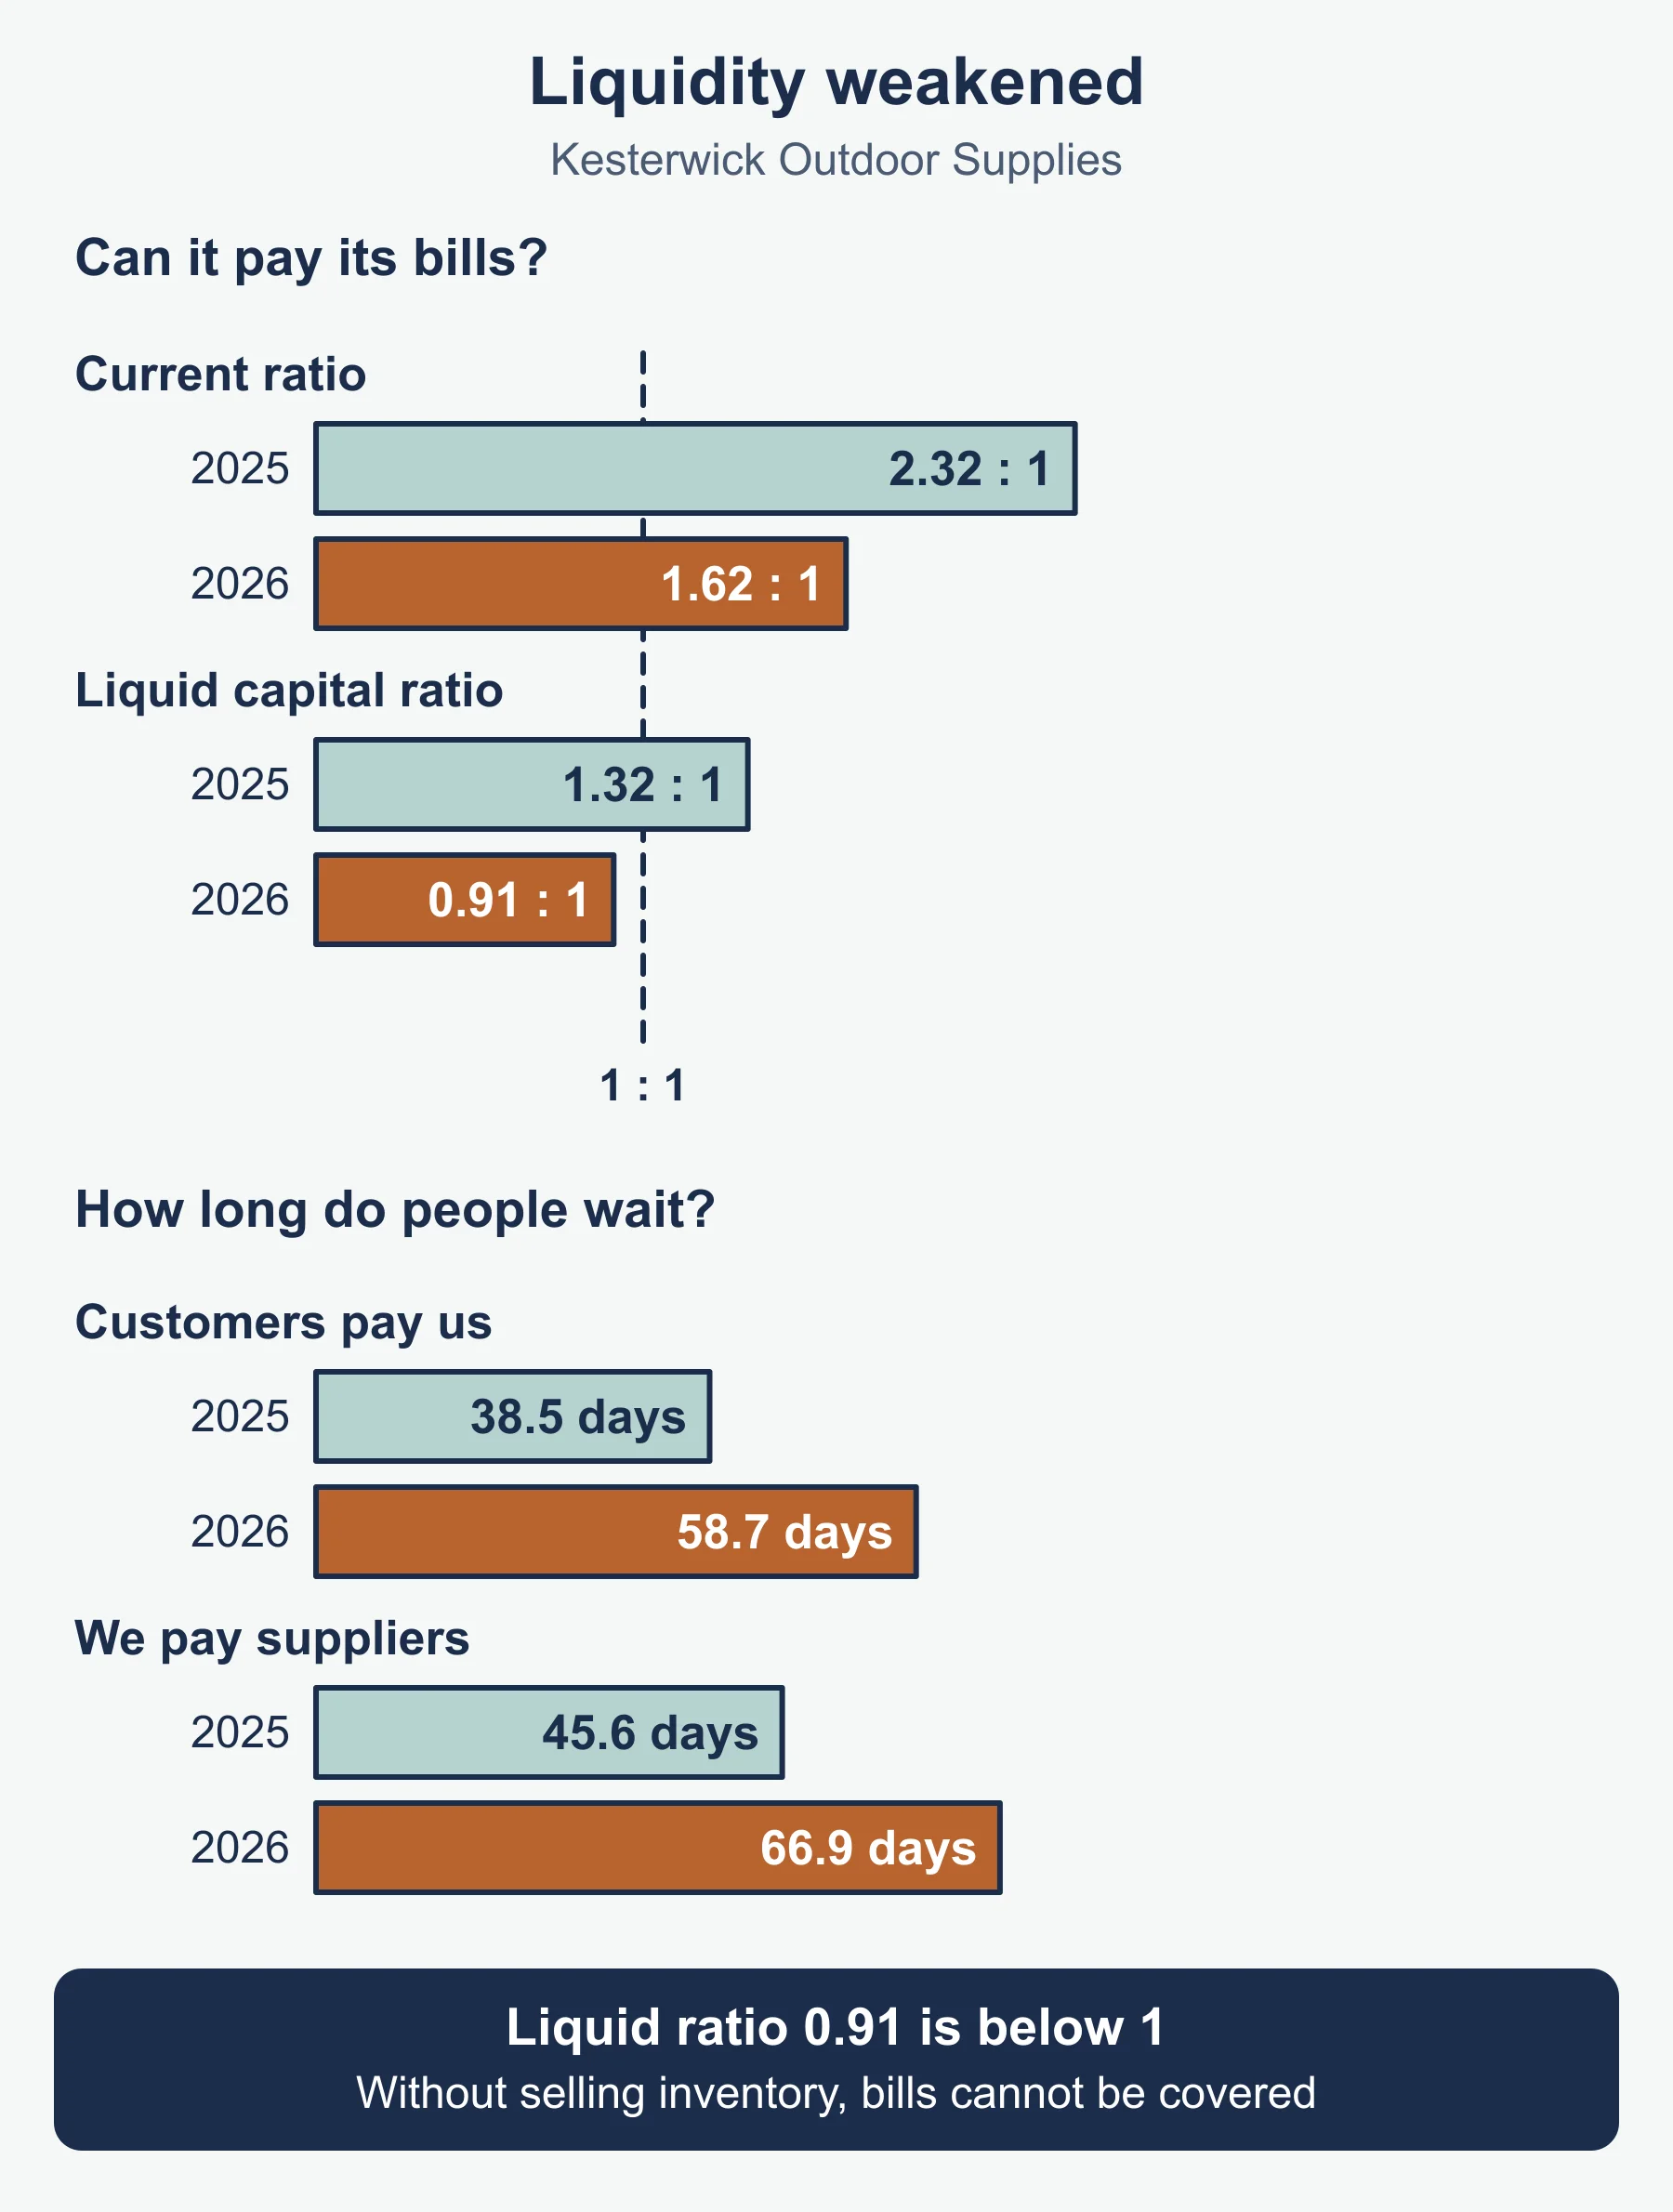
| Current ratio | 2.32 : 1 | 1.62 : 1 |
| Liquid capital ratio | 1.32 : 1 | 0.91 : 1 |
| Trade receivable days | 38.5 days | 58.7 days |
| Trade payable days | 45.6 days | 66.9 days |
The turnover uses average inventory of 36,000 and 47,000. Receivable days use credit sales, for example 72,000 / 448,000 x 365 = 58.7.
How to write an appraisal
A list of ratios earns little. Appraisal means using the figures to reach a judgement. Work in this order.
- State the result with its direction, for example “gross profit margin fell from 37.5% to 35.0%”.
- Compare it with something: the previous year, another business, or a target. A single ratio on its own means little.
- Give a reason that fits the facts in the question, for example “cost of sales rose faster than revenue, so either suppliers charged more or prices were cut”.
- Say whether this is good or bad for the business and who it matters to.
- Finish with a judgement or a recommendation.
Appraisal of Kesterwick, profitability. Revenue rose by 16.7% but profit fell by 6.7%, from 60,000 to 56,000. Gross profit margin fell by 2.5 percentage points, so the extra sales were earned at a lower margin, possibly through discounts. Expenses also rose faster than the gross profit gain, so profit in relation to revenue fell from 12.5% to 10.0%. ROCE fell from 20.0% to 18.0%, so each 100 invested earned less. Profitability weakened even though the business grew.
Appraisal of Kesterwick, liquidity. The current ratio fell from 2.32 : 1 to 1.62 : 1 and the liquid capital ratio from 1.32 : 1 to 0.91 : 1. A liquid ratio below 1 means that, without selling inventory, the business cannot cover its current liabilities. Receivable days rose from 38.5 to 58.7 while payable days rose from 45.6 to 66.9. Customers are paying slower, and Kesterwick is paying its own suppliers slower to cope, which risks supplier goodwill. Inventory turnover also slowed, so more cash is tied up in inventory. A sensible recommendation is to chase customers harder, offer a discount for early payment and reduce inventory levels.
Cash and profit are different
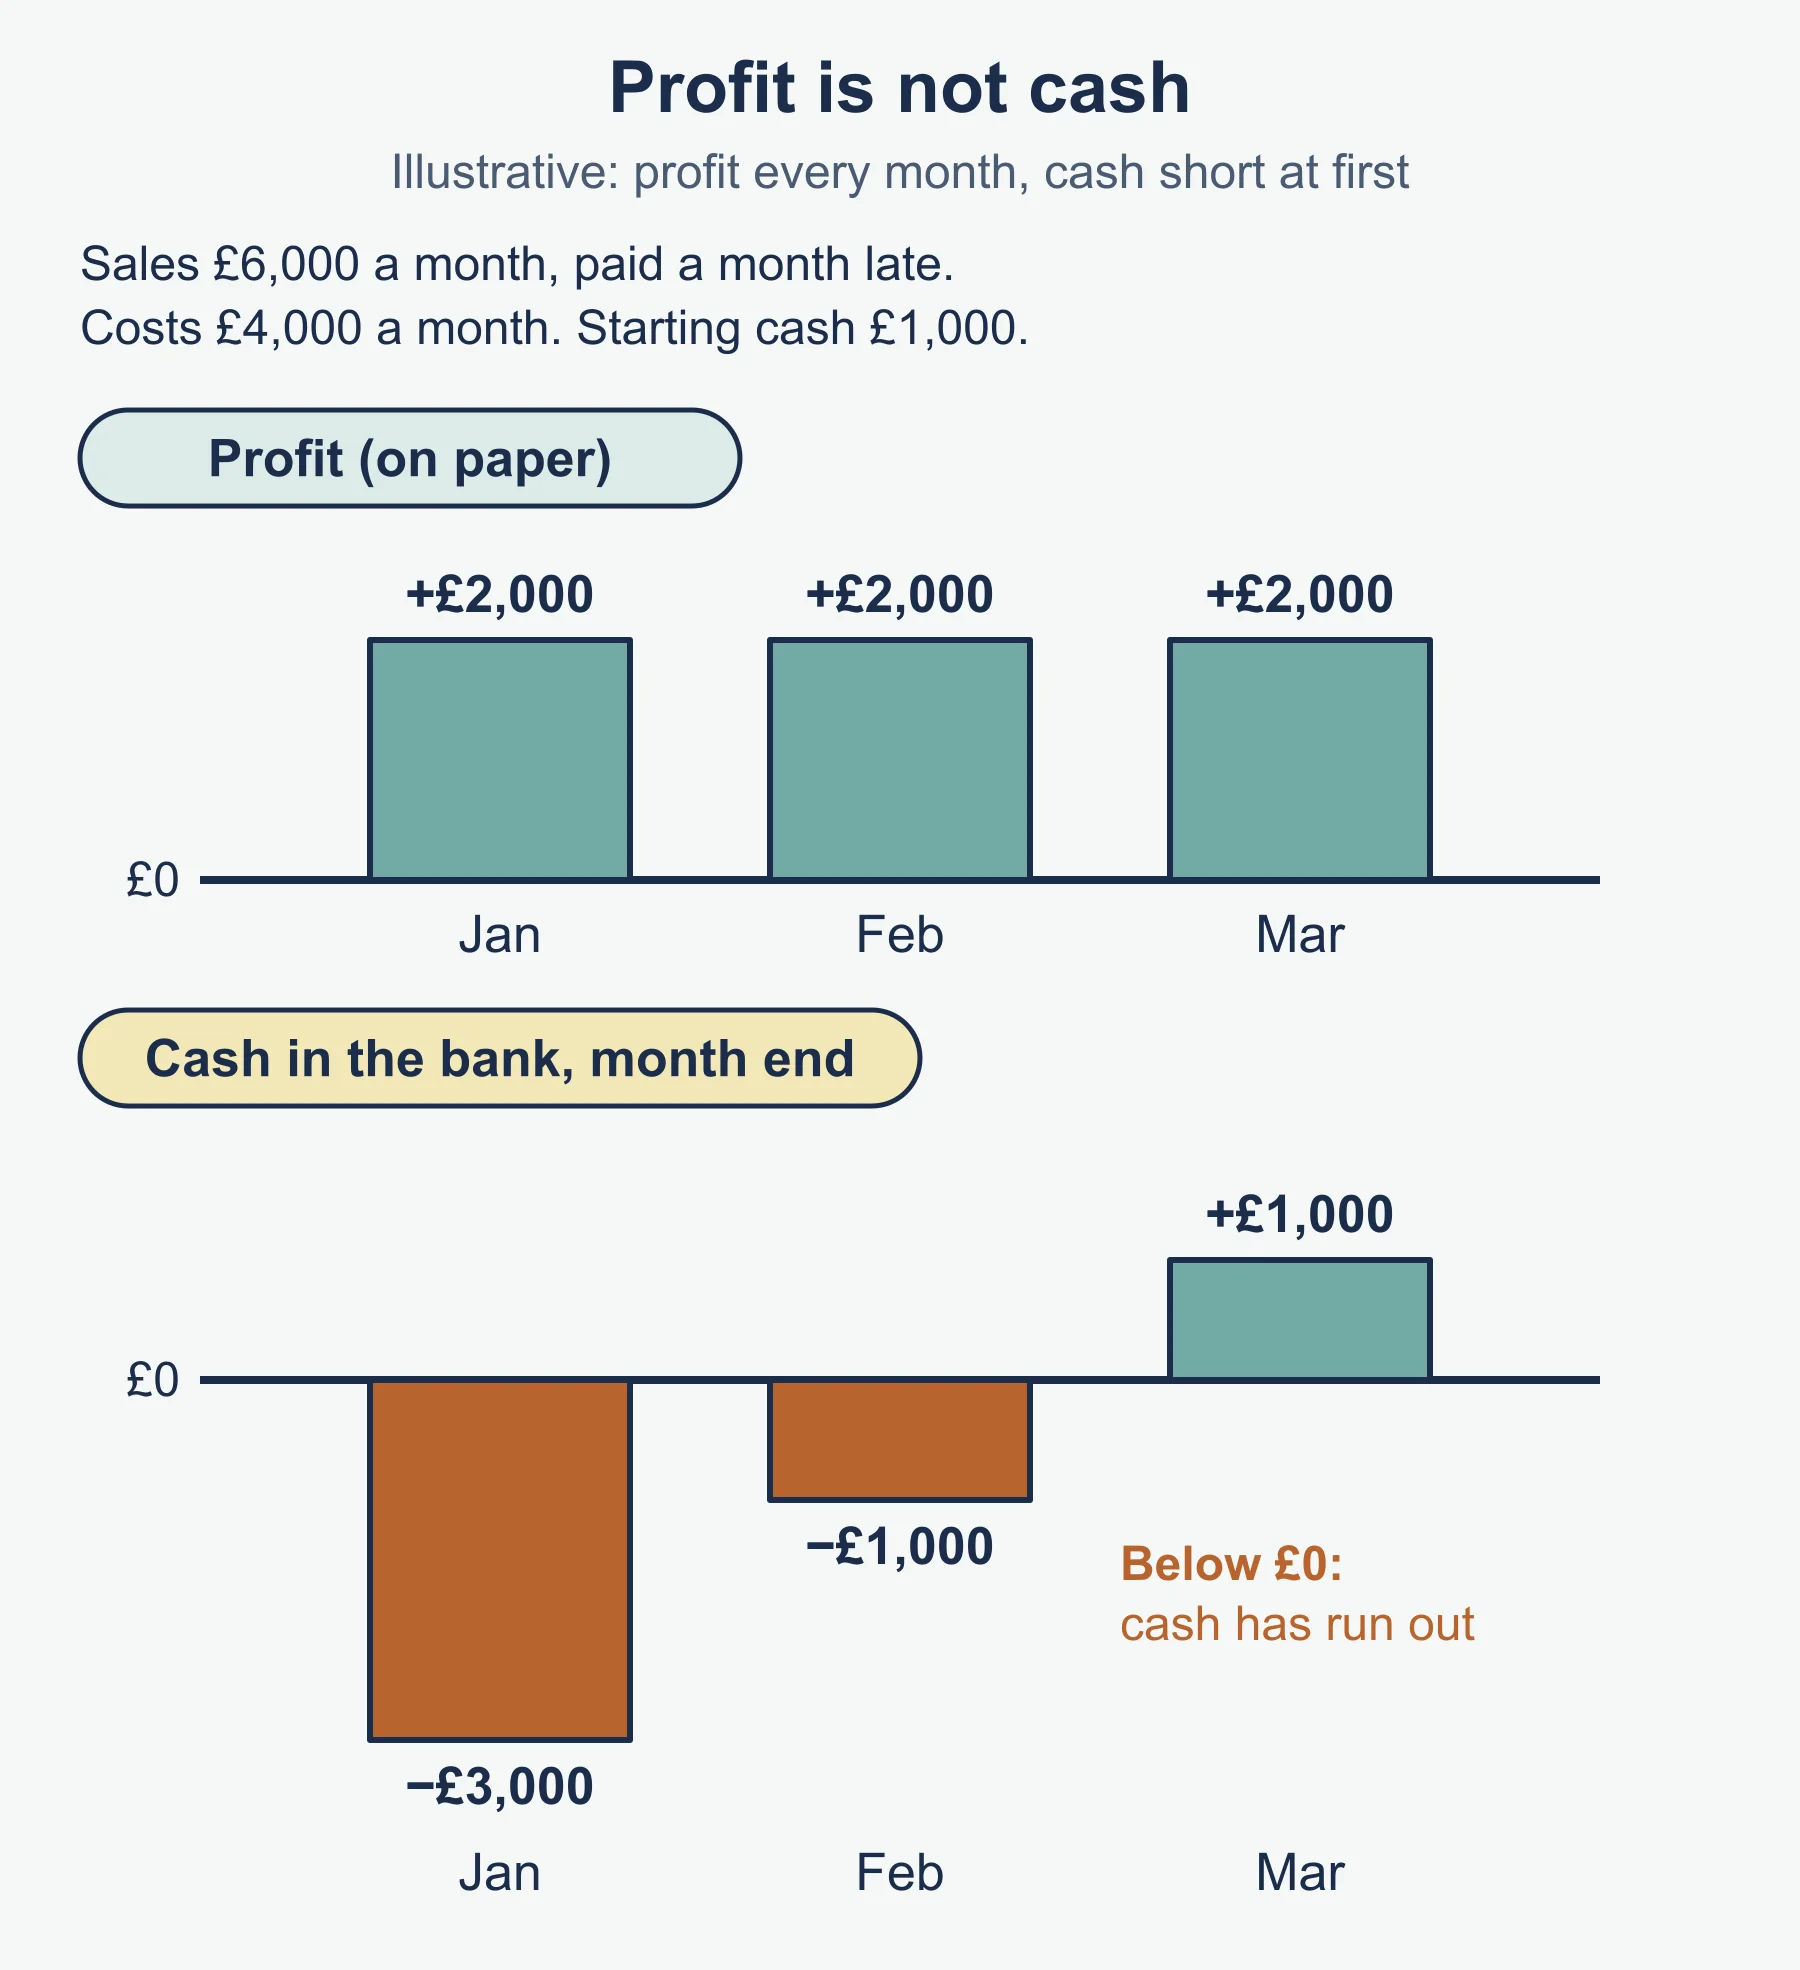
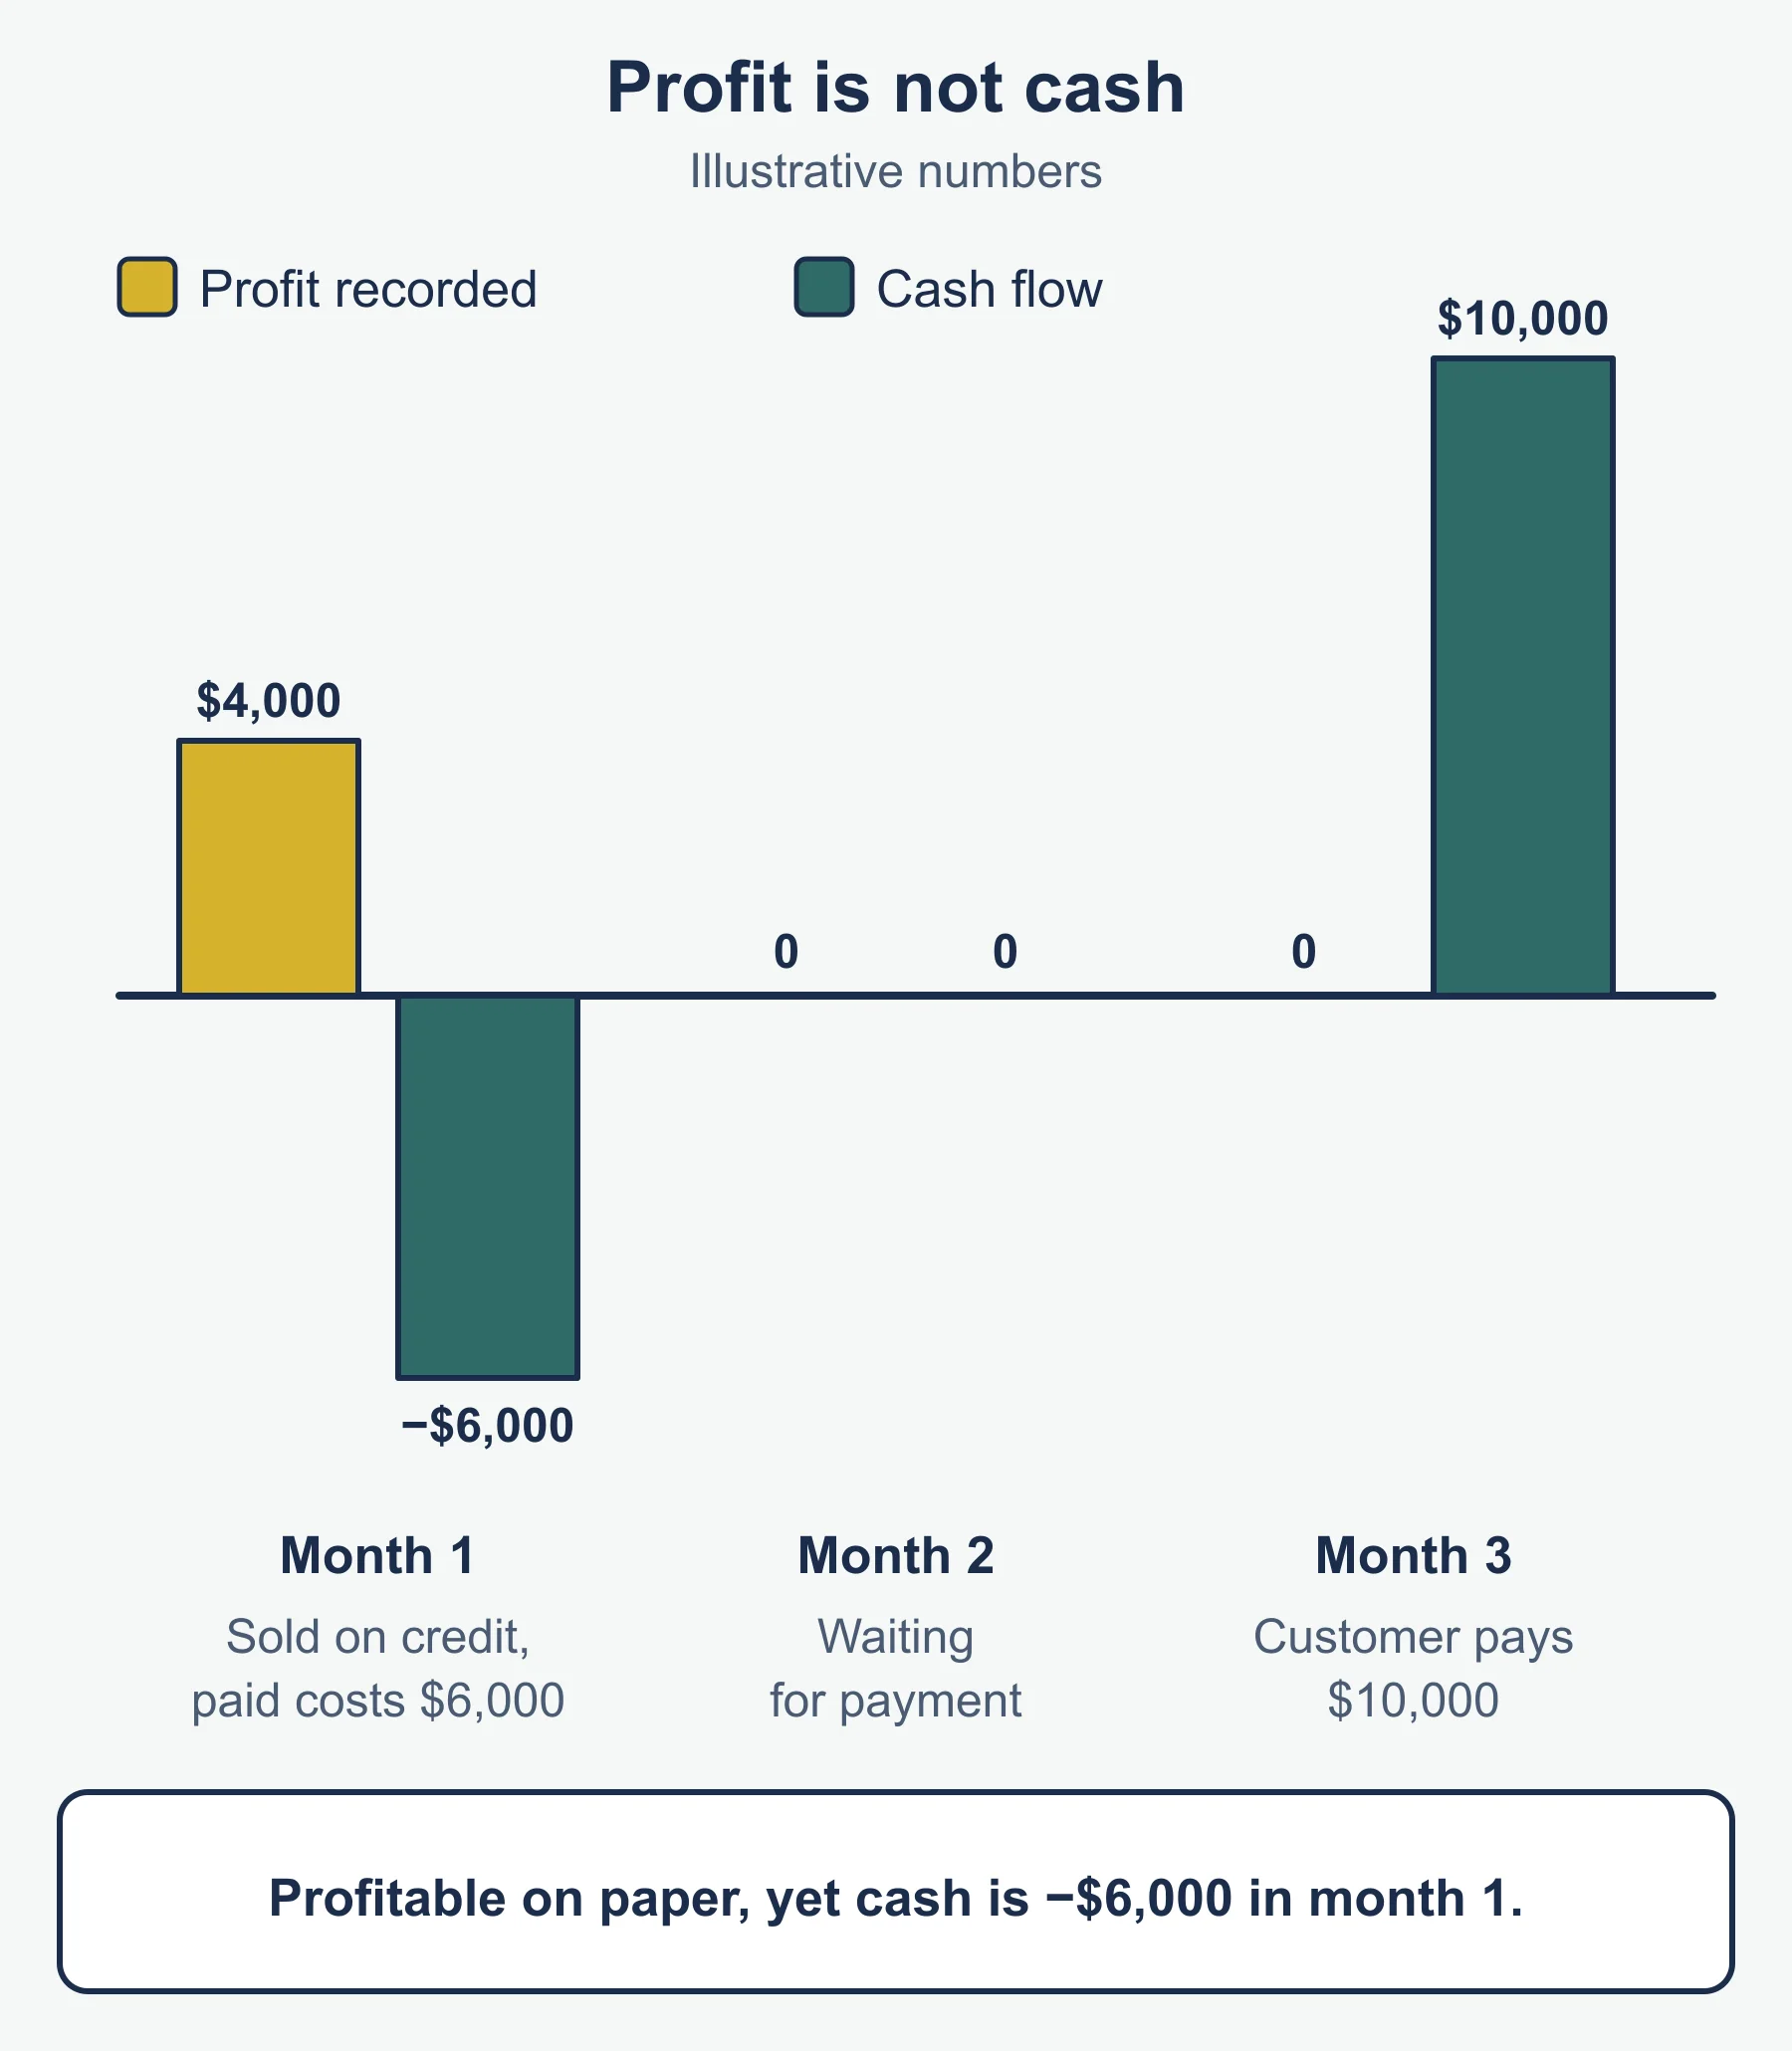
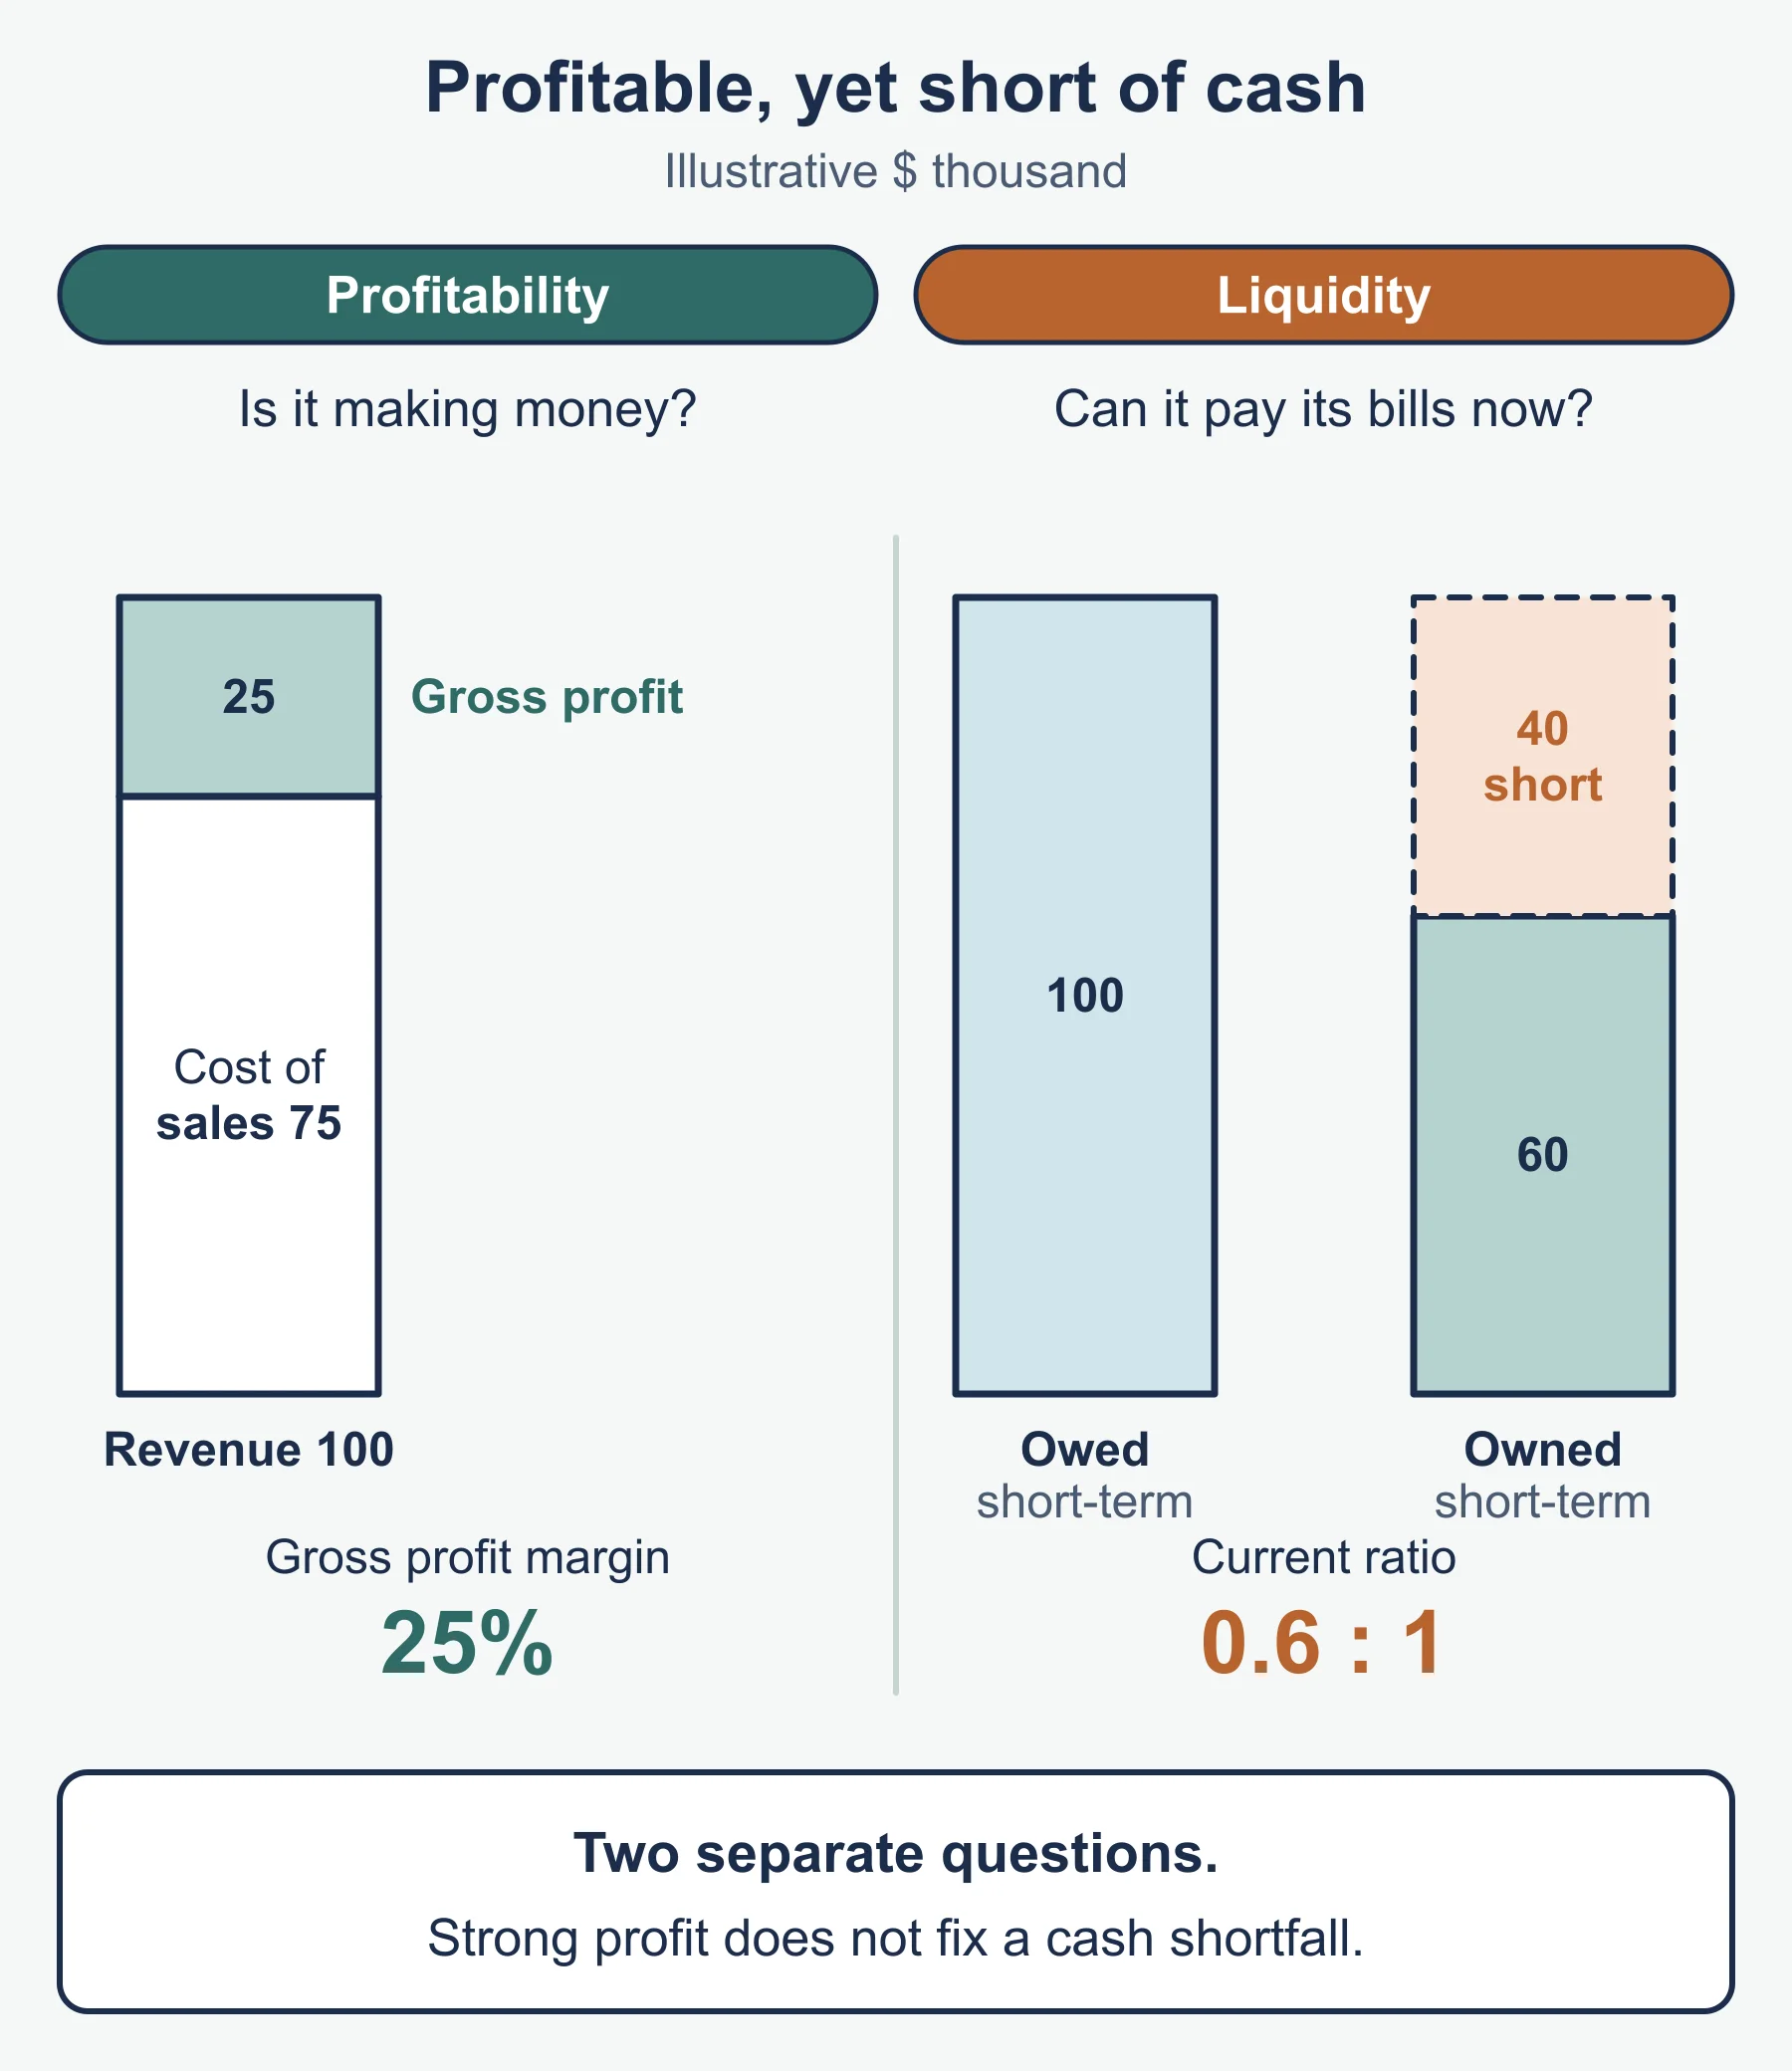
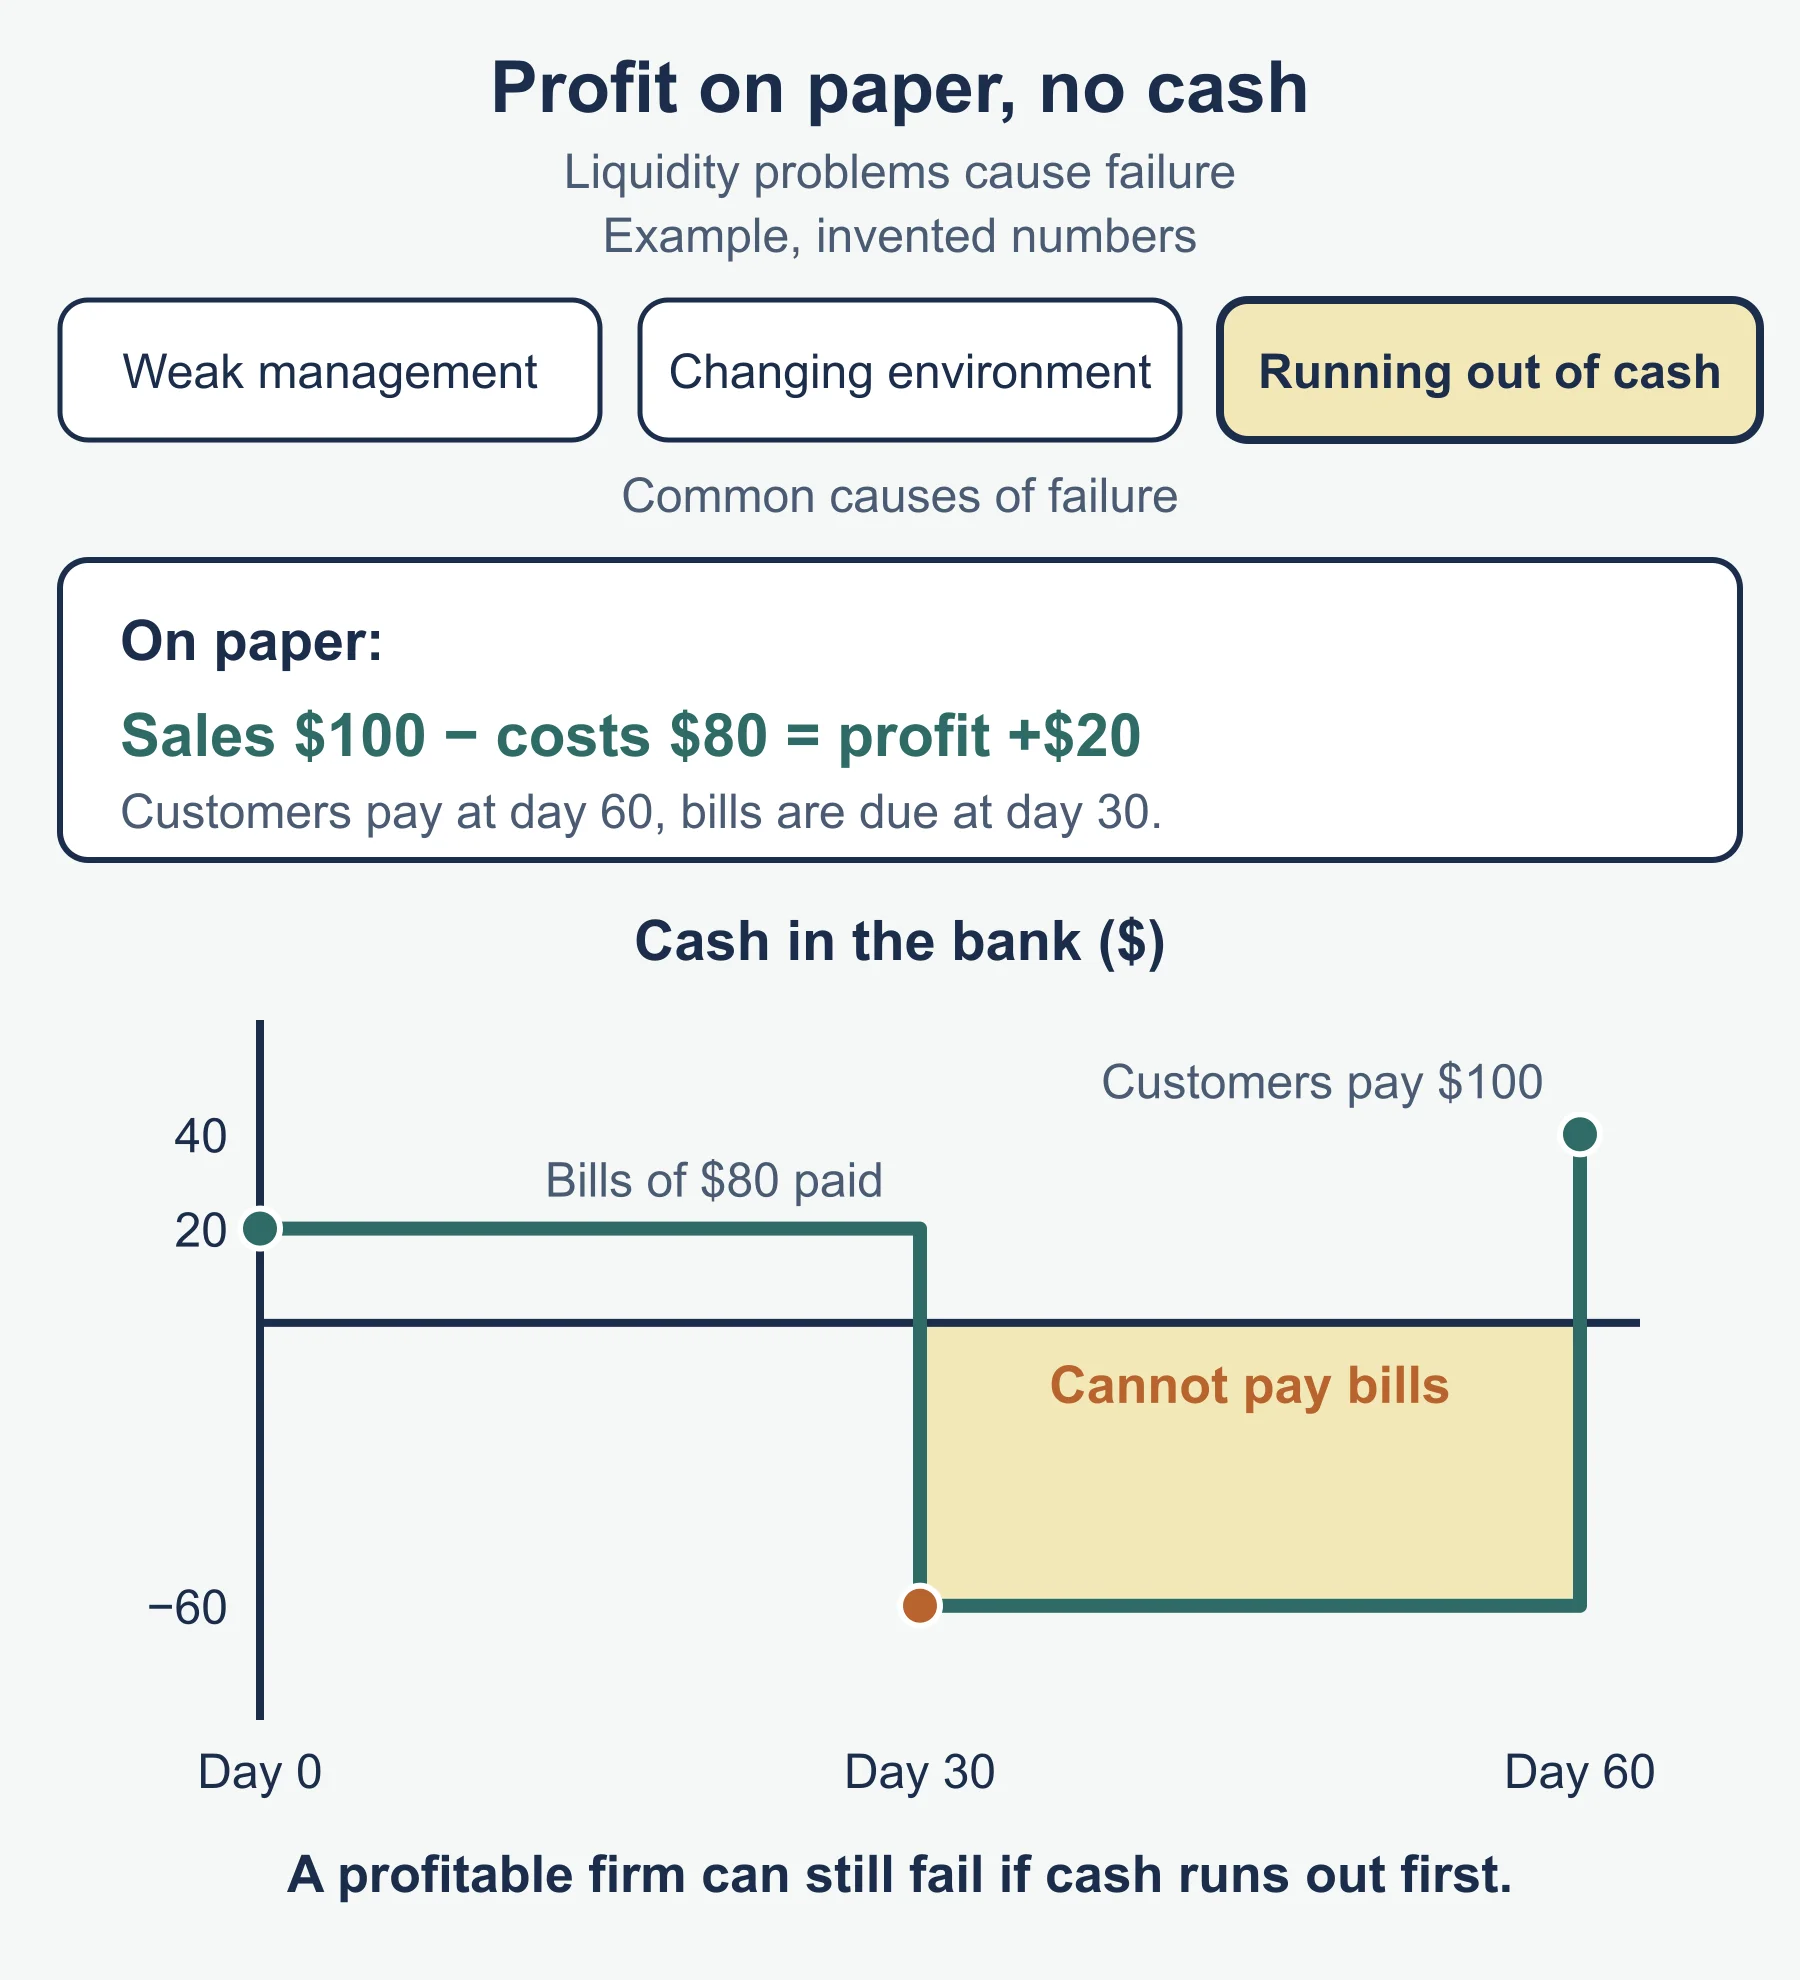
Profit is revenue minus expenses for a period. It follows the accruals approach, so a sale is counted when it is made, not when the money arrives. Cash is the money actually received and paid, including the bank balance. Liquidity is the ability to pay debts as they fall due, which depends on cash and on assets that turn into cash quickly.
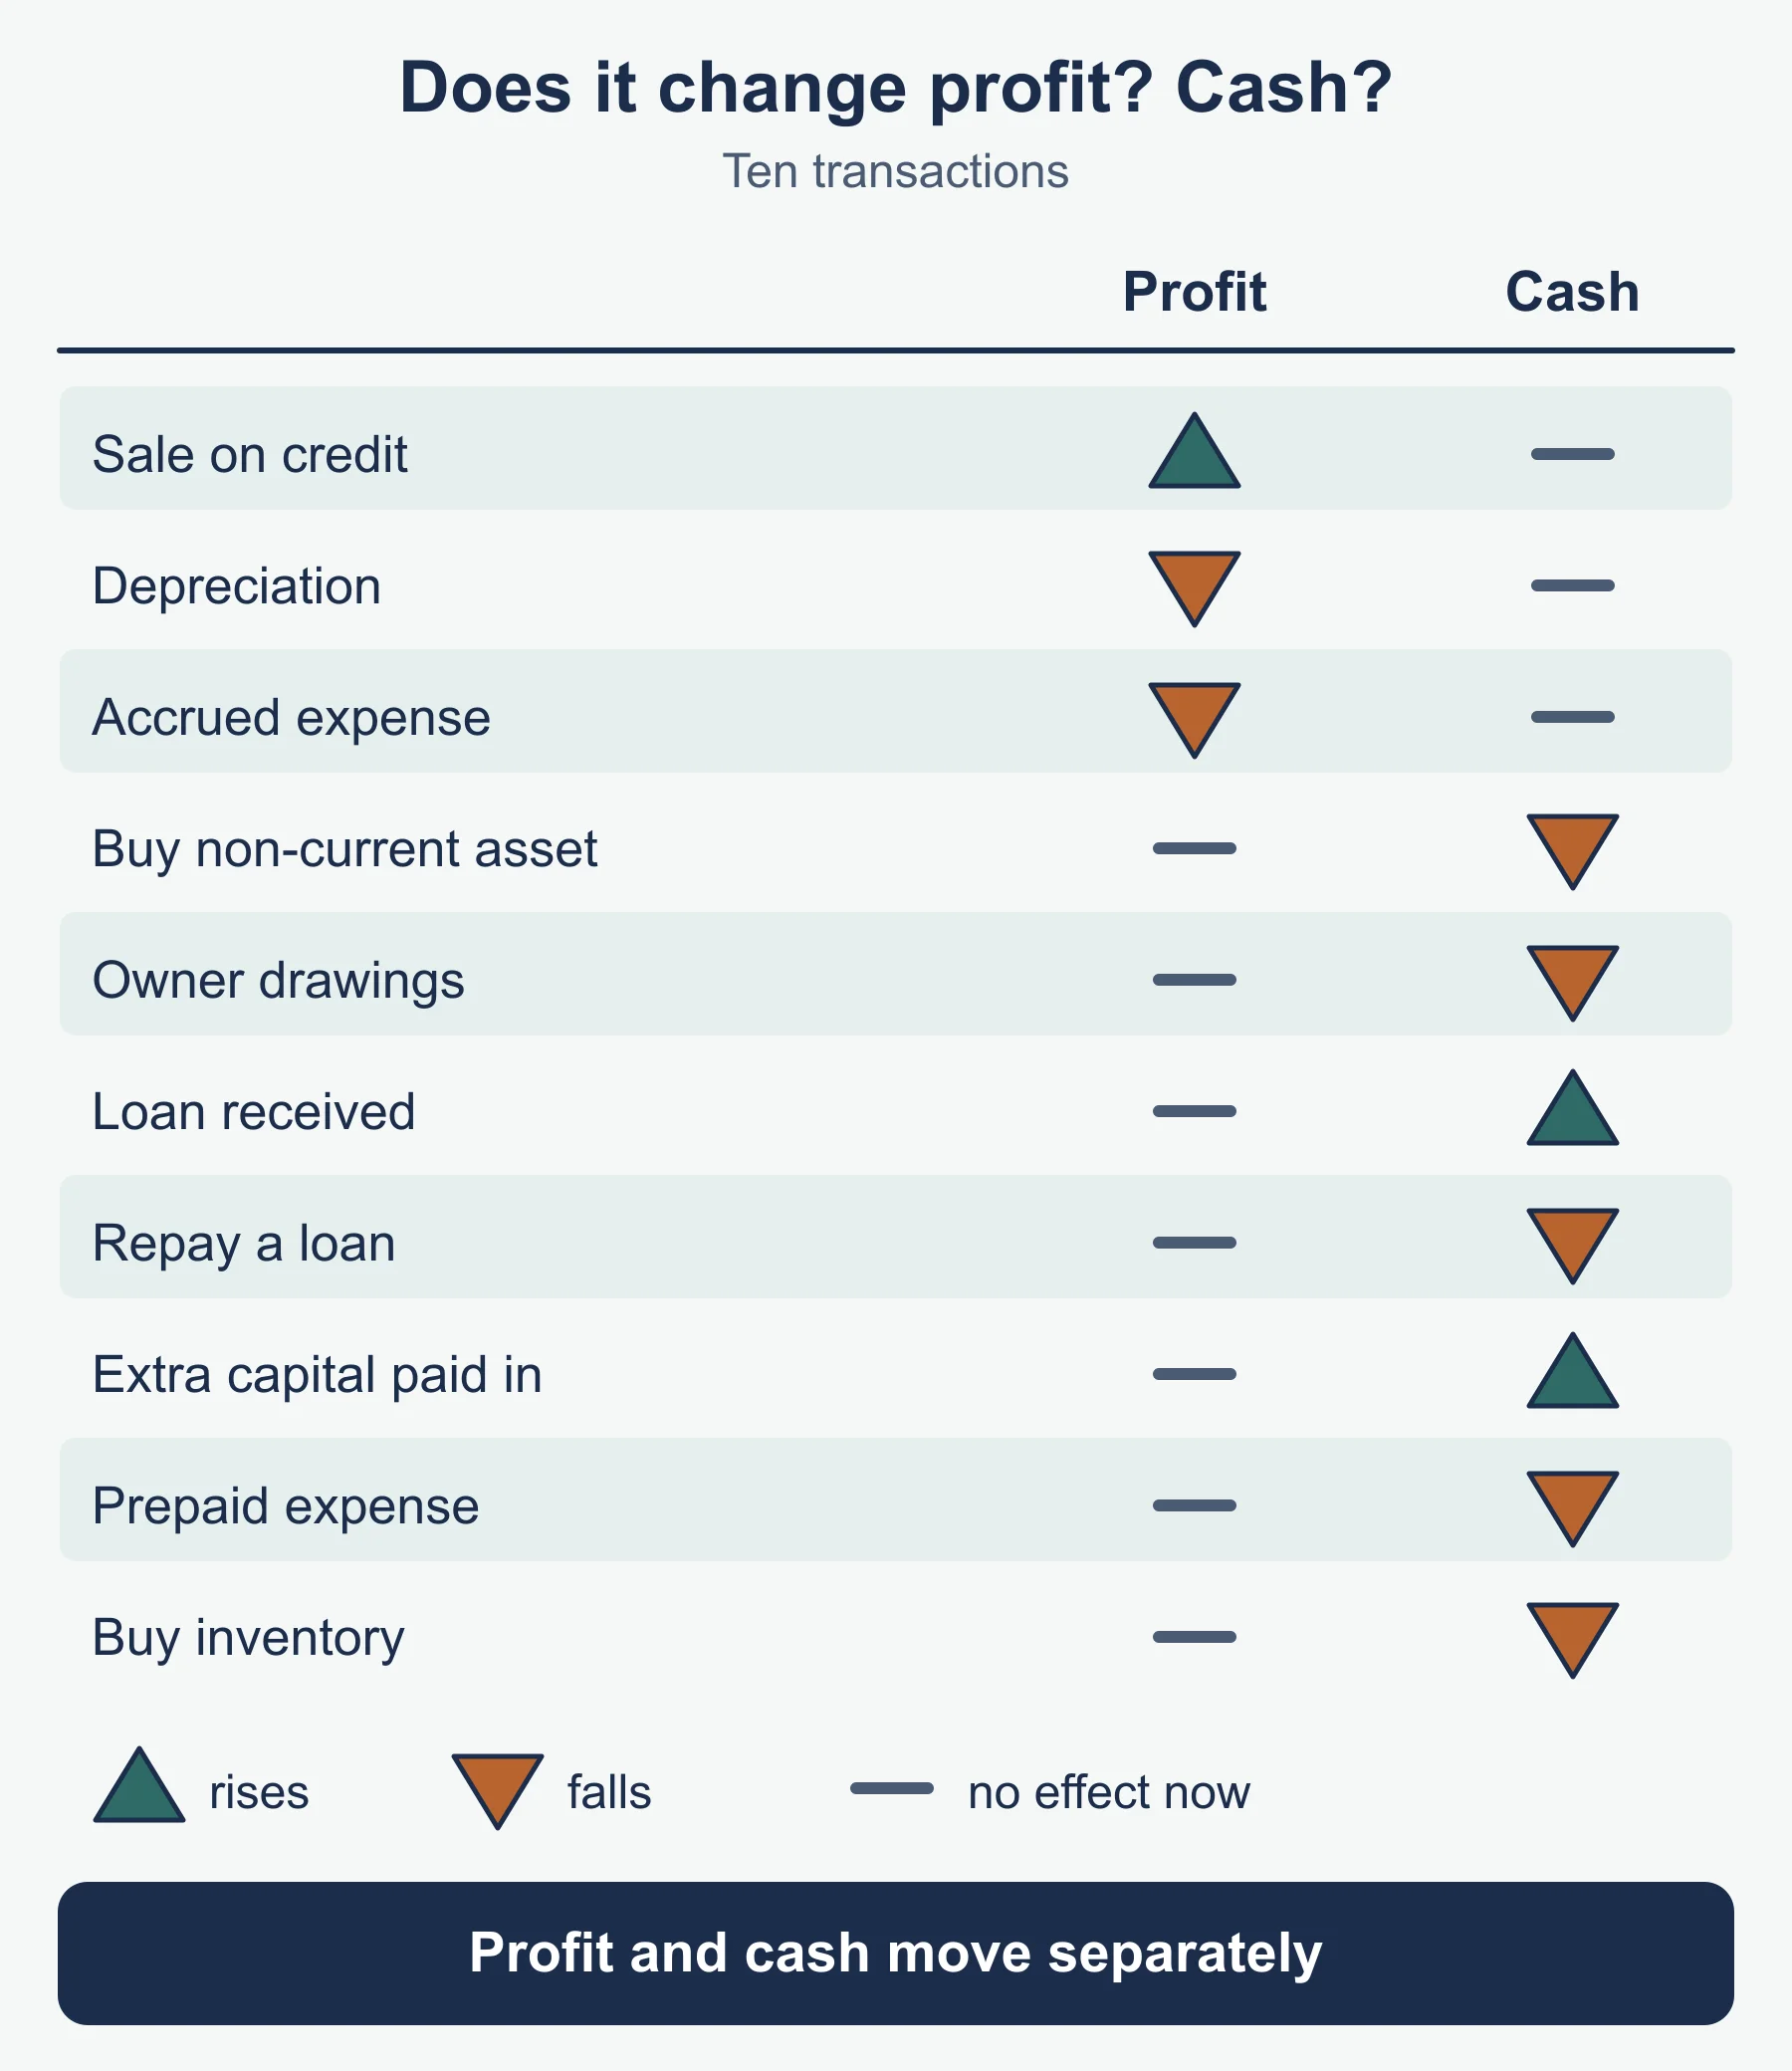
| Item | Effect on profit | Effect on cash |
|---|---|---|
| Sale on credit | Increases profit now | No cash until the customer pays |
| Depreciation | Reduces profit | No cash leaves; it is not a payment |
| Buying a non-current asset | No effect at purchase (depreciation later) | Cash falls at once |
| Drawings by the owner | None (not an expense) | Cash falls |
| Loan received | None (a liability) | Cash rises |
| Repaying a loan | None | Cash falls |
| Extra capital paid in | None | Cash rises |
| Accrued expense | Reduces profit | No cash paid yet |
| Prepaid expense | Not charged this year | Cash already paid |
| Buying inventory | No effect until sold | Cash falls, or payables rise if on credit |
So a profitable business can have no cash, for example when profit is tied up in receivables and inventory or spent on non-current assets and drawings. A business making a loss can have cash if it has just taken a loan or sold a non-current asset.
Worked example 2: effect of transactions on liquidity
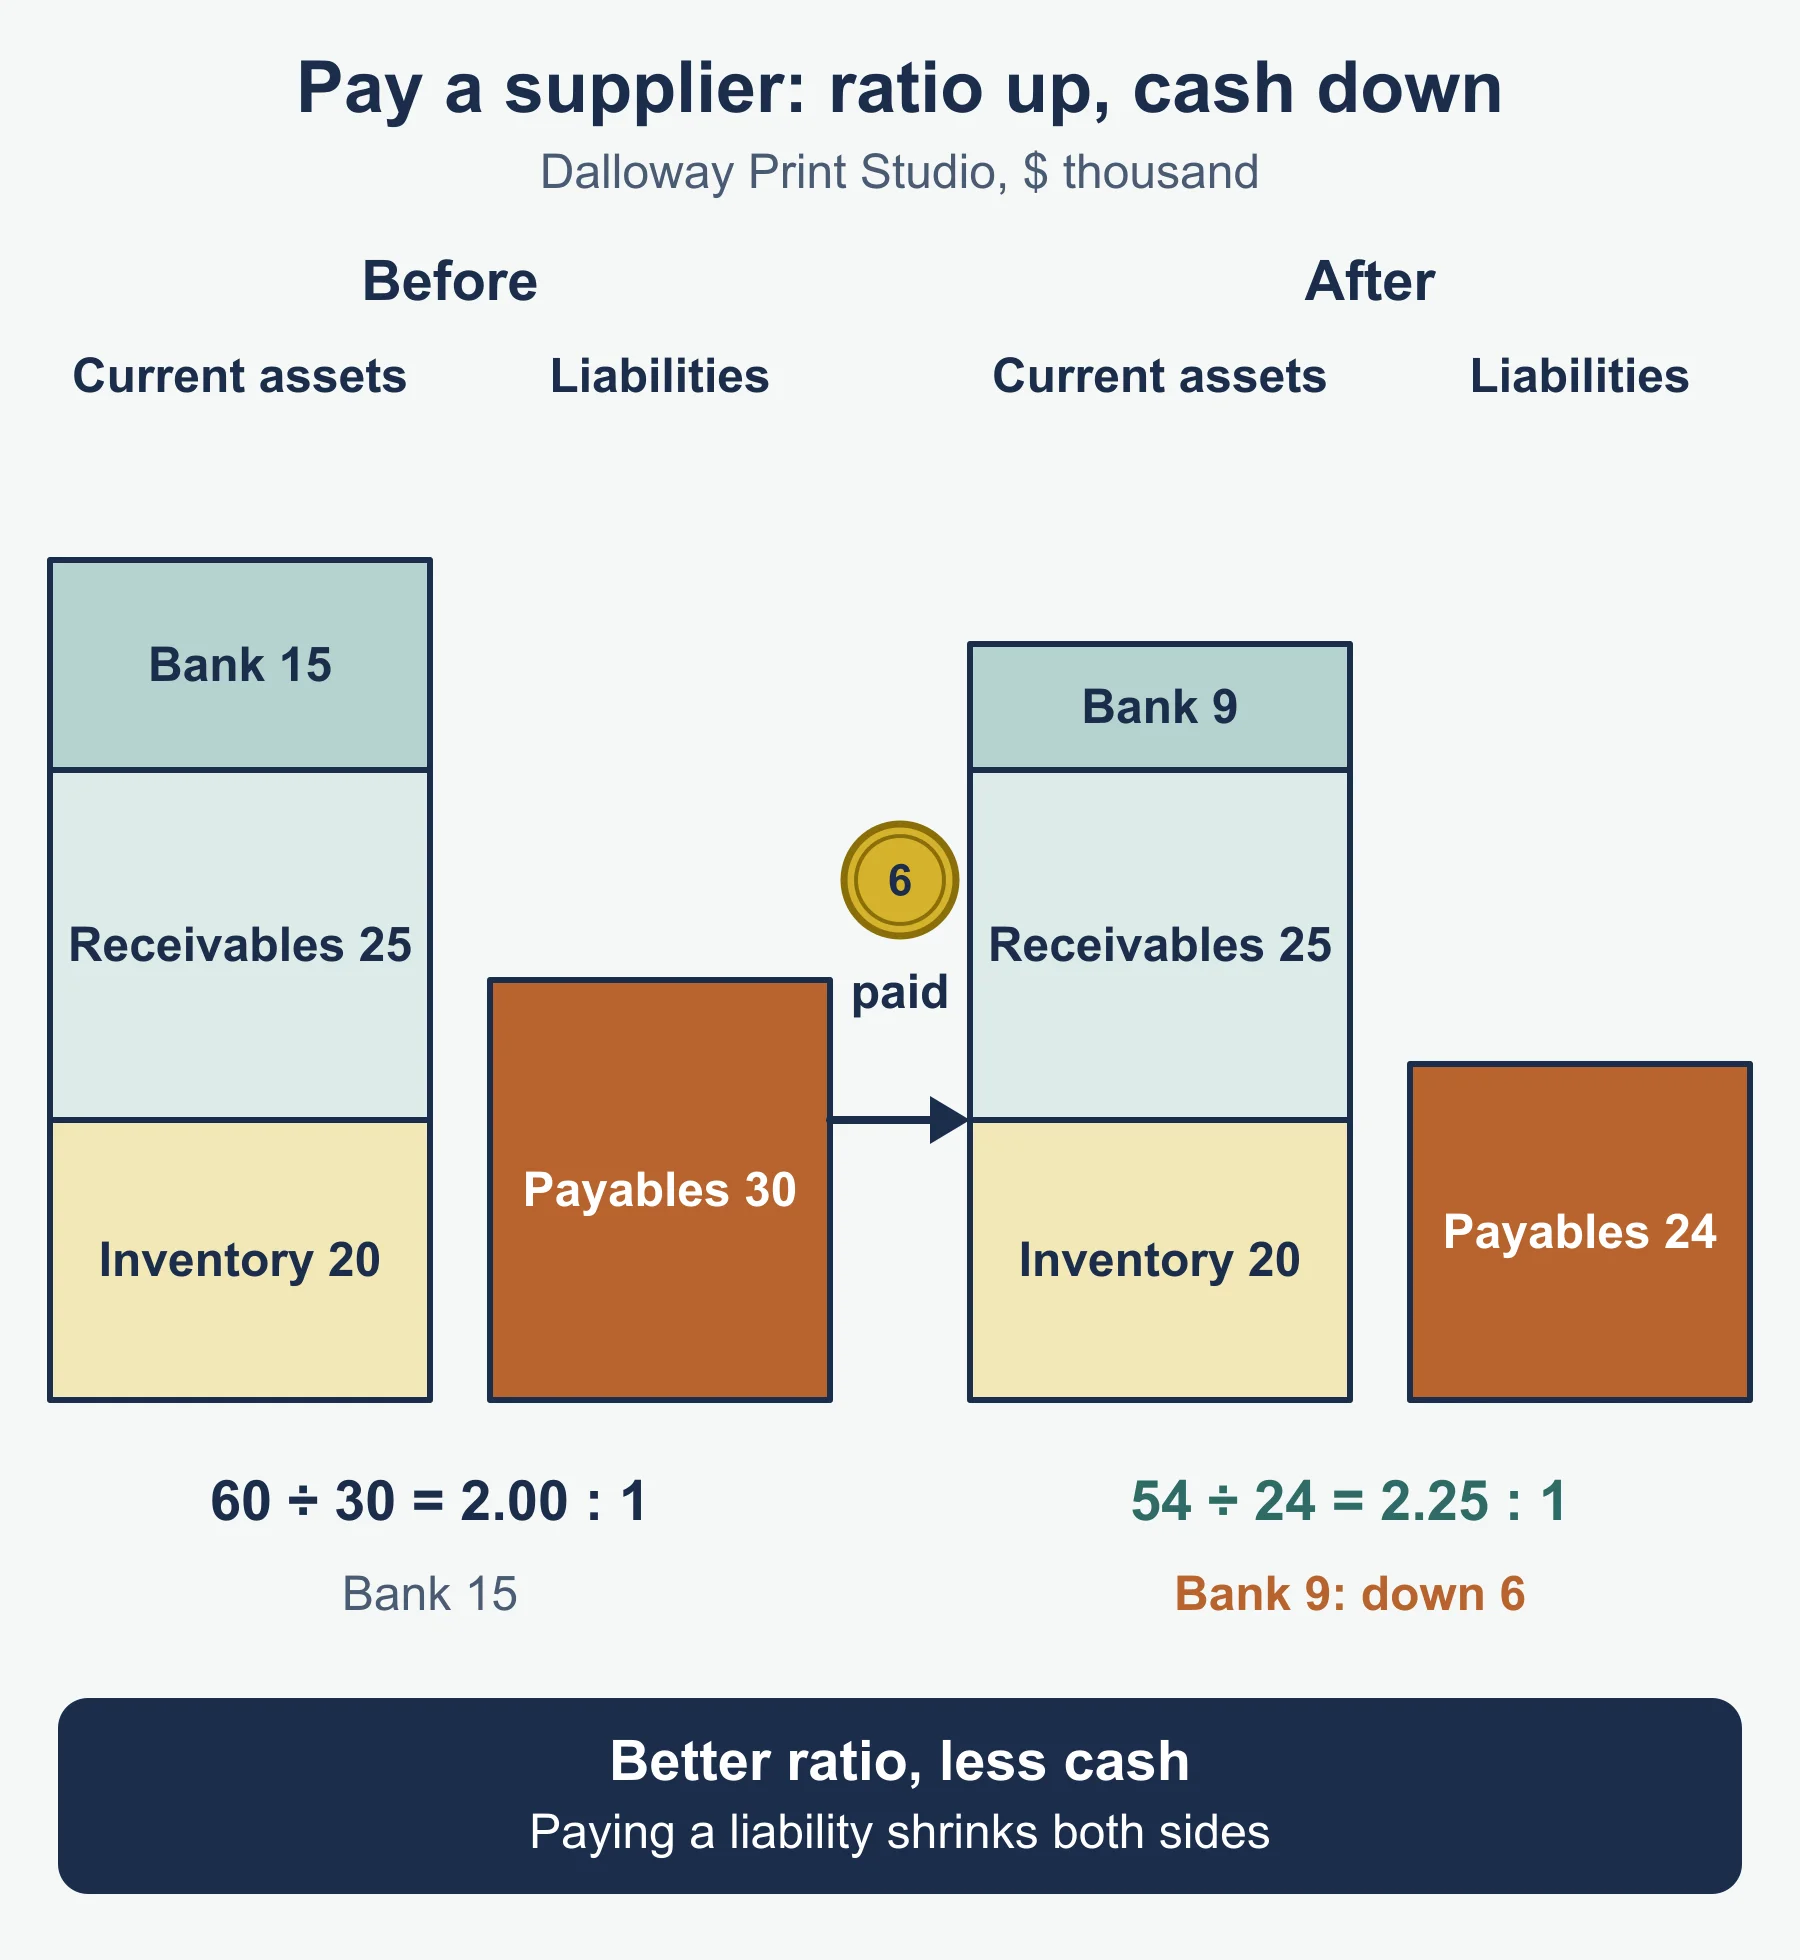
Dalloway Print Studio starts with inventory 20,000, trade receivables 25,000, bank 15,000 and trade payables 30,000. Current assets are 60,000, so the current ratio is 2.00 : 1 and the liquid capital ratio is (60,000 - 20,000) / 30,000 = 1.33 : 1. Treat each transaction separately from this starting point.
| Transaction | Effect on profit | Cash | Current ratio | Liquid ratio |
|---|---|---|---|---|
| Buys a machine for 9,000 from the bank | None | -9,000 | 1.70 : 1 | 1.03 : 1 |
| A customer pays 10,000 owed | None | +10,000 | 2.00 : 1 | 1.33 : 1 |
| Buys 12,000 of inventory on credit | None | None | 1.71 : 1 | 0.95 : 1 |
| Charges 5,000 depreciation | -5,000 | None | 2.00 : 1 | 1.33 : 1 |
| Sells goods on credit for 16,000, cost 10,000 | +6,000 | None | 2.20 : 1 | 1.87 : 1 |
| Owner takes 4,000 drawings from the bank | None | -4,000 | 1.87 : 1 | 1.20 : 1 |
| Pays suppliers 6,000 from the bank | None | -6,000 | 2.25 : 1 | 1.42 : 1 |
Two lessons. First, the last row shows the current ratio rising while cash falls, because paying a liability shrinks both sides when the ratio is above 1. A better ratio does not mean more cash. Second, depreciation changes profit and the statement of financial position, but not cash or the current ratio, because non-current assets are not current assets.
Worked example 3: why profit and cash moved apart
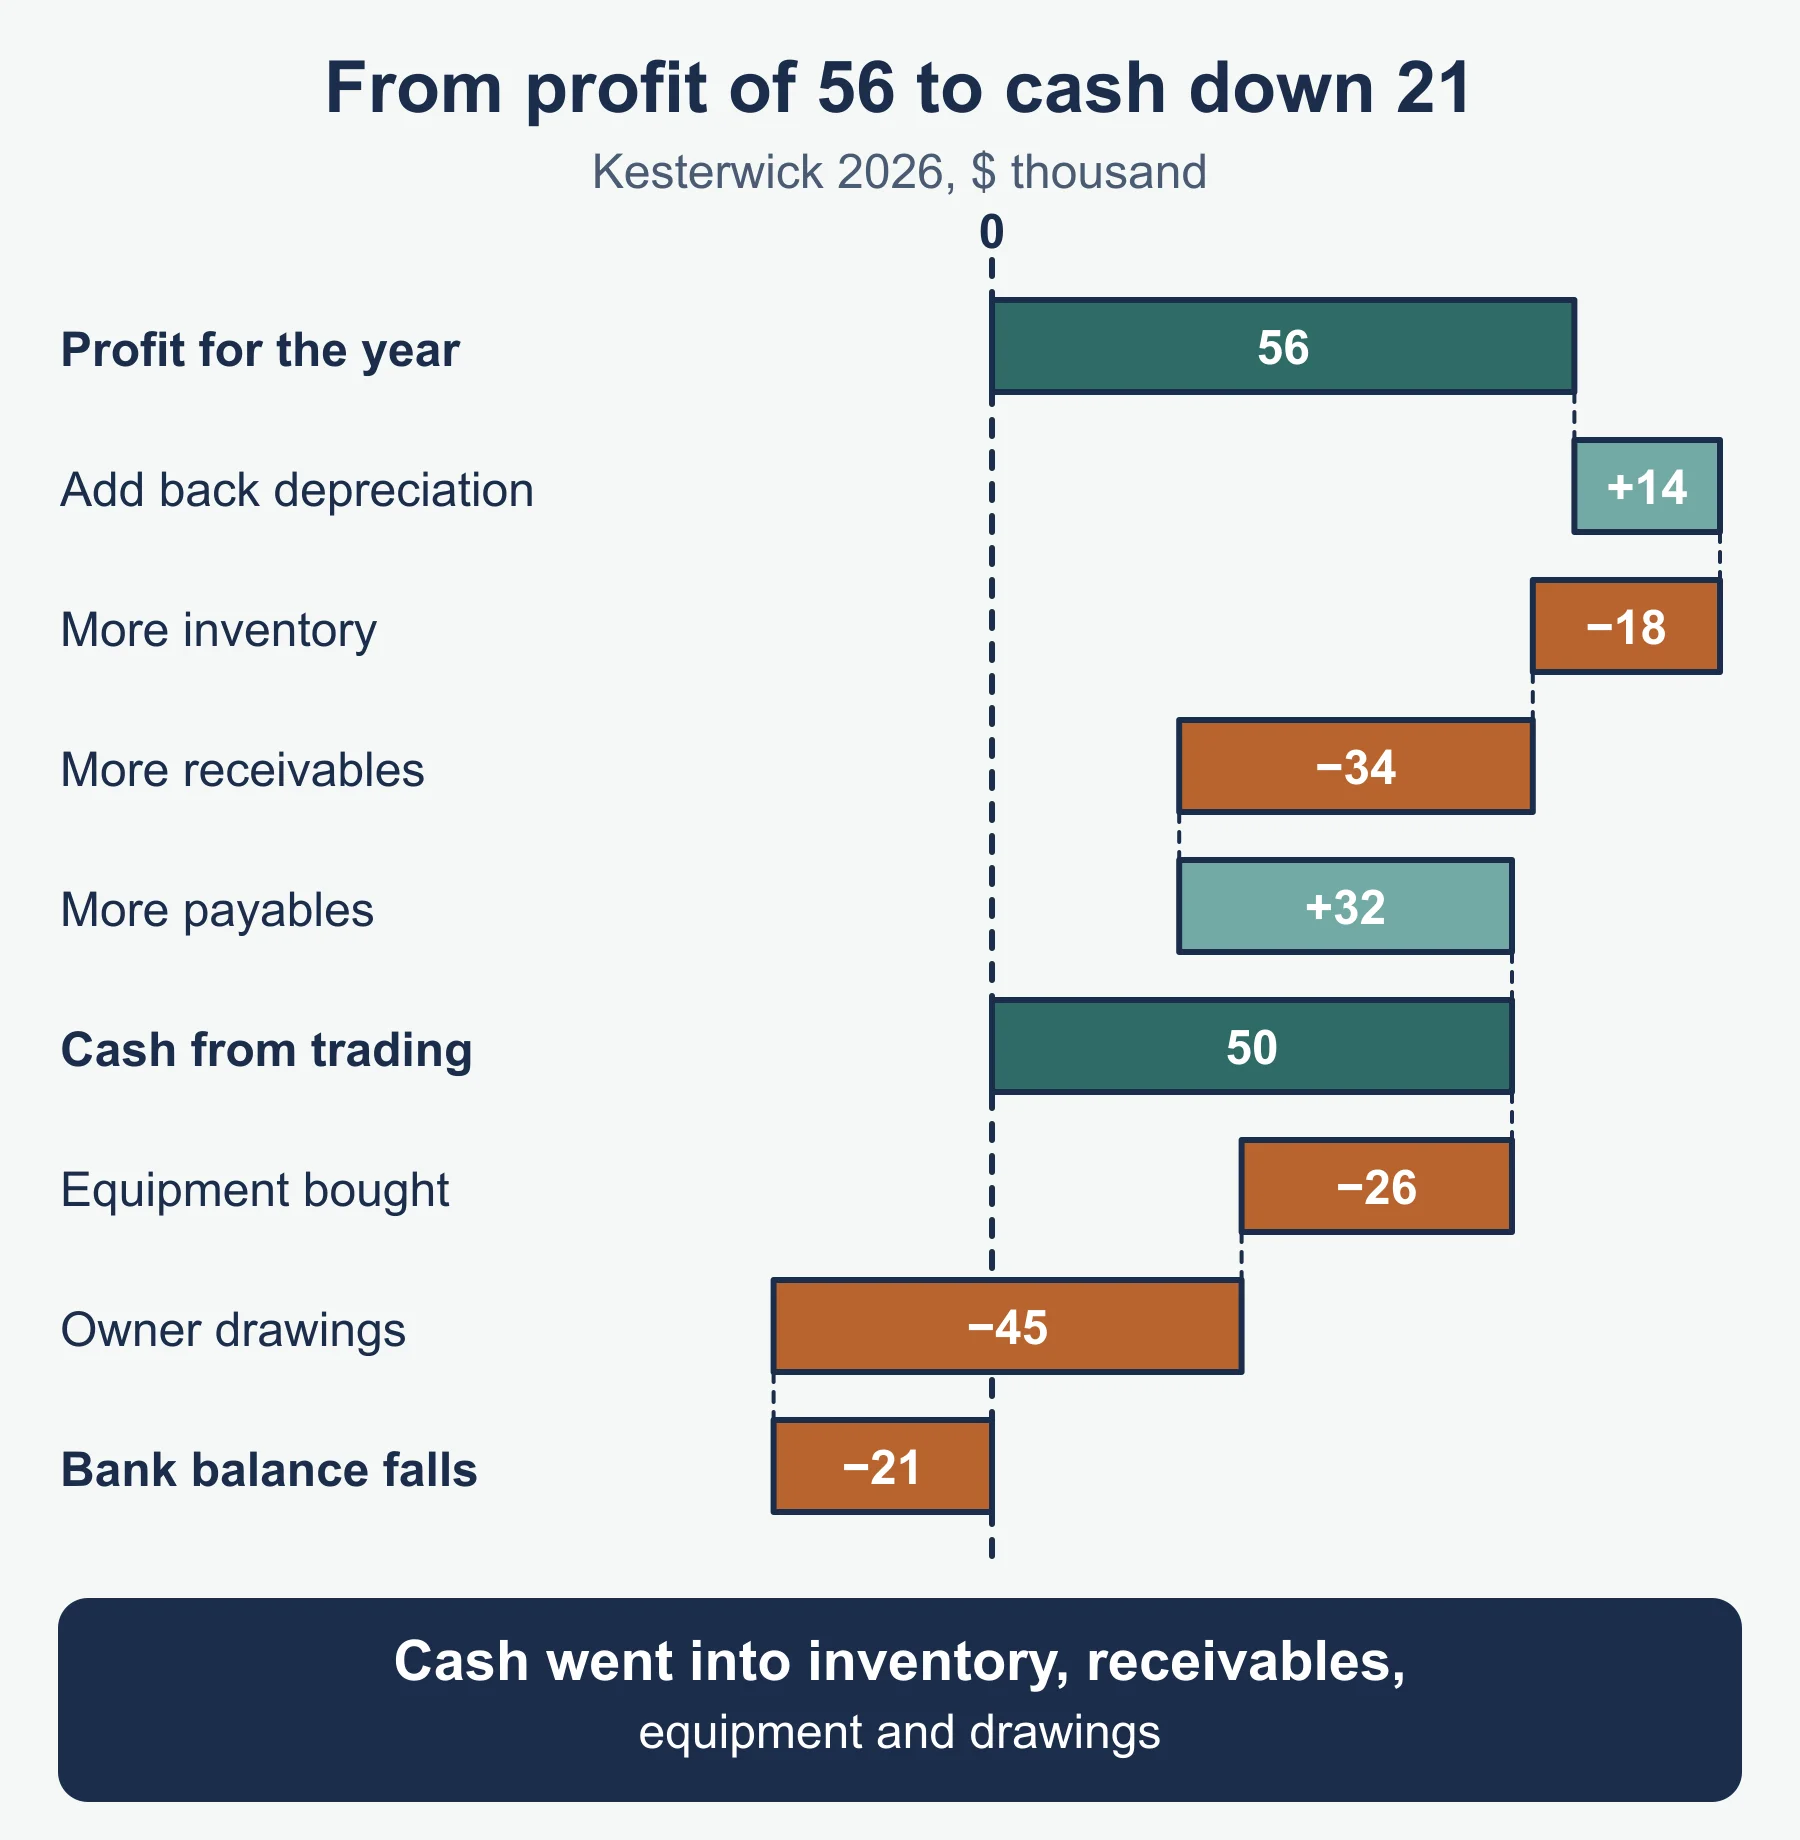
Return to Kesterwick in 2026. Profit was 56,000, yet the bank went from 12,000 in credit to a 9,000 overdraft, a fall of 21,000. Expenses include 14,000 depreciation, non-current assets cost 26,000 to buy (250,000 + 26,000 - 14,000 = 262,000) and drawings were 45,000.
| Amount | |
|---|---|
| Profit for the year | 56,000 |
| Add back depreciation (not a cash payment) | 14,000 |
| Less increase in inventory (56,000 - 38,000) | (18,000) |
| Less increase in trade receivables (72,000 - 38,000) | (34,000) |
| Add increase in trade payables (70,000 - 38,000) | 32,000 |
| Cash from trading | 50,000 |
| Less non-current assets bought | (26,000) |
| Less drawings | (45,000) |
| Fall in bank balance | (21,000) |
This table is an explanation tool, not a statement the specification asks you to prepare. The point is that profit of 56,000 was absorbed by growth in receivables and inventory, new equipment and drawings.
Common errors
- Writing the ratio with no formula or no unit, so a correct method earns less.
- Using revenue instead of credit sales for receivable days, or cost of sales for payable days when the question gives credit purchases.
- Dividing markup by revenue instead of cost of sales.
- Treating drawings or depreciation as if they change cash and profit in the same way.
- Saying a rising current ratio always means better liquidity.
- Describing the ratio without a reason or a judgement.
- Comparing two ratios from different years when the basis changed, such as average inventory in one year and closing inventory in the other.
Frequently asked questions
How is capital employed calculated in OxfordAQA International GCSE Accounting 9215? Capital employed is non-current assets plus current assets minus current liabilities.
What is the difference between cash and profit? Profit is revenue minus expenses for a period under the accruals approach, so a sale counts when it is made. Cash is money actually received and paid, so a profitable business can still run short of cash when profit is tied up in receivables and inventory.
How do you write an appraisal of business performance? State each result with its direction, compare it with the other year, give a likely reason, and reach a judgement. A list of ratios on its own earns little.
Can the current ratio rise while cash falls? Yes. Paying a liability from the bank reduces current assets and current liabilities by the same amount, so a current ratio above 1 : 1 rises even though cash has fallen.
Why should inventory figures be on the same basis when comparing years? Comparing ratios worked on average inventory in one year and closing inventory in another gives a misleading comparison. Use the same basis for both years, or say when it has changed.
Official syllabus
Source: OxfordAQA International GCSE Accounting (9215) specification, version 1.2, for exams from May/June 2026 onwards, published by OxfordAQA, section 3.5.
Get free revision emails (optional)
Occasional emails with practice questions, worked explanations and links to free resources for the qualification and subjects you choose. No spam, and you can unsubscribe from any email. The free tools on this site never need an email.
Related resources
-
Practice questions
OxfordAQA IGCSE Accounting: Appraising business performance, cash and profit (9215) – Practice Questions
Eleven original questions with worked answers on profitability and liquidity ratios, appraisal, and cash versus profit for OxfordAQA IGCSE Accounting 9215.
Accounting · OxfordAQA · IGCSE
Try questions -
Revision notes
OxfordAQA IGCSE Accounting: Appraising business performance, cash and profit (9215) – Revision Notes
Condensed formulas, interpretation phrases, cash versus profit grids and a self-test on ratios and appraisal for OxfordAQA IGCSE Accounting 9215.
Accounting · OxfordAQA · IGCSE
Revise topic -
Study guides
OxfordAQA IGCSE Accounting: Internal and external stakeholders (9215)
Study guide to internal and external stakeholders in OxfordAQA International GCSE Accounting 9215, with each group's interests and a worked example.
Accounting · OxfordAQA · IGCSE
Read guide
Related articles
-
teaching
A Level tuition in Dubai: Cambridge or Pearson Edexcel International A Level?
Schools in Dubai and Abu Dhabi teach either Cambridge International AS & A Level or Pearson Edexcel International A Level. How the two are structured, why it matters for tuition, and how online classes from Lahore work.
9 October 2026
-
curriculum guides
Choosing subjects at IGCSE and A Level
How subject choices at 14 and 16 affect university options later, and how to keep pathways open without overloading a timetable.
28 July 2026
Studying this with a teacher
Working through Accounting IGCSE?
This page is free and stays free. If you would rather be taught it, Marlbridge runs Accounting classes one-to-one and in small groups of up to 15, online in your own time zone. The first trial class is free. WhatsApp replies within an hour (8am–11pm Pakistan time, every day); email the same day.
OxfordAQA Accounting teachers at Marlbridge