
Revision Notes
A Level Business: Quality management and Operations strategy (Cambridge 9609) – Revision Notes
Condensed revision notes for 9.2 Quality management and 9.3 Operations strategy in Cambridge A Level Business 9609, with a self-test and lost marks.
- Subject
- Business
- Level
- A LEVEL
- Topic
- Operations management
- Author
- Marlbridge Academic Team
- Updated
- Reviewed by
- Salman Ahmad (what this means)
Aligned to Cambridge A Level Business (9609), For examination in 2026, 2027 and 2028. Official specification .
Syllabus page (what it covers and how it is assessed): Cambridge A Level Business.
Syllabus points this page covers
9609 (A Level)
- 9.2 Quality management
- 9.3 Operations strategy
Found an error? Report a correction.
Need help with this topic? Request a free trial class for A Level Business (9609).
These are condensed notes for sections 9.2 Quality management and 9.3 Operations strategy of the Cambridge International AS & A Level Business 9609 syllabus for examination in 2026, 2027 and 2028. Both are A Level topics. For explanations and worked examples use the study guide, then test yourself with the practice questions. See also the Topic 9 practice set and inventory management notes. Course links: the Cambridge A Level Business hub, the checklist and the free diagnostics.
9.2.1 Quality control, quality assurance and TQM
Key definitions
| Term | Meaning |
|---|---|
| Quality (operations view) | Fit for purpose; meets the specification and customer expectations |
| Customer perception of quality | What the customer thinks, shaped by price, brand and experience |
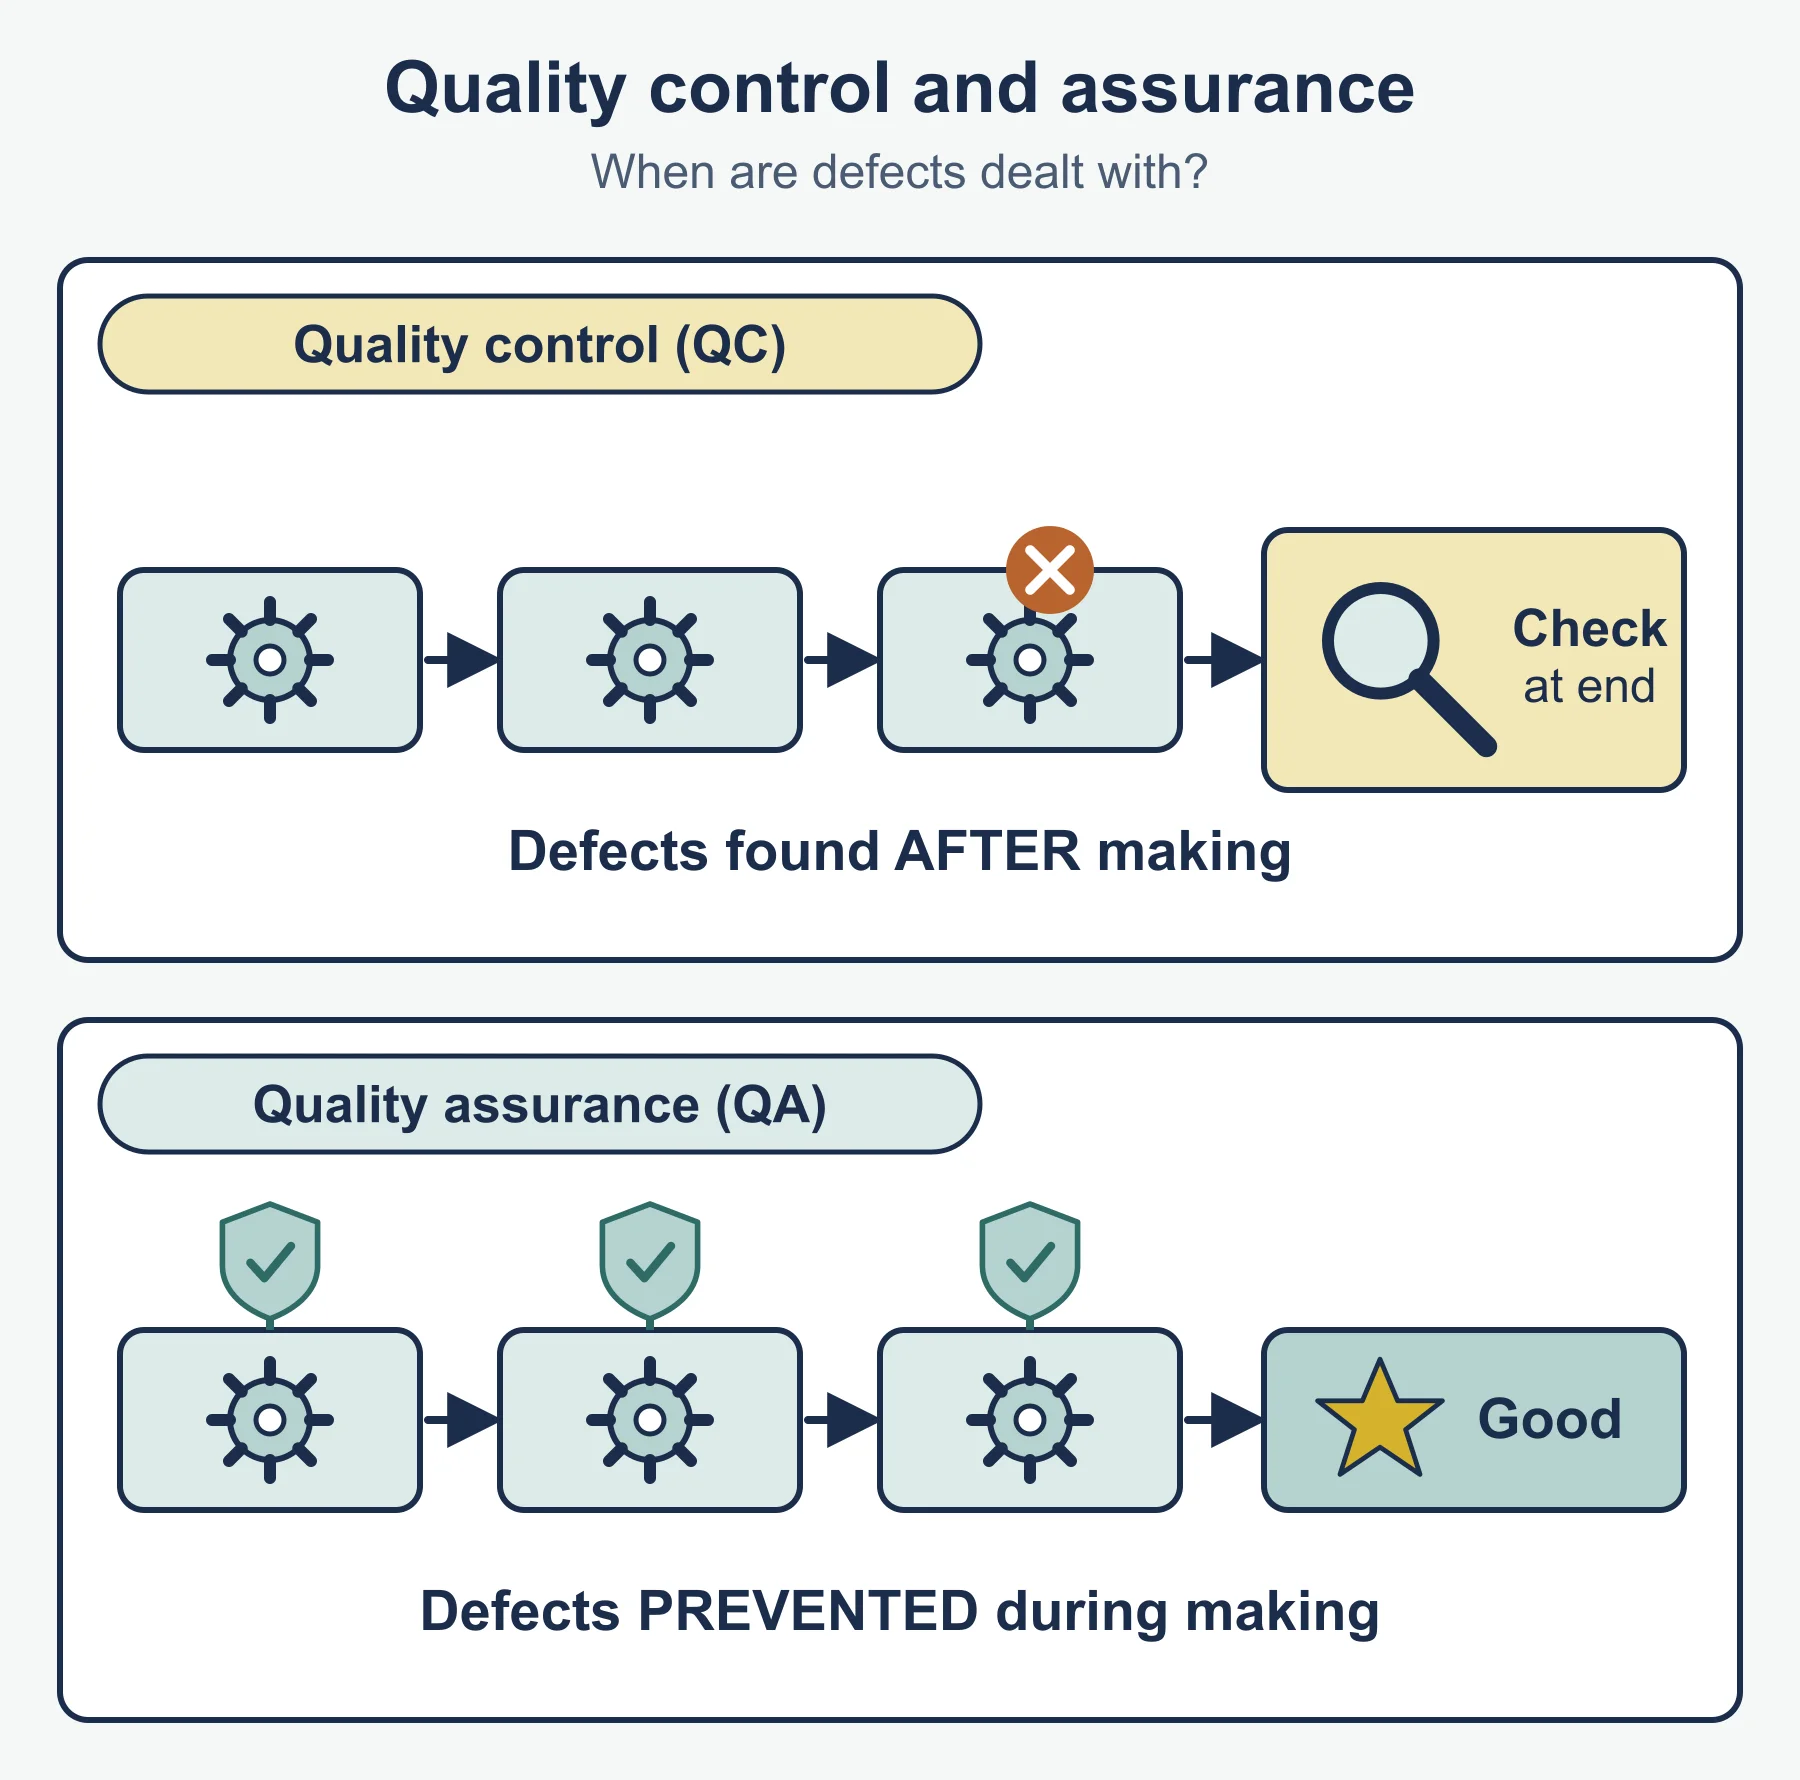
| Quality control (QC) | Inspecting or testing output, or samples, to find faulty items |
| Quality assurance (QA) | Setting standards and checking the process throughout, so faults are prevented |
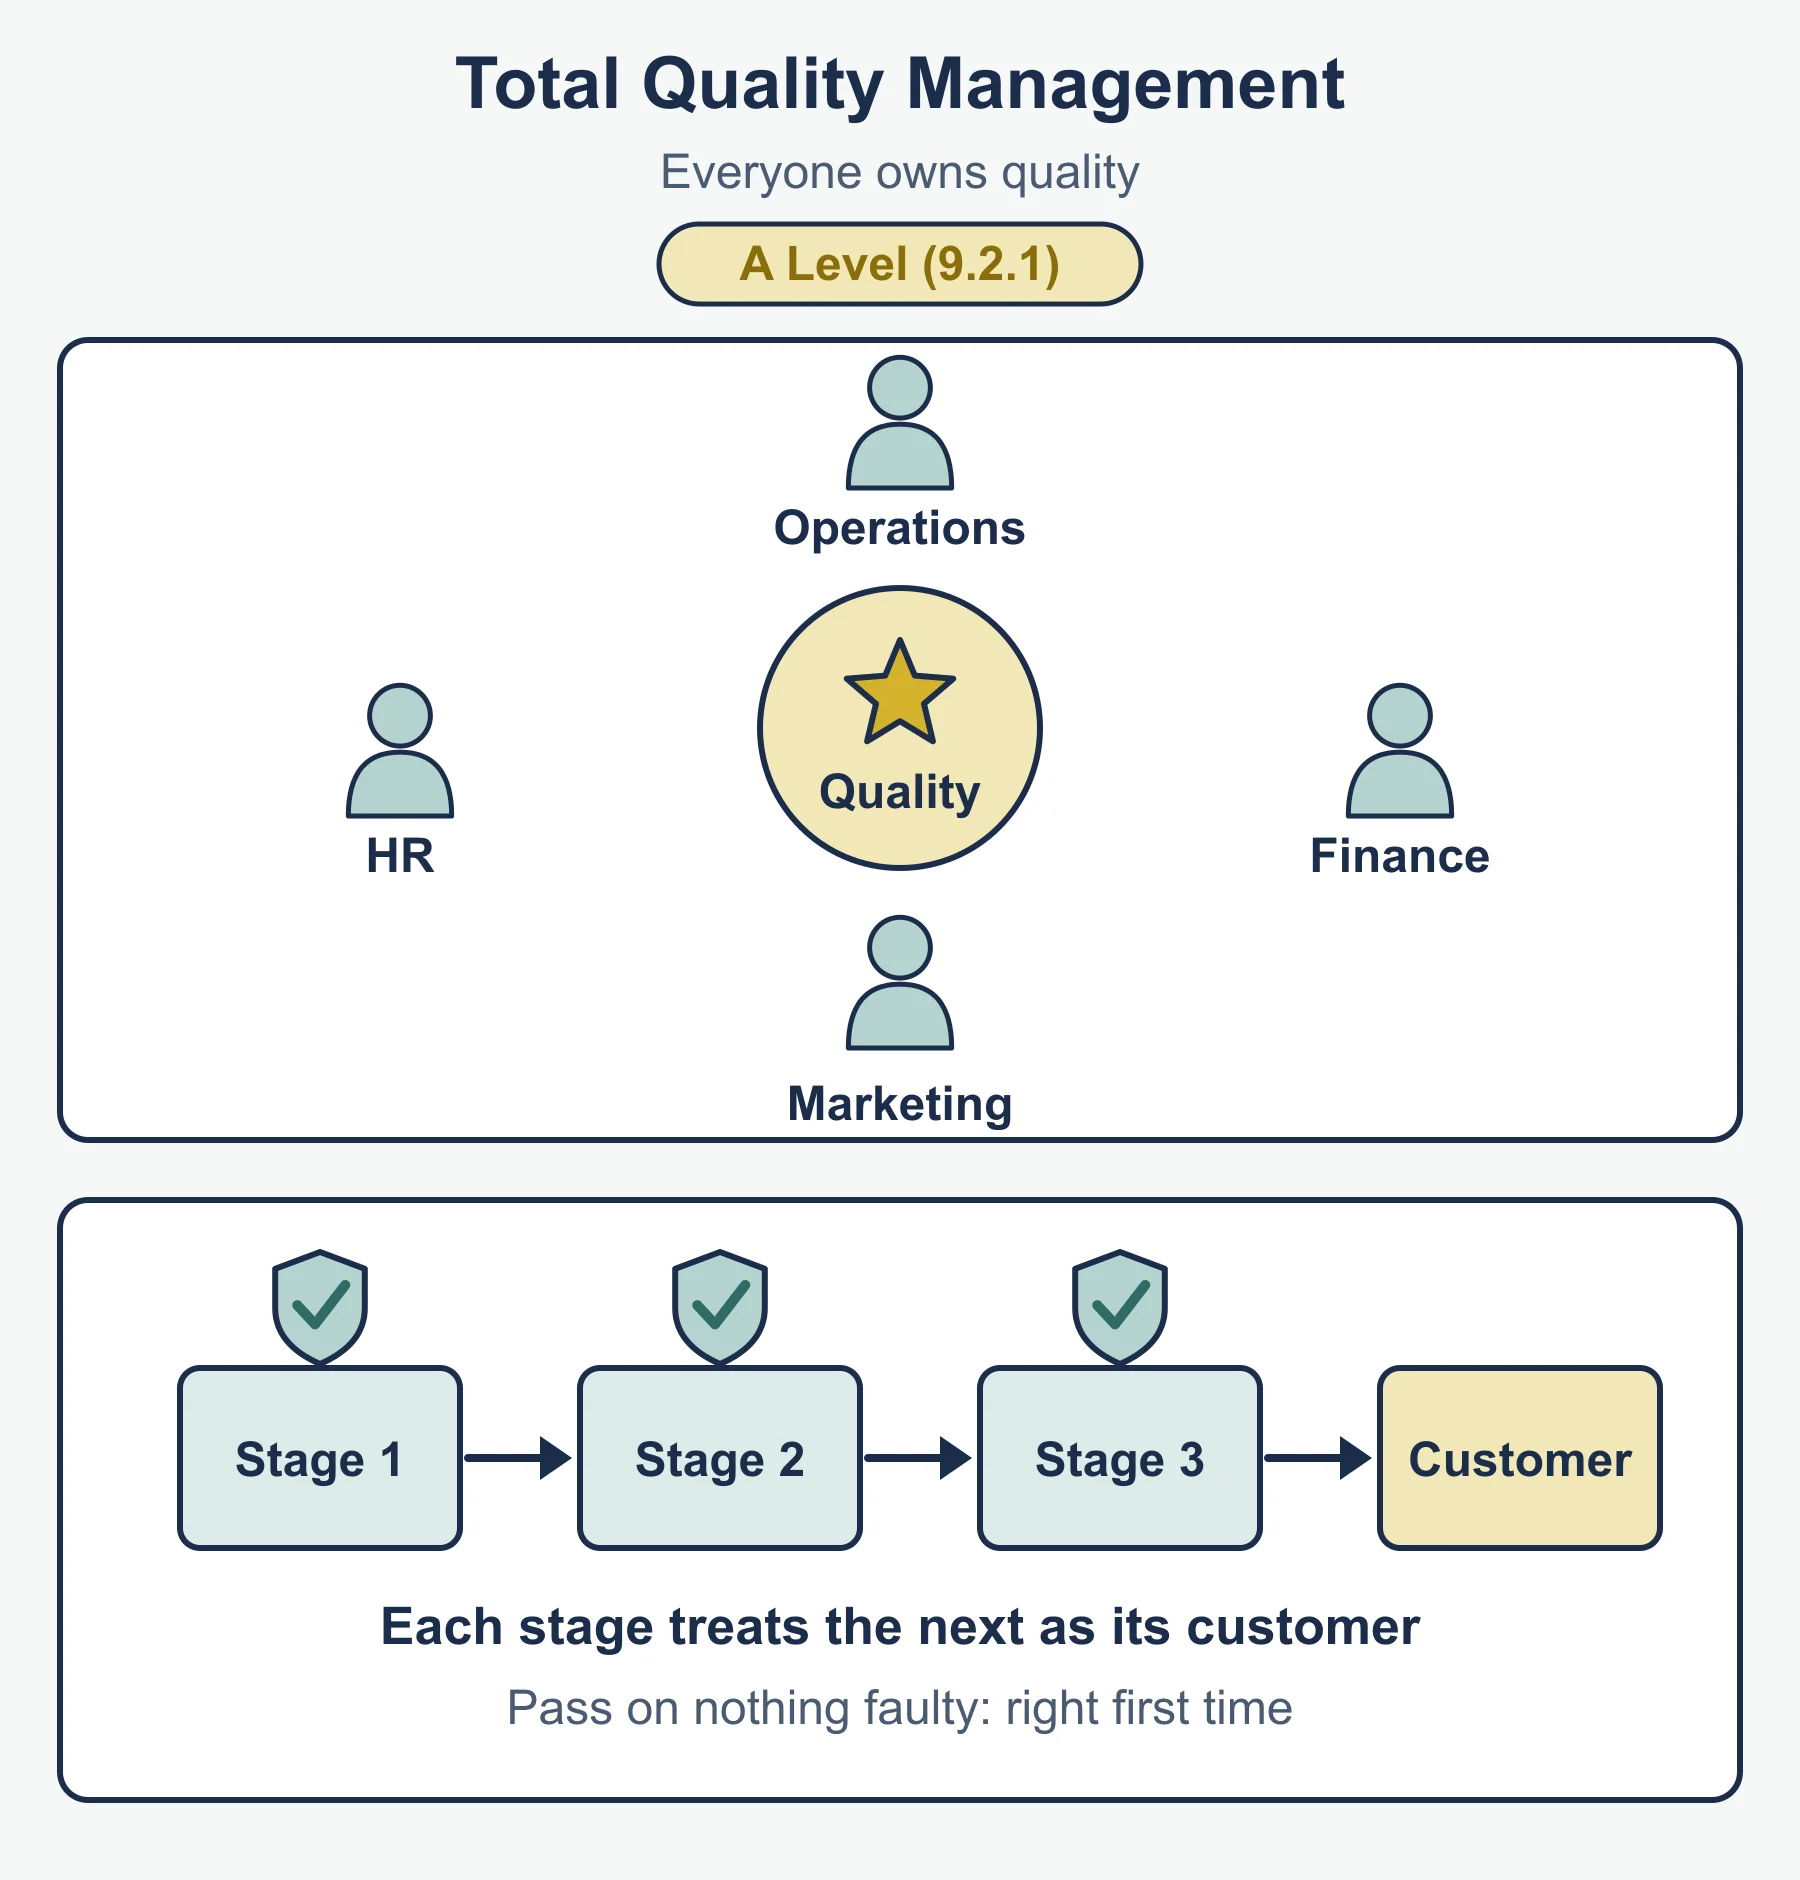
| Total Quality Management (TQM) | Every employee responsible for quality; right first time, zero defects |
Why quality matters
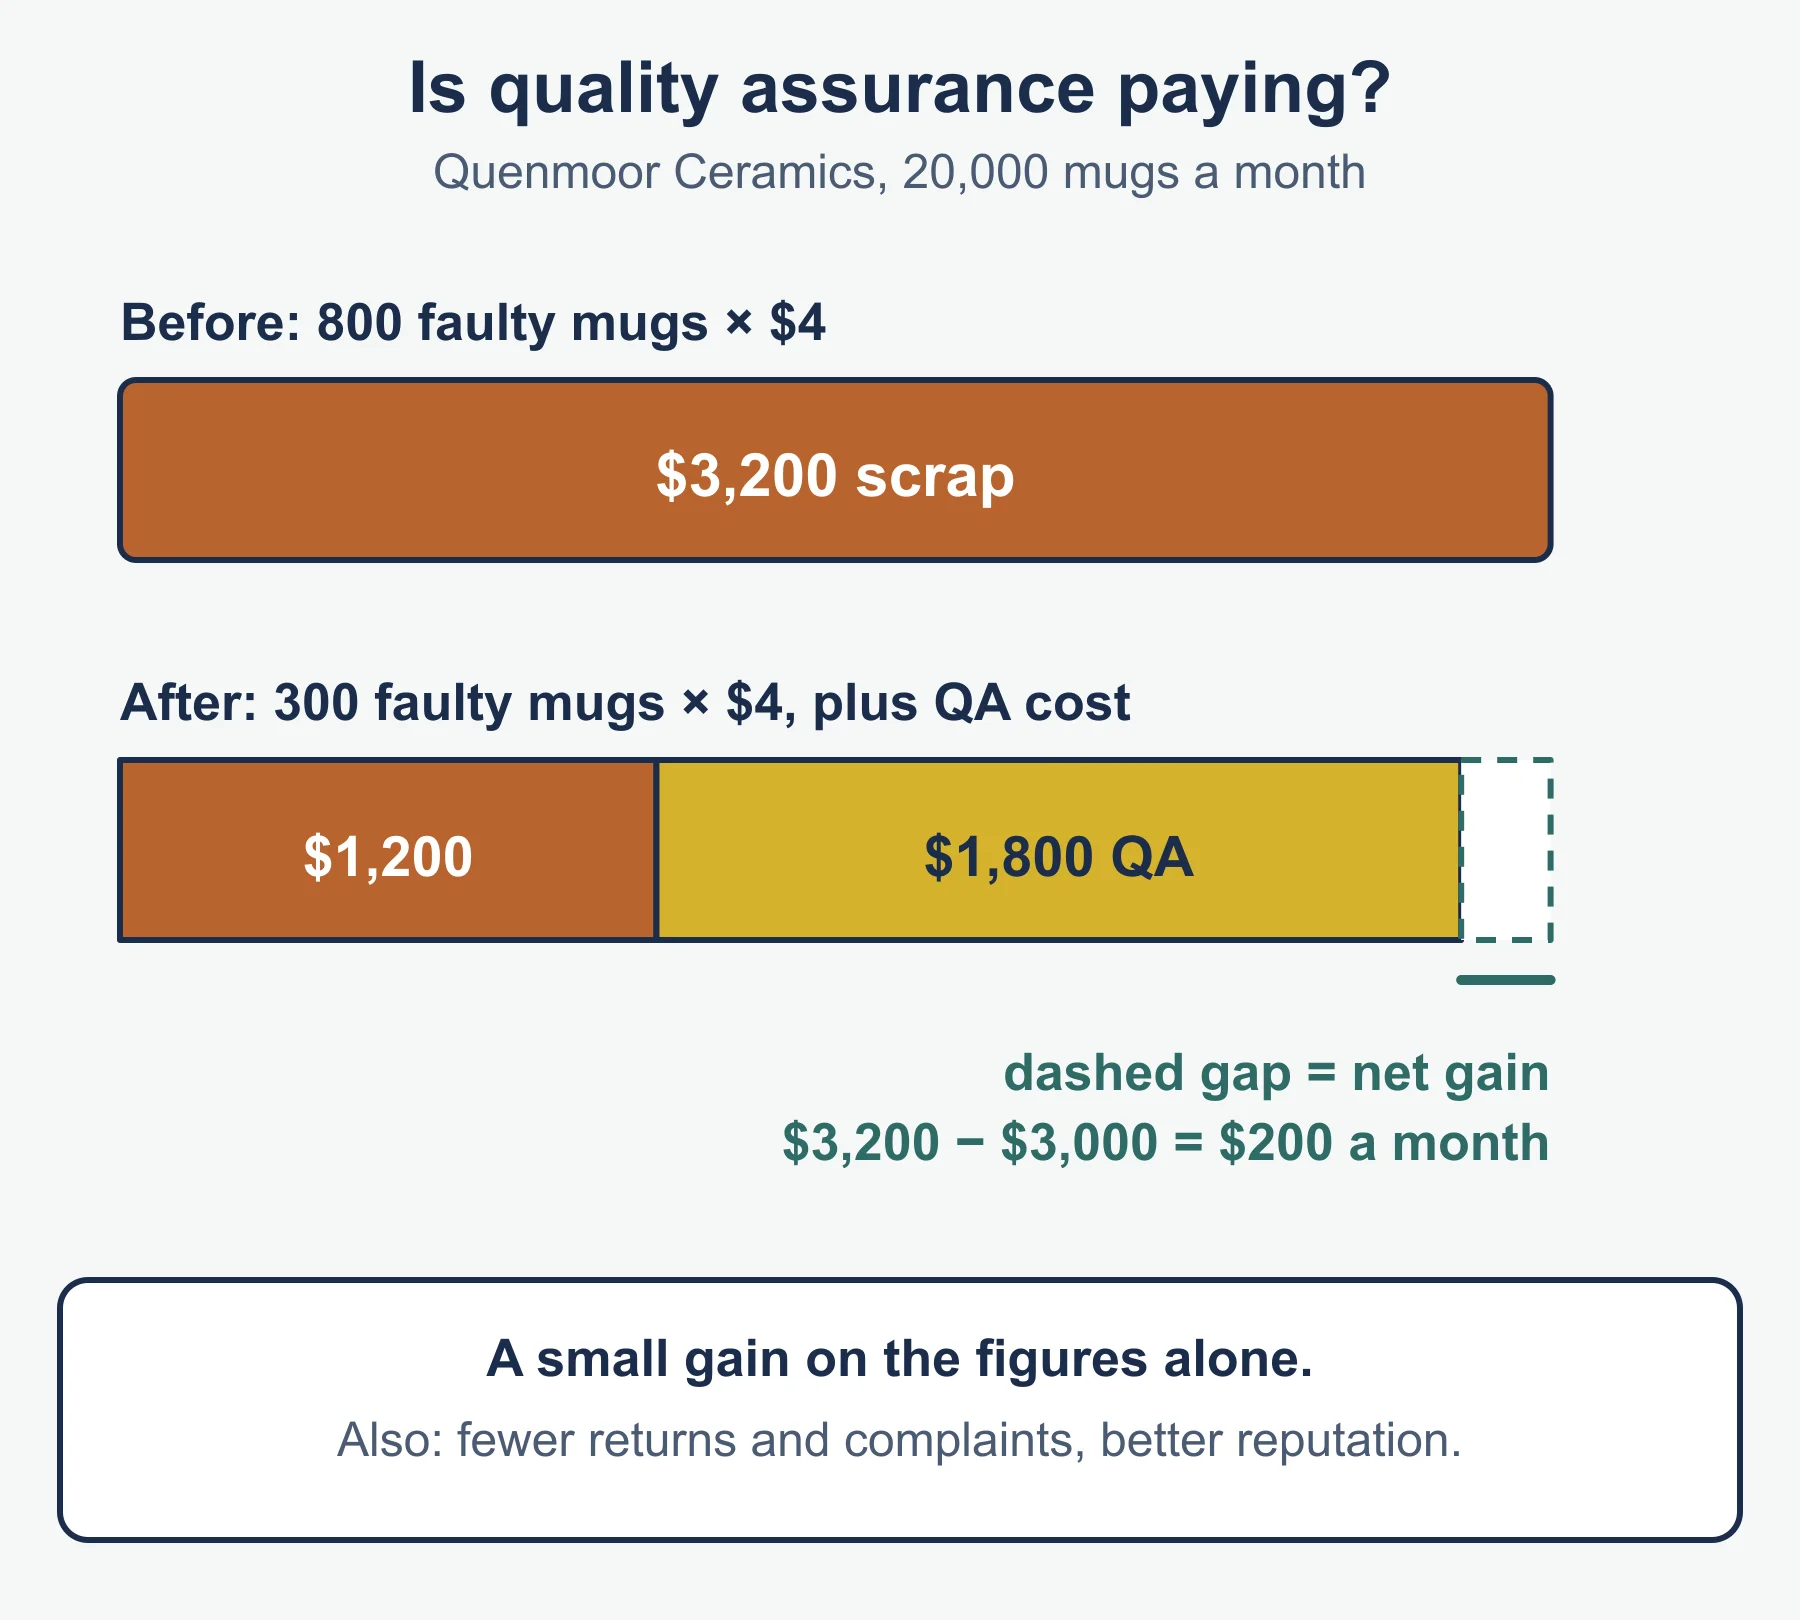
- Finance: less waste, rework and returns.
- Marketing: reputation, repeat purchase, ability to support a price.
- Human resources: pride in work, less time spent fixing mistakes.
- Operations: fewer stoppages and a steadier flow of output.
Impact of each method
| Method | Positive impact | Negative impact |
|---|---|---|
| QC | Stops faulty items reaching customers | Inspectors cost money; faults found after waste has occurred; sampling can miss faults |
| QA | Prevents faults; fewer defects and rework | Set-up and training cost; documentation |
| TQM | Fewer defects, less inspection, responsible staff | Training cost; culture change takes time; staff may resist |
Must-know distinction: QC detects after the event; QA prevents by controlling the process; TQM makes everyone responsible, so it reduces the need for inspectors.
9.2.2 Benchmarking
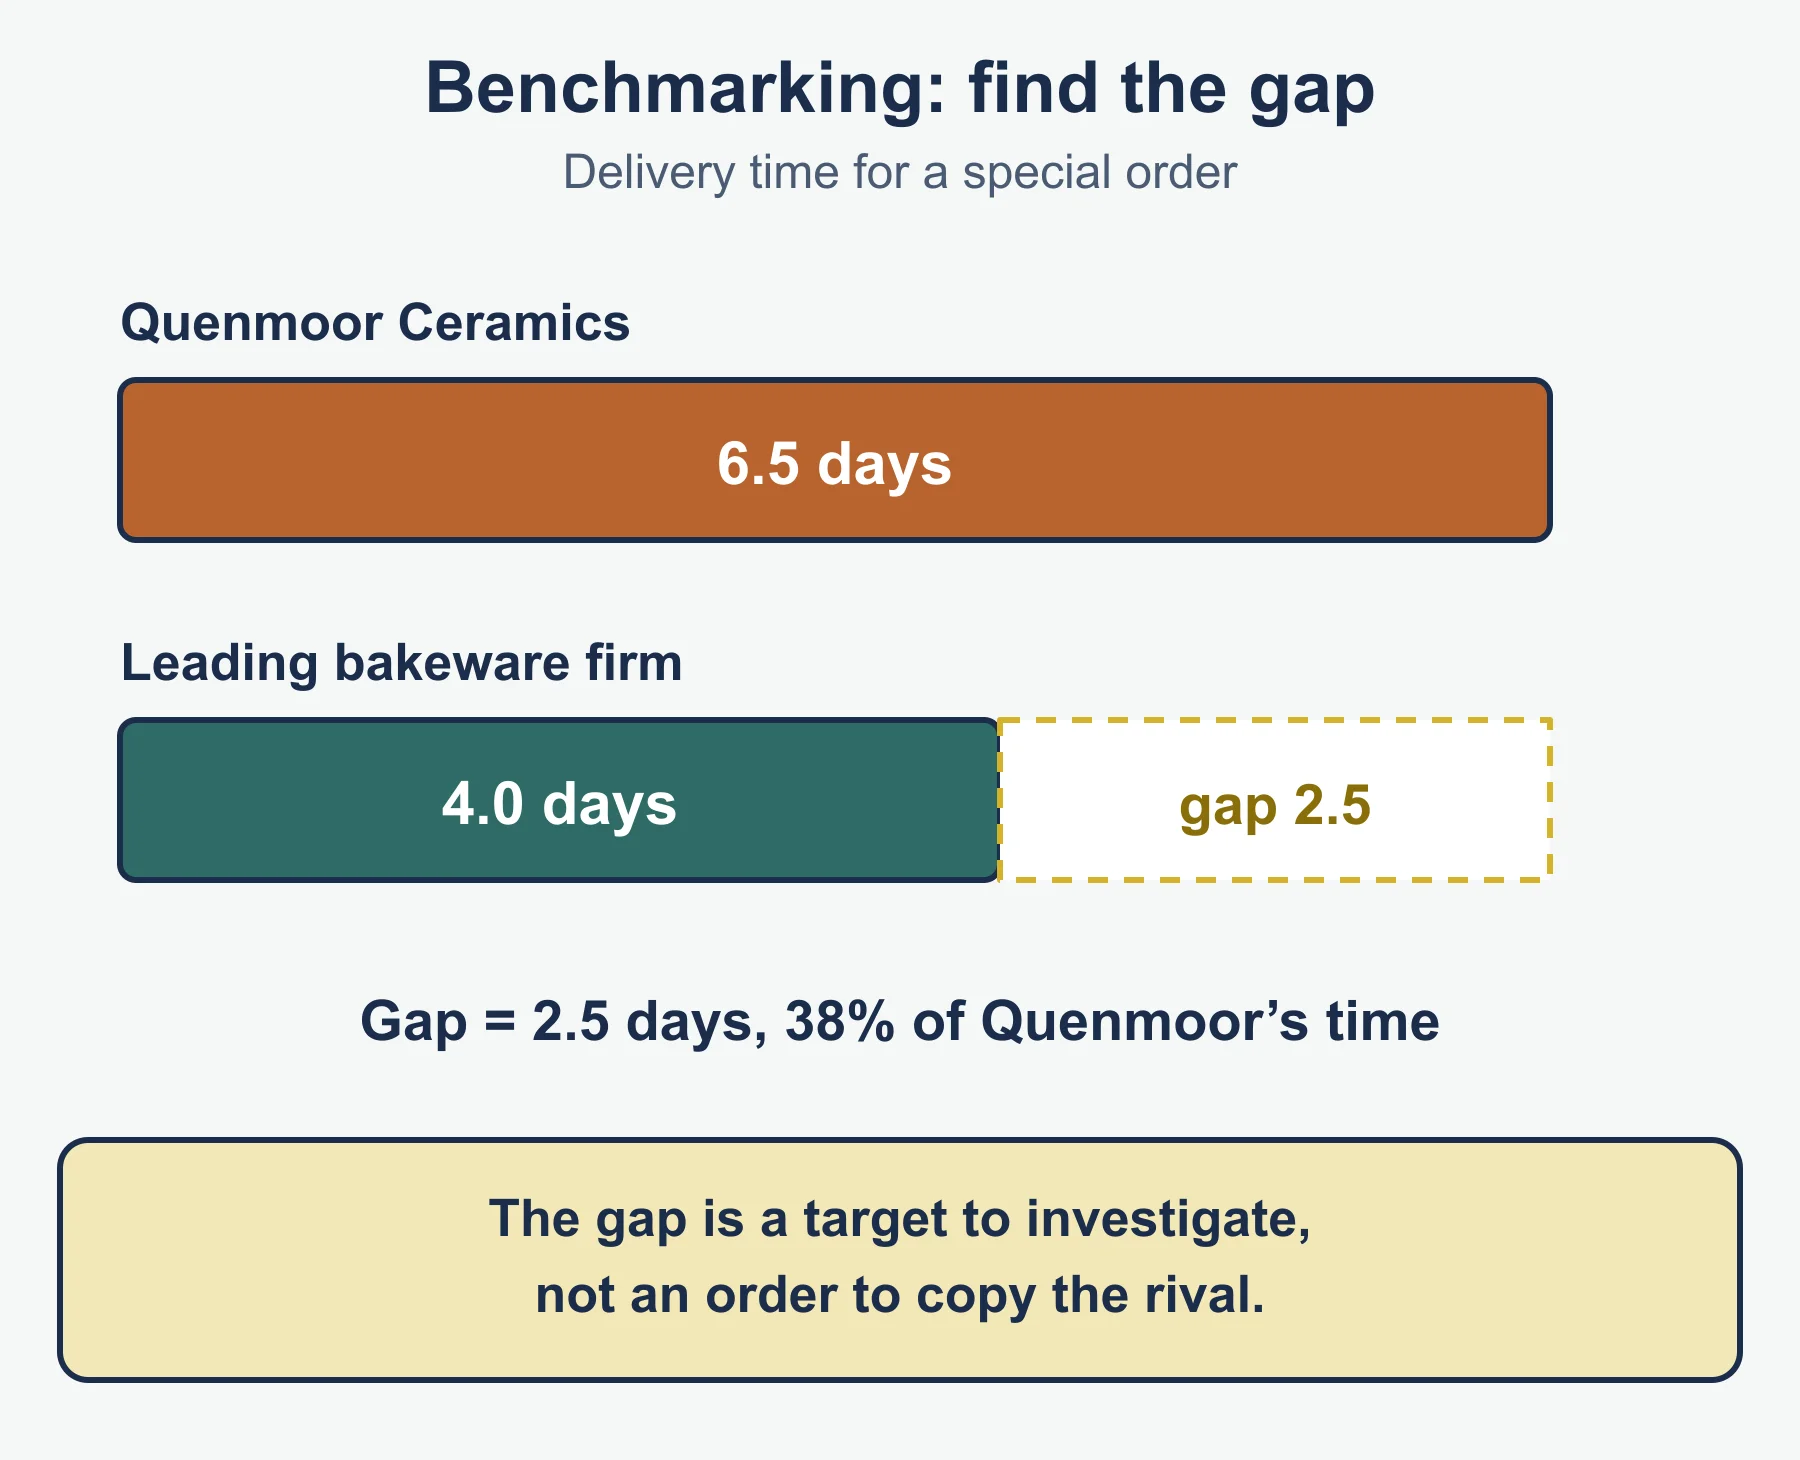
Comparing performance, processes or products with the best (a rival, a leader in another industry with a similar process, or the best unit inside the business) and using the gap to set targets and make changes. These groupings are the standard description; the syllabus asks for its importance in quality management.
- Importance: shows where the business falls short; sets realistic targets; supports continuous improvement.
- Limits: rival data is hard to obtain; one business’s method may not suit another; targets only match the best.
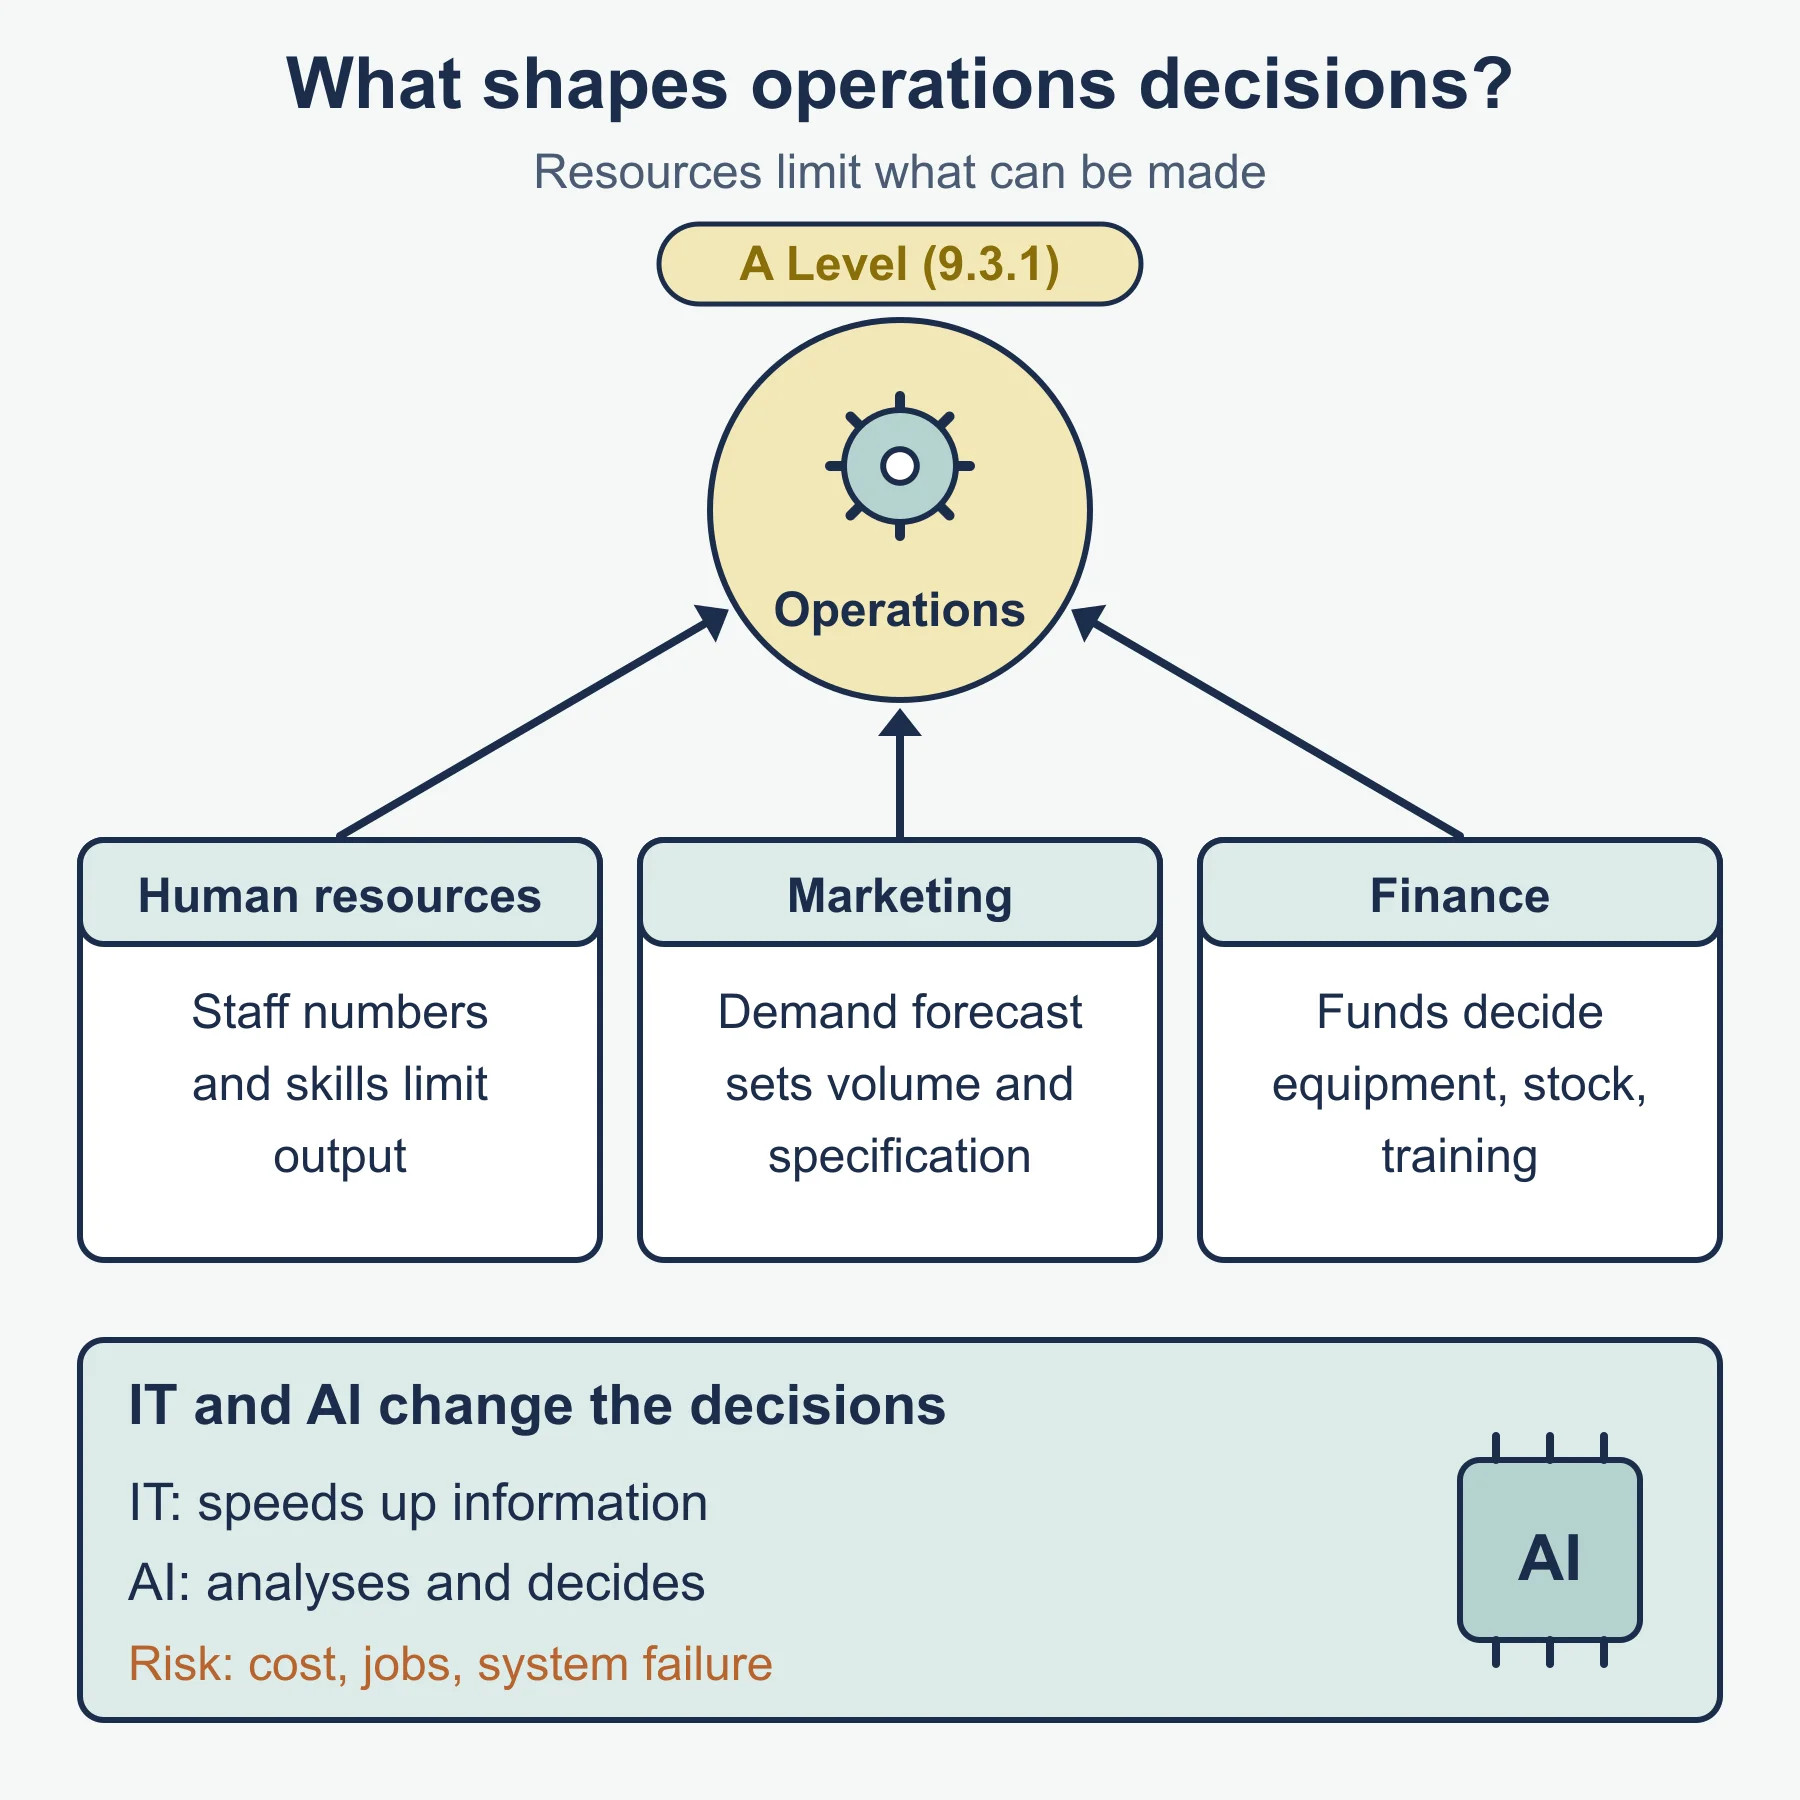
9.3.1 Operational decisions
| Resource | How it influences operations decisions |
|---|---|
| Human | Number, skills and flexibility of staff limit volume, process and quality |
| Marketing | Demand forecasts and brand promise set volume, specification and quality level |
| Finance | Funds decide equipment, inventory, training and the process chosen |
IT and AI: automation, computer-aided design, stock tracking, demand forecasting, fault detection by camera, predictive servicing, customer chatbots. Benefits: speed, consistency, data. Risks: cost, job change, system failure, poor data, cyber-risk.
9.3.2 Flexibility and innovation
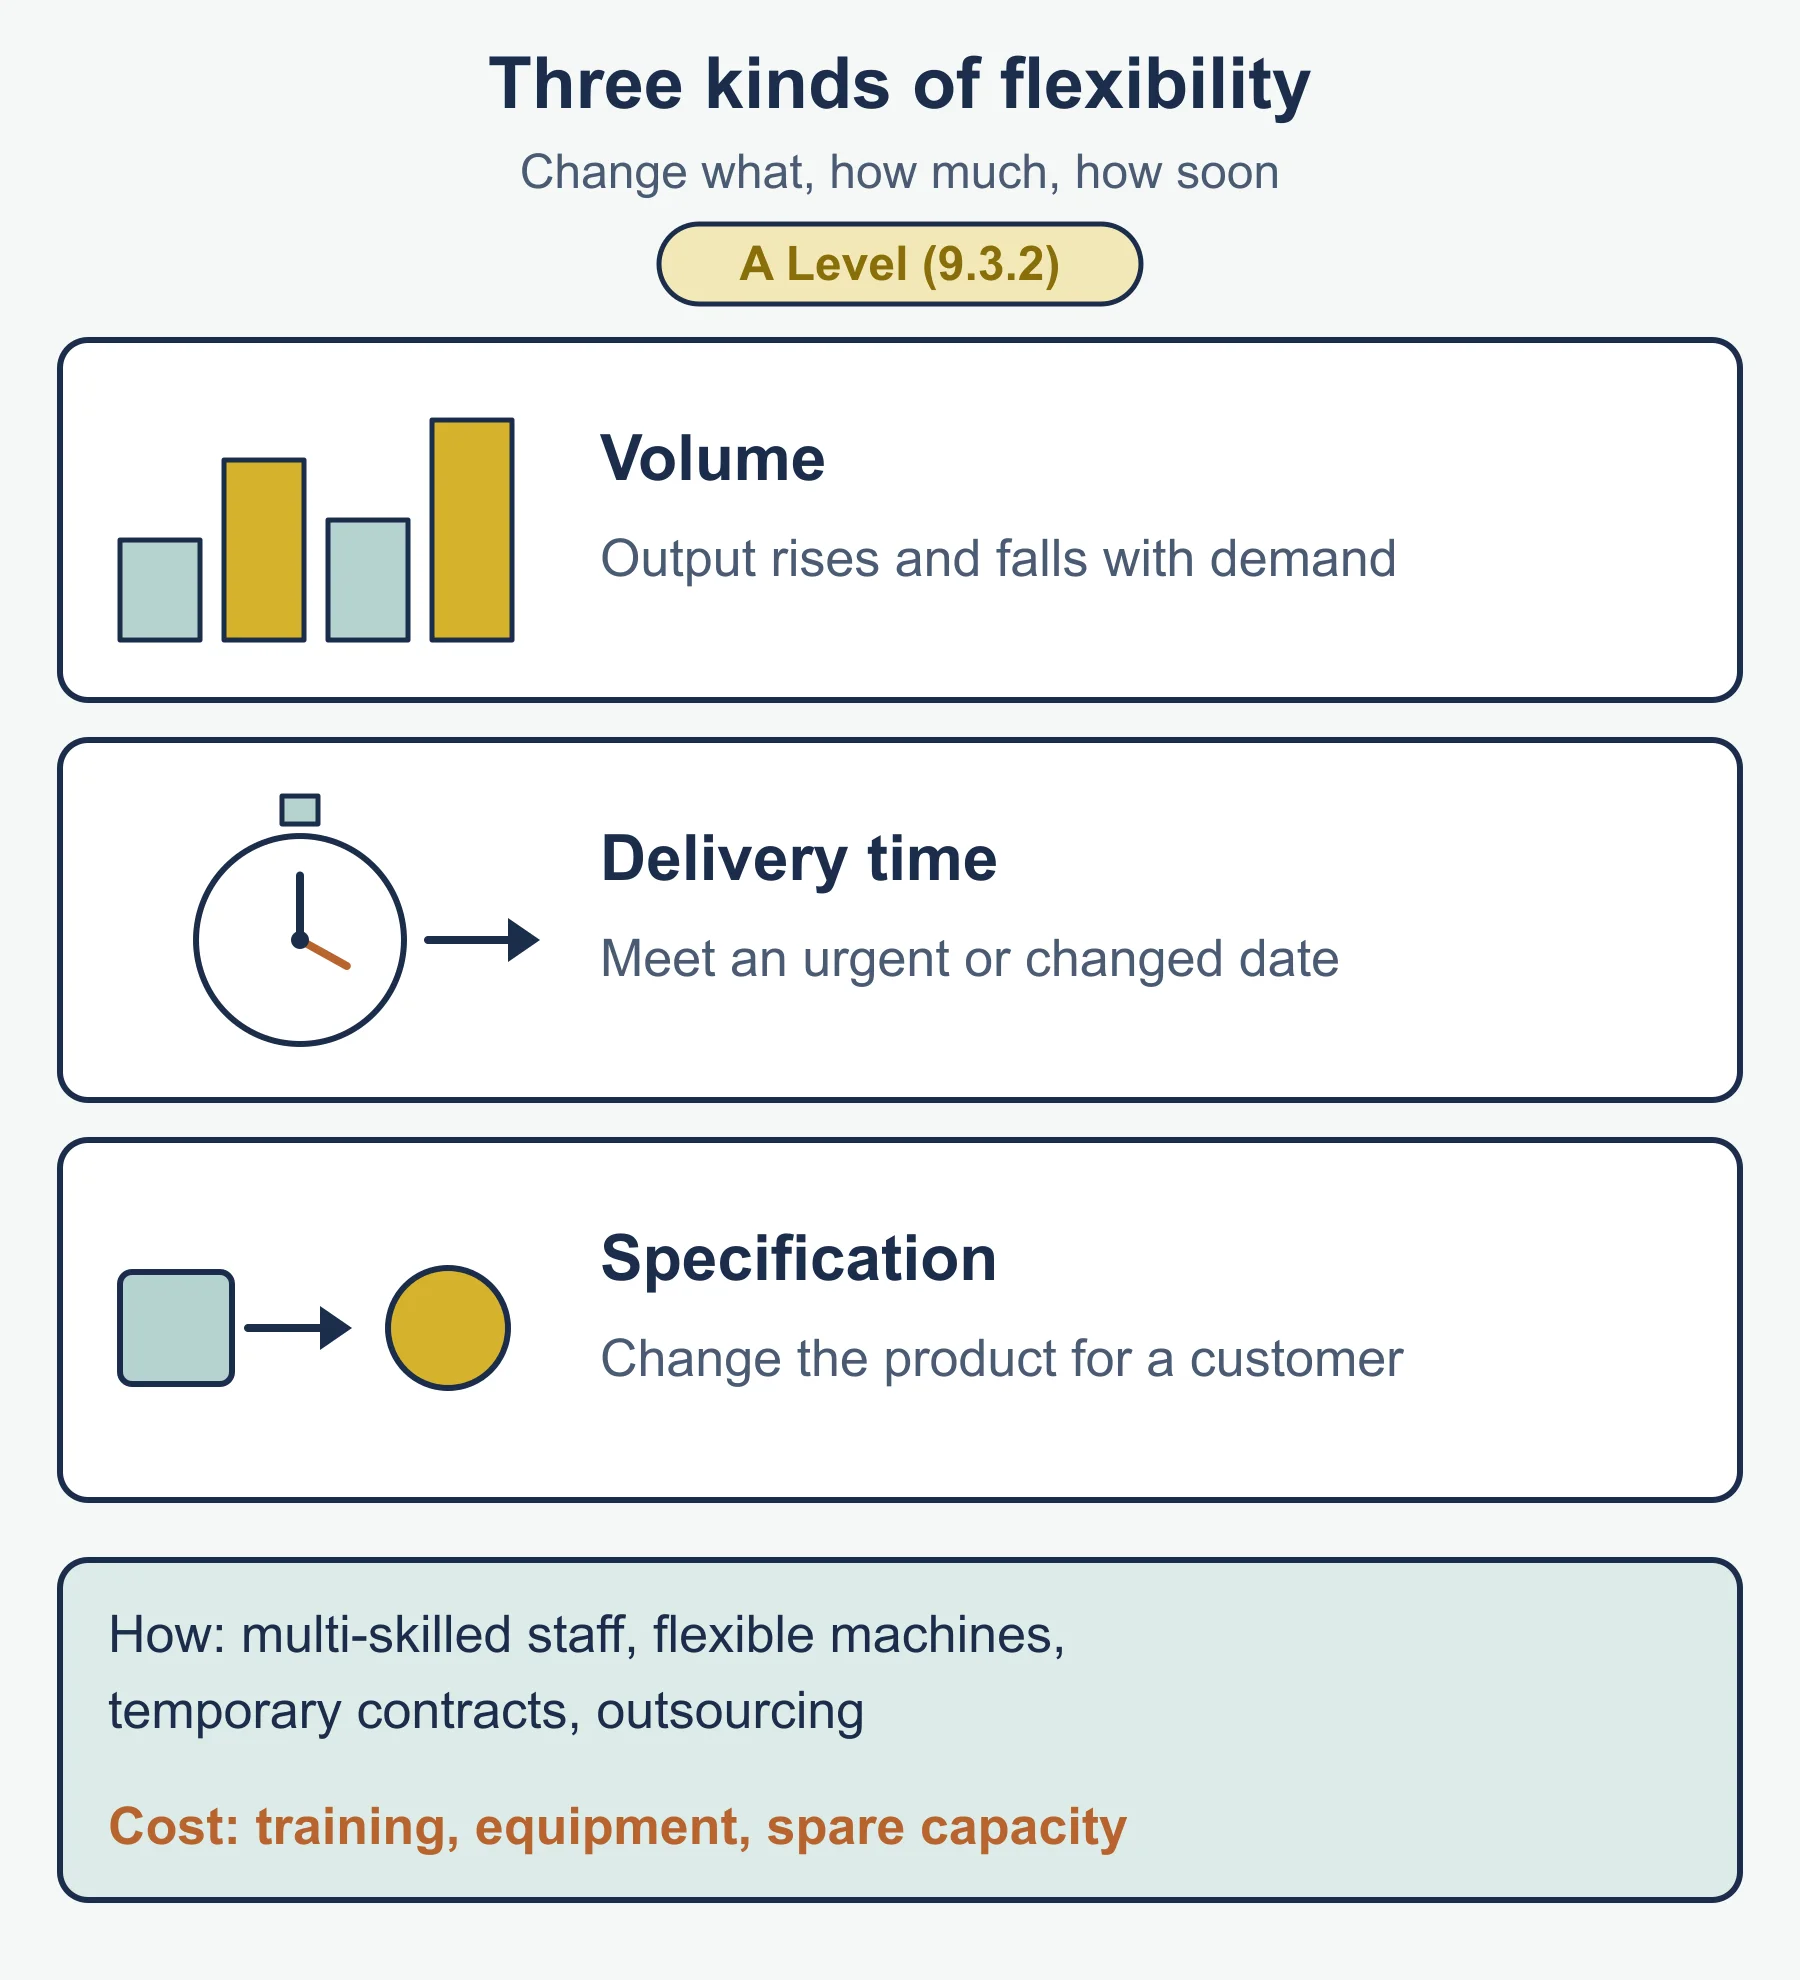
- Three kinds of flexibility: volume, delivery time, specification.
- Ways: multi-skilled staff, flexible machines, temporary contracts, outsourcing, spare capacity.
- Cost: training, equipment, unused capacity.
- Process innovation: changing current processes, or adopting new ways of producing products or delivering services.
- Benefits: lower cost, higher quality, faster delivery. Risks: cost, disruption, may not work.
9.3.3 Enterprise resource planning (ERP)
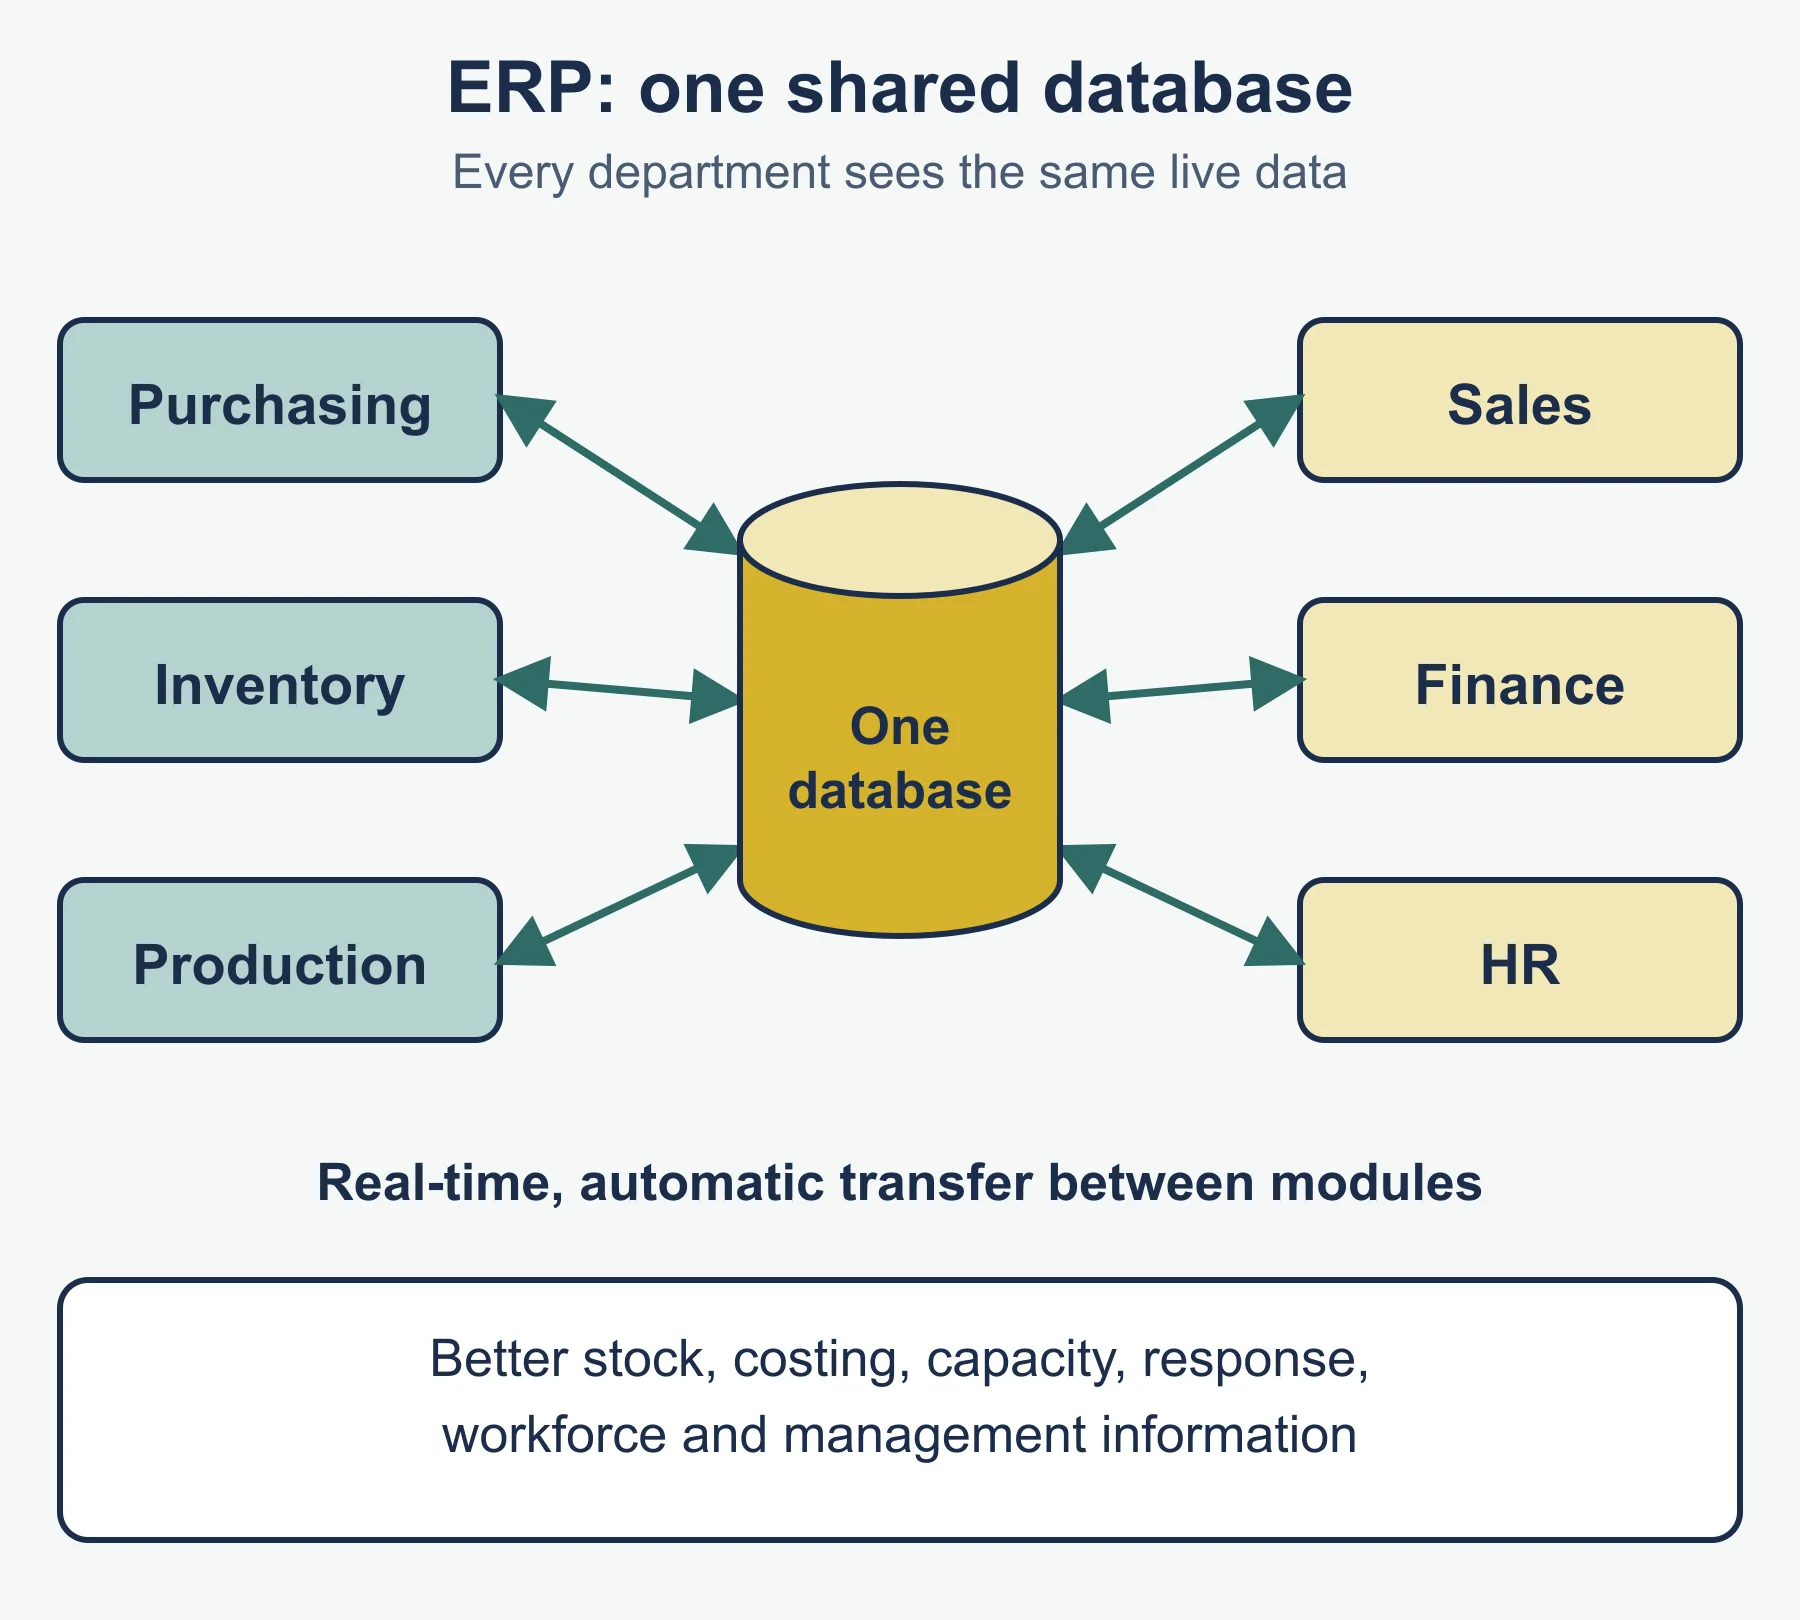
Main features: integrated software, one shared database, linked modules (such as purchasing, inventory, production, sales, finance, HR), real-time information, automated data transfer, reports.
| Area | How ERP helps |
|---|---|
| Inventory control | Live records; automatic re-ordering |
| Costing and pricing | Accurate current costs |
| Capacity utilisation | Orders and capacity shown together |
| Responses to change | Changes reach every department at once |
| Workforce flexibility | Skills and availability data |
| Management information | Reports from a single source |
Limits: cost, disruption, training, resistance to change, reliance on accurate data.
9.3.4 Lean production
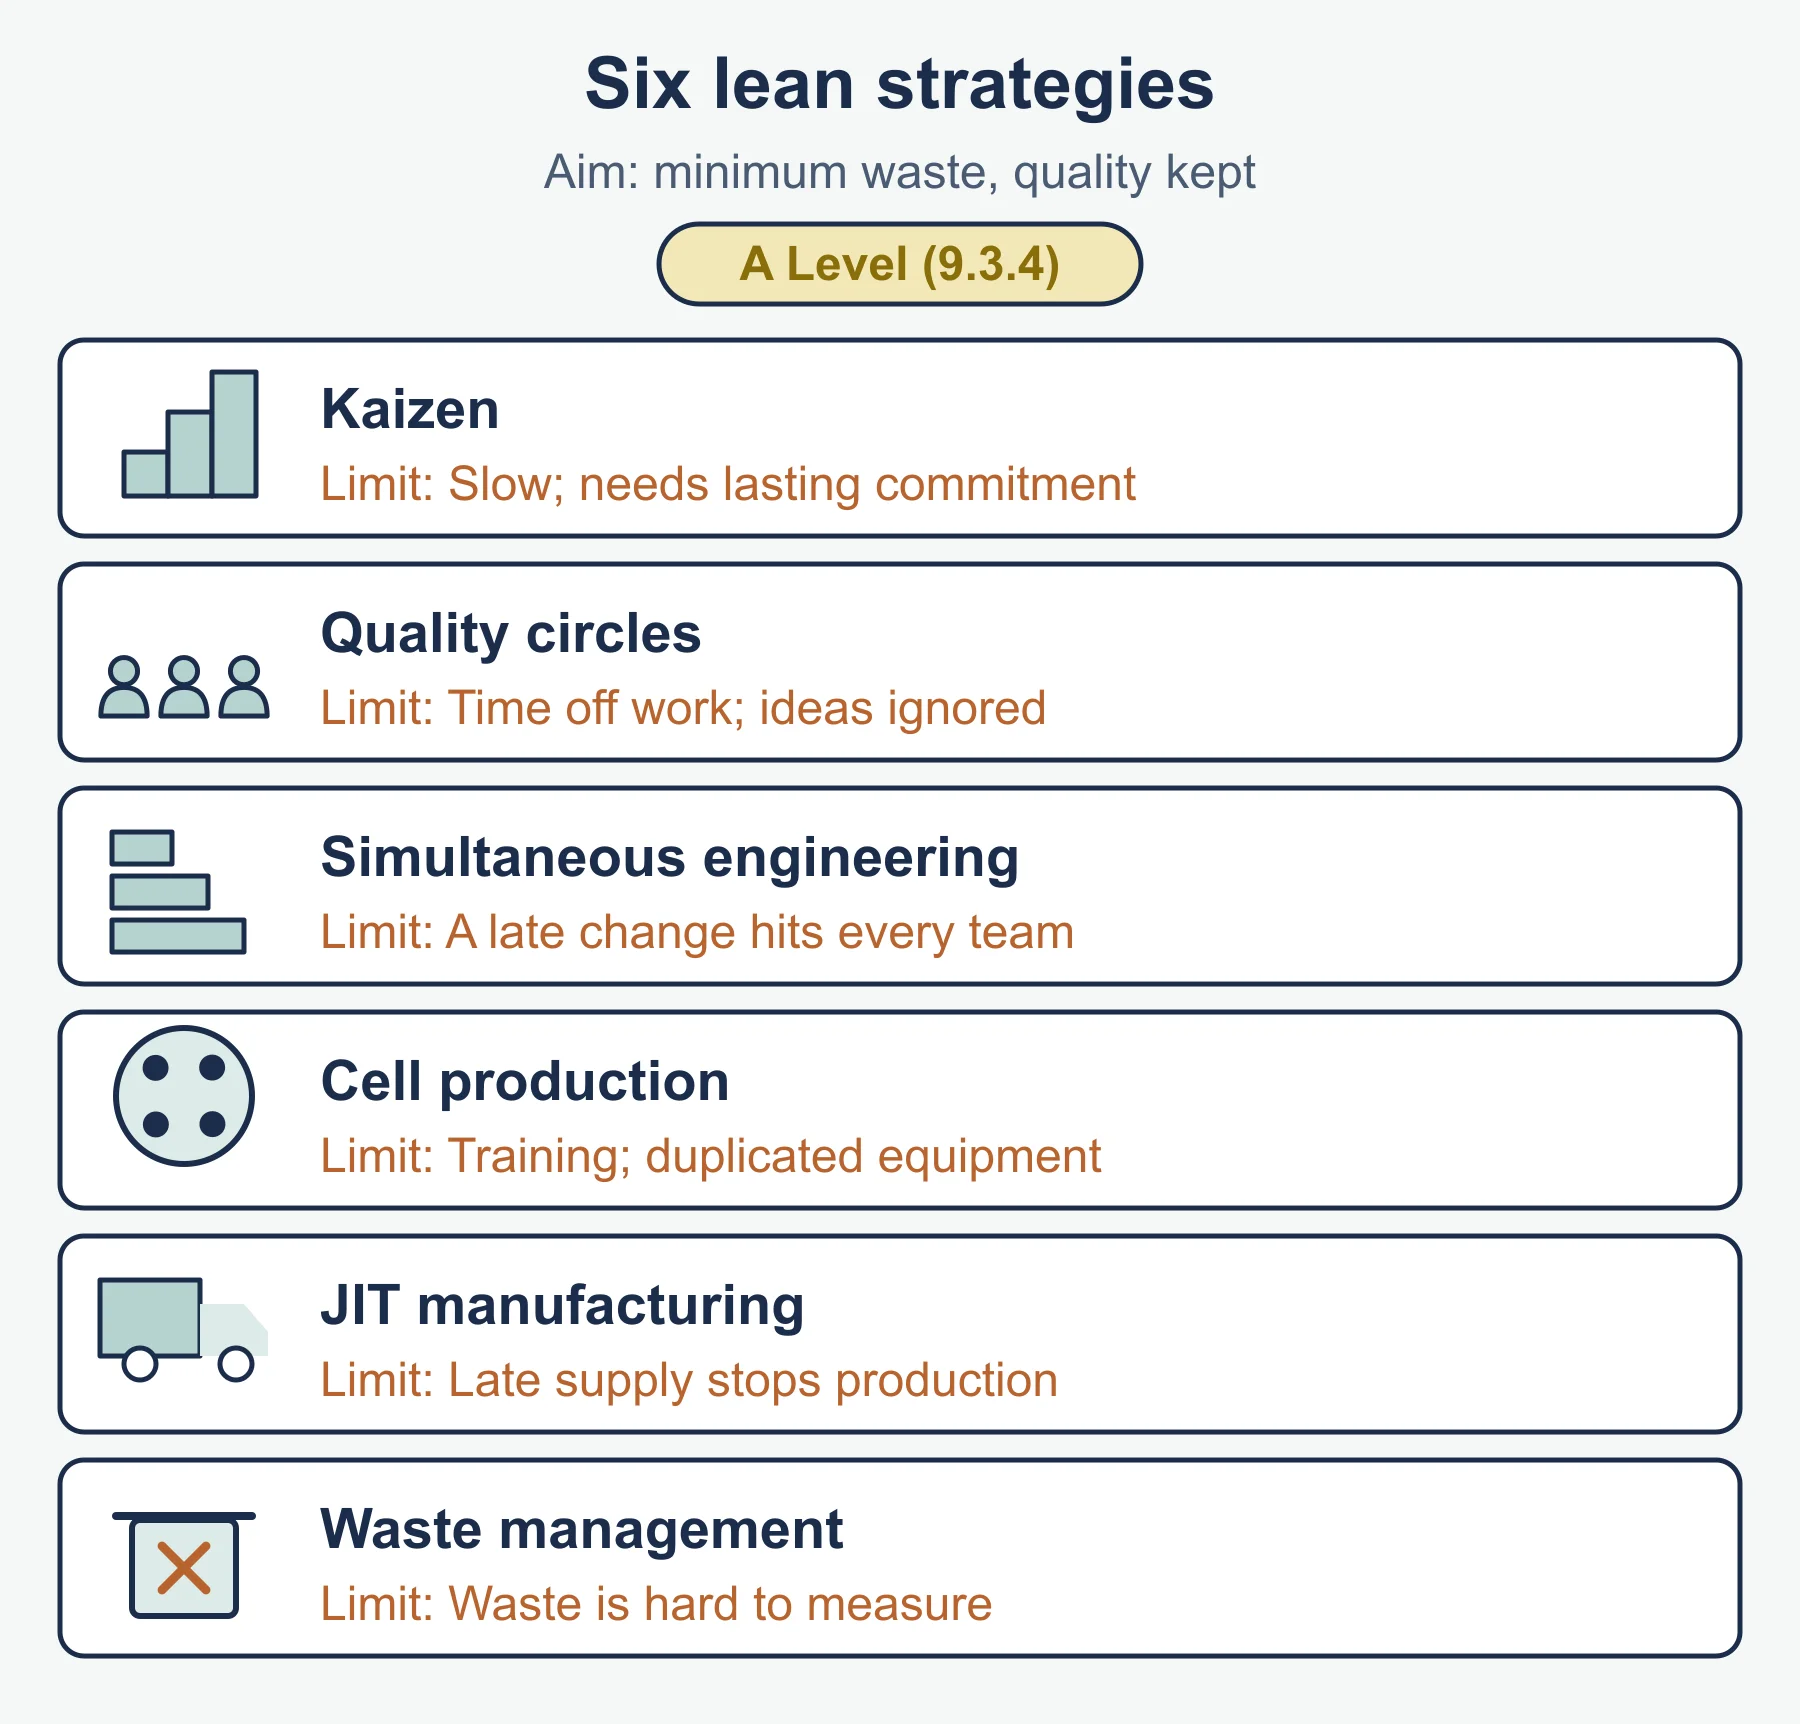
Aim: minimum waste (materials, time, space, effort, inventory) while meeting customer needs and quality standards. Purpose: lower costs, higher quality, speed, efficiency.
| Strategy | Key idea | Limitation |
|---|---|---|
| Kaizen | Continuous small improvements | Slow; needs commitment |
| Quality circles | Groups solving quality problems | Time; ideas may be ignored |
| Simultaneous engineering | Design, testing and planning in parallel | Coordination; late changes |
| Cell production | Team makes a whole product or part | Training; duplicated equipment |
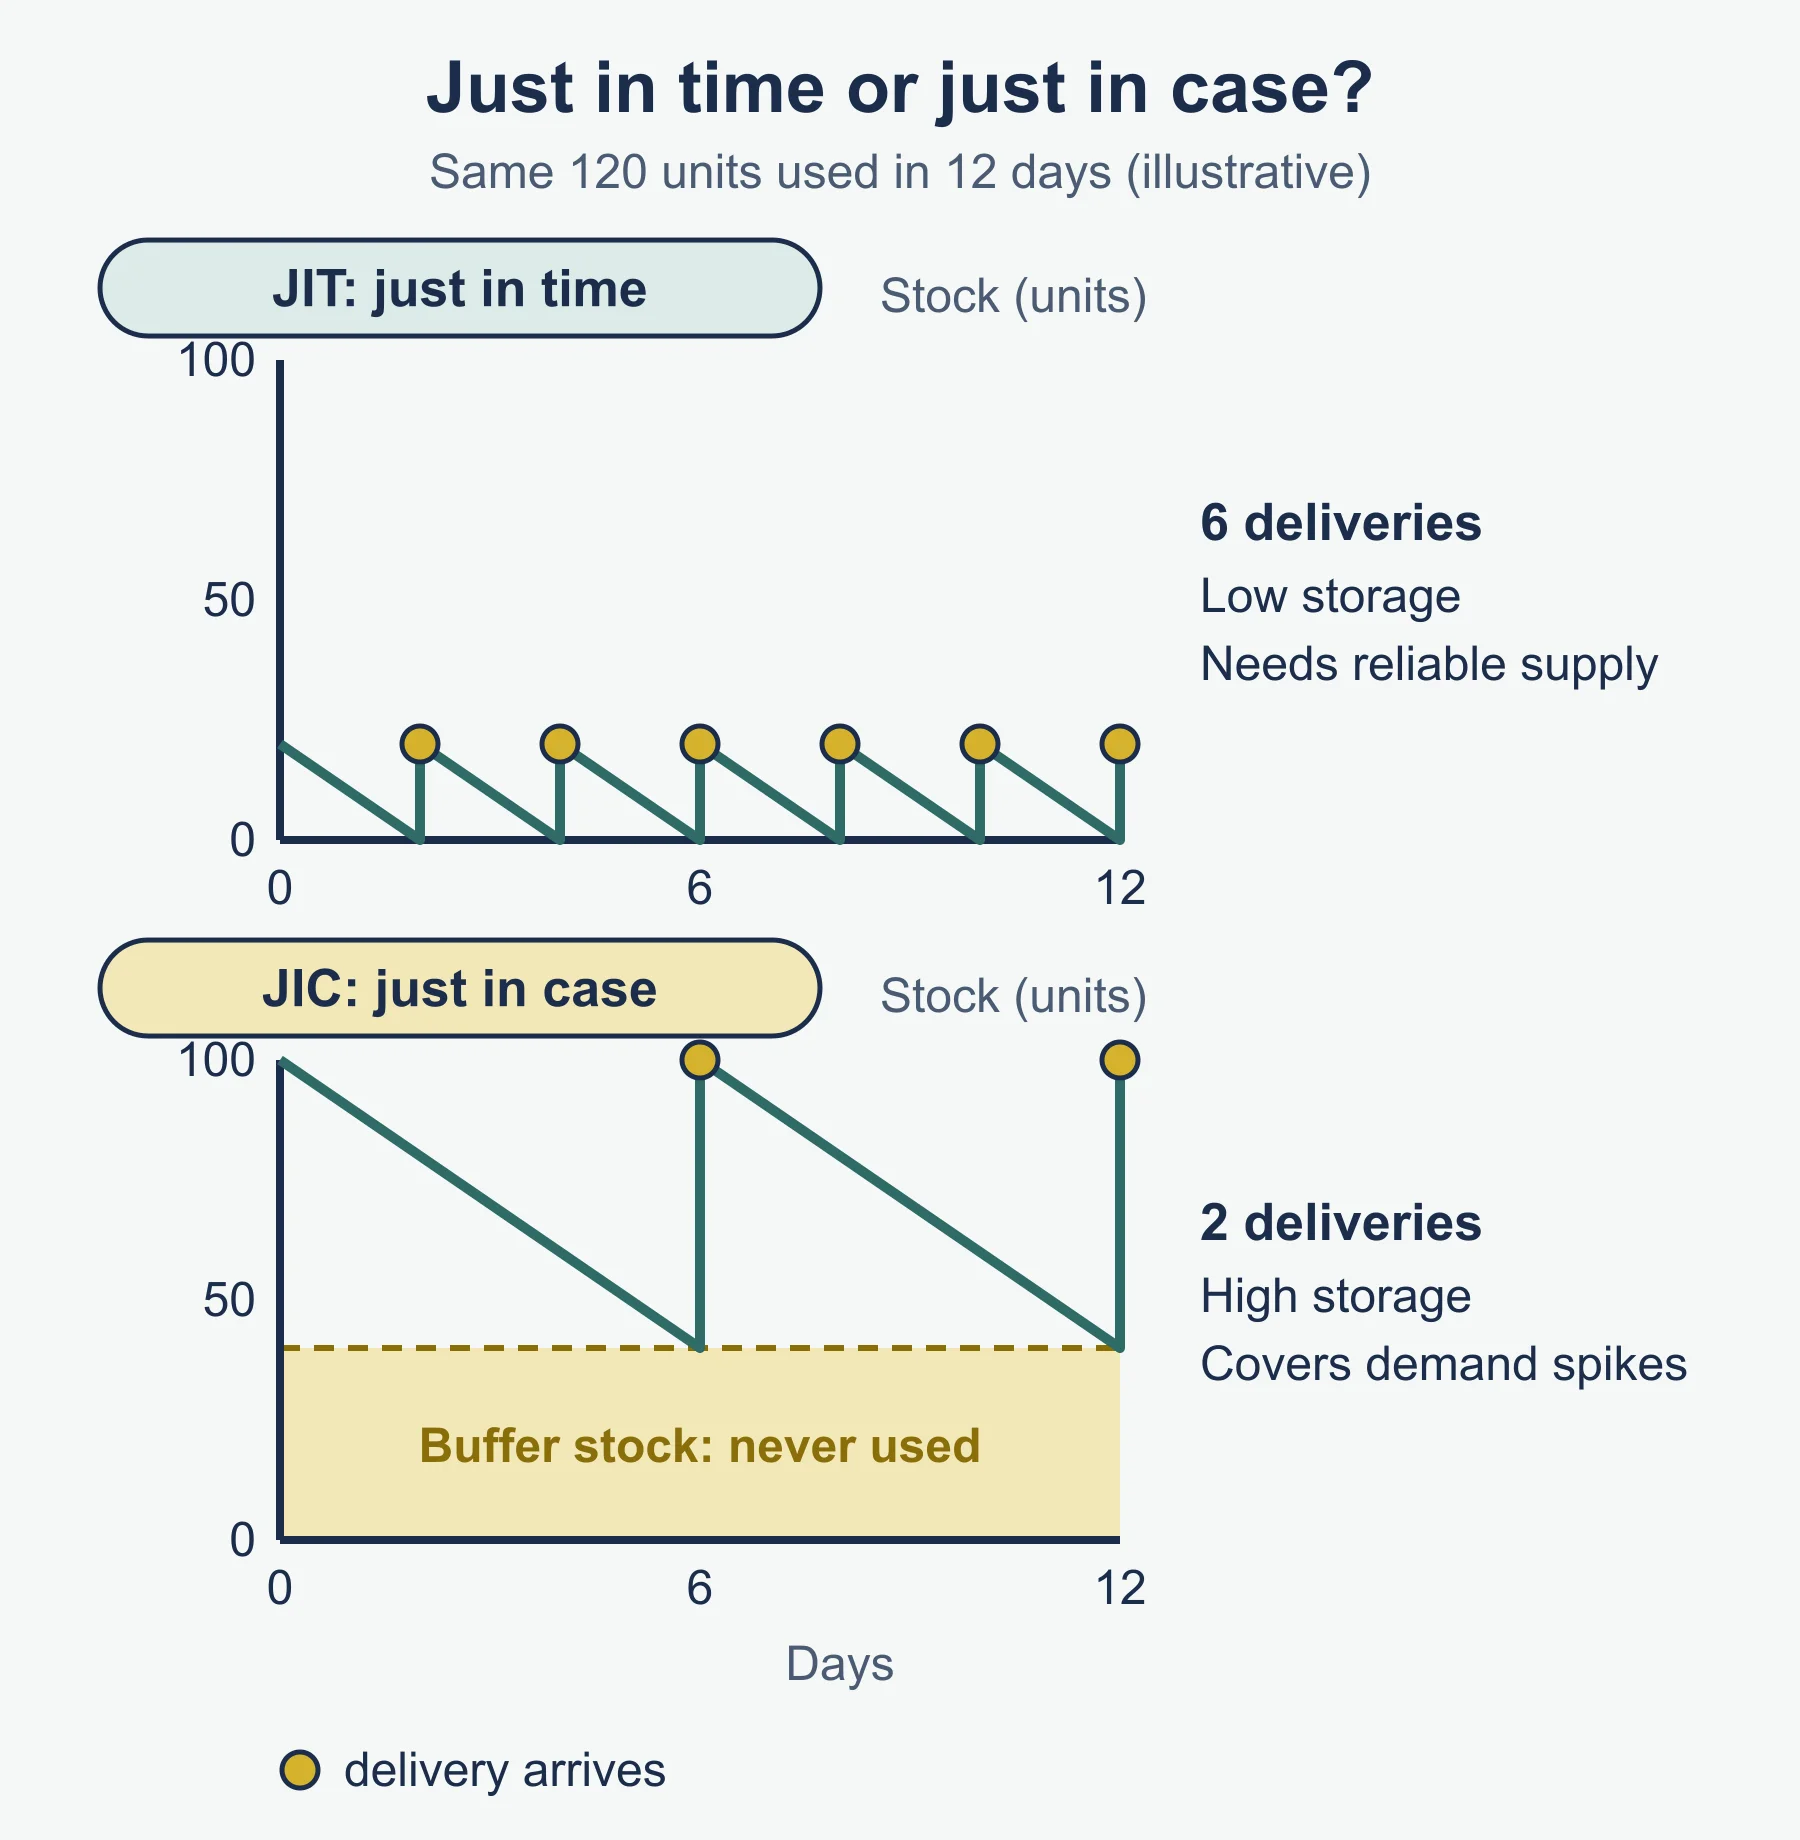
| JIT manufacturing | Inputs arrive as needed | Supply failure stops output |
| Waste management | Find and remove waste | Hard to measure; effort |
Links: inventory control (minimal inventory, JIT); quality (right first time); employees (wider roles, more skills); capacity management (high utilisation, less slack); efficiency (lower cost per unit).
9.3.5 Operations planning
Need: correct order of work, resources in place, delays seen early.
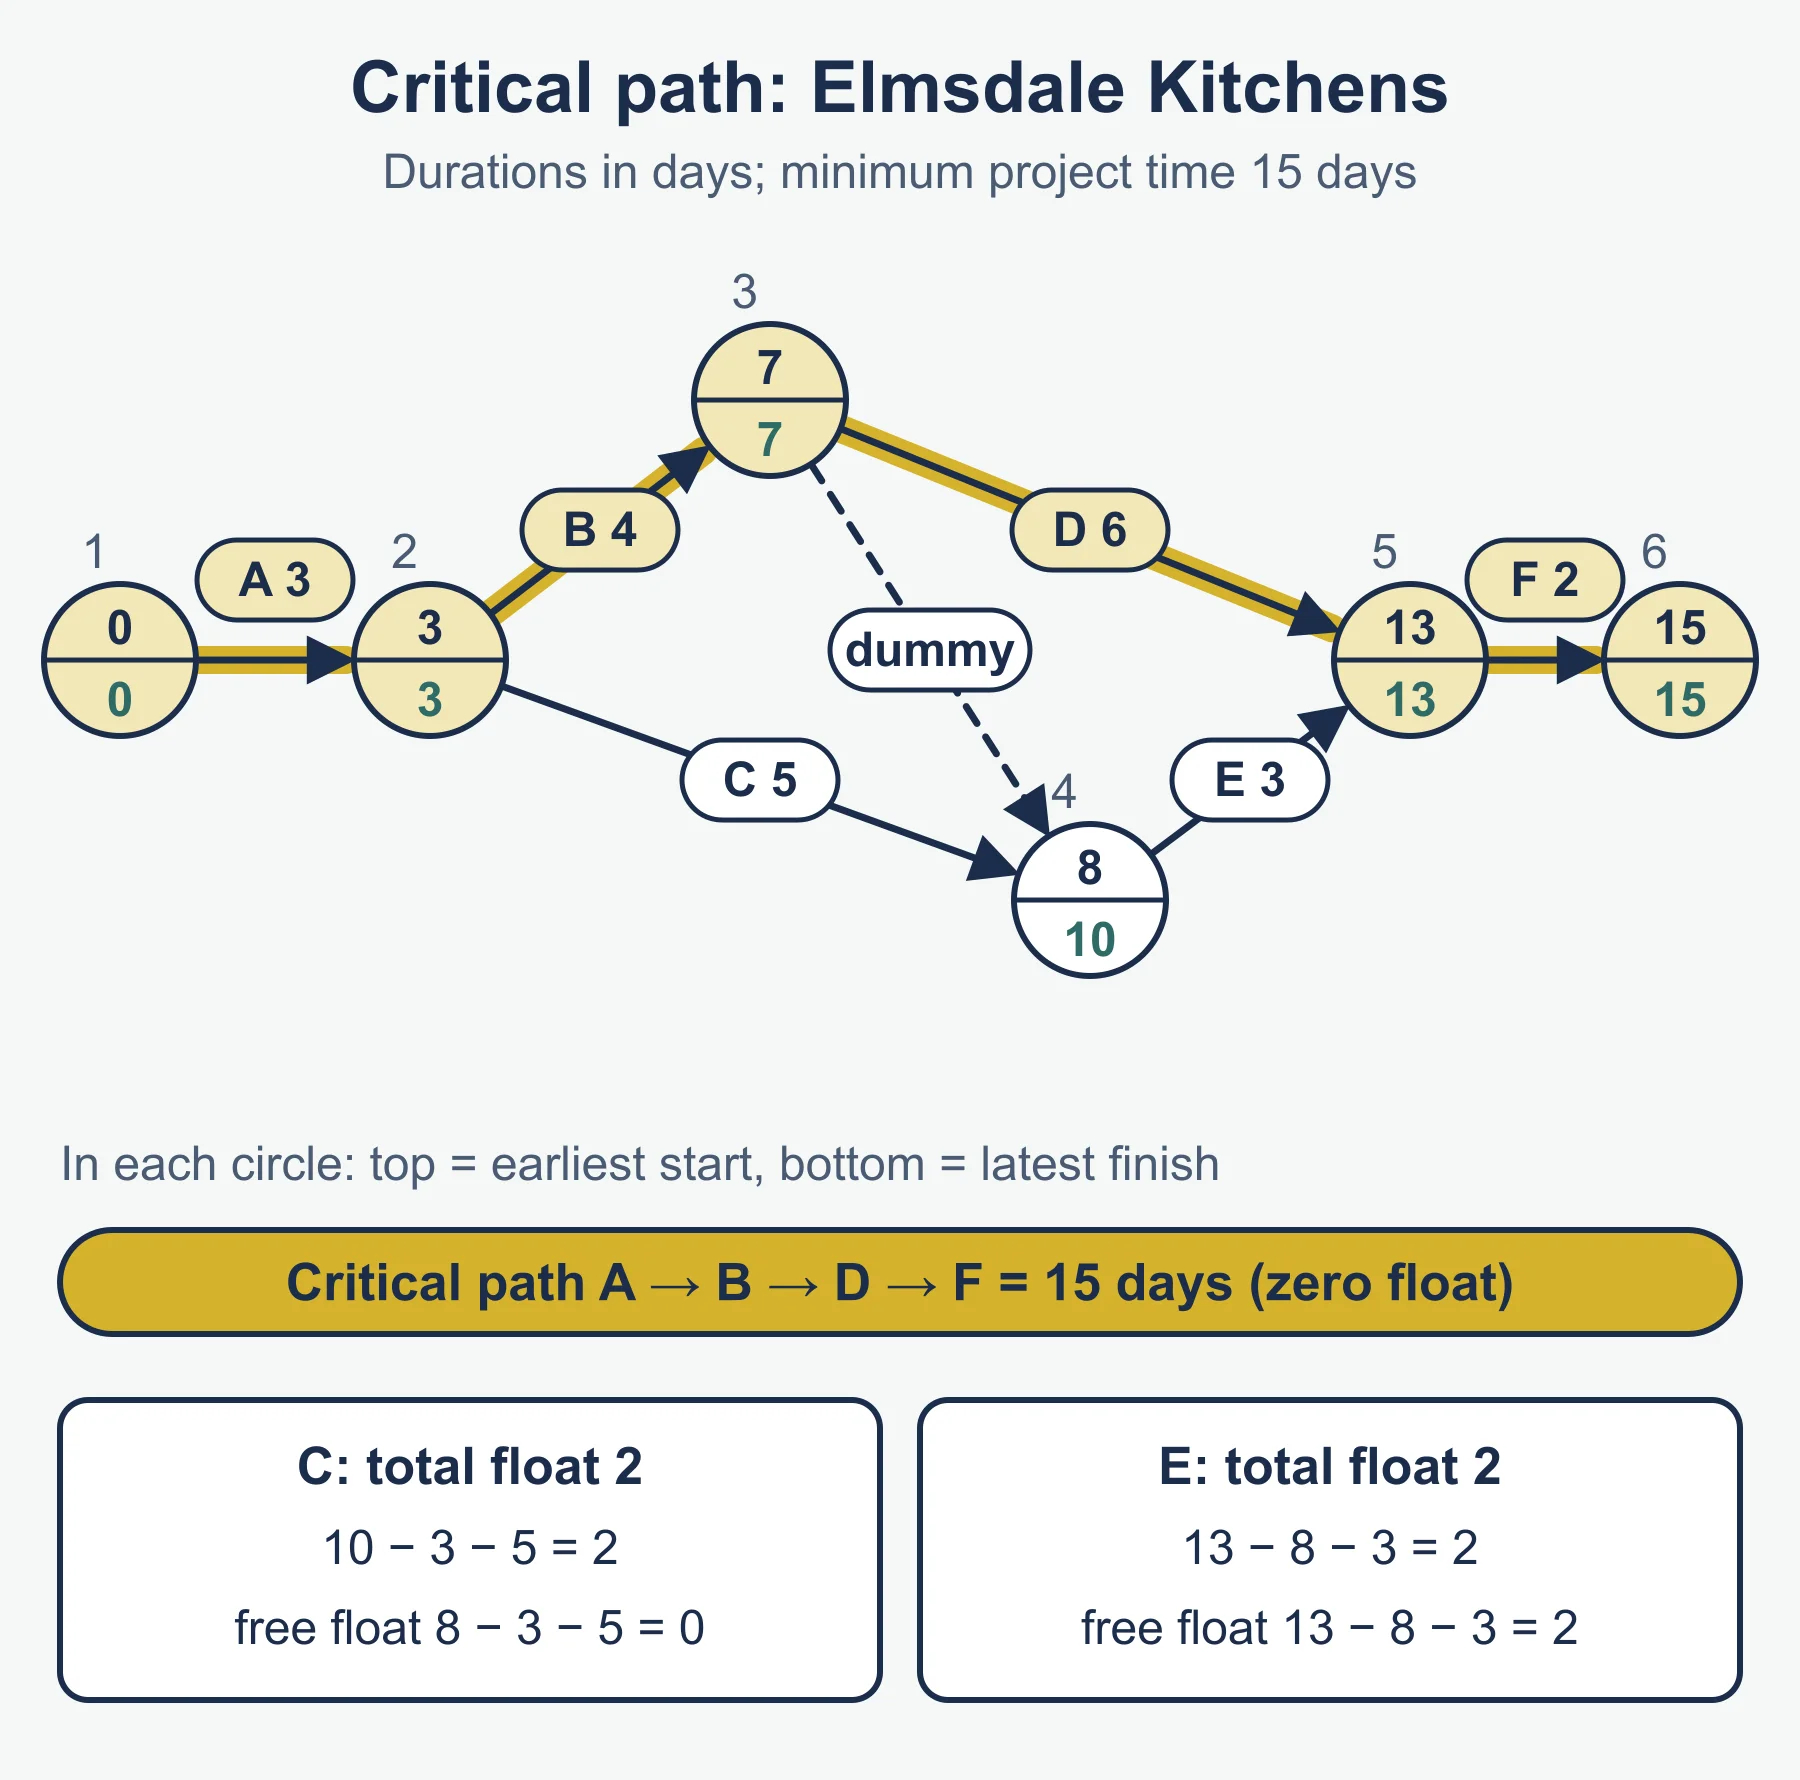
Network diagram elements
- Activity: an arrow with a duration.
- Node: a circle marking the start or end of activities.
- Dummy activity: a zero-duration dotted arrow showing a dependency.
Method in steps (standard forms)
- Forward pass: EST at a node = largest of (EST at start + duration) over arrows entering it.
- Minimum project duration = EST at the end node.
- Backward pass: LFT at a node = smallest of (LFT at end − duration) over arrows leaving it.
- Total float = LFT at end − EST at start − duration.
- Free float = EST at end − EST at start − duration.
- Critical path = activities with zero total float; the longest route.
Small worked reminder
A takes 2 days. B takes 5 days. C takes 3 days. B and C both start after A. D (4 days) starts after B and C. Path A, B, D = 11 days; path A, C, D = 9 days. Minimum duration 11 days, critical path A, B, D. C has total float 2 days (LFT 7 − EST 2 − 3 = 2).
Benefits: shows minimum time, critical activities and slack. Limits: estimates may be wrong, ignores cost and resources unless added, complex for big projects, needs updating.
Using the case study and judging
Papers 3 and 4 use a case study, and the last part of some questions, and every Paper 4 essay, should show evaluation. Use these prompts to turn knowledge into judgement.
| Question type | What to do |
|---|---|
| Define | Give a precise meaning in one sentence |
| Identify | Name or select; no explanation needed |
| Calculate | Show working from the figures given |
| Explain | Give a reason and say why or how it follows |
| Analyse | Build a chain: cause, effect, consequence for the business |
| Justify | Support a case with evidence and argument |
| Evaluate | Weigh both sides and reach a judgement |
Evaluation points that fit this unit
- TQM or lean: the gain depends on how willing staff are to change, on training, and on how long the business can wait for savings.
- JIT inside lean: it suits reliable suppliers and steady demand; a late delivery stops output because there is no buffer.
- ERP: judge cost against the gain in information; the size of the business and the number of sites matter.
- AI and IT: compare the cost of installing and training against the savings in labour and errors, and think about the effect on staff.
- Benchmarking: useful only if the comparison is with a similar process.
- CPA: reliable only if the time estimates are reliable; it should be updated as the project runs.
- Always finish with a reasoned judgement that depends on a stated factor (such as time horizon, size of the firm or supplier reliability).
Reading float results
- Zero total float means the activity is critical.
- If an activity is delayed by no more than its total float, the project end date is unchanged.
- If it is delayed by more than the total float, the project is delayed by the excess.
- Free float is the delay allowed before the next activity is affected; it can never be larger than total float.
- Staff and equipment can be shifted away from activities that have float and onto critical ones to shorten the project.
Quick self-test
- Define quality in operations terms.
- State one difference between QC and QA.
- Why does TQM reduce the need for inspectors?
- Name the three kinds of flexibility.
- Give two ways ERP improves efficiency.
- State the aim of lean production.
- Name three of the six operational strategies for lean production.
- In a network, what does a dummy activity show?
- An activity has EST 6 at its start node, a duration of 4 and an end node with EST 12 and LFT 14. Calculate total float and free float.
- State one limitation of CPA.
Answers
- Fit for purpose, meeting the specification and customer expectations.
- QC finds faults after they occur; QA prevents them by controlling the process.
- Workers check their own work, so quality is built in.
- Volume, delivery time and specification.
- For example live inventory records, and accurate costing for pricing.
- To produce with minimum waste while meeting customer needs.
- For example kaizen, quality circles, cell production (others: simultaneous engineering, JIT, waste management).
- A dependency that takes no time and uses no resources.
- Total float = 14 − 6 − 4 = 4 days. Free float = 12 − 6 − 4 = 2 days.
- For example duration estimates may be inaccurate.
Where marks are usually lost
- Describing quality as expensive or luxury instead of fit for purpose.
- Saying TQM needs more inspectors.
- Listing lean strategies without a limitation or a link to the case.
- Explaining ERP in general terms without naming the area of efficiency asked.
- Taking the shortest path as critical.
- Mixing up total float and free float, or forgetting the backward pass.
- Giving benefits of IT or AI with no cost or risk when asked to evaluate.
- Ignoring the data in the case study.
Frequently asked questions
What is the difference between quality control and quality assurance? Quality control detects faults after the event by inspecting or testing output. Quality assurance prevents faults by setting standards and checking the process throughout.
What are the three kinds of flexibility in Cambridge 9609 operations? Volume, delivery time and specification. Ways to gain flexibility include multi-skilled staff, flexible machines, temporary contracts and outsourcing.
What are the six lean production strategies? Kaizen, quality circles, simultaneous engineering, cell production, JIT manufacturing and waste management. Each has a limitation, so link it to the business in the case.
What is the difference between total float and free float? Total float is the delay an activity can have without delaying the whole project. Free float is the delay allowed before the next activity is affected, and it can never be larger than the total float.
Official syllabus
Cambridge International AS & A Level Business 9609 syllabus for examination in 2026, 2027 and 2028, published by Cambridge University Press & Assessment (Cambridge International Education): sections 9.2 and 9.3.
Get free revision emails (optional)
Occasional emails with practice questions, worked explanations and links to free resources for the qualification and subjects you choose. No spam, and you can unsubscribe from any email. The free tools on this site never need an email.
Related resources
-
Study guides
A Level Business: The nature of operations (Cambridge 9609)
Study guide to the nature of operations for Cambridge AS & A Level Business: added value, productivity, sustainability and operations methods.
Business · Cambridge · AS Level
Read guide -
Practice questions
A Level Business: The nature of operations (Cambridge 9609) – Practice Questions
Original practice questions with worked answers on the nature of operations for Cambridge AS & A Level Business: productivity, methods and sustainability.
Business · Cambridge · AS Level
Try questions -
Revision notes
A Level Business: The nature of operations (Cambridge 9609) – Revision Notes
Condensed revision notes for Cambridge AS & A Level Business section 4.1: added value, productivity, sustainability and operations methods.
Business · Cambridge · AS Level
Revise topic
Related articles
-
teaching
A Level tuition in Dubai: Cambridge or Pearson Edexcel International A Level?
Schools in Dubai and Abu Dhabi teach either Cambridge International AS & A Level or Pearson Edexcel International A Level. How the two are structured, why it matters for tuition, and how online classes from Lahore work.
9 October 2026
-
curriculum guides
Choosing subjects at IGCSE and A Level
How subject choices at 14 and 16 affect university options later, and how to keep pathways open without overloading a timetable.
28 July 2026
Studying this with a teacher
Working through Business A LEVEL?
This page is free and stays free. If you would rather be taught it, Marlbridge runs Business classes one-to-one and in small groups of up to 15, online in your own time zone. The first trial class is free. WhatsApp replies within an hour (8am–11pm Pakistan time, every day); email the same day.
Cambridge Business teachers at Marlbridge

