
Study Guides
A Level Business: Quality management and Operations strategy (Cambridge 9609)
Study guide to 9.2 Quality management and 9.3 Operations strategy in Cambridge A Level Business 9609: TQM, benchmarking, ERP, lean production and CPA.
- Subject
- Business
- Level
- A LEVEL
- Topic
- Operations management
- Author
- Marlbridge Academic Team
- Updated
- Reviewed by
- Salman Ahmad (what this means)
Aligned to Cambridge A Level Business (9609), For examination in 2026, 2027 and 2028. Official specification .
Syllabus page (what it covers and how it is assessed): Cambridge A Level Business.
Syllabus points this page covers
9609 (A Level)
- 9.2 Quality management
- 9.3 Operations strategy
Found an error? Report a correction.
Need help with this topic? Request a free trial class for A Level Business (9609).
This guide covers sections 9.2 Quality management and 9.3 Operations strategy of the Cambridge International AS & A Level Business 9609 syllabus for examination in 2026, 2027 and 2028. Both are A Level topics, so they are assessed in Papers 3 and 4, and AS knowledge (including inventory management and JIT) is assumed. For quick recall use the revision notes, then the practice questions. Related: the Topic 9 practice set, inventory management and capacity utilisation. Course links: the Cambridge A Level Business hub, the checklist and the free diagnostics.
What this unit covers
| Syllabus point | Skills to show |
|---|---|
| 9.2.1 Quality | Explain quality as meeting customer expectations, and why it matters |
| 9.2.1 Control, assurance, TQM | Analyse the impact of each on a business |
| 9.2.2 Benchmarking | Explain its importance in quality management |
| 9.3.1 Operational decisions | Link decisions to human, marketing and finance resources; discuss IT and AI |
| 9.3.2 Flexibility and innovation | Volume, delivery time, specification; process innovation |
| 9.3.3 ERP | Main features; effects on six named areas of efficiency |
| 9.3.4 Lean production | Aims; six strategies; their limitations; links to five areas |
| 9.3.5 Operations planning | Network diagrams, CPA, floats, benefits and limitations |
Papers 3 and 4 use a case study and expect you to use its information. Answers to the last parts of some questions, and to Paper 4 essays, should show evaluation.
9.2.1 Quality: meeting customer expectations
In operations management, quality means a product or service is fit for purpose and meets the specification set for it. This is different from a customer’s perception of quality, which comes from price, brand, packaging and experience. A basic mug that never leaks is high quality in the operations sense even if a buyer thinks of it as cheap.
Quality matters because:
- Fewer faulty units mean less waste and rework, which helps finance.
- A reliable product protects the brand and supports repeat purchase and, where customers value reliability, a higher price, which helps marketing.
- Staff who spend less time fixing errors are easier to motivate, which helps human resources.
Quality control
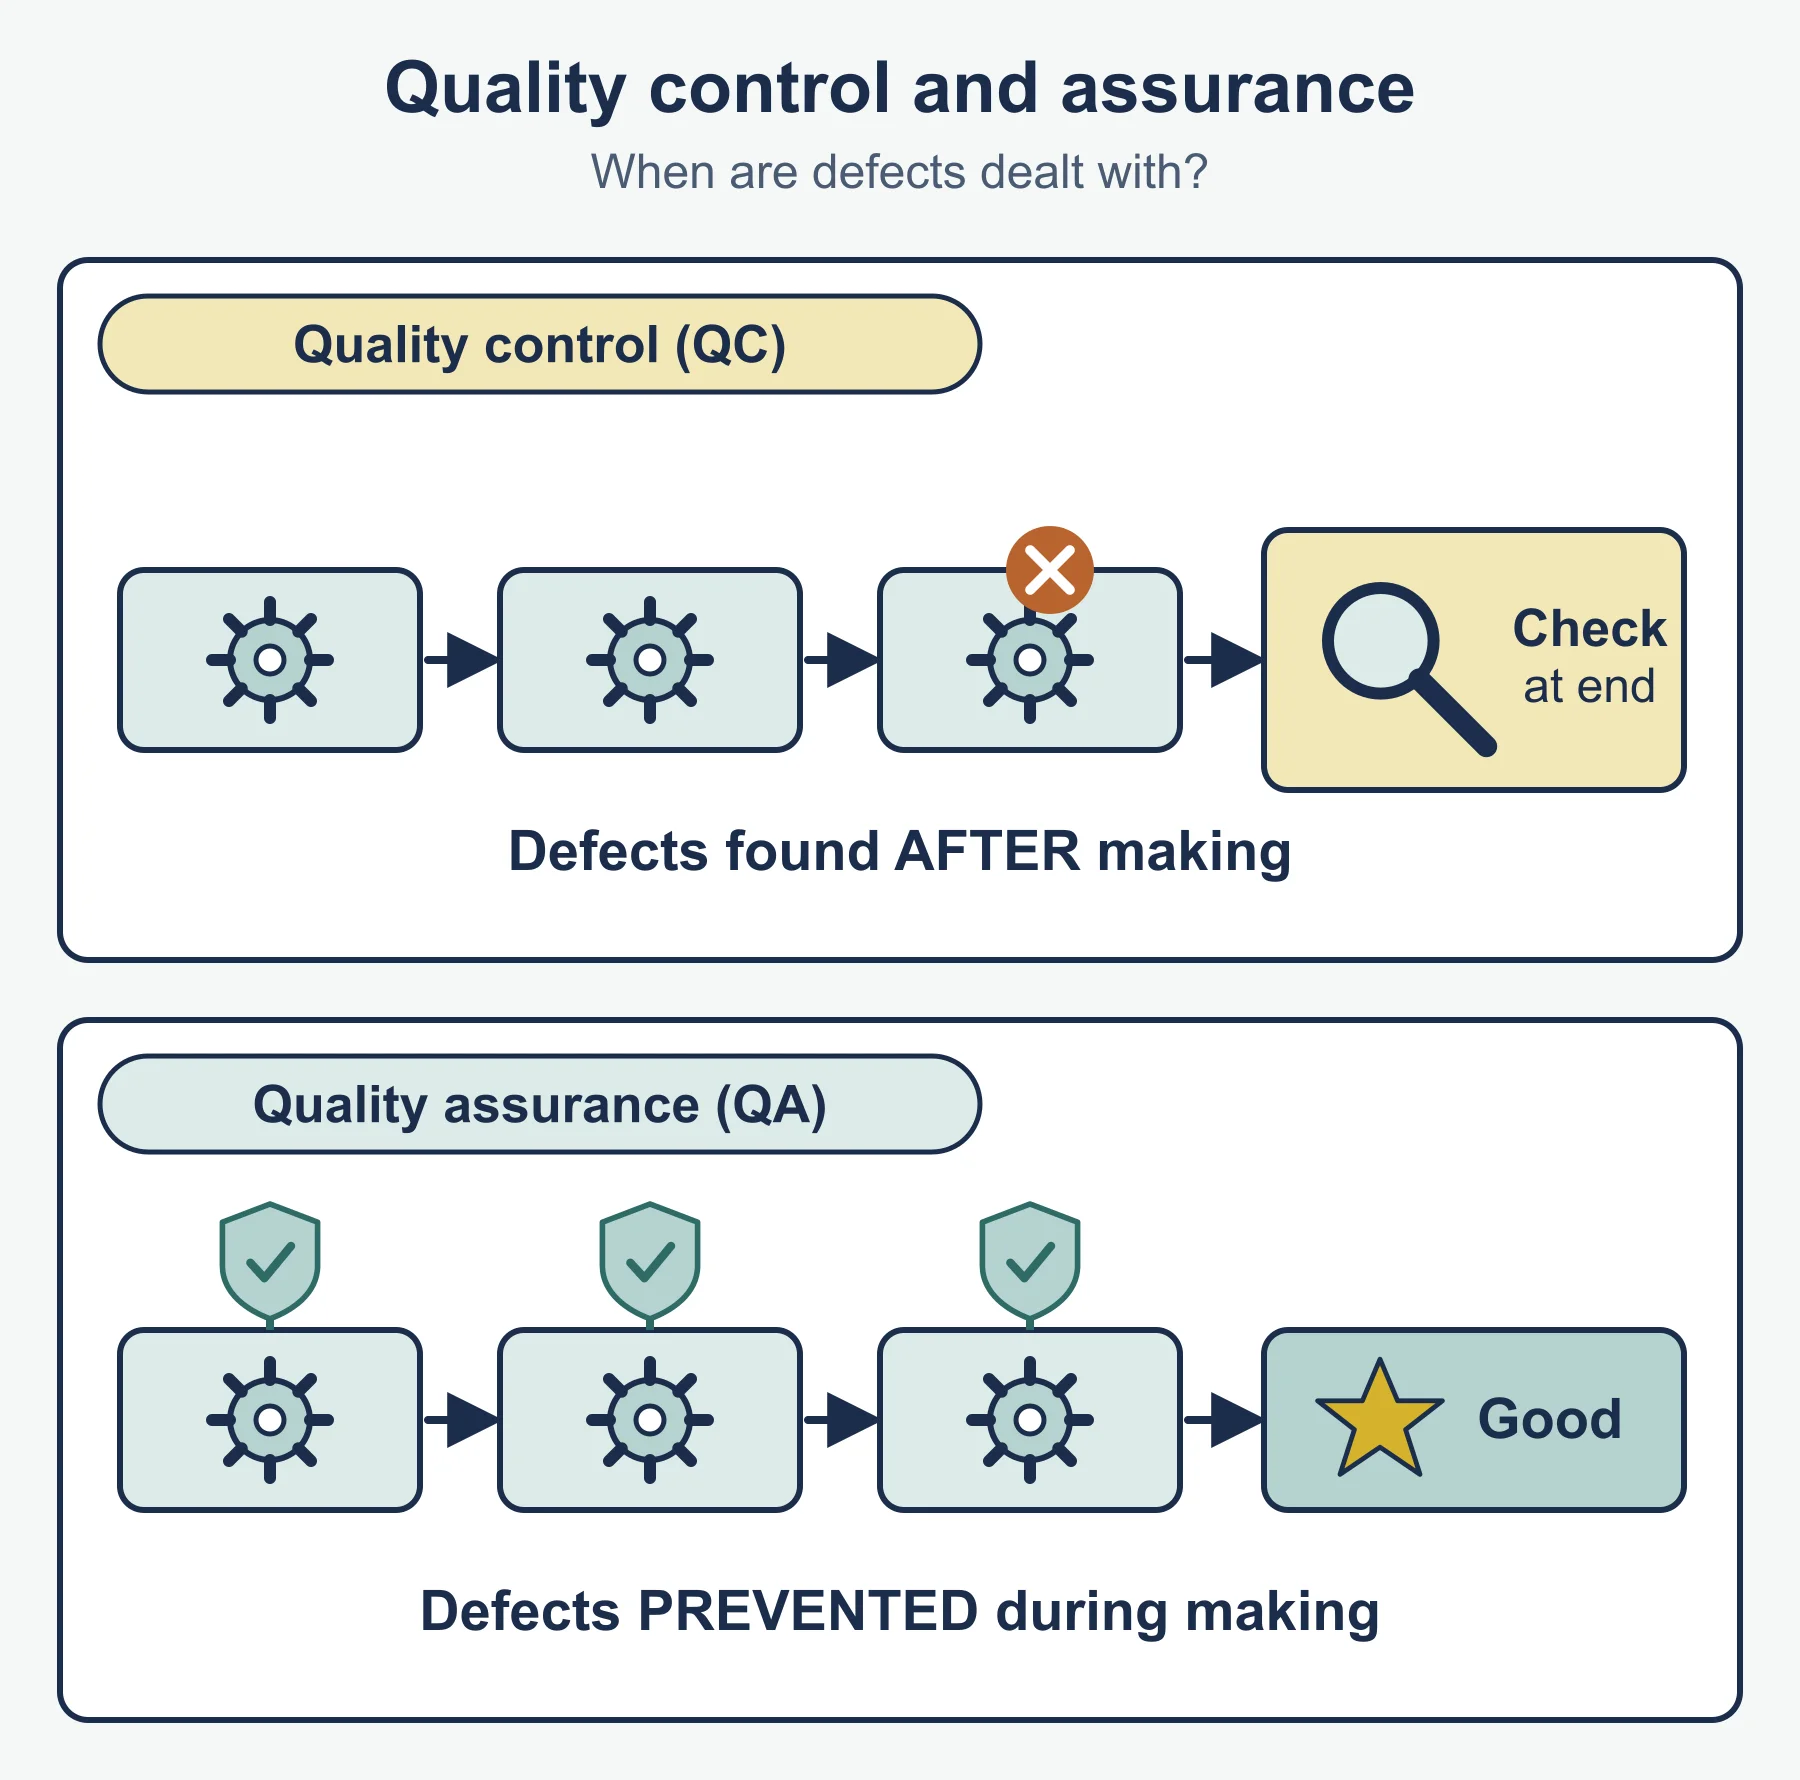
Quality control (QC) means inspecting or testing output, either every unit or a sample, and removing or correcting faulty items. It usually takes place at the end of production, or at set checkpoints.
Impact on a business:
- It catches faulty items before they reach customers, protecting reputation.
- It needs inspectors, equipment and time, which add cost without adding value.
- It finds faults after they have occurred, so materials and labour are already wasted.
Quality assurance
Quality assurance (QA) tries to prevent faults by setting standards and checking the process at every stage, from supplier selection to delivery. Typical features are agreed supplier standards, documented procedures, checks at each stage and records that trace the cause of a fault.
Impact on a business:
- Fewer defects are produced, so waste and rework fall.
- Set-up costs are higher: procedures, training and recording.
Contrast: QC detects faults after the event; QA prevents them by controlling the process.
Total Quality Management (TQM)
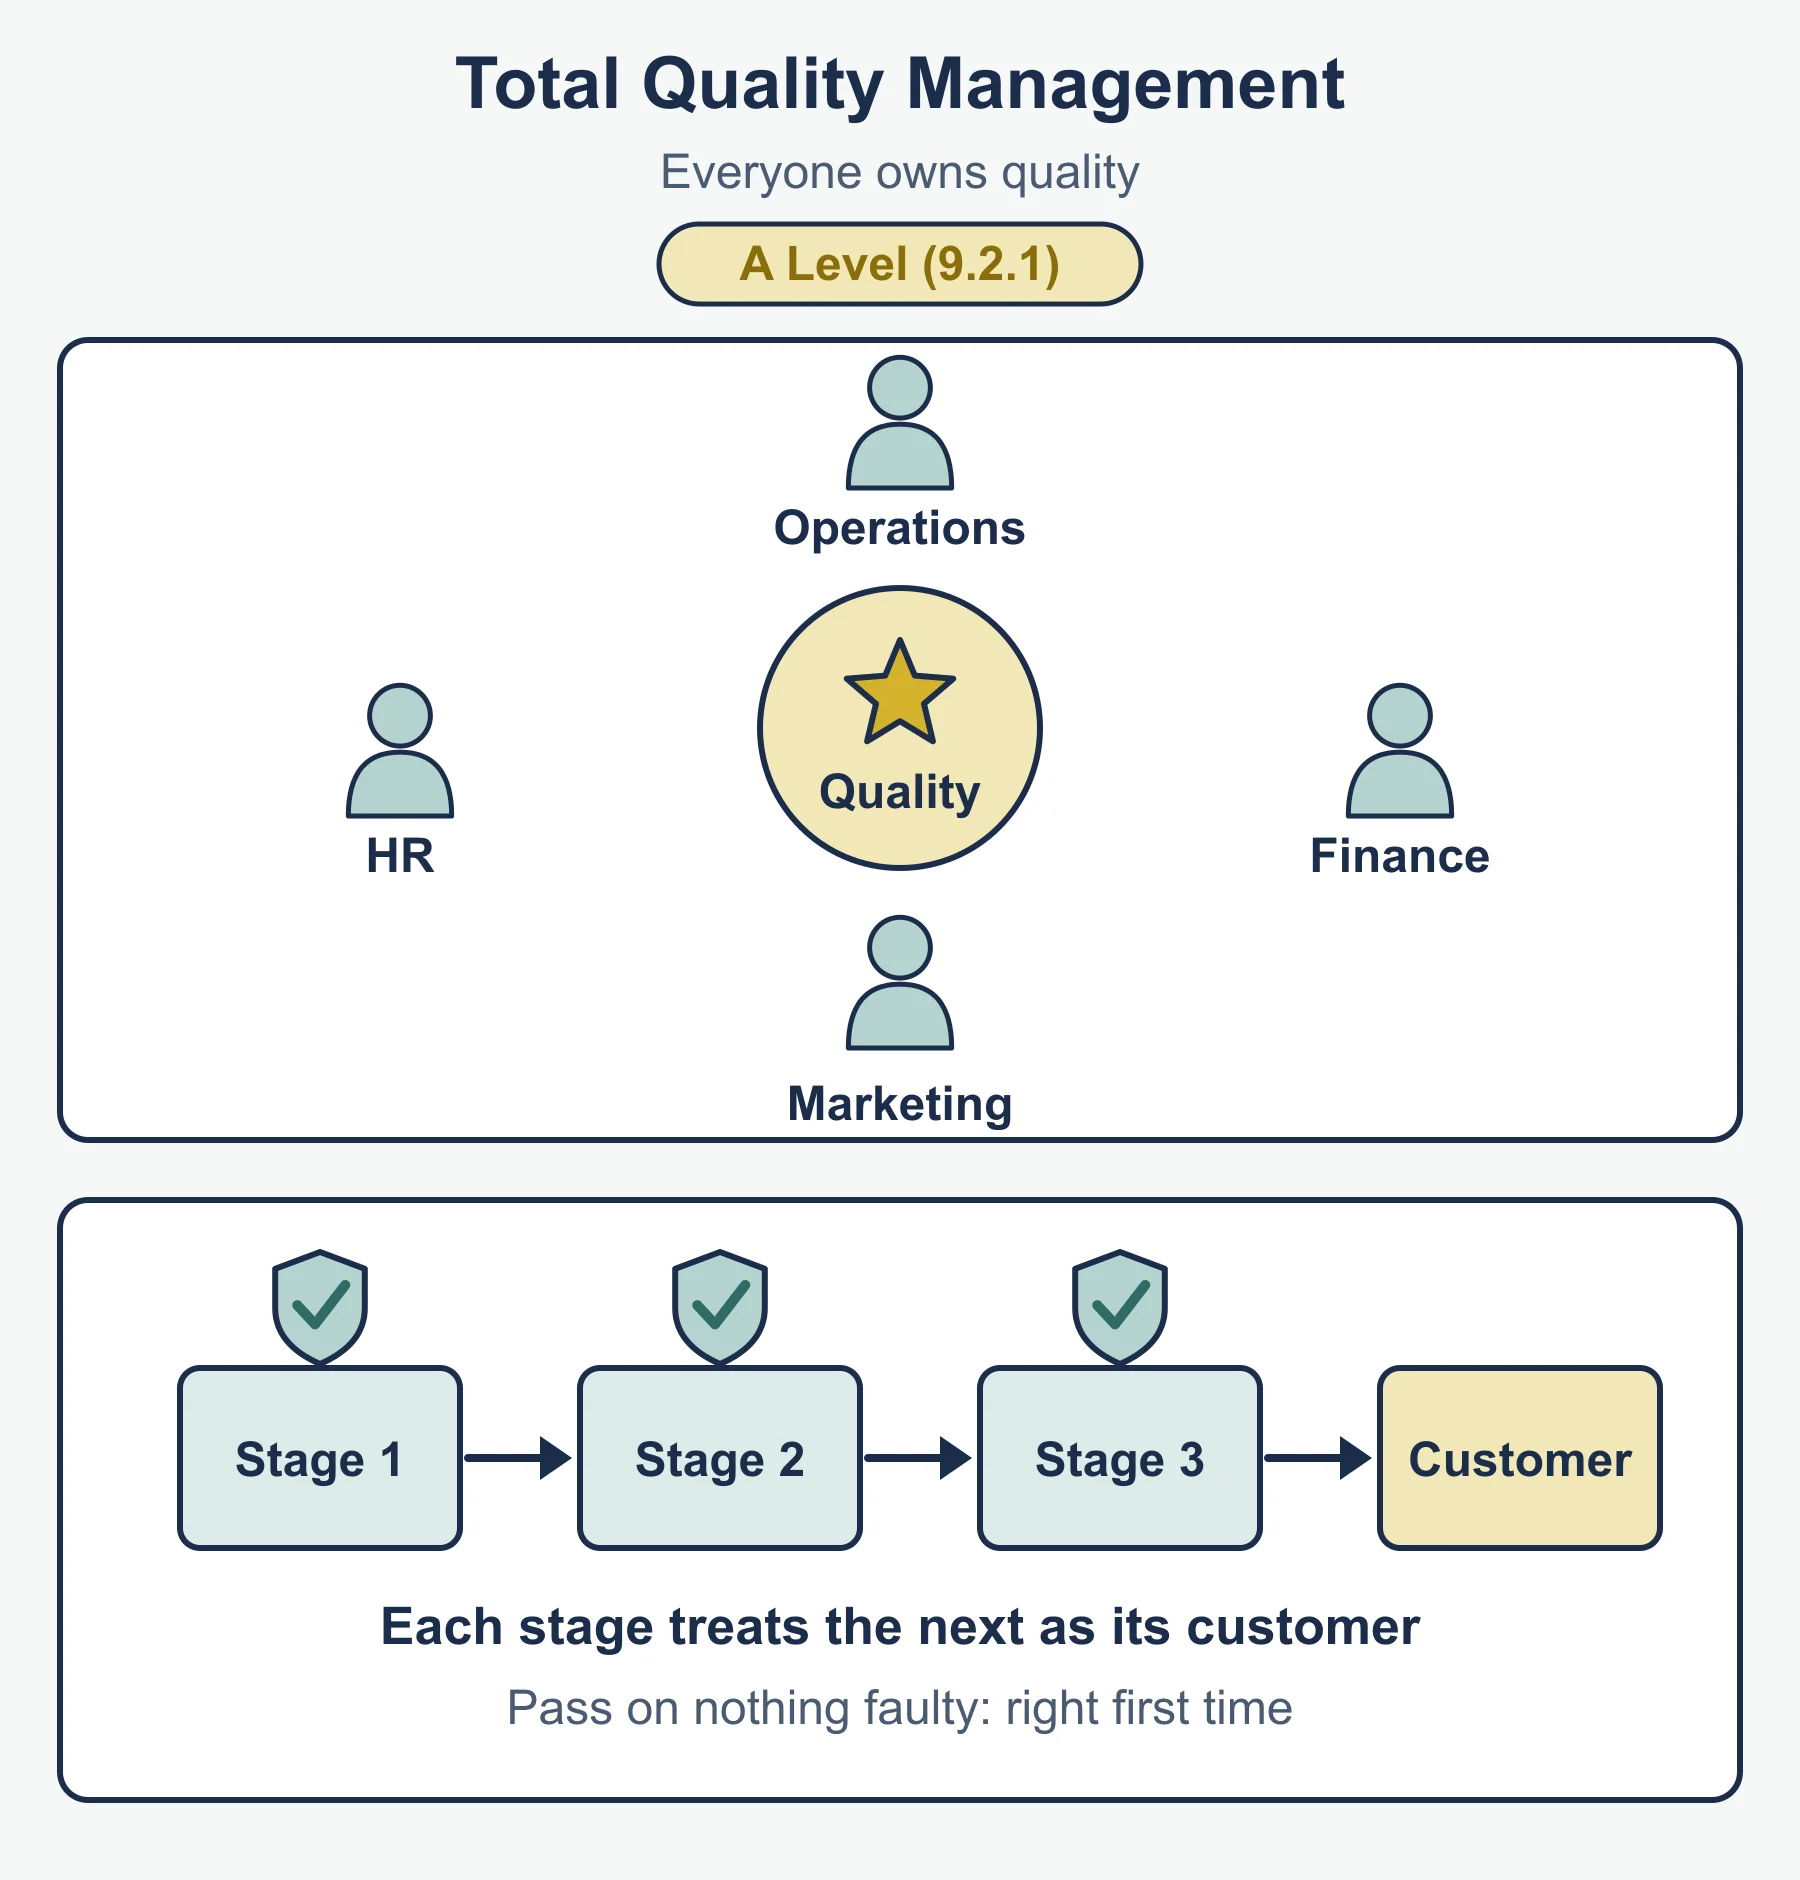
TQM is a whole-business approach in which every employee in every department takes responsibility for quality, with the aim of getting things right first time and ending defects. Staff treat the next stage of the process as their “customer” and pass on nothing faulty.
Impact on a business:
- Defects and waste fall, and fewer inspectors are needed because workers check their own work.
- Training is costly, and the business must change its culture, so results take time.
- Staff may resist extra responsibility.
Worked example: is the quality system paying?
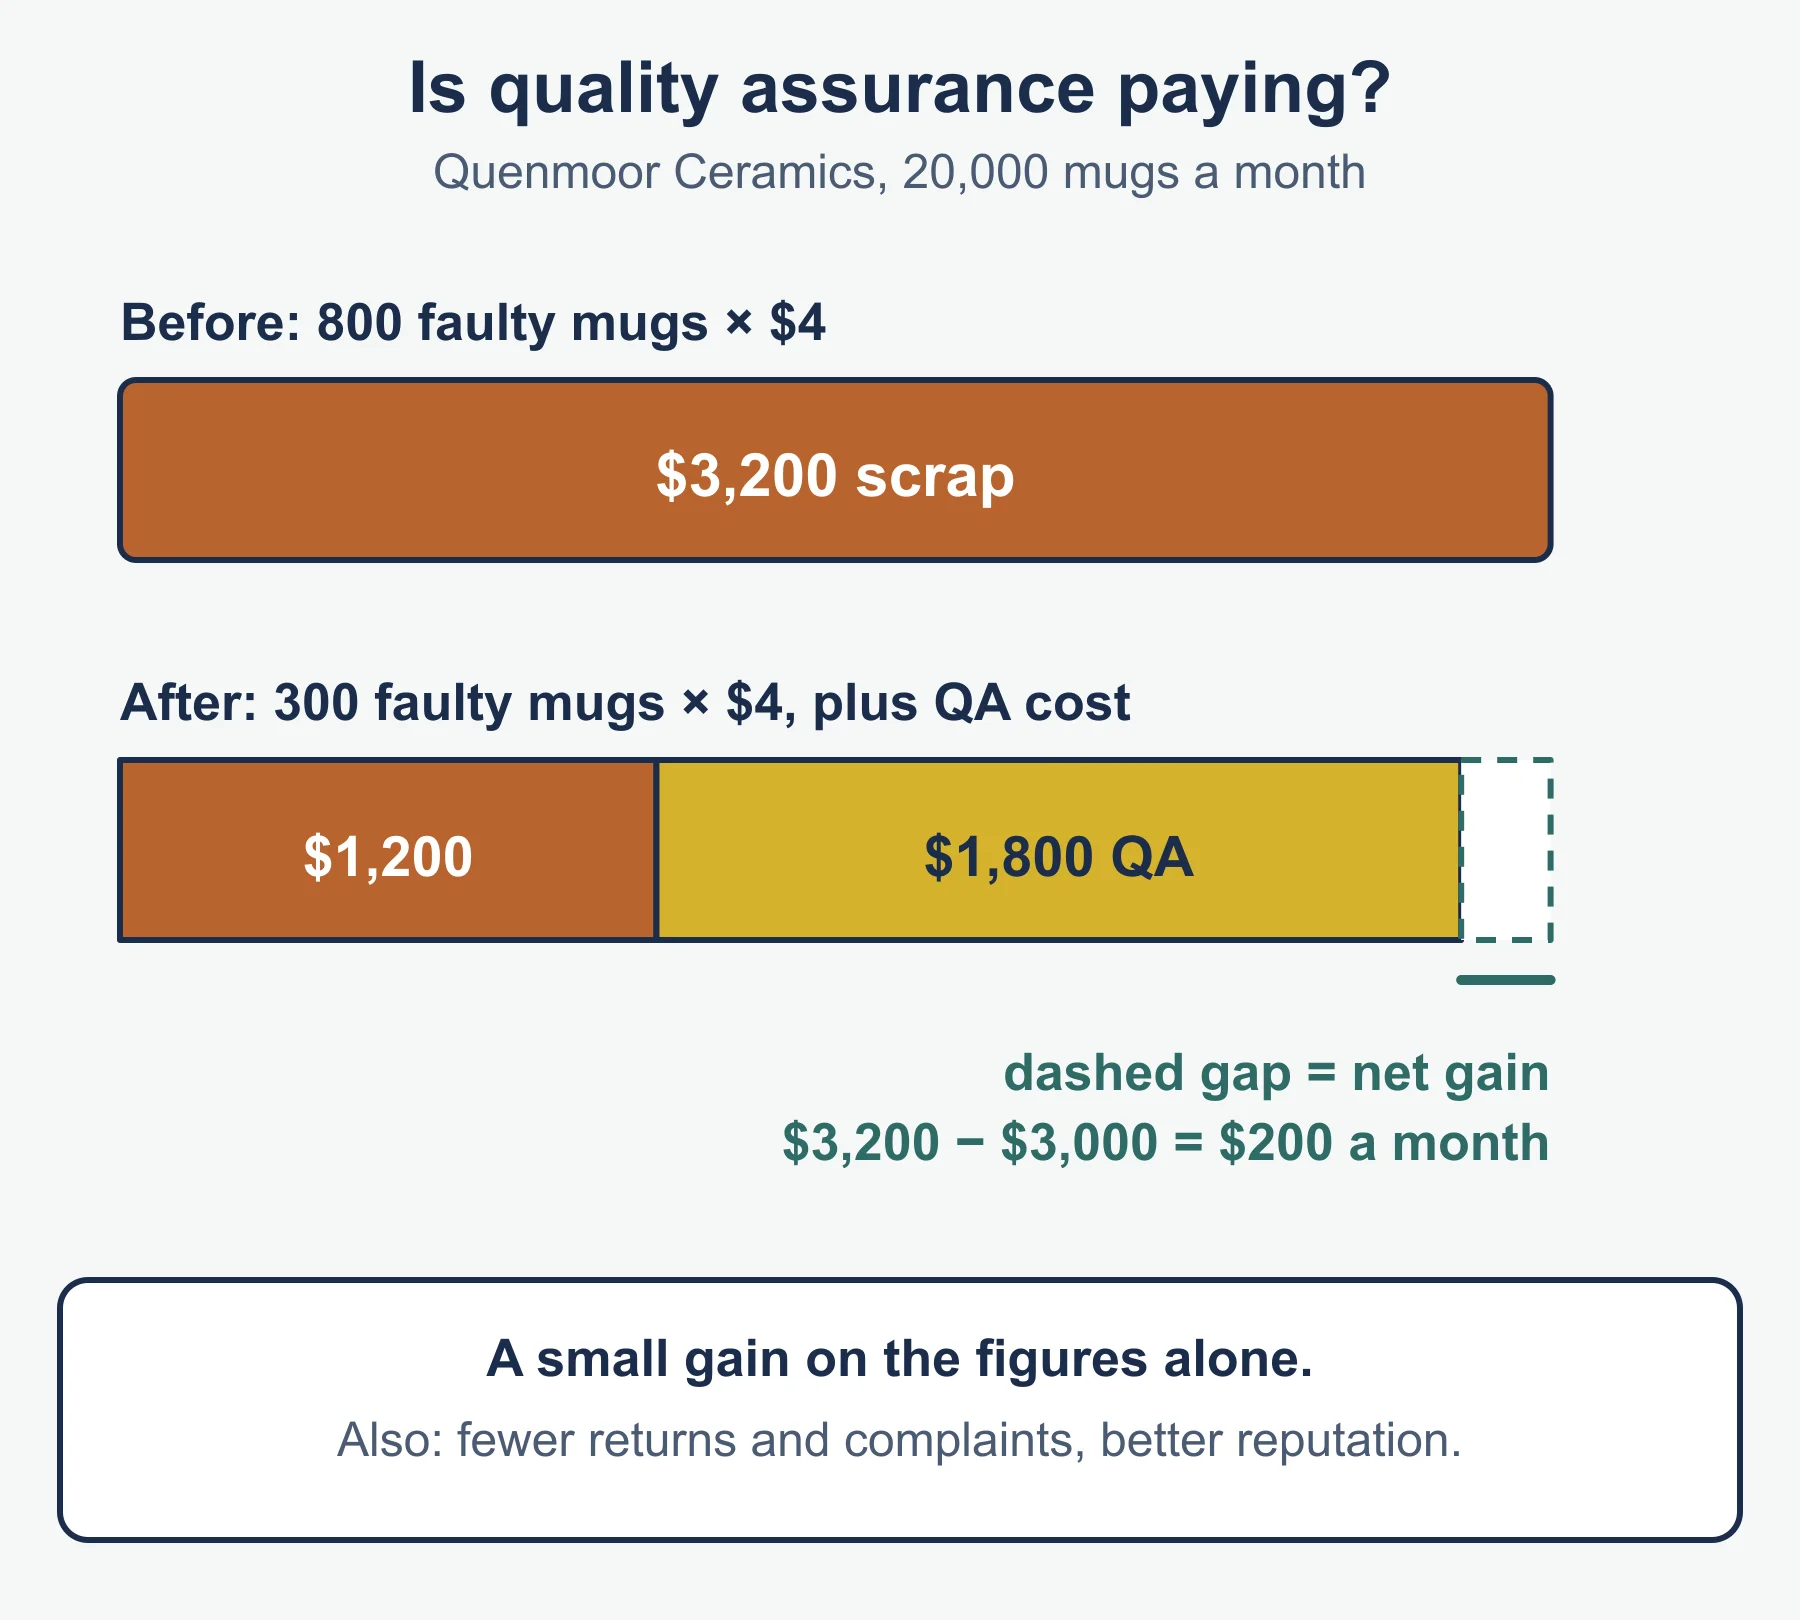
Quenmoor Ceramics makes 20 000 mugs a month. At present 4% are found faulty at final inspection, and each faulty mug costs 4 dollars in scrap and rework. The business introduces quality assurance that costs 1 800 dollars a month in extra training and records, and the faulty rate falls to 1.5%.
- Faulty mugs before: 20 000 × 0.04 = 800. Cost: 800 × 4 = 3 200.
- Faulty mugs after: 20 000 × 0.015 = 300. Cost: 300 × 4 = 1 200.
- Saving on scrap and rework: 3 200 − 1 200 = 2 000.
- Net monthly gain: 2 000 − 1 800 = 200.
The gain is small on these figures alone. A full answer adds what the figures leave out: fewer returns and complaints, and a stronger reputation.
9.2.2 Benchmarking
Benchmarking means comparing a business’s performance, processes or products with those of the best performers, then using the gaps to set targets and make changes. The comparison can be against another business, against a leader in a different industry with a similar process, or against the best unit inside the same business. These groupings are a standard way of describing benchmarking; the syllabus asks for its importance in quality management.
Why it matters:
- It shows where the business is weaker than the best, with evidence.
- It gives realistic targets and supports continuous improvement.
Limits: competitor data is hard to obtain, and methods that suit one business may not suit another.
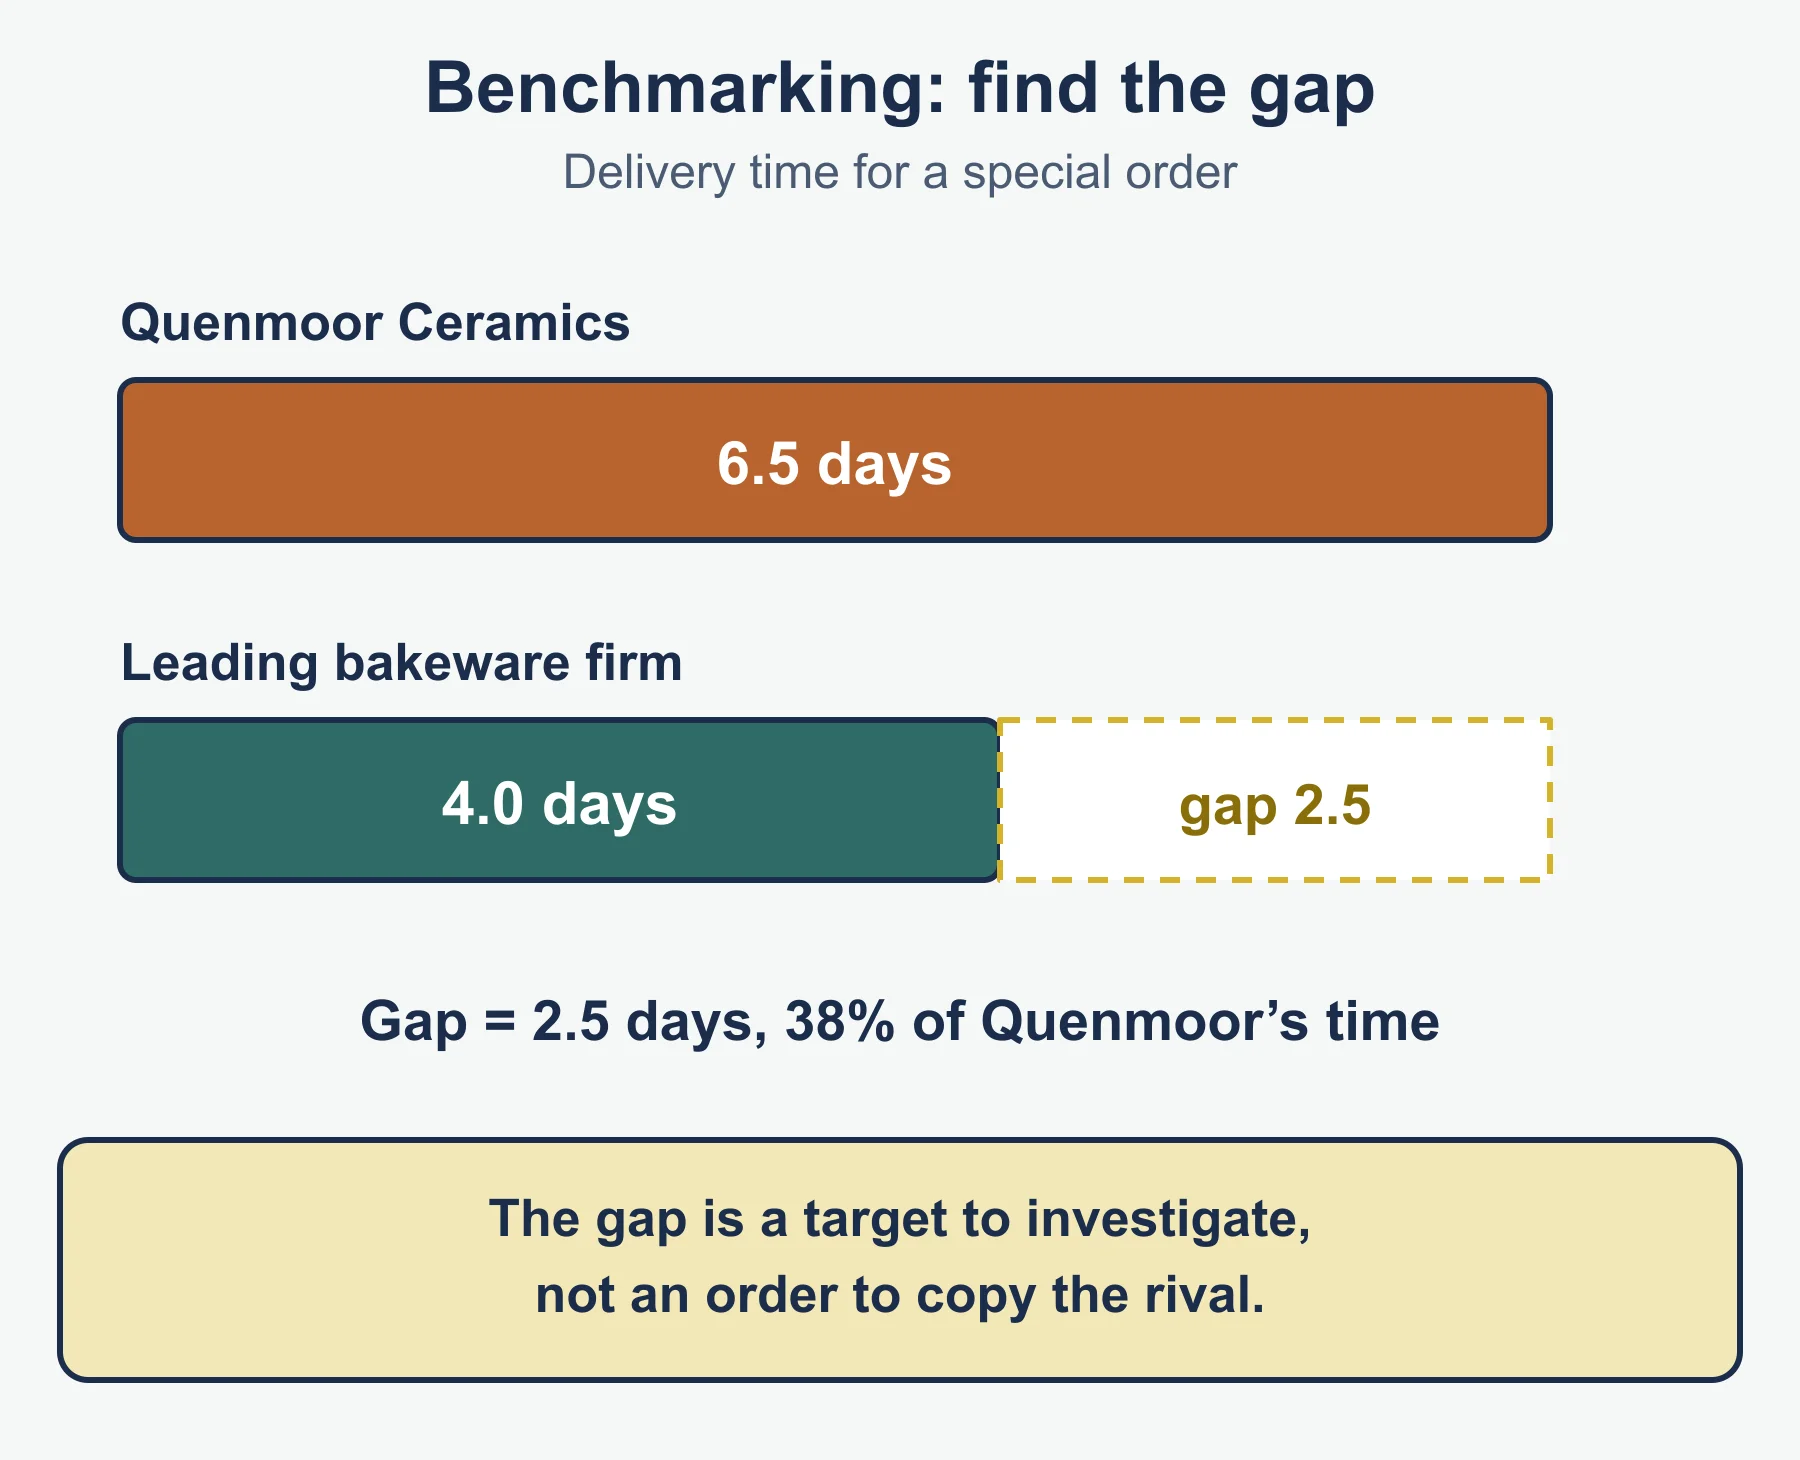
Example: Quenmoor Ceramics takes 6.5 days to deliver a special order. A leading bakeware firm with a similar process takes 4.0 days. The gap is 2.5 days (38% of Quenmoor’s time). That gap becomes the target to investigate, not a command to copy the rival.
9.3.1 Operational decisions
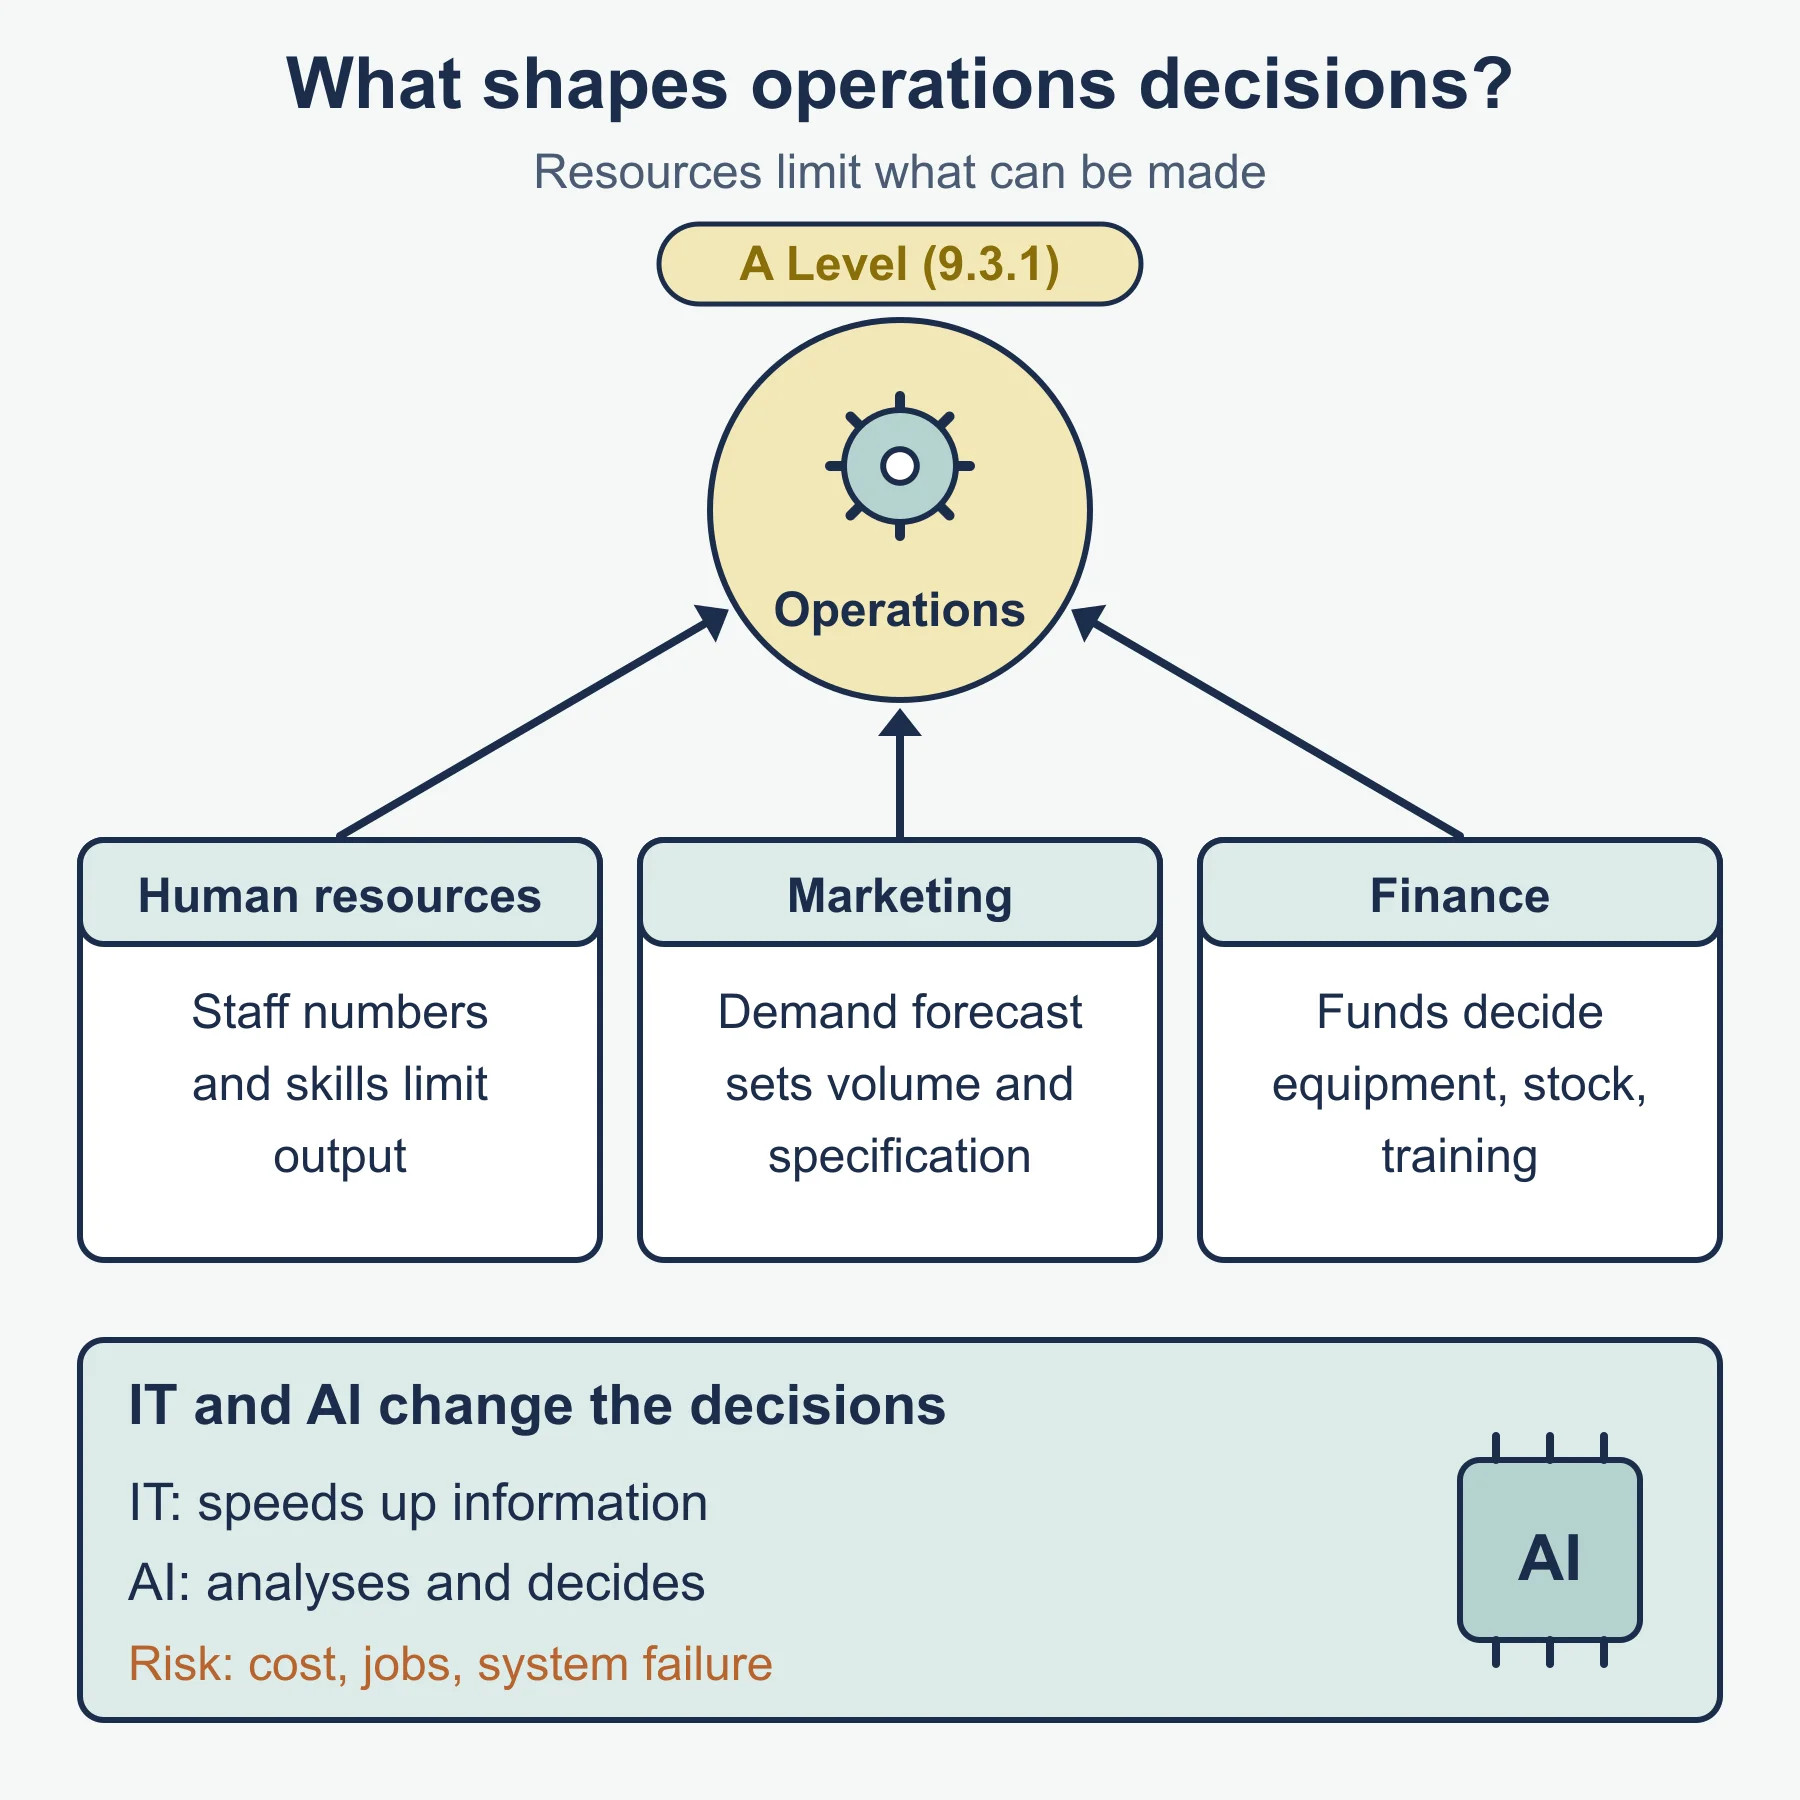
Operations decisions (what volume to make, which process to use, how much to spend on equipment) are shaped by the resources a business has.
- Human resources: the number and skills of staff limit what can be made. Shortages mean overtime, outsourcing or training; skilled, flexible staff allow more varied output.
- Marketing: demand forecasts and the brand promise set volume and specification. A campaign that lifts demand quickly puts pressure on capacity.
- Finance: available funds decide whether the business can buy equipment, hold inventory or pay for training. A cash shortage may force a cheaper process.
The changing role of IT and AI
IT speeds up information handling: computer-aided design, stock records, automated machines and online ordering. Artificial Intelligence (AI) adds analysis and decisions, such as forecasting demand, spotting faults on a camera feed, predicting when machines need servicing and answering customer queries.
Benefits: faster, consistent work and better data. Risks: purchase and training costs, jobs changed or lost, reliance on systems that can fail, and poor decisions if data is wrong.
9.3.2 Flexibility and innovation
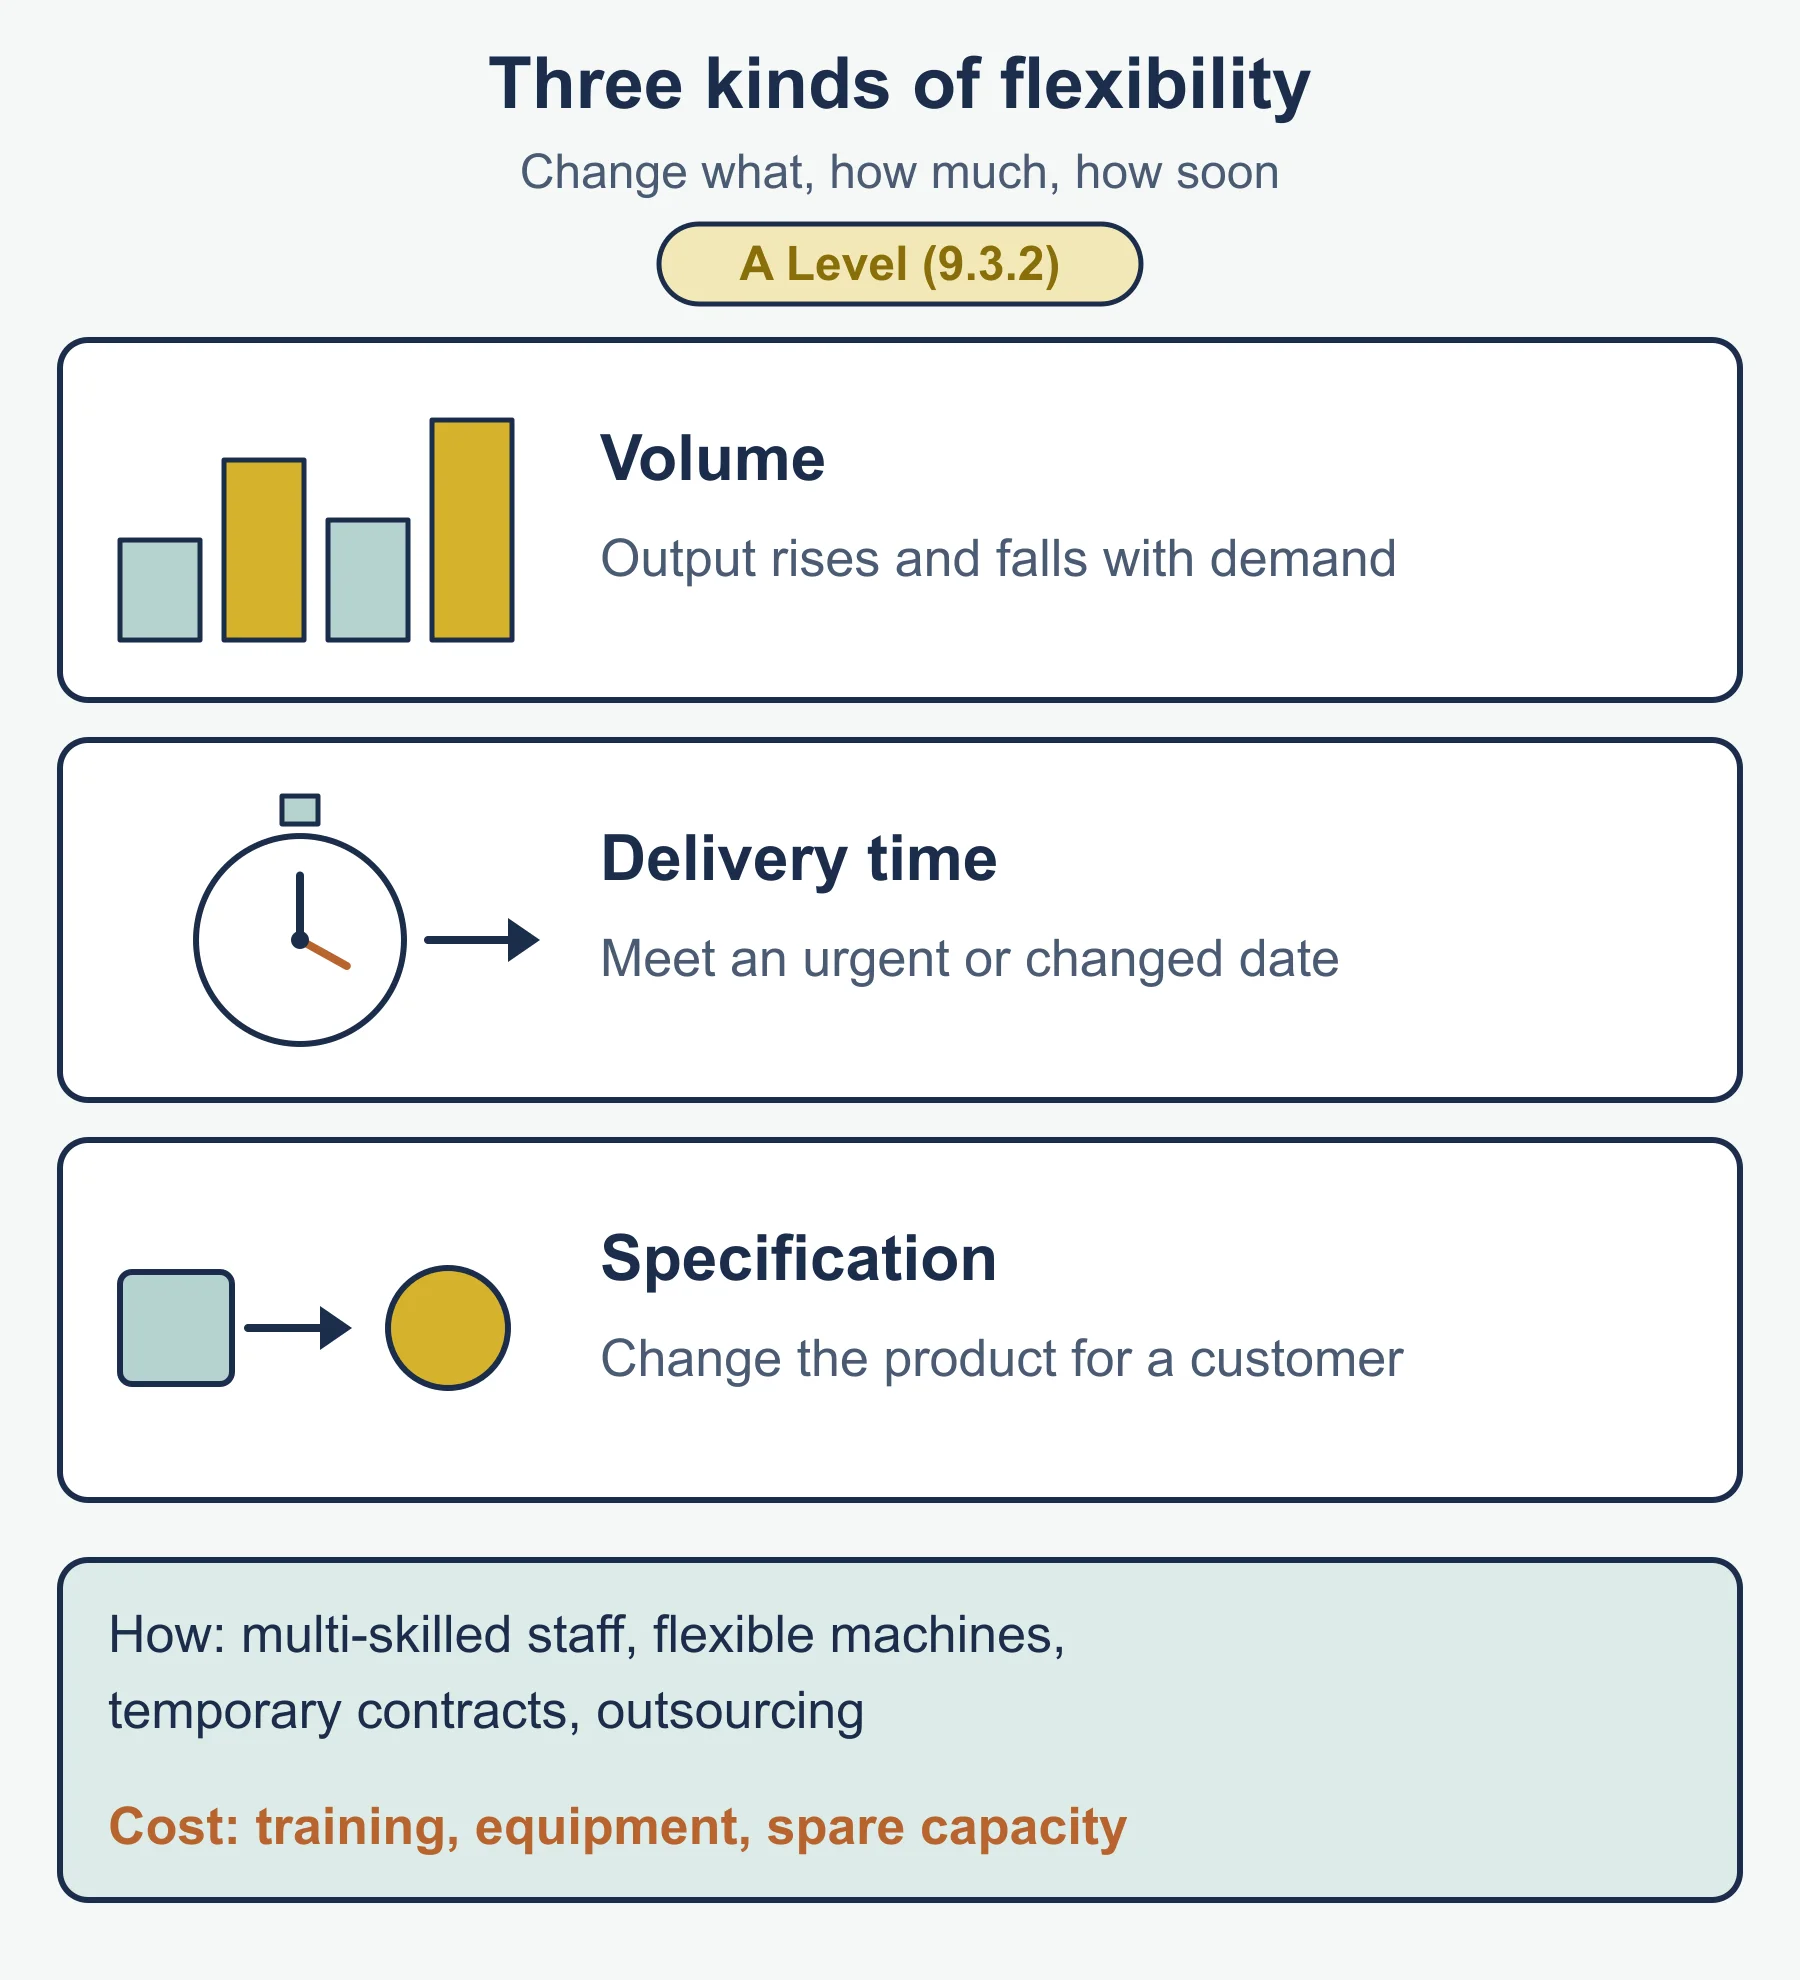
Flexibility is the ability to change what and how much is produced. The syllabus names three kinds:
- Volume: raising or lowering output as demand rises and falls.
- Delivery time: meeting urgent orders or a changed delivery date.
- Specification: changing the product to suit a customer or a trend.
Ways to gain flexibility include multi-skilled staff, flexible machines, temporary contracts and outsourcing. The cost is often higher training and equipment costs, and some spare capacity.
Process innovation means changing current processes (a new layout, new software, different work methods) or adopting new ways of producing products or delivering services (such as 3D printing, or taking orders through an app). It can cut costs, raise quality or speed up delivery, but it brings set-up cost, disruption and the risk that it does not work.
9.3.3 Enterprise resource planning (ERP)
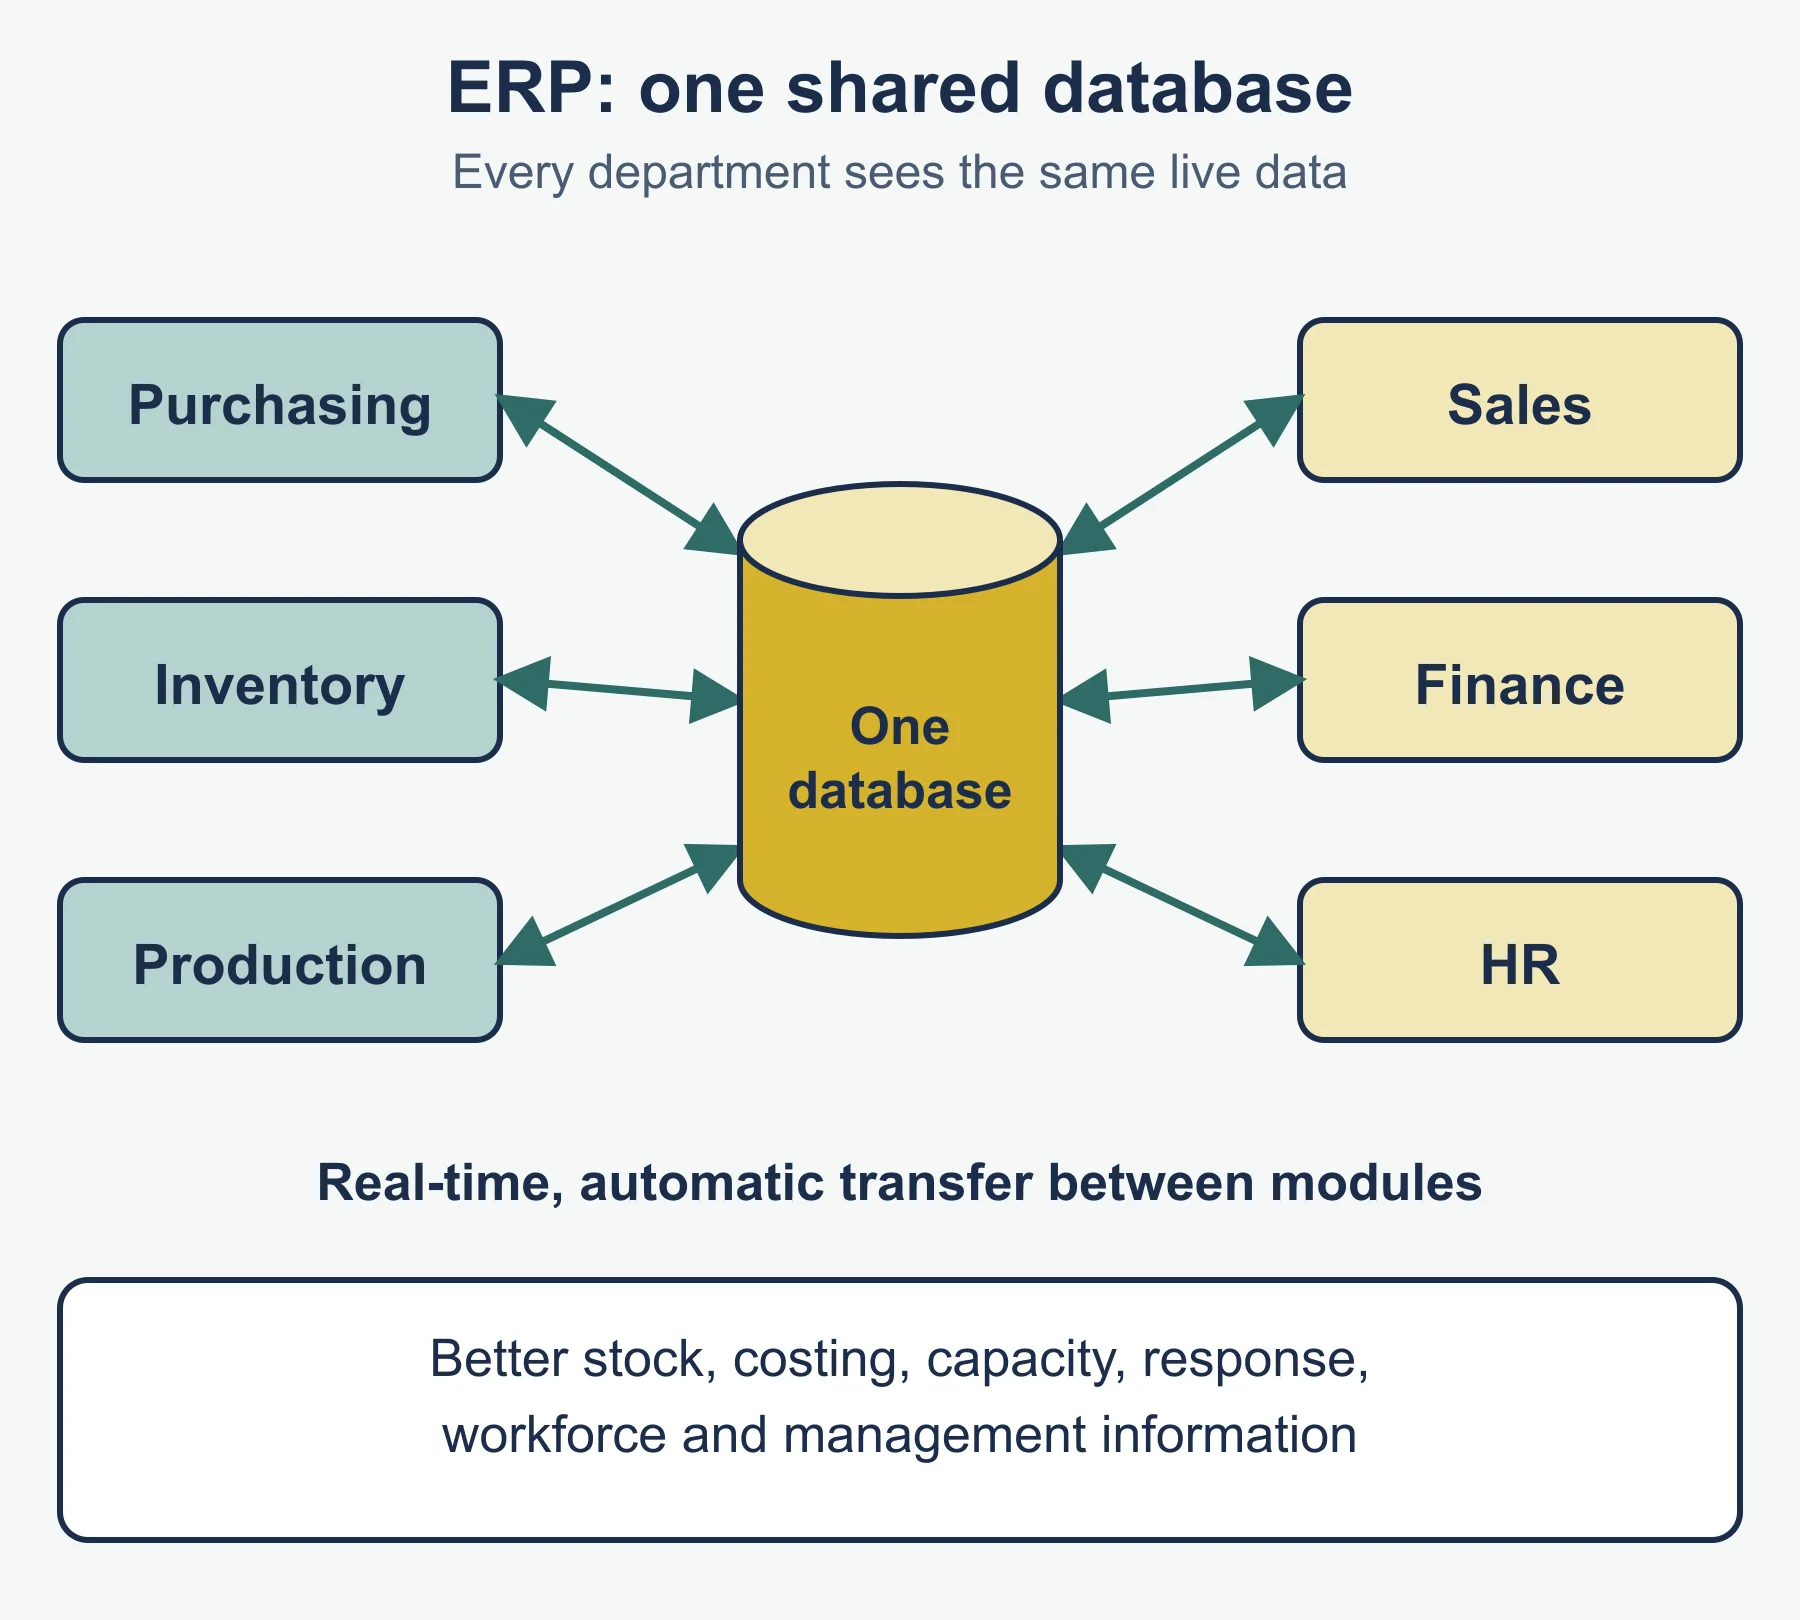
An ERP programme is an integrated software system that links departments (such as purchasing, inventory, production, sales, finance and HR) through one shared database. Main features: one database, linked modules, real-time information, automatic transfer of data between functions, and reporting tools.
How it can improve efficiency:
| Area | Effect |
|---|---|
| Inventory control | Live stock records and automatic re-ordering reduce stock-outs and over-stocking |
| Costing and pricing | Accurate, up-to-date cost data supports quicker, better-based prices |
| Capacity utilisation | Orders and capacity are visible together, so schedules can be adjusted |
| Responses to change | A change in demand or supply reaches every department at once |
| Workforce flexibility | Skills and availability data help to move staff to where they are needed |
| Management information | Reports from one source speed up and improve decisions |
Limits: high cost, disruption and training, resistance to change, and dependence on accurate data.
9.3.4 Lean production
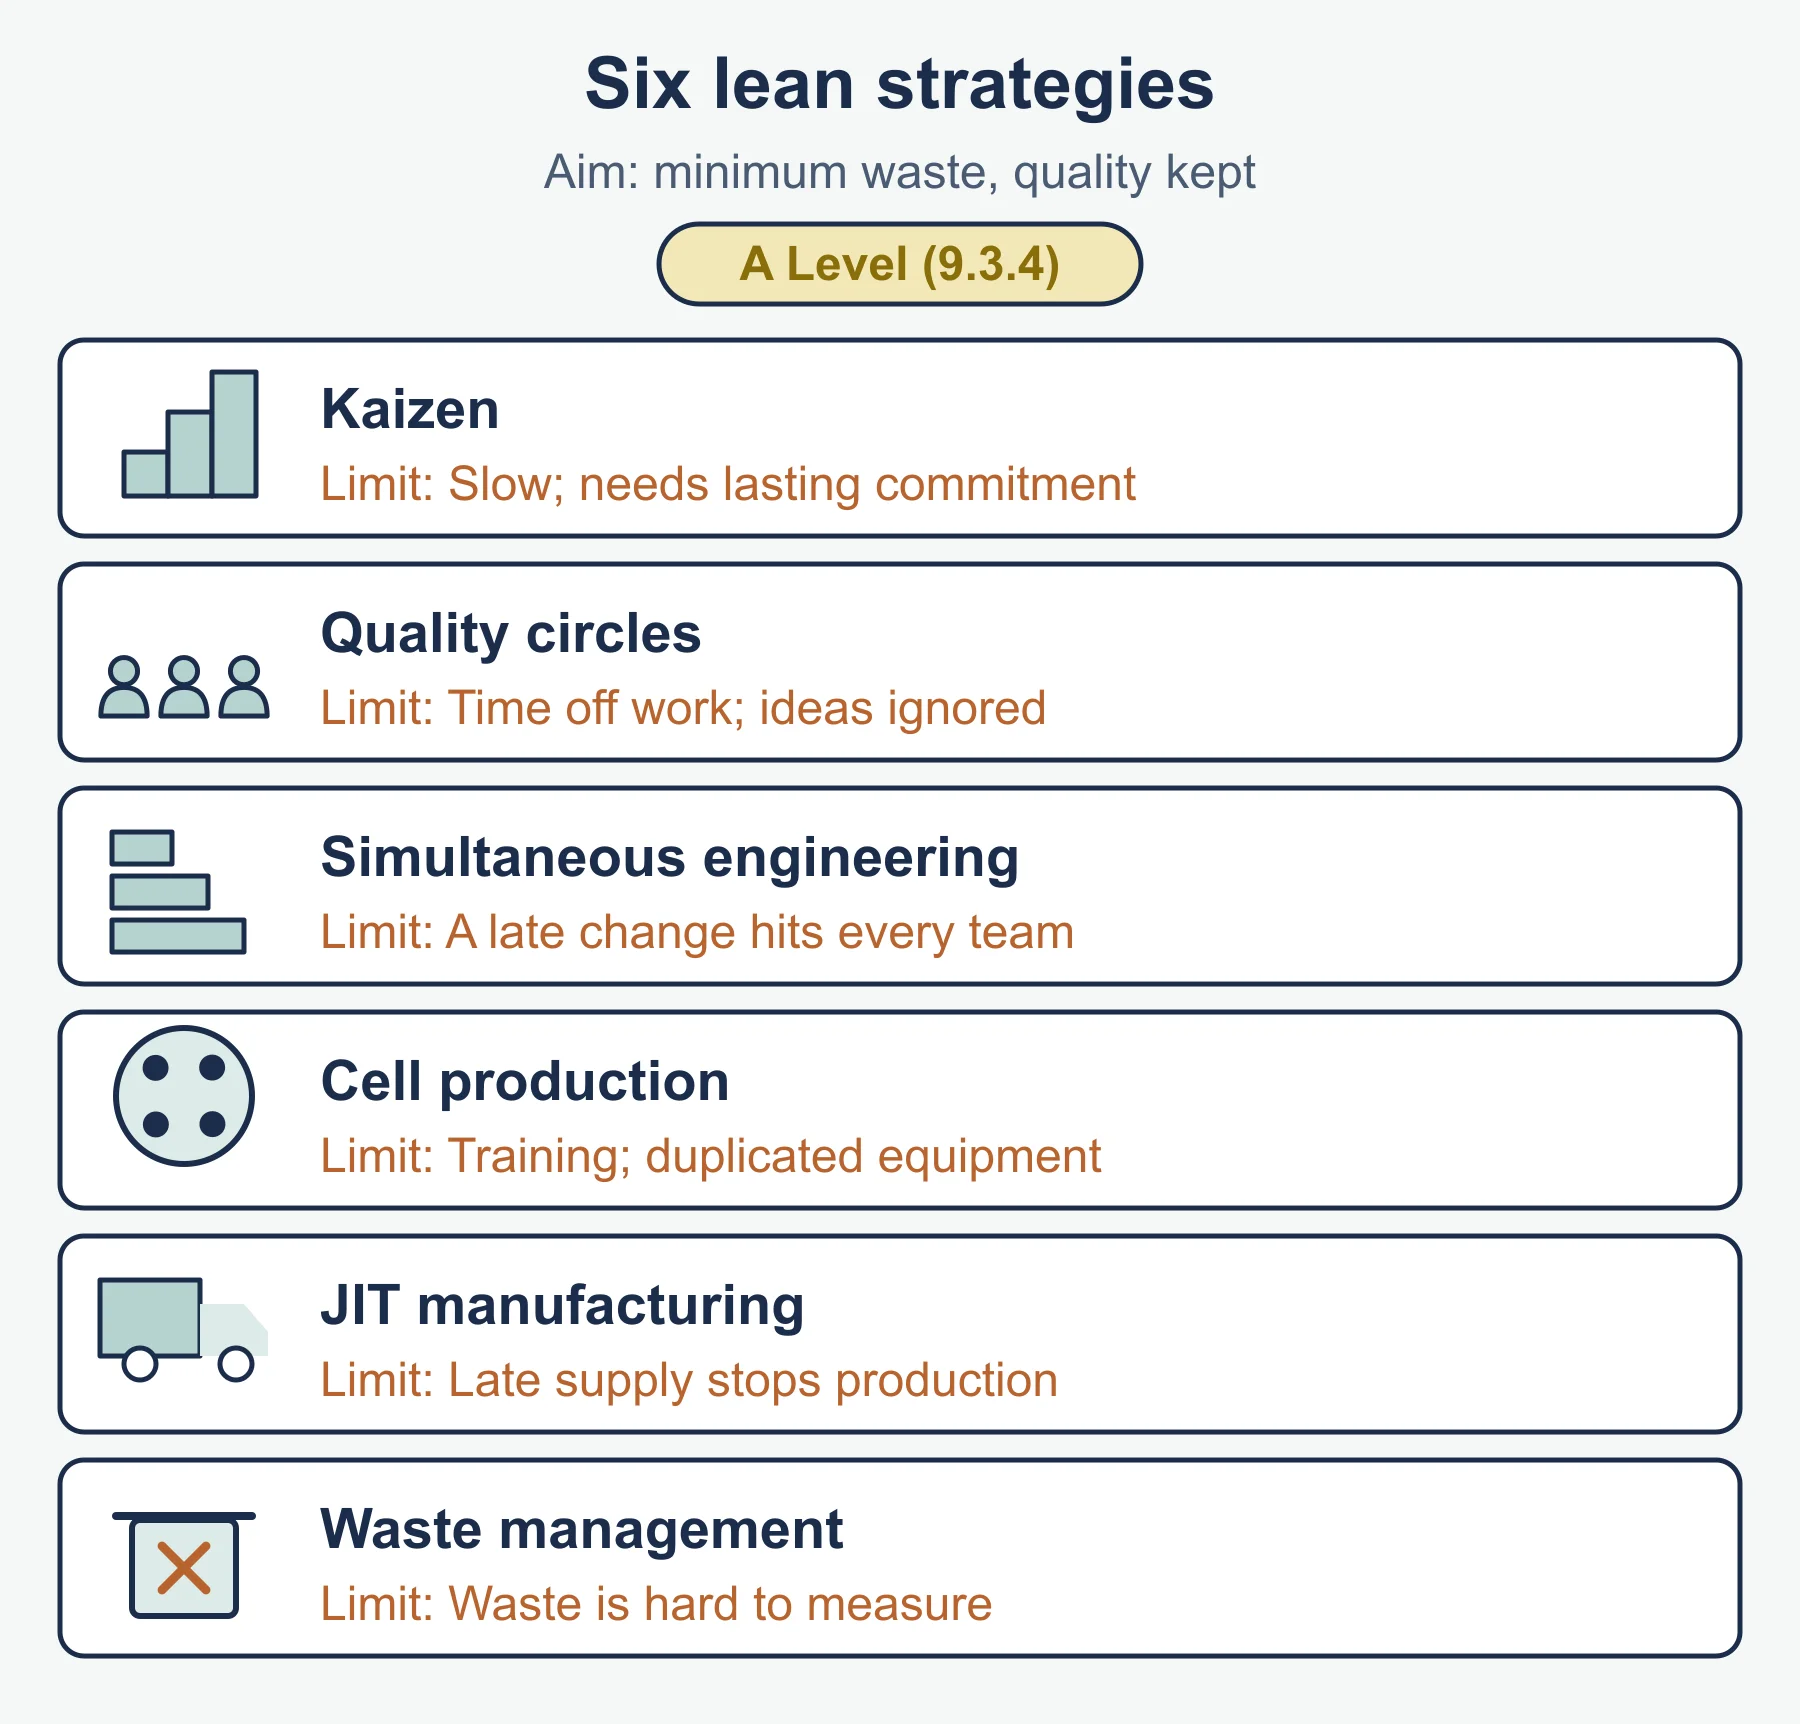
Lean production aims to produce with minimum waste (of materials, time, space, effort and inventory) while meeting customer needs and quality standards. Its purposes are lower costs, higher quality, faster response and higher efficiency.
| Strategy | What it is | Limitation |
|---|---|---|
| Kaizen | Continuous small improvements, suggested by staff | Slow; needs lasting staff commitment |
| Quality circles | Small groups meeting to solve quality problems | Time away from work; ideas may be ignored |
| Simultaneous engineering | Design, testing and production planning done at the same time by a cross-functional team | Needs close coordination; a late design change affects every team |
| Cell production | Small team makes a whole product or part of one | Training and duplicated equipment |
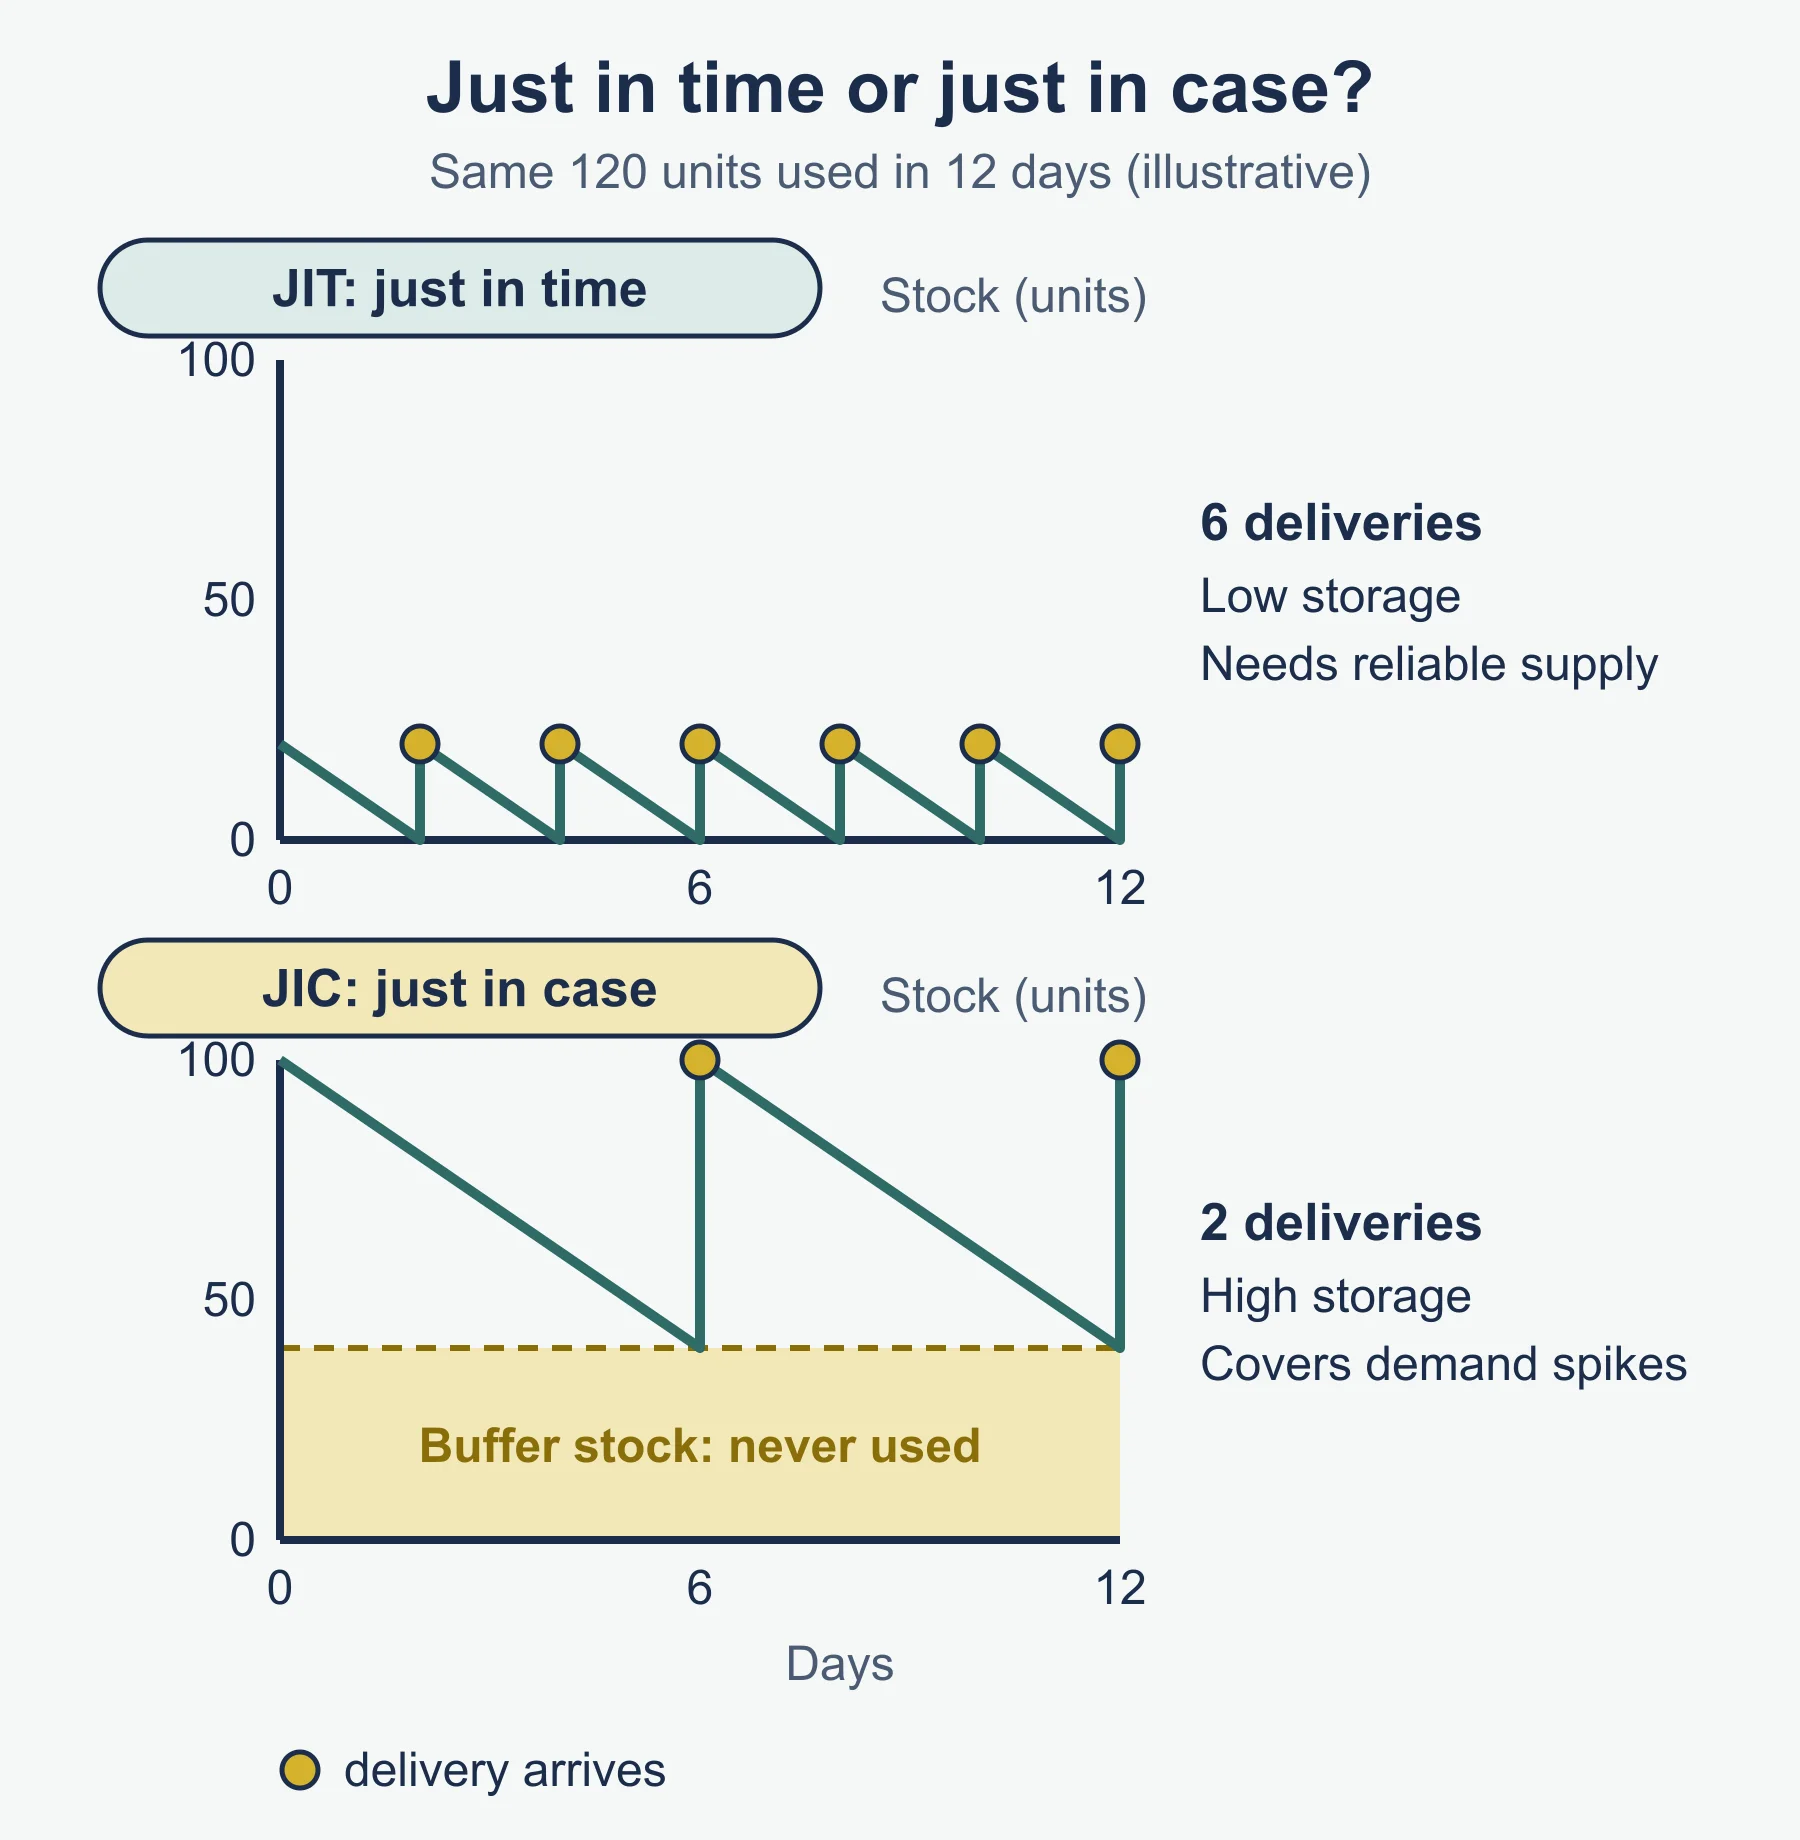
| JIT manufacturing | Materials arrive just as needed, so almost no inventory | Delay in supply stops production |
| Waste management | Finding and removing waste such as defects, waiting, excess stock | Waste can be hard to measure; takes time and effort |
Links: lean cuts inventory (JIT), builds in quality (right first time), gives employees more responsibility and skill, leaves little spare capacity (high utilisation, but little room for sudden demand), and raises efficiency.
9.3.5 Operations planning
Planning ensures that activities happen in the right order, resources are there when needed, and delays are noticed early.
A network diagram shows activities as arrows, joined at nodes (circles that mark the start or end of activities). A dummy activity (dotted arrow, zero duration) shows a dependency without using time or resources. Critical Path Analysis (CPA) uses the diagram to find the minimum project duration and the critical path, the longest route; any delay on it delays the project.
Standard calculations (the standard form; the syllabus lists the results rather than formulas):
- Earliest start time (EST) of a node: the latest, over all arrows entering it, of the EST at the start plus the duration.
- Latest finish time (LFT) of a node: work backwards from the end, taking the smallest of LFT at the end minus duration.
- Total float = LFT at the end node − EST at the start node − duration.
- Free float = EST at the end node − EST at the start node − duration.
Worked example: Elmsdale Kitchens
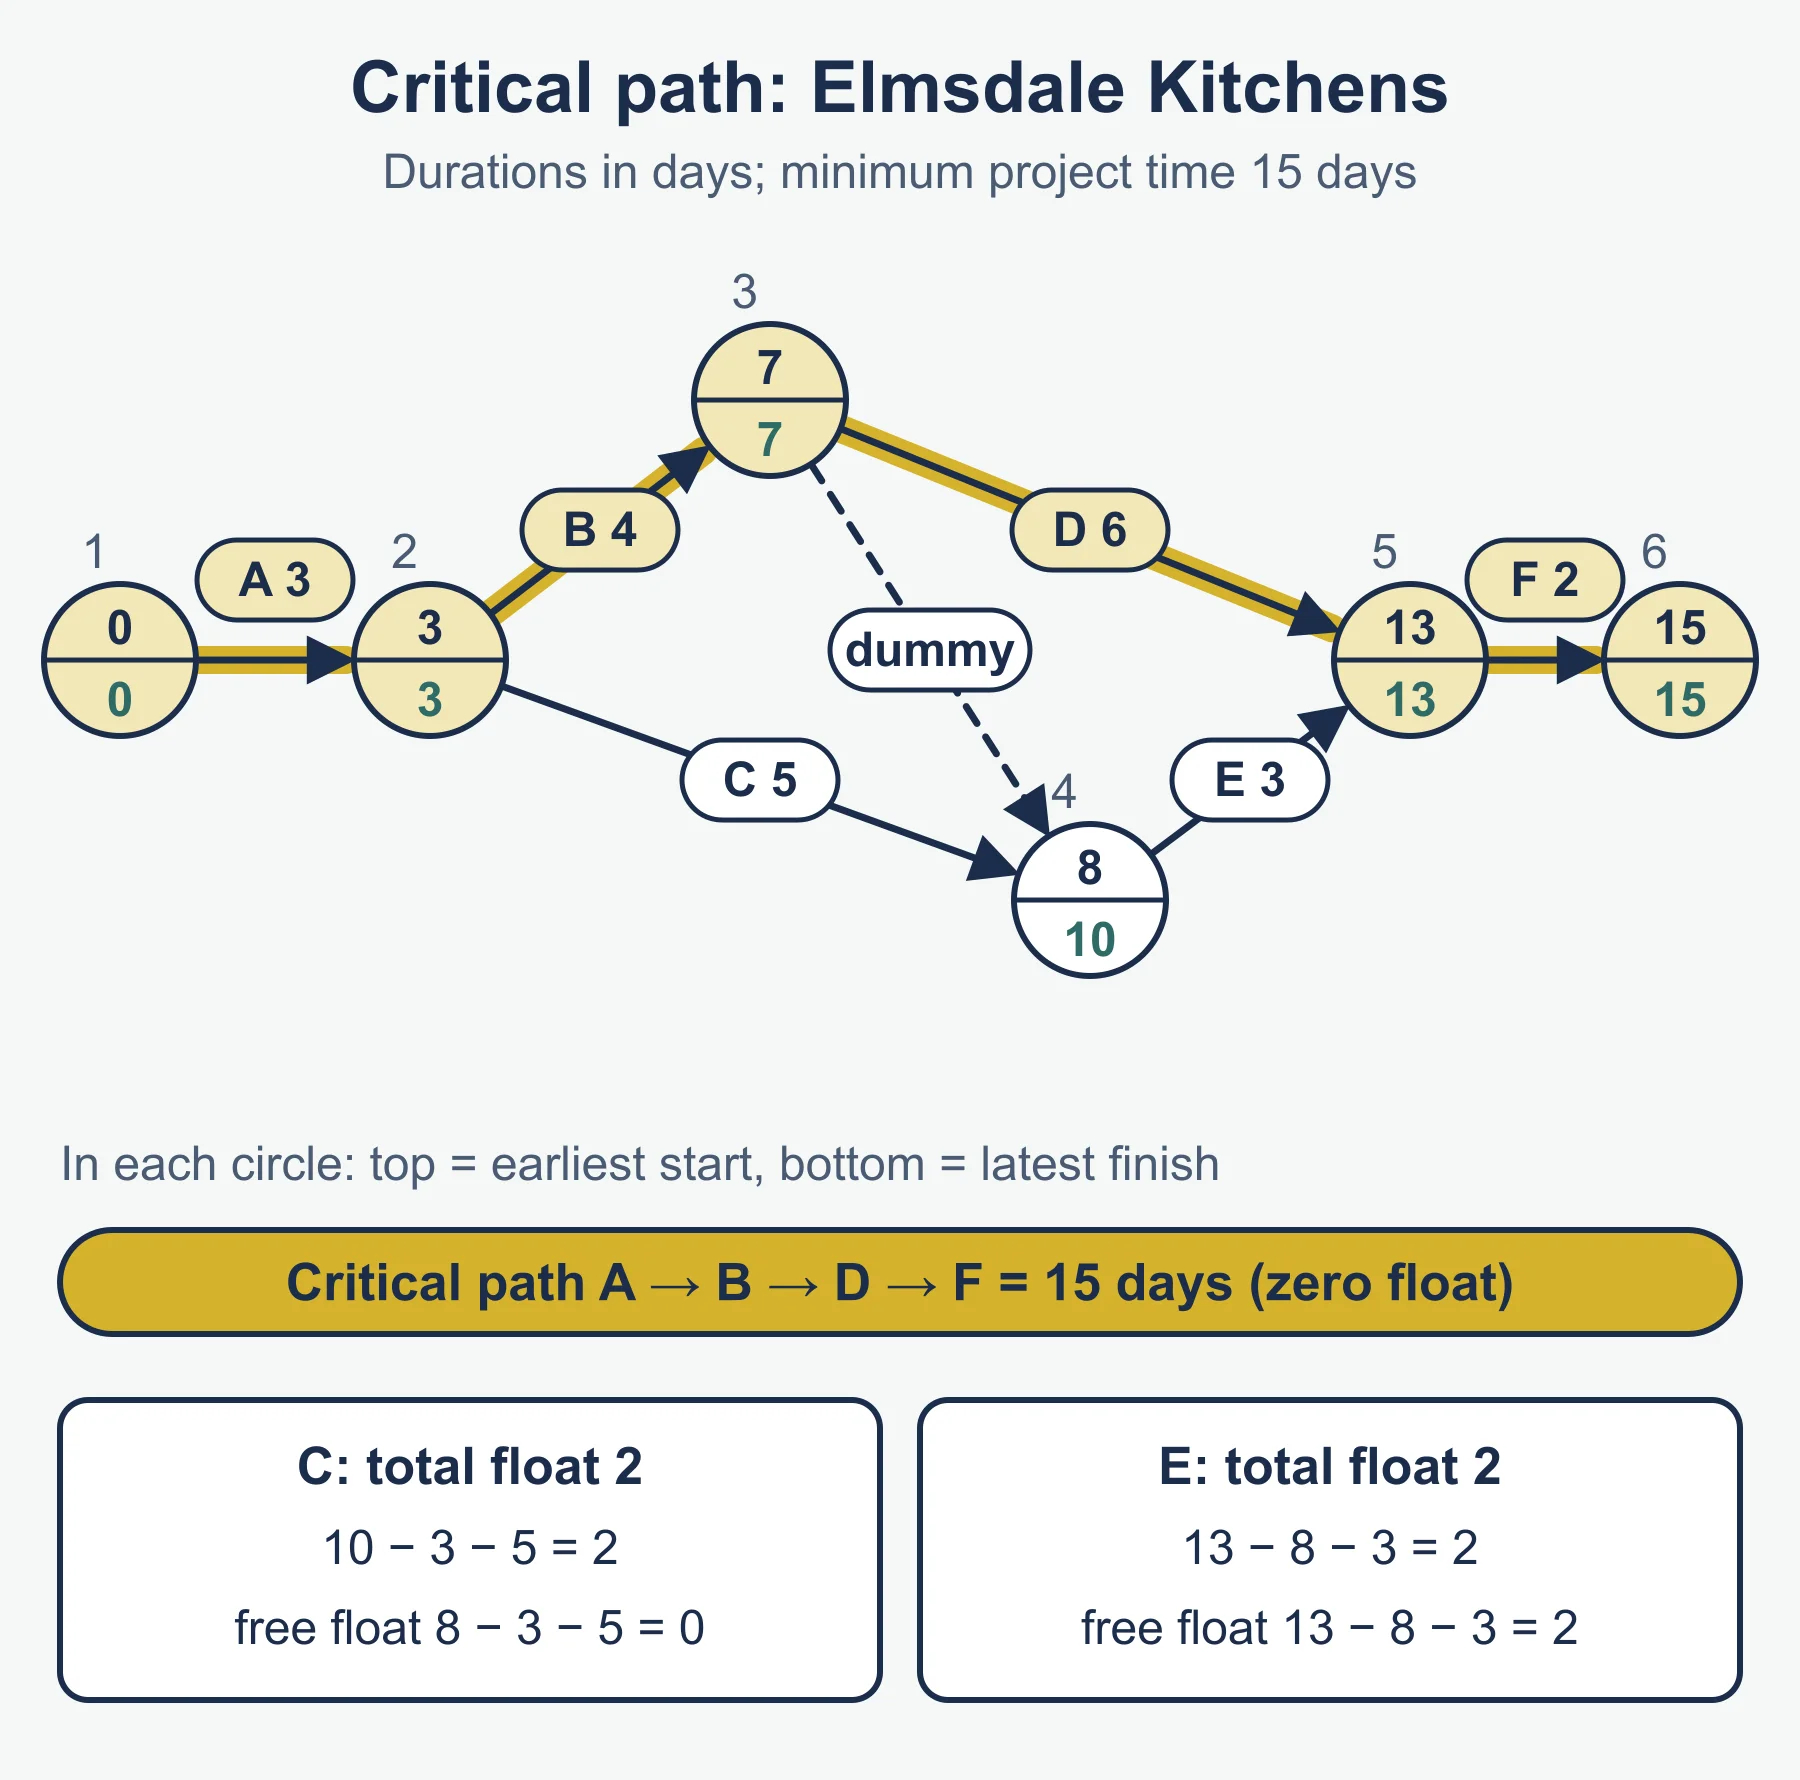
Elmsdale Kitchens is fitting out a shop. A (lease, 3 days) has no predecessor. B (design, 4 days) follows A. C (order ovens, 5 days) follows A. D (shopfit, 6 days) follows B. E (install ovens, 3 days) follows B and C. F (final checks, 2 days) follows D and E.
Node 1 starts A to node 2. B runs 2 to 3, C runs 2 to 4, a dummy runs 3 to 4 (E needs B but D does not need C), D runs 3 to 5, E runs 4 to 5, F runs 5 to 6.
| Node | 1 | 2 | 3 | 4 | 5 | 6 |
|---|---|---|---|---|---|---|
| EST | 0 | 3 | 7 | 8 | 13 | 15 |
| LFT | 0 | 3 | 7 | 10 | 13 | 15 |
Minimum duration: 15 days. Critical path: A, B, D, F (zero float). C: total float 10 − 3 − 5 = 2; free float 8 − 3 − 5 = 0. E: total float 13 − 8 − 3 = 2; free float 13 − 8 − 3 = 2.
Interpretation: C can be late by up to 2 days without delaying the project, but any delay pushes back the start of E. E can overrun by 2 days with no knock-on effect. Managers can move staff from non-critical to critical activities.
Benefits of CPA: it shows the shortest time, the critical activities and where there is slack. Limitations: durations are estimates, it ignores cost and resource limits unless added, large networks are complex, and it needs updating.
Common errors
- Saying TQM needs more inspectors; it moves responsibility to workers.
- Listing lean strategies without limitations.
- Reading the critical path as the shortest route, or mixing up total and free float.
Frequently asked questions
What is Total Quality Management? TQM is a whole-business approach in which every employee in every department takes responsibility for quality, aiming for right first time. Fewer inspectors are needed, but training is costly and the culture must change.
What is benchmarking? Benchmarking means comparing a business’s performance, processes or products with the best, such as a rival or a leader in another industry, to find gaps and set realistic targets.
What is an ERP programme? Enterprise resource planning is integrated software with one shared database linking departments such as purchasing, production, sales and finance. It can improve inventory control, costing, capacity utilisation and management information.
Is the critical path the shortest route through a network? No. The critical path is the longest route, made up of activities with zero total float, and it sets the minimum project duration.
Official syllabus
Cambridge International AS & A Level Business 9609 syllabus for examination in 2026, 2027 and 2028, published by Cambridge University Press & Assessment (Cambridge International Education): sections 9.2 and 9.3.
Get free revision emails (optional)
Occasional emails with practice questions, worked explanations and links to free resources for the qualification and subjects you choose. No spam, and you can unsubscribe from any email. The free tools on this site never need an email.
Related resources
-
Practice questions
A Level Business: Quality management and Operations strategy (Cambridge 9609) – Practice Questions
Original practice questions with worked answers on quality, benchmarking, ERP, lean production and CPA for Cambridge A Level Business 9609.
Business · Cambridge · A Level
Try questions -
Revision notes
A Level Business: Quality management and Operations strategy (Cambridge 9609) – Revision Notes
Condensed revision notes for 9.2 Quality management and 9.3 Operations strategy in Cambridge A Level Business 9609, with a self-test and lost marks.
Business · Cambridge · A Level
Revise topic -
Study guides
A Level Business: The nature of operations (Cambridge 9609)
Study guide to the nature of operations for Cambridge AS & A Level Business: added value, productivity, sustainability and operations methods.
Business · Cambridge · AS Level
Read guide
Related articles
-
teaching
A Level tuition in Dubai: Cambridge or Pearson Edexcel International A Level?
Schools in Dubai and Abu Dhabi teach either Cambridge International AS & A Level or Pearson Edexcel International A Level. How the two are structured, why it matters for tuition, and how online classes from Lahore work.
9 October 2026
-
curriculum guides
Choosing subjects at IGCSE and A Level
How subject choices at 14 and 16 affect university options later, and how to keep pathways open without overloading a timetable.
28 July 2026
Studying this with a teacher
Working through Business A LEVEL?
This page is free and stays free. If you would rather be taught it, Marlbridge runs Business classes one-to-one and in small groups of up to 15, online in your own time zone. The first trial class is free. WhatsApp replies within an hour (8am–11pm Pakistan time, every day); email the same day.
Cambridge Business teachers at Marlbridge

