
Study Guides
Edexcel GCSE Business: Business calculations (1BS0)
Study guide to gross profit, net profit, profit margins and average rate of return for Pearson Edexcel GCSE Business 1BS0, Theme 2 topic 2.4.1.
- Subject
- Business
- Level
- GCSE
- Topic
- Making financial decisions
- Author
- Marlbridge Academic Team
- Updated
- Reviewed by
- Asif Iqbal (what this means)
Aligned to Pearson Edexcel GCSE Business (1BS0), Issue 2, July 2022. Official specification .
Syllabus page (what it covers and how it is assessed): Pearson Edexcel GCSE Business.
Syllabus points this page covers
1BS0
- 2.4 Making financial decisions (whole topic)
- 2.4.1 Business calculations
Found an error? Report a correction.
Want a teacher for this? Marlbridge teaches Business online. Request a free trial class.
This guide teaches content item 2.4.1, Business calculations, from Topic 2.4 Making financial decisions in Theme 2, Building a business, of the Pearson Edexcel Level 1/Level 2 GCSE (9-1) in Business (1BS0) specification, Issue 2, July 2022. The specification describes Topic 2.4 as exploring the tools a business has to support financial decision making, including ratio analysis. The qualification has two written papers: Theme 1, Investigating small business (1BS0/01), and Theme 2, Building a business (1BS0/02). Each lasts 1 hour 45 minutes, carries 90 marks and is 50% of the qualification. Each has three sections (A 35 marks, B 30 marks, C 25 marks) of calculations, multiple-choice, short-answer and extended-writing questions, and Sections B and C use business contexts given in the paper. Calculators may be used. The formulae are listed in the specification (Appendix 3) and are not provided in the examinations. Every business below is invented.
Course links: Edexcel GCSE Business hub, the printable checklist and the free 10-minute diagnostics. Companion pages: the revision notes and the practice questions. Revenue, costs and profit are introduced in the Theme 1 guide on revenue, costs and profit, and margins return in the guide on legislation and external influences.
What 2.4.1 asks you to know
| Content point | What you must be able to do | Where in this guide |
|---|---|---|
| Gross profit | Explain the concept and calculate it | Part 1 |
| Net profit | Explain the concept and calculate it | Part 2 |
| Gross profit margin | Calculate and interpret | Part 3 |
| Net profit margin | Calculate and interpret | Part 3 and Part 4 |
| Average rate of return | Calculate and interpret | Part 5 and Part 6 |
Appendix 2 of the specification lists gross profit margin, net profit margin and average rate of return among the calculations, and says that profitability ratios and average rate of return are among the data you must interpret. Questions on these skills are always set in a business context.
Part 1: gross profit
Gross profit tells you how much money is left from sales revenue after paying for the goods or services that were sold. Appendix 3 gives the formula.
- Gross profit = sales revenue − cost of sales
The specification does not define cost of sales, so this is the standard meaning: the direct cost of the items sold, such as the price paid for stock bought for resale or the materials used in making the product. Sales revenue is price × quantity, summed over everything sold in the period.
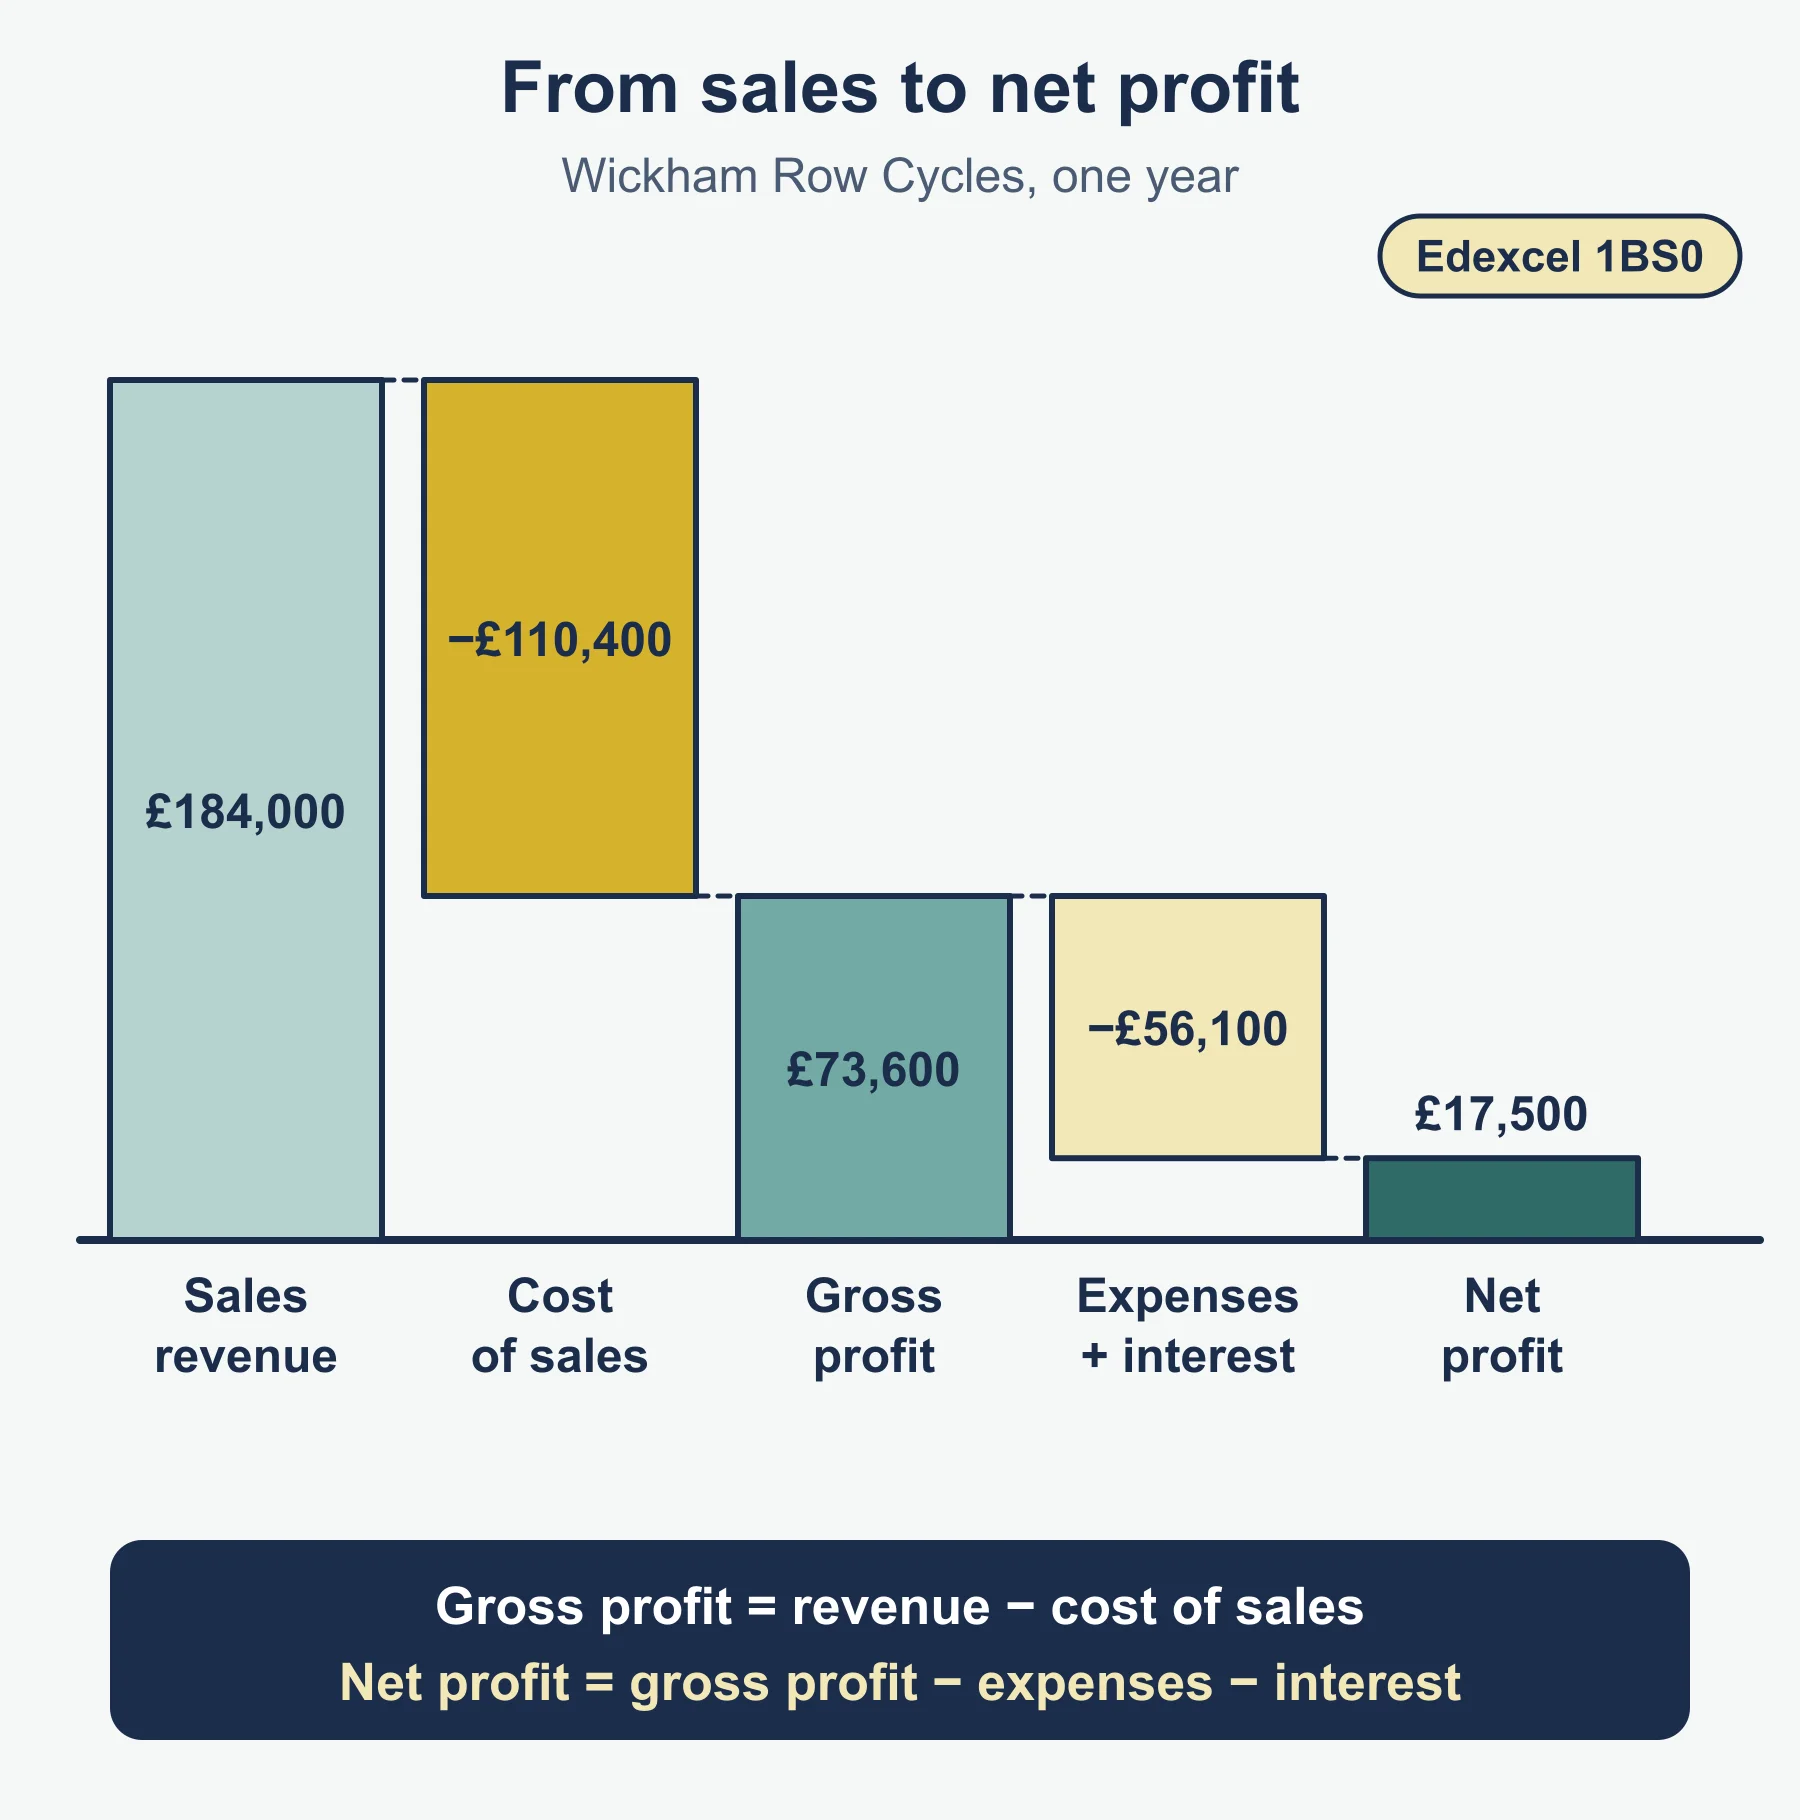
Worked example: Wickham Row Cycles. This bike shop has sales revenue of £184,000 in a year. The cost of sales, mainly the bikes and parts it bought to sell, is £110,400.
Gross profit = £184,000 − £110,400 = £73,600
This is not the money the owner can keep. The shop still has to pay rent, wages, insurance and interest from this figure.
Part 2: net profit
Net profit is what remains after the other costs of running the business have been paid. Appendix 3 gives the formula.
- Net profit = gross profit − other operating expenses and interest
Other operating expenses are the running costs that are not part of cost of sales, such as rent, advertising, utility bills and the wages of shop staff (a standard grouping, not specification wording). Interest is the cost of borrowing. The formula takes it off separately, so a business with a large loan can have a healthy gross profit and a thin net profit.
Wickham Row Cycles, continued. Other operating expenses are £52,900 and interest is £3,200.
- Costs to take off = £52,900 + £3,200 = £56,100
- Net profit = £73,600 − £56,100 = £17,500
If the answer to a net profit calculation is negative, the business has made a loss for the period.
Part 3: gross and net profit margin
A profit figure alone does not show how well a business turns sales into profit. A margin states profit as a percentage of sales revenue, so businesses of different sizes, or the same business in different years, can be compared fairly. Appendix 3 gives both formulae.
- Gross profit margin (%) = (gross profit ÷ sales revenue) × 100
- Net profit margin (%) = (net profit ÷ sales revenue) × 100
Both use sales revenue on the bottom line. A common slip is to divide net profit by gross profit.
Wickham Row Cycles, continued.
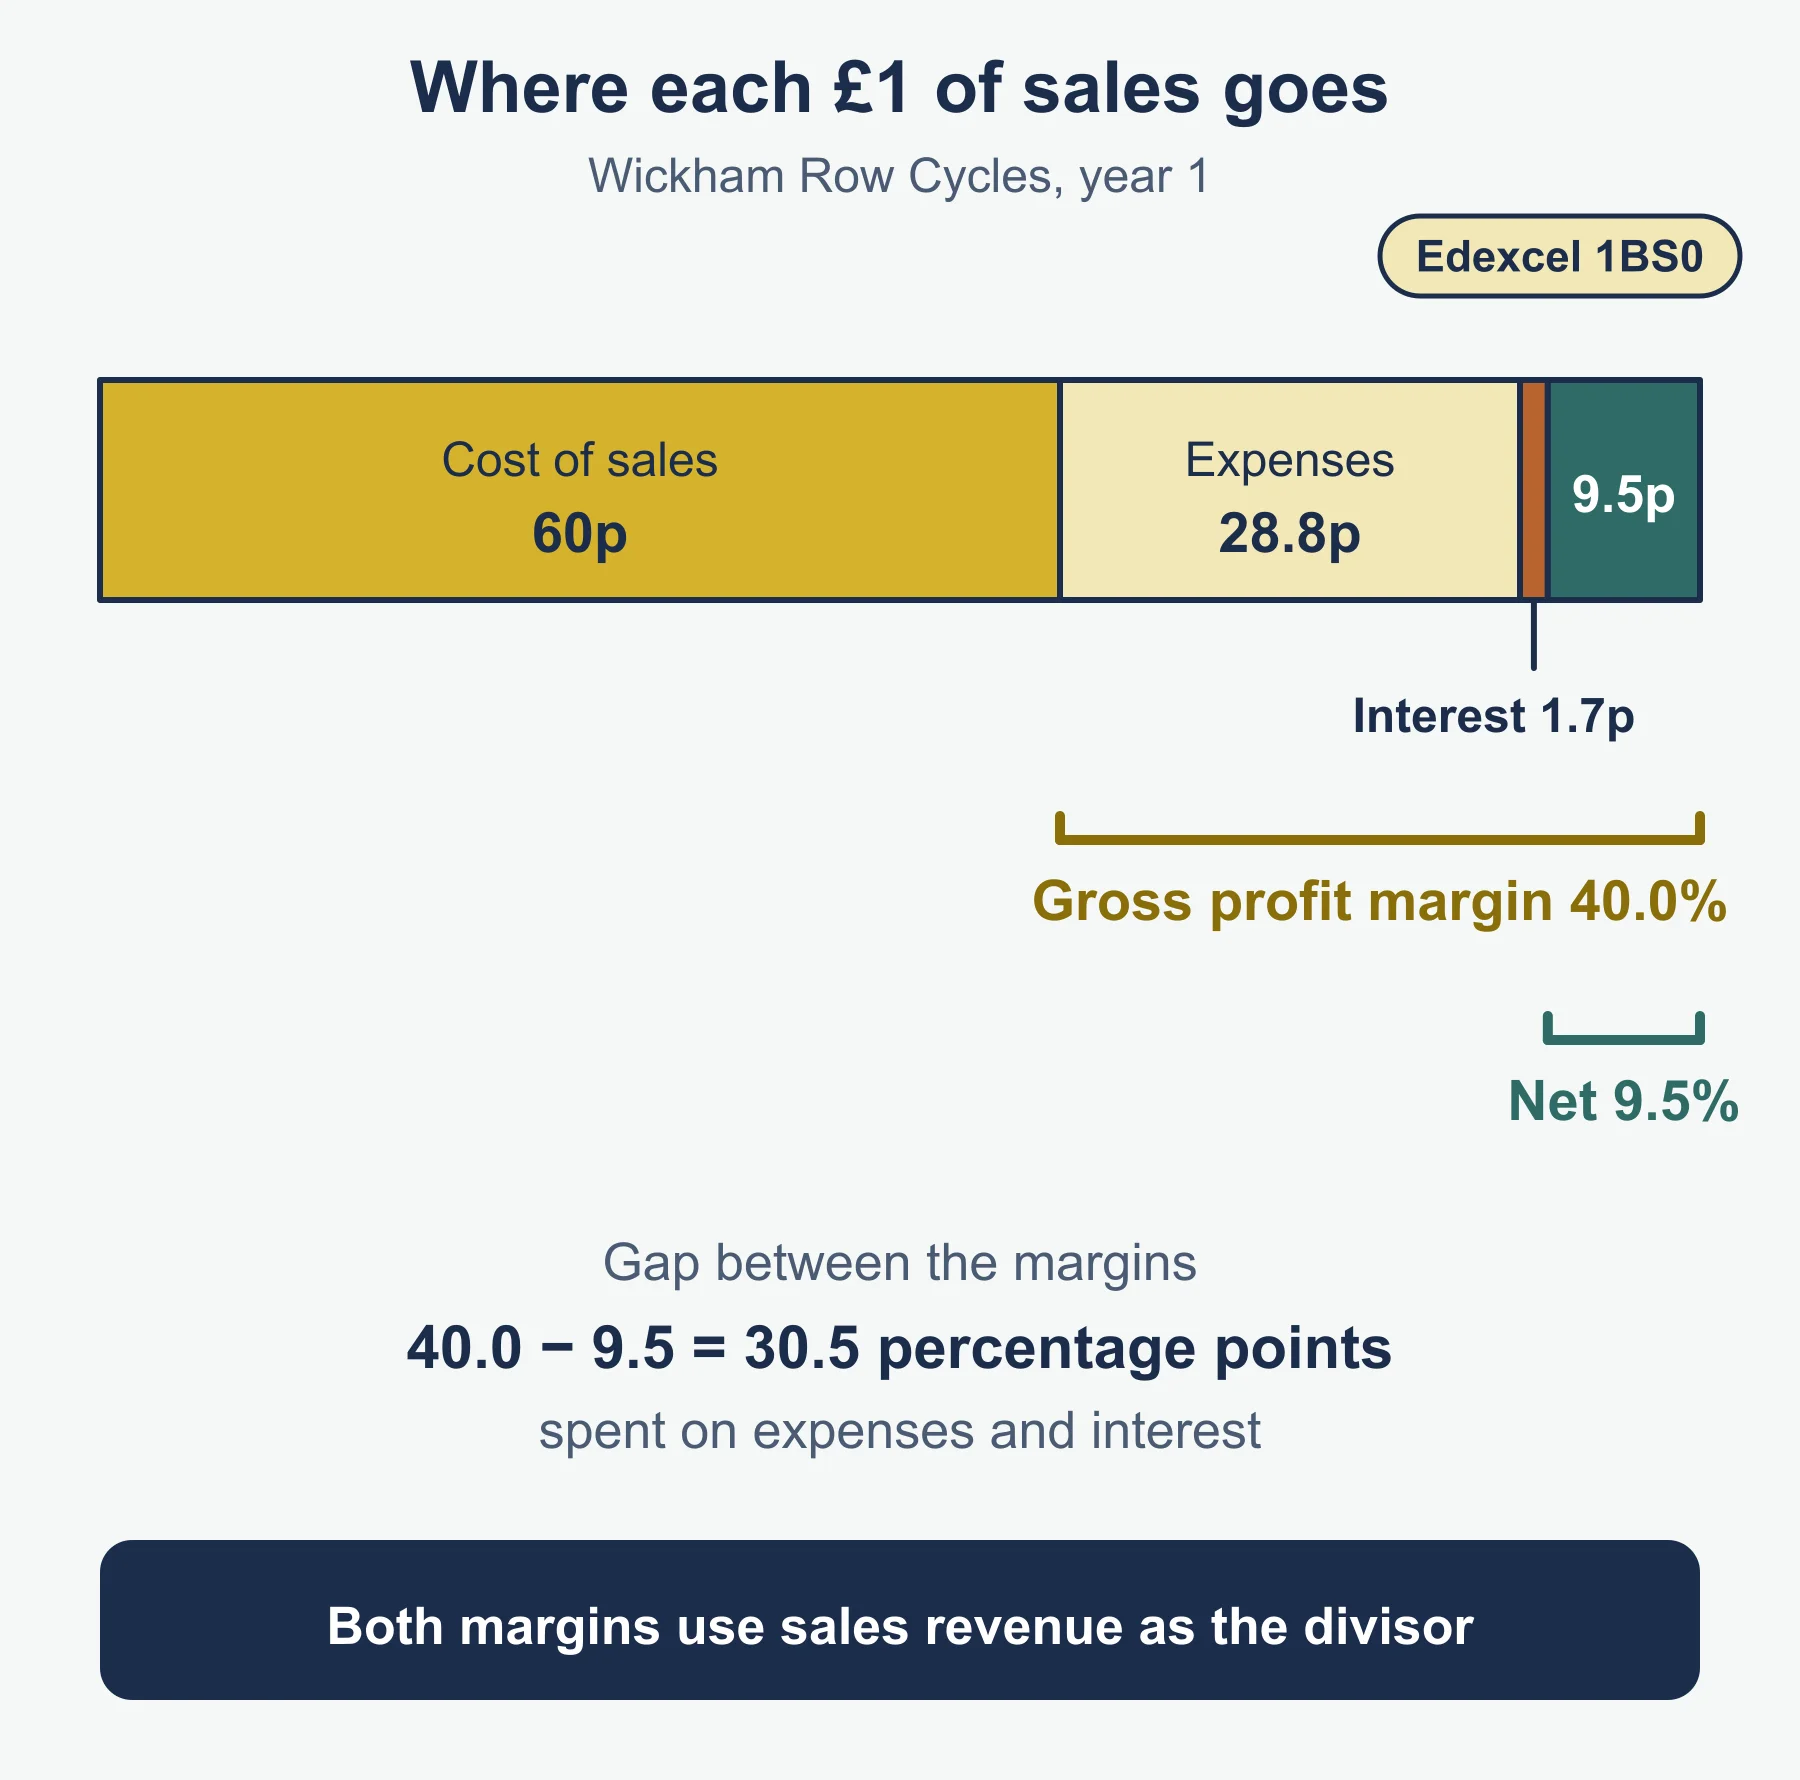
- Gross profit margin = £73,600 ÷ £184,000 × 100 = 40.0%
- Net profit margin = £17,500 ÷ £184,000 × 100 = 9.51%, which is 9.5% to one decimal place
The first result means the shop keeps 40p of every £1 of sales after paying for the goods sold. The second means it keeps about 9.5p of every £1 after all costs and interest. Give your answer to the accuracy the question asks for, and show the formula and substitution because workings should be given with the command word Calculate.
Why the gap between the two margins matters
The gross margin is normally larger than the net margin, because net profit is gross profit minus further costs. The gap shows how much of each £1 of sales goes on other operating expenses and interest. Here the gap is 40.0 − 9.5 = 30.5 percentage points.
Part 4: interpreting margins
Calculating a margin is only half the task. Interpretation means saying what the figure tells the owner and what could have caused a change. Compare the margin with something: the same business last year, a competitor, or the owner’s target.
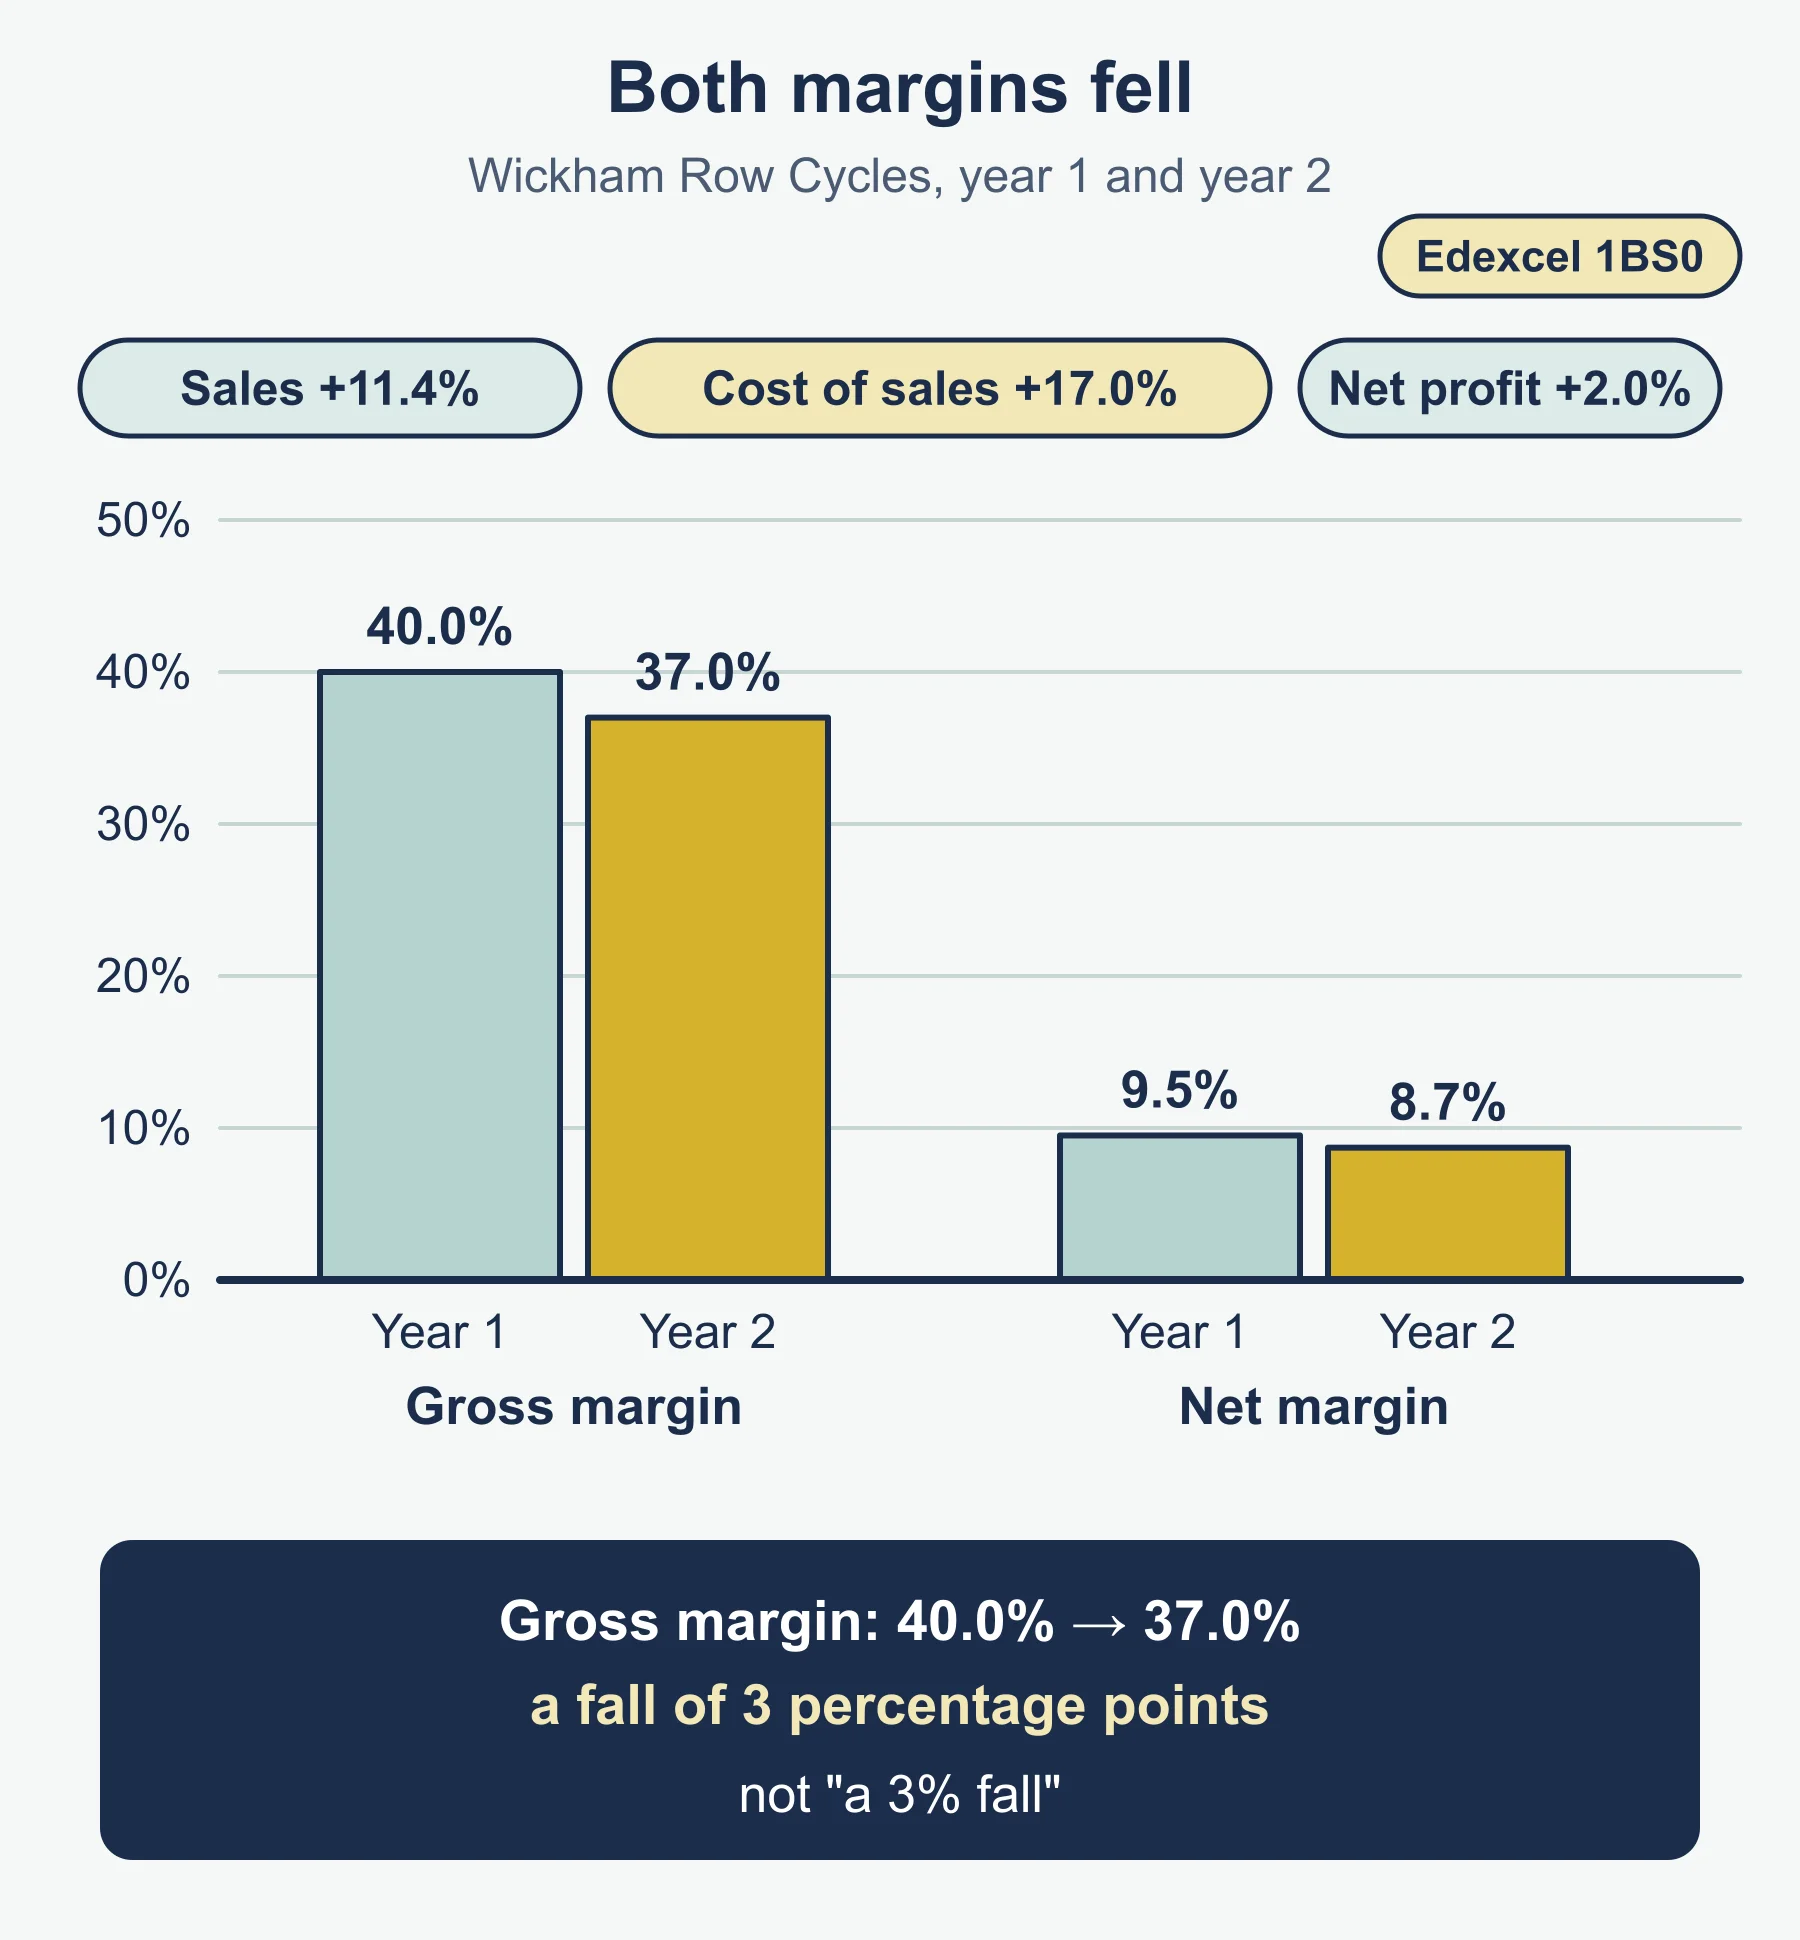
Wickham Row Cycles, a second year. Sales revenue rises to £205,000. Cost of sales is £129,150. Other operating expenses are £56,800 and interest is £1,200.
| Year 1 | Year 2 | |
|---|---|---|
| Sales revenue | £184,000 | £205,000 |
| Cost of sales | £110,400 | £129,150 |
| Gross profit | £73,600 | £75,850 |
| Gross profit margin | 40.0% | 37.0% |
| Net profit | £17,500 | £17,850 |
| Net profit margin | 9.5% | 8.7% |
Sales revenue rose by 11.4%, but net profit rose by only 2.0%. Both margins fell. The gross profit margin fell by 3 percentage points, so the shop kept less of each £1 after paying for what it sold. A percentage point is the difference between two percentages, not a percentage change.
Reading a pair of margins:
- If the gross margin falls, look at price and cost of sales. Possible causes are discounting, a supplier raising prices, or a shift in what is sold towards lower-margin items.
- If the gross margin holds but the net margin falls, look at other operating expenses and interest. Possible causes are higher rent, more advertising or a larger loan.
- If both rise, the owner may have raised prices or controlled costs. Check that sales revenue did not fall at the same time.
For the shop in this example, the cost of sales rose by 17.0% while sales revenue rose by 11.4%. That points to buying costs, or to discounts used to win sales, as the main cause. This is an inference from the figures and should be presented as one likely reason, not a certainty.
What a business can do to improve a margin
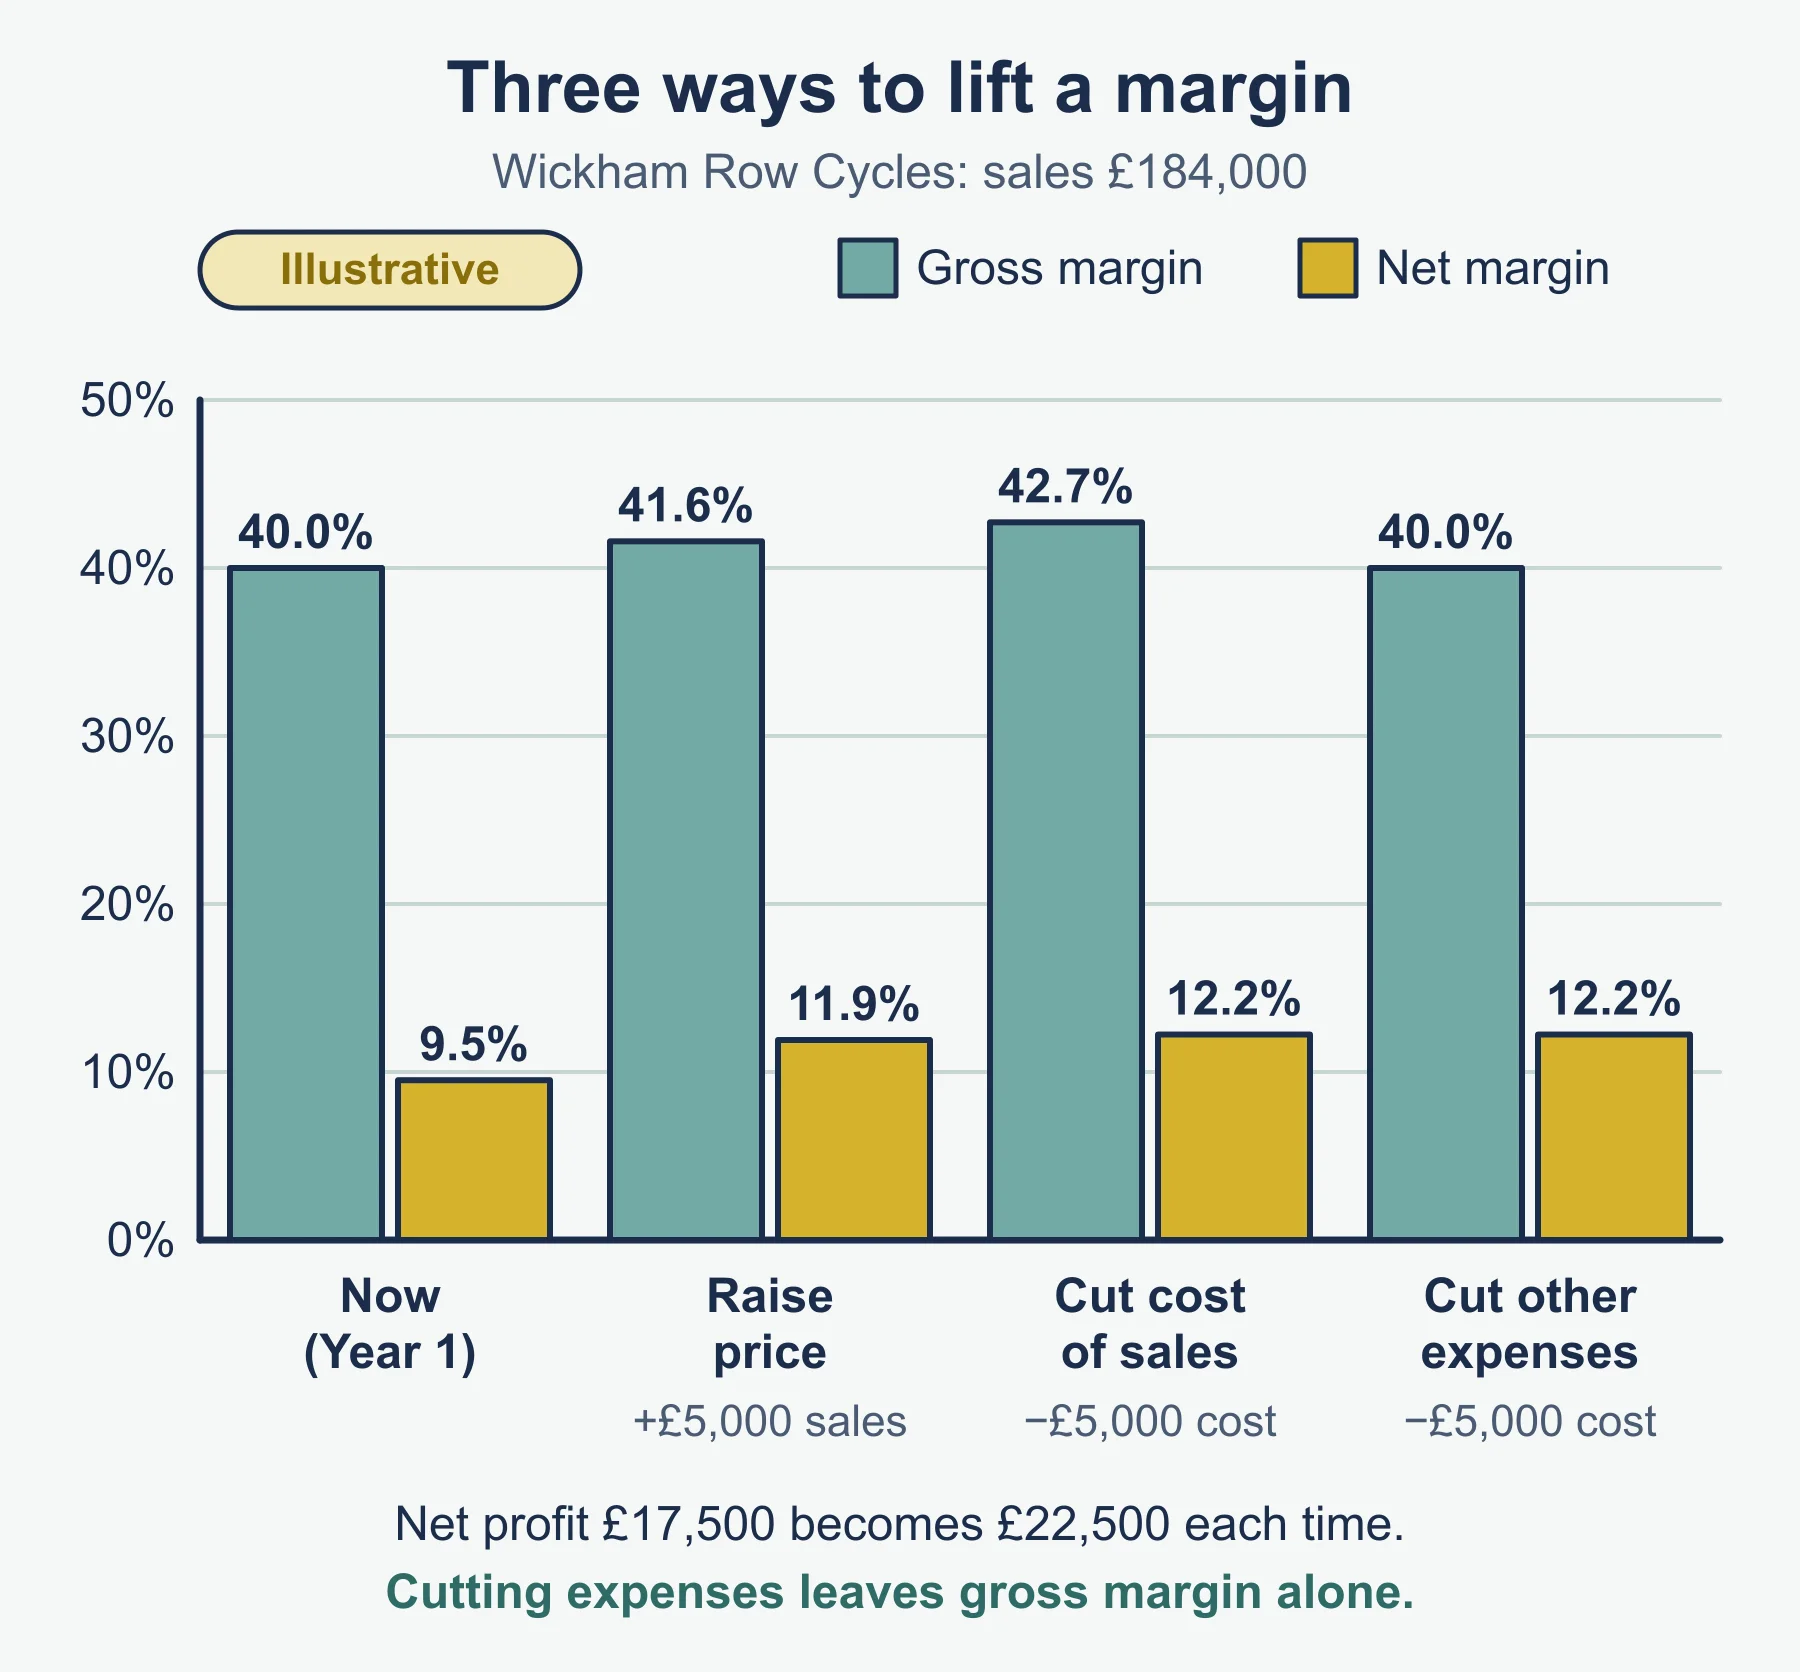
- Raise prices, if customers will still buy. This lifts both margins.
- Lower cost of sales, for example by negotiating with suppliers. This lifts both margins.
- Lower other operating expenses or interest. This lifts only the net margin.
Each has a risk. A price rise can lose customers, and a cheaper supplier can lower quality. Good answers apply the point to the business in the question.
Part 5: average rate of return
A business may spend money on an investment, such as a new machine, a van or a shop refit, and wants to know what it earns each year compared with its cost. Appendix 3 gives the formula.
- Average rate of return (%) = (average annual profit ÷ cost of investment) × 100
- Average annual profit = total profit ÷ number of years
Total profit here means the profit the investment is expected to produce over its life, with each year’s profit added together.
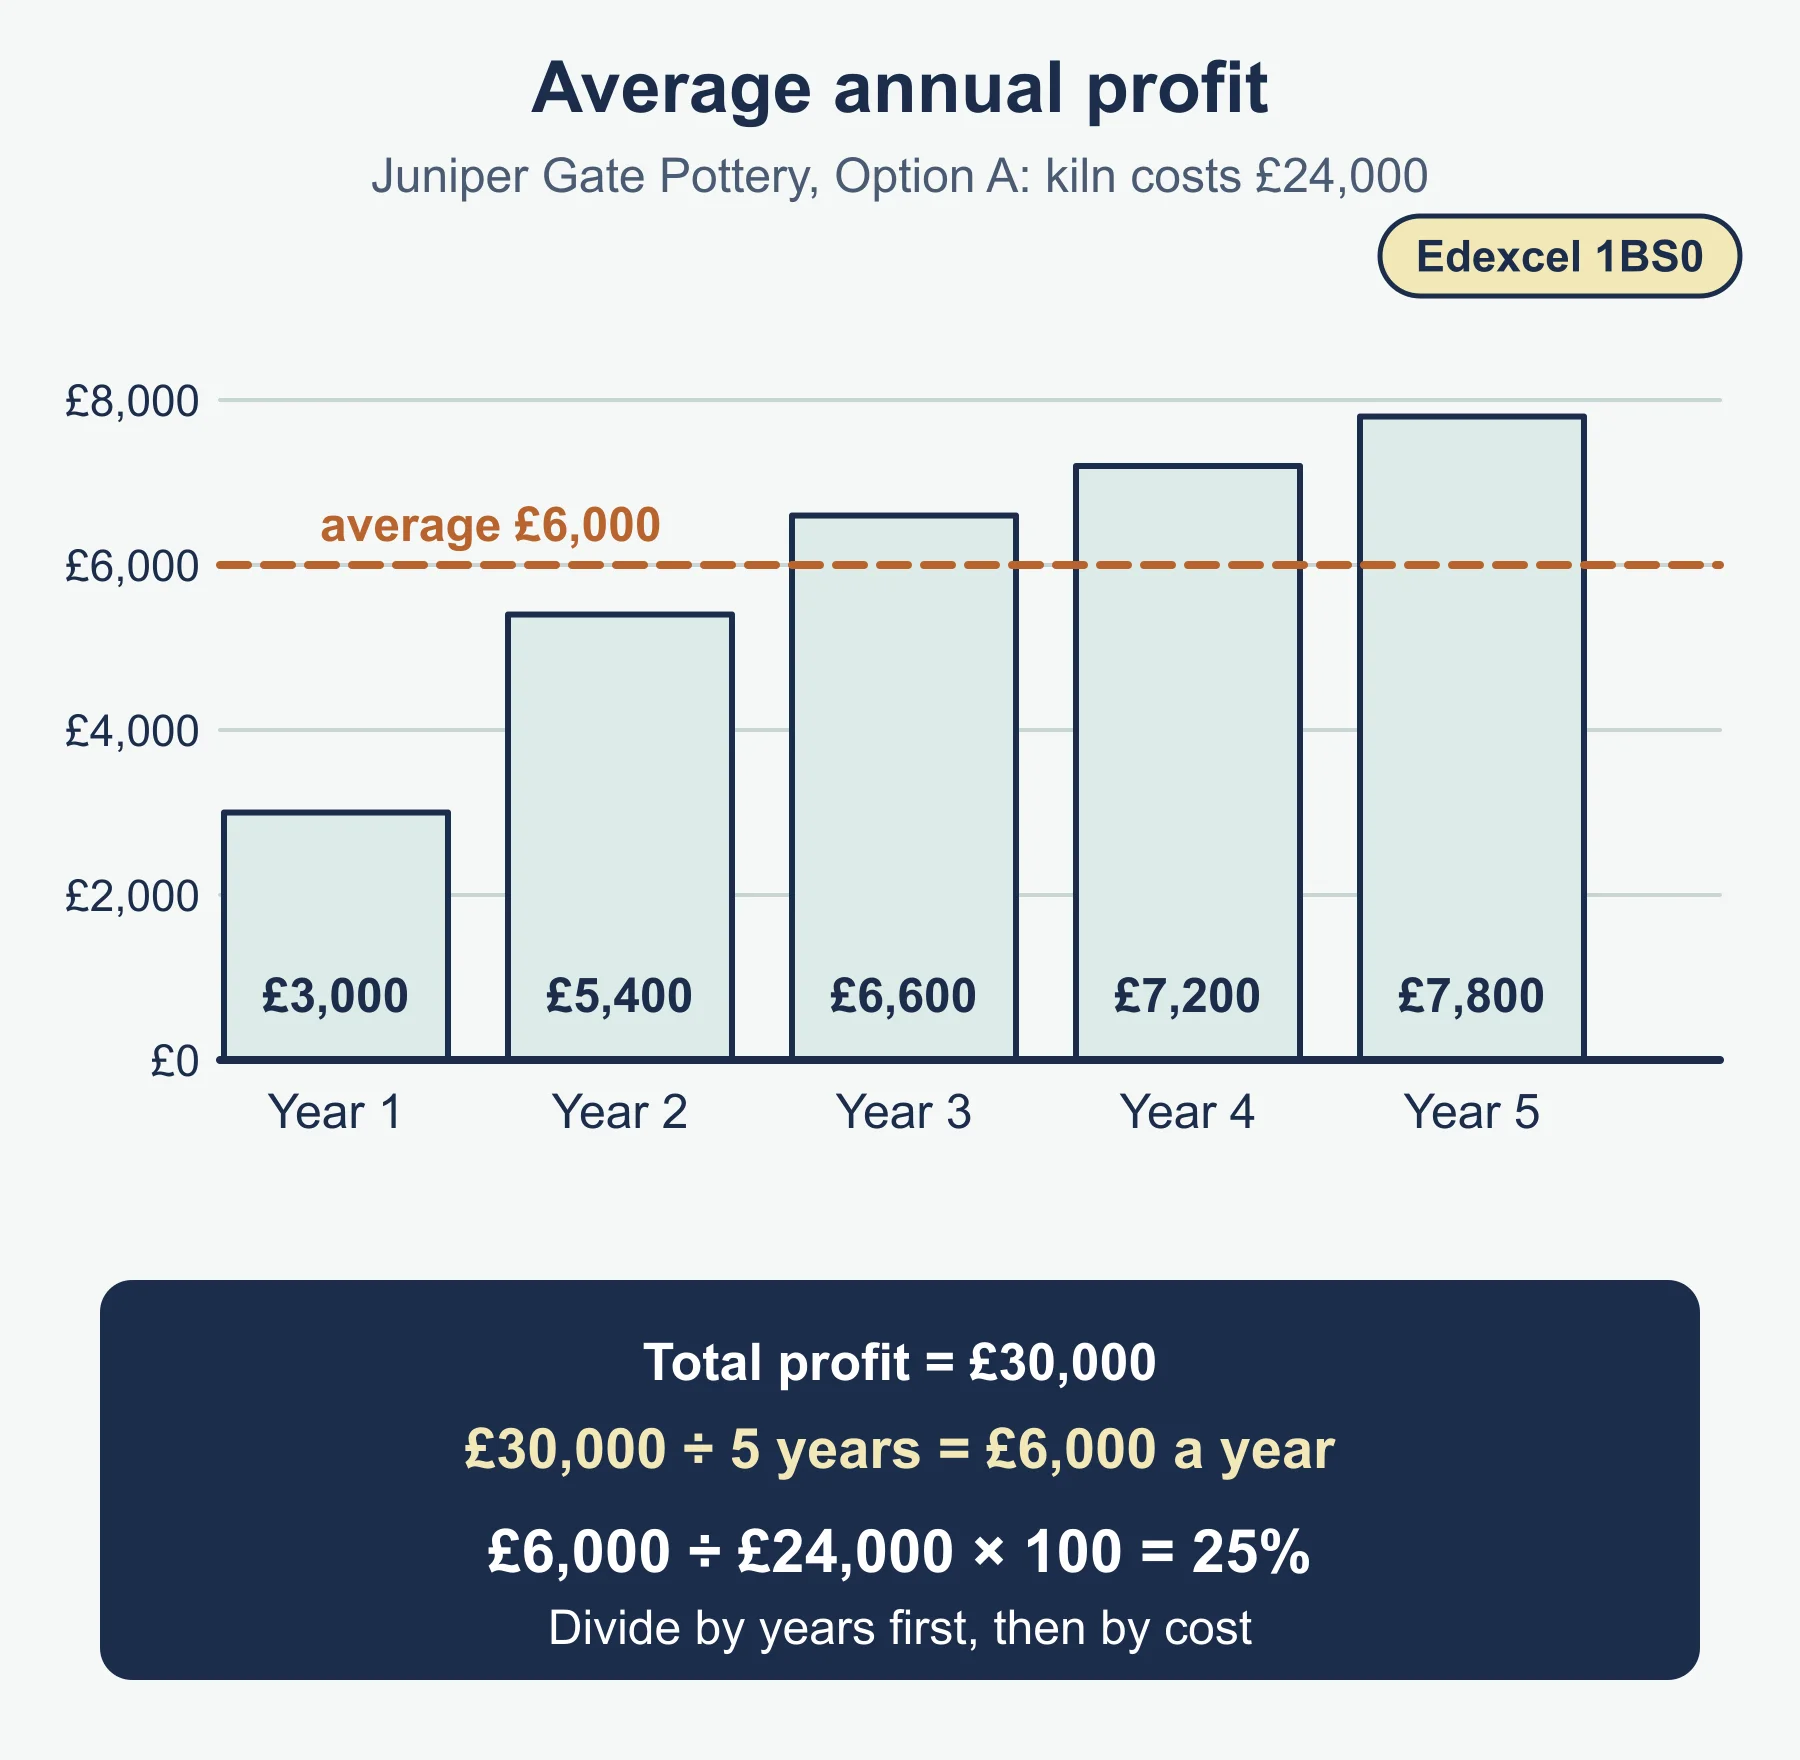
Worked example: Juniper Gate Pottery, Option A. The studio is considering a new kiln costing £24,000. It expects profits from the kiln over five years of £3,000, £5,400, £6,600, £7,200 and £7,800.
- Total profit = 3,000 + 5,400 + 6,600 + 7,200 + 7,800 = £30,000
- Average annual profit = £30,000 ÷ 5 = £6,000
- Average rate of return = £6,000 ÷ £24,000 × 100 = 25%
The answer says that, on average, each £1 spent on the kiln is expected to bring back 25p of profit a year.
If a question gives the cash the investment will bring in, not the profit, the cash returned includes the money that pays back the cost, so work out the profit first by taking the cost off. Check the wording, and if it is unclear, say how you have treated the figures. That is advice on method, not wording from the specification.
Part 6: interpreting average rate of return
The percentage means little alone. Compare it with something.
- Another option. The higher rate is usually the better return on each £1 spent.
- A target. The owner may want a minimum rate, such as 20%.
- The cost or alternative use of the money. If savings in a bank earn 3% a year, an investment with a rate of 25% looks far better. If the money is borrowed, compare the rate with the interest percentage on the loan.
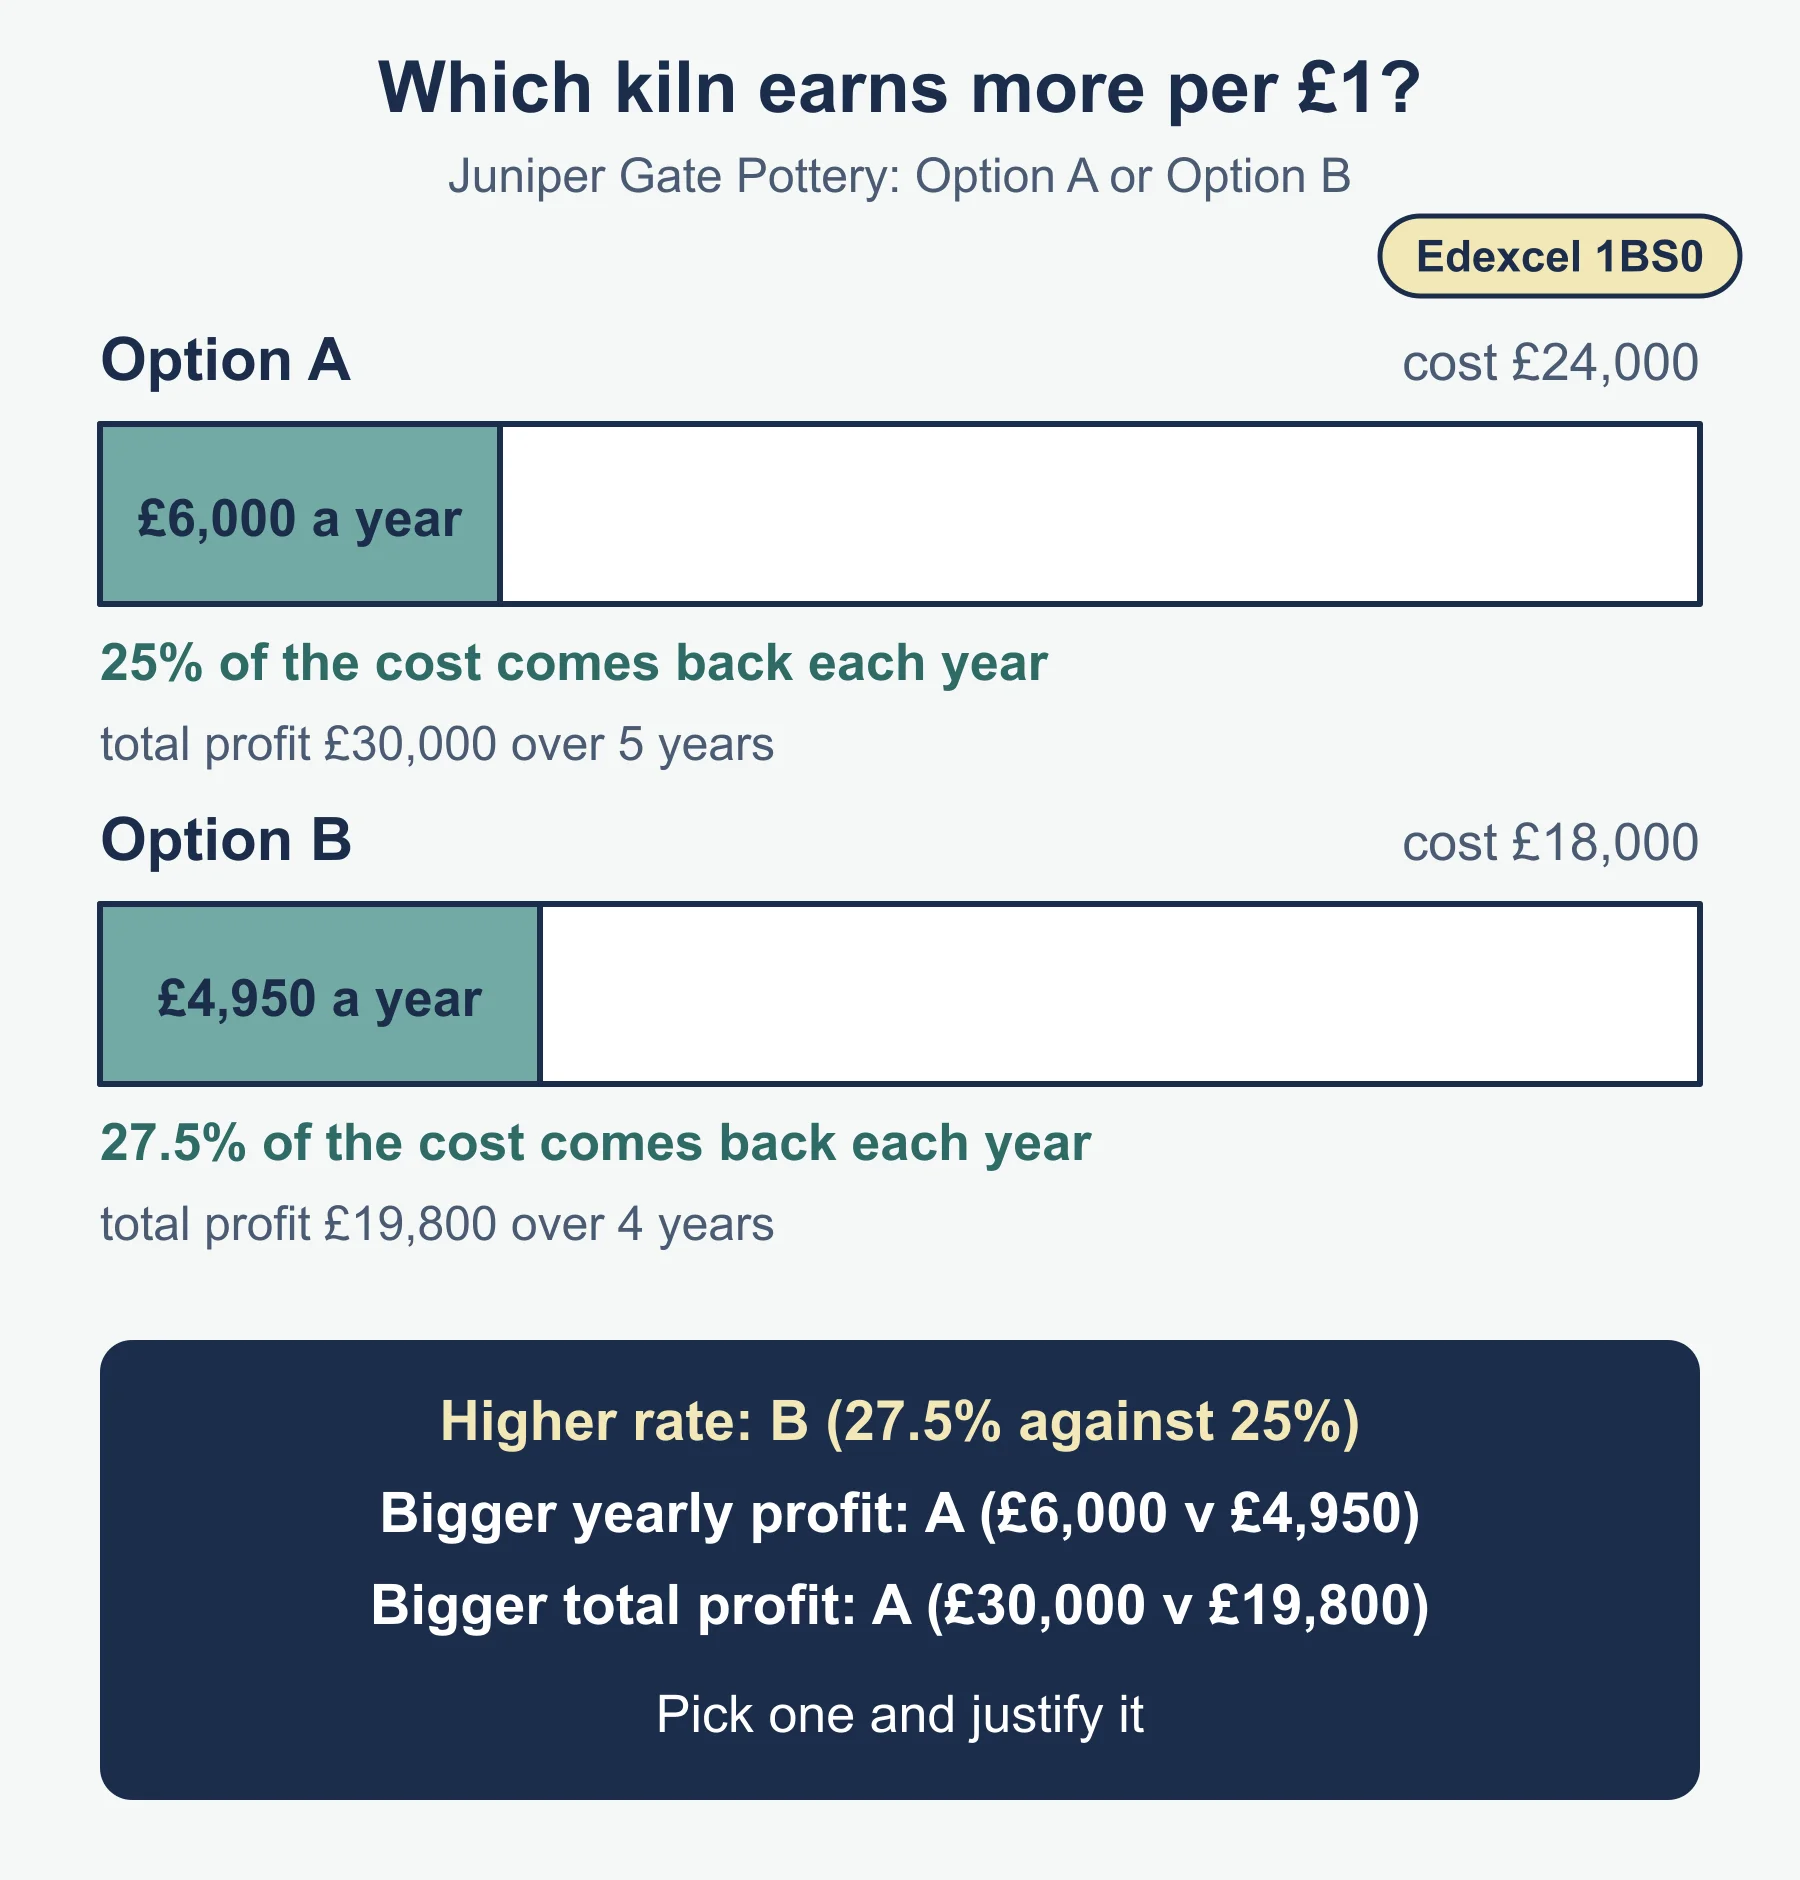
Juniper Gate Pottery, Option B. A smaller kiln costs £18,000 and is expected to give total profit of £19,800 over four years.
- Average annual profit = £19,800 ÷ 4 = £4,950
- Average rate of return = £4,950 ÷ £18,000 × 100 = 27.5%
Option B has the higher rate (27.5% against 25%). Option A has the larger average annual profit (£6,000 against £4,950) and the larger total profit (£30,000 against £19,800). A justify answer chooses one and says why. For example: if the studio can afford only a small outlay, or wants the best return per £1 spent, Option B is better. If it can afford the cost and wants the larger profit, Option A is better.
Limitations to mention when evaluating
These are standard points, not specification wording.
- The profits are forecasts, so the rate is only as reliable as the forecast. Sales could be lower than hoped.
- An average hides the pattern. Option A’s profits start low and grow, but the average treats every year alike.
- A rate does not show how long the investment lasts, so a high rate over a short life may give less total profit.
- It leaves out non-financial factors, such as quality, reputation and staff morale.
Common errors
- Dividing by gross profit, not sales revenue, when finding a net profit margin.
- Forgetting to take off interest when finding net profit.
- Treating cost of sales and other operating expenses as the same cost.
- Dividing total profit, not average annual profit, by the cost of the investment.
- Dividing by the sales revenue or the profit, not the cost of the investment, in the rate of return formula.
- Dividing total profit by the wrong number of years.
- Leaving off the percentage sign or giving a margin as a decimal fraction.
- Calling a fall in margin from 40% to 37% a “3% fall”. It is 3 percentage points.
- Writing a calculated figure and nothing else when the command word is analyse, evaluate or justify.
Frequently asked questions
What is cost of sales? The specification does not define it, so the standard meaning is used: the direct cost of the goods or services the business has sold, such as stock bought for resale. Rent and wages are other operating expenses.
How can a business improve its profit margins? Raising prices or lowering cost of sales lifts both the gross and net margins, while cutting other operating expenses or interest lifts only the net margin. Each has a risk, such as lost customers or lower quality.
How do you interpret an average rate of return? Compare it with another option, the owner’s target or what the money could earn elsewhere, such as interest on savings. The percentage means little on its own.
Why is the gross profit margin usually larger than the net profit margin? Net profit is gross profit minus other operating expenses and interest, so net profit is smaller and its margin on the same sales revenue is lower.
Official syllabus
Pearson Edexcel Level 1/Level 2 GCSE (9-1) in Business (1BS0), Specification, Issue 2, July 2022, published by Pearson Education Limited. Theme 2: Building a business, Topic 2.4 Making financial decisions, content item 2.4.1 Business calculations.
Get free revision emails (optional)
Occasional emails with practice questions, worked explanations and links to free resources for the qualification and subjects you choose. No spam, and you can unsubscribe from any email. The free tools on this site never need an email.
Related resources
-
Practice questions
Edexcel GCSE Business: Business calculations (1BS0) – Practice Questions
Twelve original practice questions with worked answers on profit, profit margins and average rate of return for Pearson Edexcel GCSE Business, topic 2.4.1.
Business · Pearson Edexcel · GCSE
Try questions -
Revision notes
Edexcel GCSE Business: Business calculations (1BS0) – Revision Notes
Condensed revision notes on gross profit, net profit, profit margins and average rate of return for Pearson Edexcel GCSE Business 1BS0, with a self-test.
Business · Pearson Edexcel · GCSE
Revise topic -
Study guides
Edexcel GCSE Business: Interpreting quantitative business data (1BS0)
Study guide to reading graphs, financial, marketing and market data and the limits of financial information, for Pearson Edexcel GCSE Business.
Business · Pearson Edexcel · GCSE
Read guide
Related articles
-
teaching
A Level tuition in Dubai: Cambridge or Pearson Edexcel International A Level?
Schools in Dubai and Abu Dhabi teach either Cambridge International AS & A Level or Pearson Edexcel International A Level. How the two are structured, why it matters for tuition, and how online classes from Lahore work.
9 October 2026
-
curriculum guides
Choosing subjects at IGCSE and A Level
How subject choices at 14 and 16 affect university options later, and how to keep pathways open without overloading a timetable.
28 July 2026
Studying this with a teacher
Working through Business GCSE?
This page is free and stays free. If you would rather be taught it, Marlbridge runs Business classes one-to-one and in small groups of up to 15, online in your own time zone. The first trial class is free. WhatsApp replies within an hour (8am–11pm Pakistan time, every day); email the same day.
Pearson Edexcel Business teachers at Marlbridge

