
Study Guides
Edexcel GCSE Business: Interpreting quantitative business data (1BS0)
Study guide to reading graphs, financial, marketing and market data and the limits of financial information, for Pearson Edexcel GCSE Business.
- Subject
- Business
- Level
- GCSE
- Topic
- Making financial decisions
- Author
- Marlbridge Academic Team
- Updated
- Reviewed by
- Asif Iqbal (what this means)
Aligned to Pearson Edexcel GCSE Business (1BS0), Issue 2, July 2022. Official specification .
Syllabus page (what it covers and how it is assessed): Pearson Edexcel GCSE Business.
Syllabus points this page covers
1BS0
- 2.4 Making financial decisions (whole topic)
- 2.4.2 Understanding business data
Found an error? Report a correction.
Want a teacher for this? Marlbridge teaches Business online. Request a free trial class.
This guide follows the Pearson Edexcel Level 1/Level 2 GCSE (9-1) in Business (1BS0) specification, Issue 2, July 2022. It covers Theme 2, Topic 2.4 Making financial decisions, content item 2.4.2 (headed “Understanding business performance” in the specification). The specification says calculators may be used and that formulae are listed in Appendix 3 but are not provided in the examinations, so learn them.
Course links: the Business hub, the printable checklist and the free diagnostics. Companion pages: the revision notes and the practice questions. For the calculations that feed this topic, see business calculations, aims, revenue, costs and profit and cash flow and sources of finance.
What the specification asks for
| Item | You must be able to | Section |
|---|---|---|
| 2.4.2 | Use and interpret quantitative data to support, inform and justify business decisions | 1 |
| 2.4.2 | Take information from graphs and charts | 2 |
| 2.4.2 | Use and interpret financial data | 3 |
| 2.4.2 | Use and interpret marketing data | 4 |
| 2.4.2 | Use and interpret market data | 5 |
| 2.4.2 | Explain the use and limitations of financial information in understanding business performance | 6 |
| 2.4.2 | Explain the use and limitations of financial information in making business decisions | 6 |
The specification says the minimum level of mathematics in the papers is equivalent to Key Stage 3, and that quantitative questions are always set in a business context. The skills it lists are percentages and percentage changes, averages, revenue, costs and profit, the two profit margins, average rate of return and cash-flow forecasts. Market share, changes in costs and changes in prices are listed for market data.
1. Support, inform and justify
Numbers do three jobs in a decision. They inform it by showing what is happening. They support a choice already leaning one way. They justify it by giving the evidence a manager can point to when someone asks why. The specification’s definition of business information covers both qualitative and quantitative information, so a number is one input, not the whole decision.
A good answer to a data question does three things: quote the figure from the stem, work out what it means (a change, a share, a ratio), then say what the business should do or what it risks.
2. Information from graphs and charts
Read the title, the axis labels and the units before reading any values. Then:
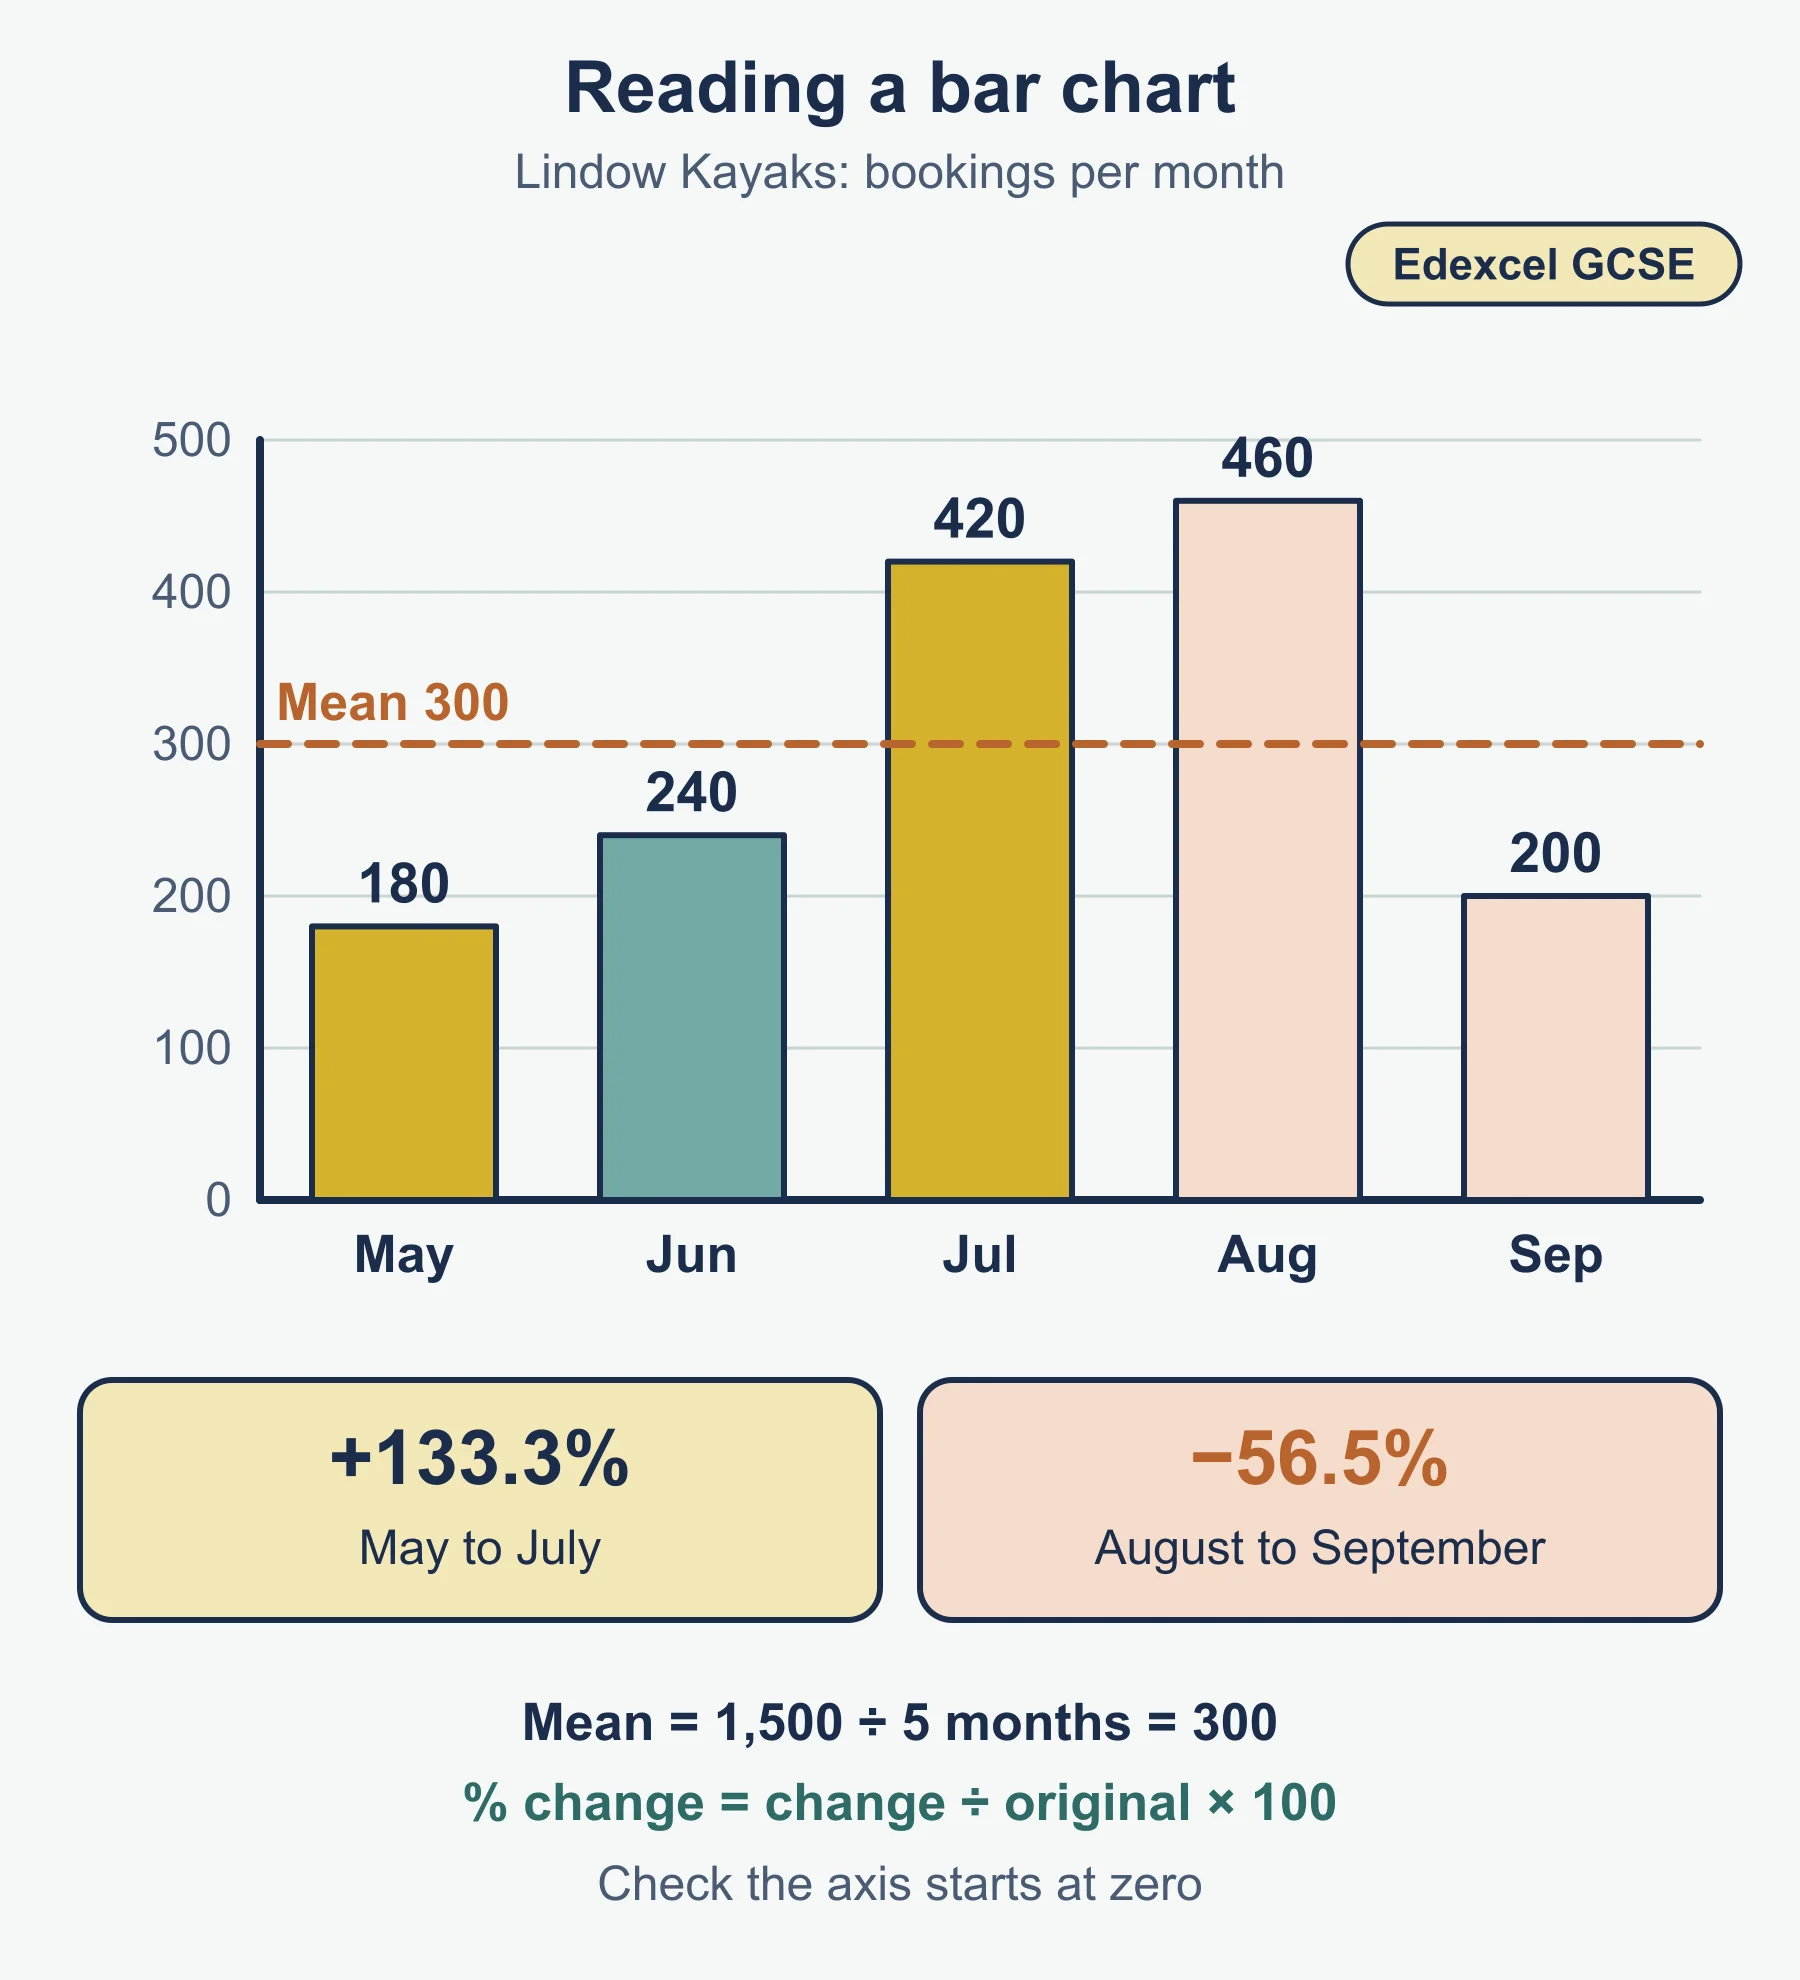
- Bar chart. Compare heights. Check whether the vertical axis starts at zero, because a cut axis makes small gaps look large.
- Line graph. Shows change over time. Describe the direction, the peak and any turning point.
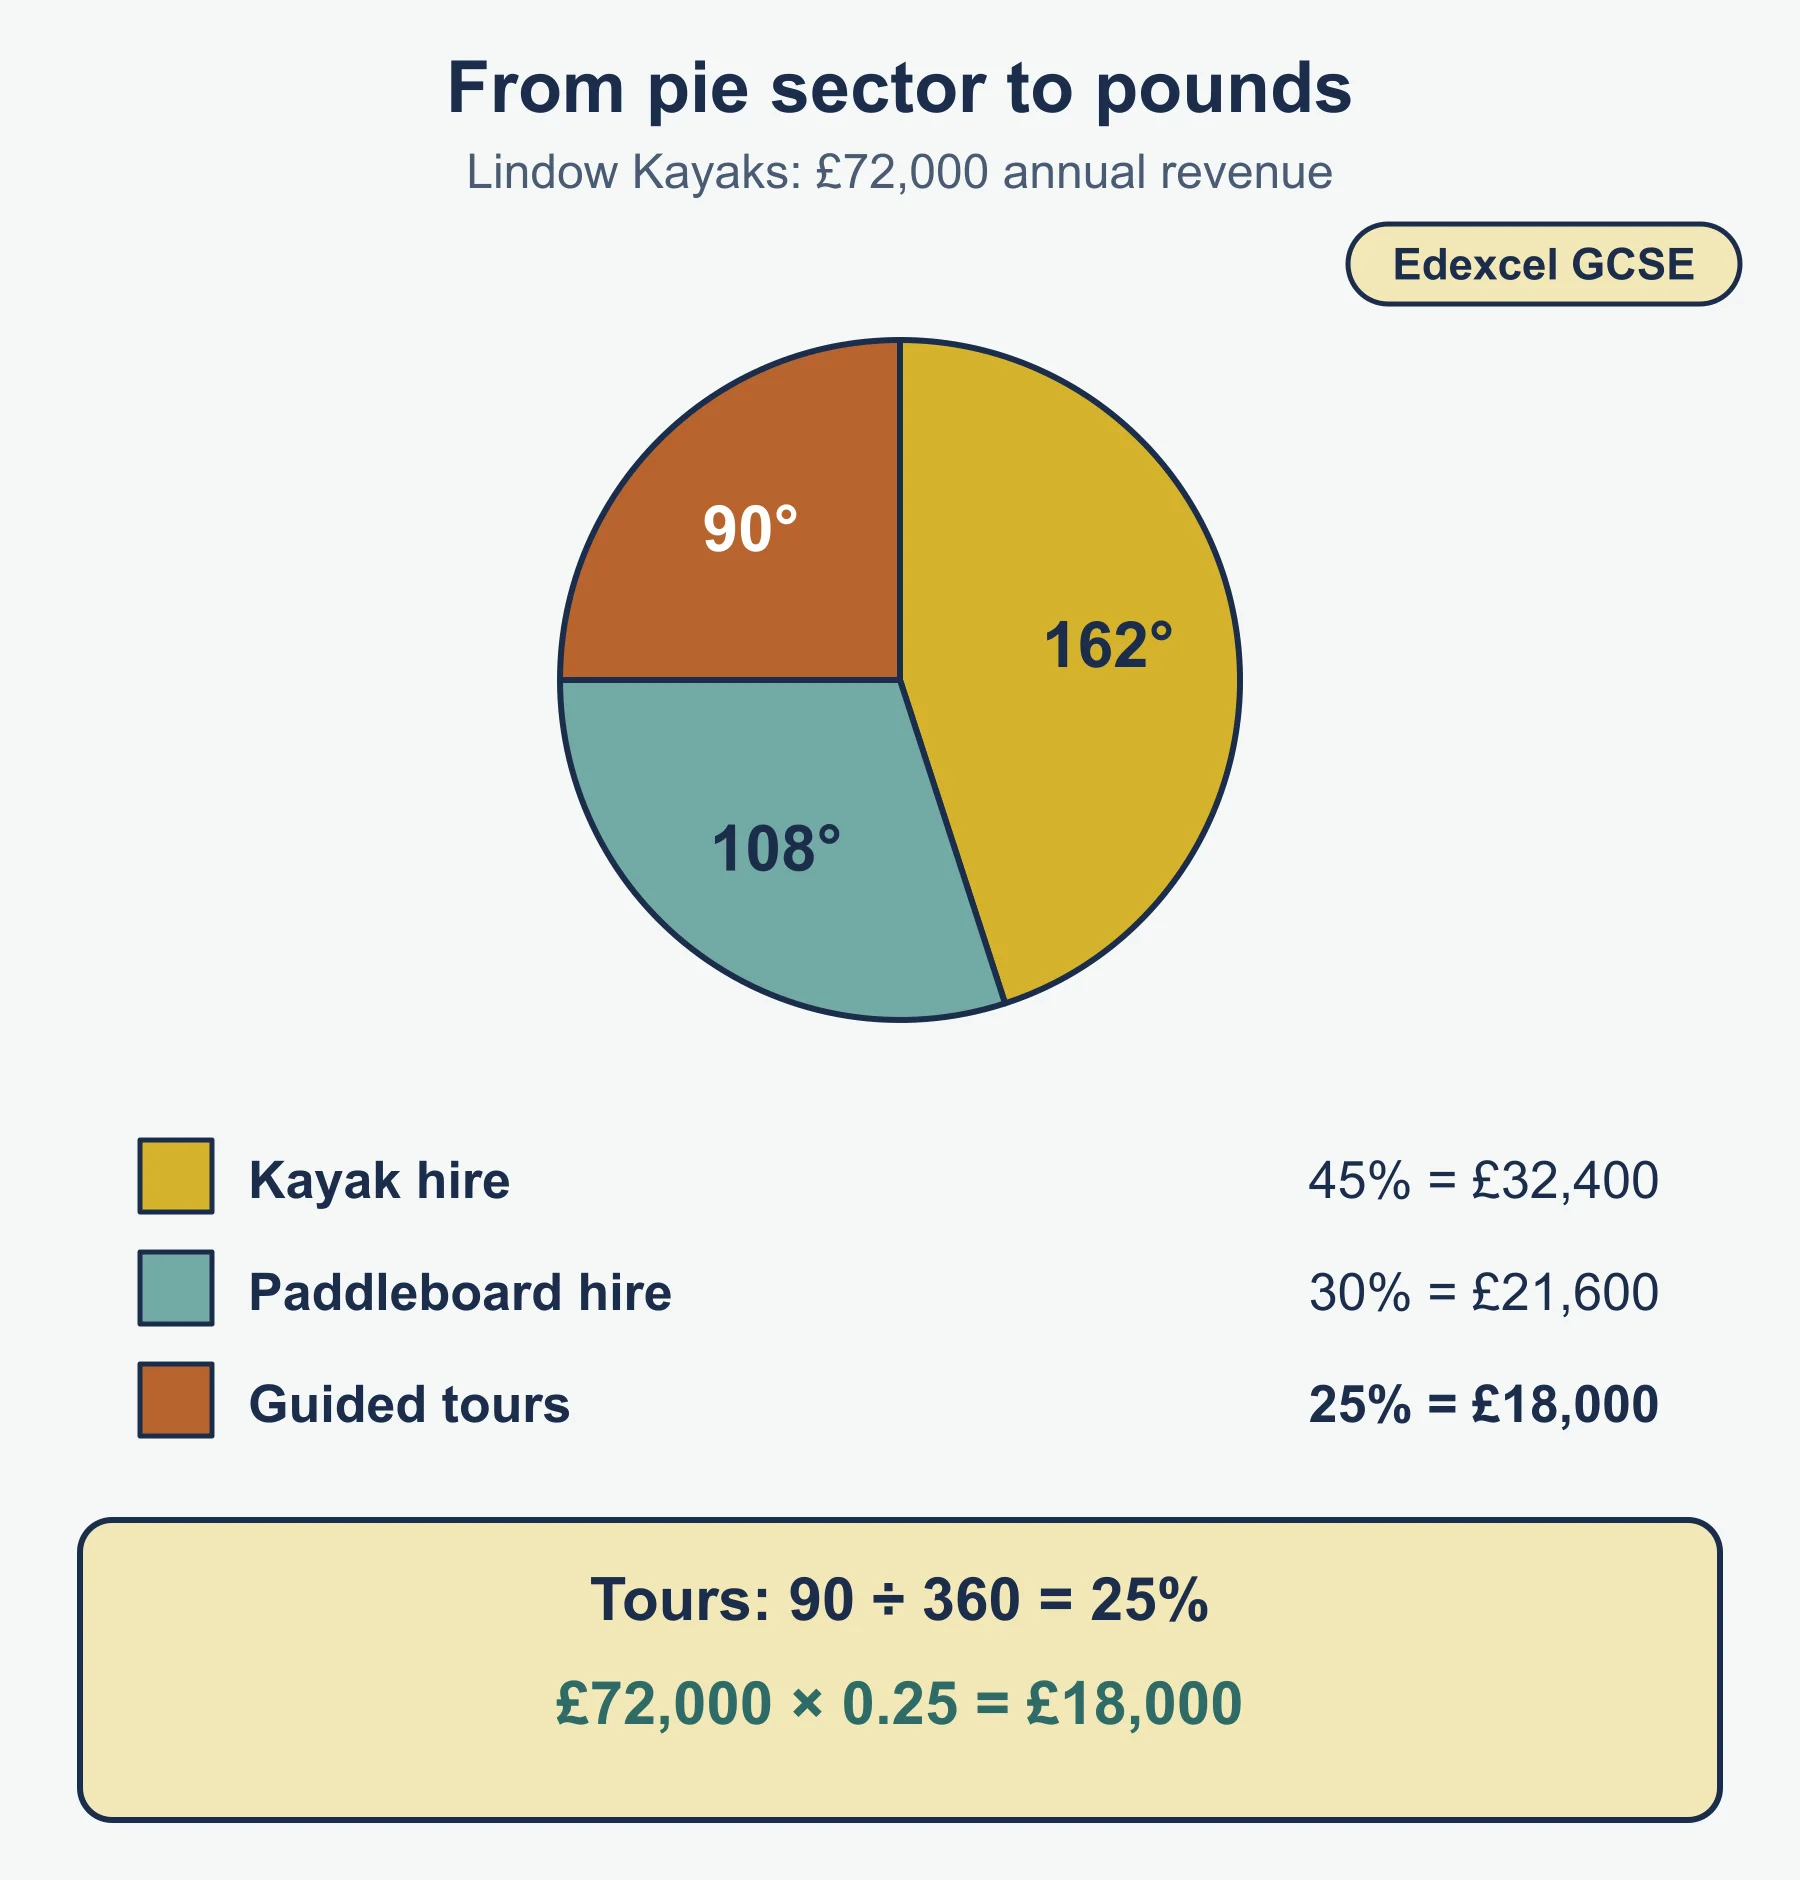
- Pie chart. Shows shares of a whole. A sector is its angle divided by 360, as a percentage.
- Table. Often the same data as a chart. Rows and columns must be matched to the right month or product.
Command words matter here. “Identify” asks you to select the answer by reading a graph or table, so give the value and its unit. “Calculate” asks for working.
Worked example. Lindow Kayaks records bookings per month:
| Month | May | Jun | Jul | Aug | Sep |
|---|---|---|---|---|---|
| Bookings | 180 | 240 | 420 | 460 | 200 |
Mean (average) bookings = total divided by the number of months = 1,500 / 5 = 300. The percentage change from May to July = (420 − 180) / 180 × 100 = 133.3% increase. From August to September = (200 − 460) / 460 × 100 = 56.5% decrease.
Pie chart of the £72,000 annual revenue: kayak hire has a 162° sector, paddleboard hire 108° and guided tours 90°. Guided tours = 90 / 360 = 25%, so £72,000 × 0.25 = £18,000. Kayak hire is 45% (£32,400) and paddleboards 30% (£21,600).
Use of the data: demand is strongly seasonal, so the business could plan temporary staff for July and August and use September to promote tours. The data does not say why September fell, so it would be sensible to check the weather and local events.
3. Financial data
Financial data in this specification covers profit and loss information, profitability ratios, average rate of return and cash-flow forecasts. The Appendix 3 formulae are:
- Gross profit = sales revenue − cost of sales
- Gross profit margin (%) = gross profit / sales revenue × 100
- Net profit = gross profit − other operating expenses and interest
- Net profit margin (%) = net profit / sales revenue × 100
- Average rate of return (%) = average annual profit (total profit / number of years) / cost of investment × 100
- Net cash flow = cash inflows − cash outflows; closing balance = opening balance + net cash flow
The specification does not list percentage change; the standard form is change / original × 100.
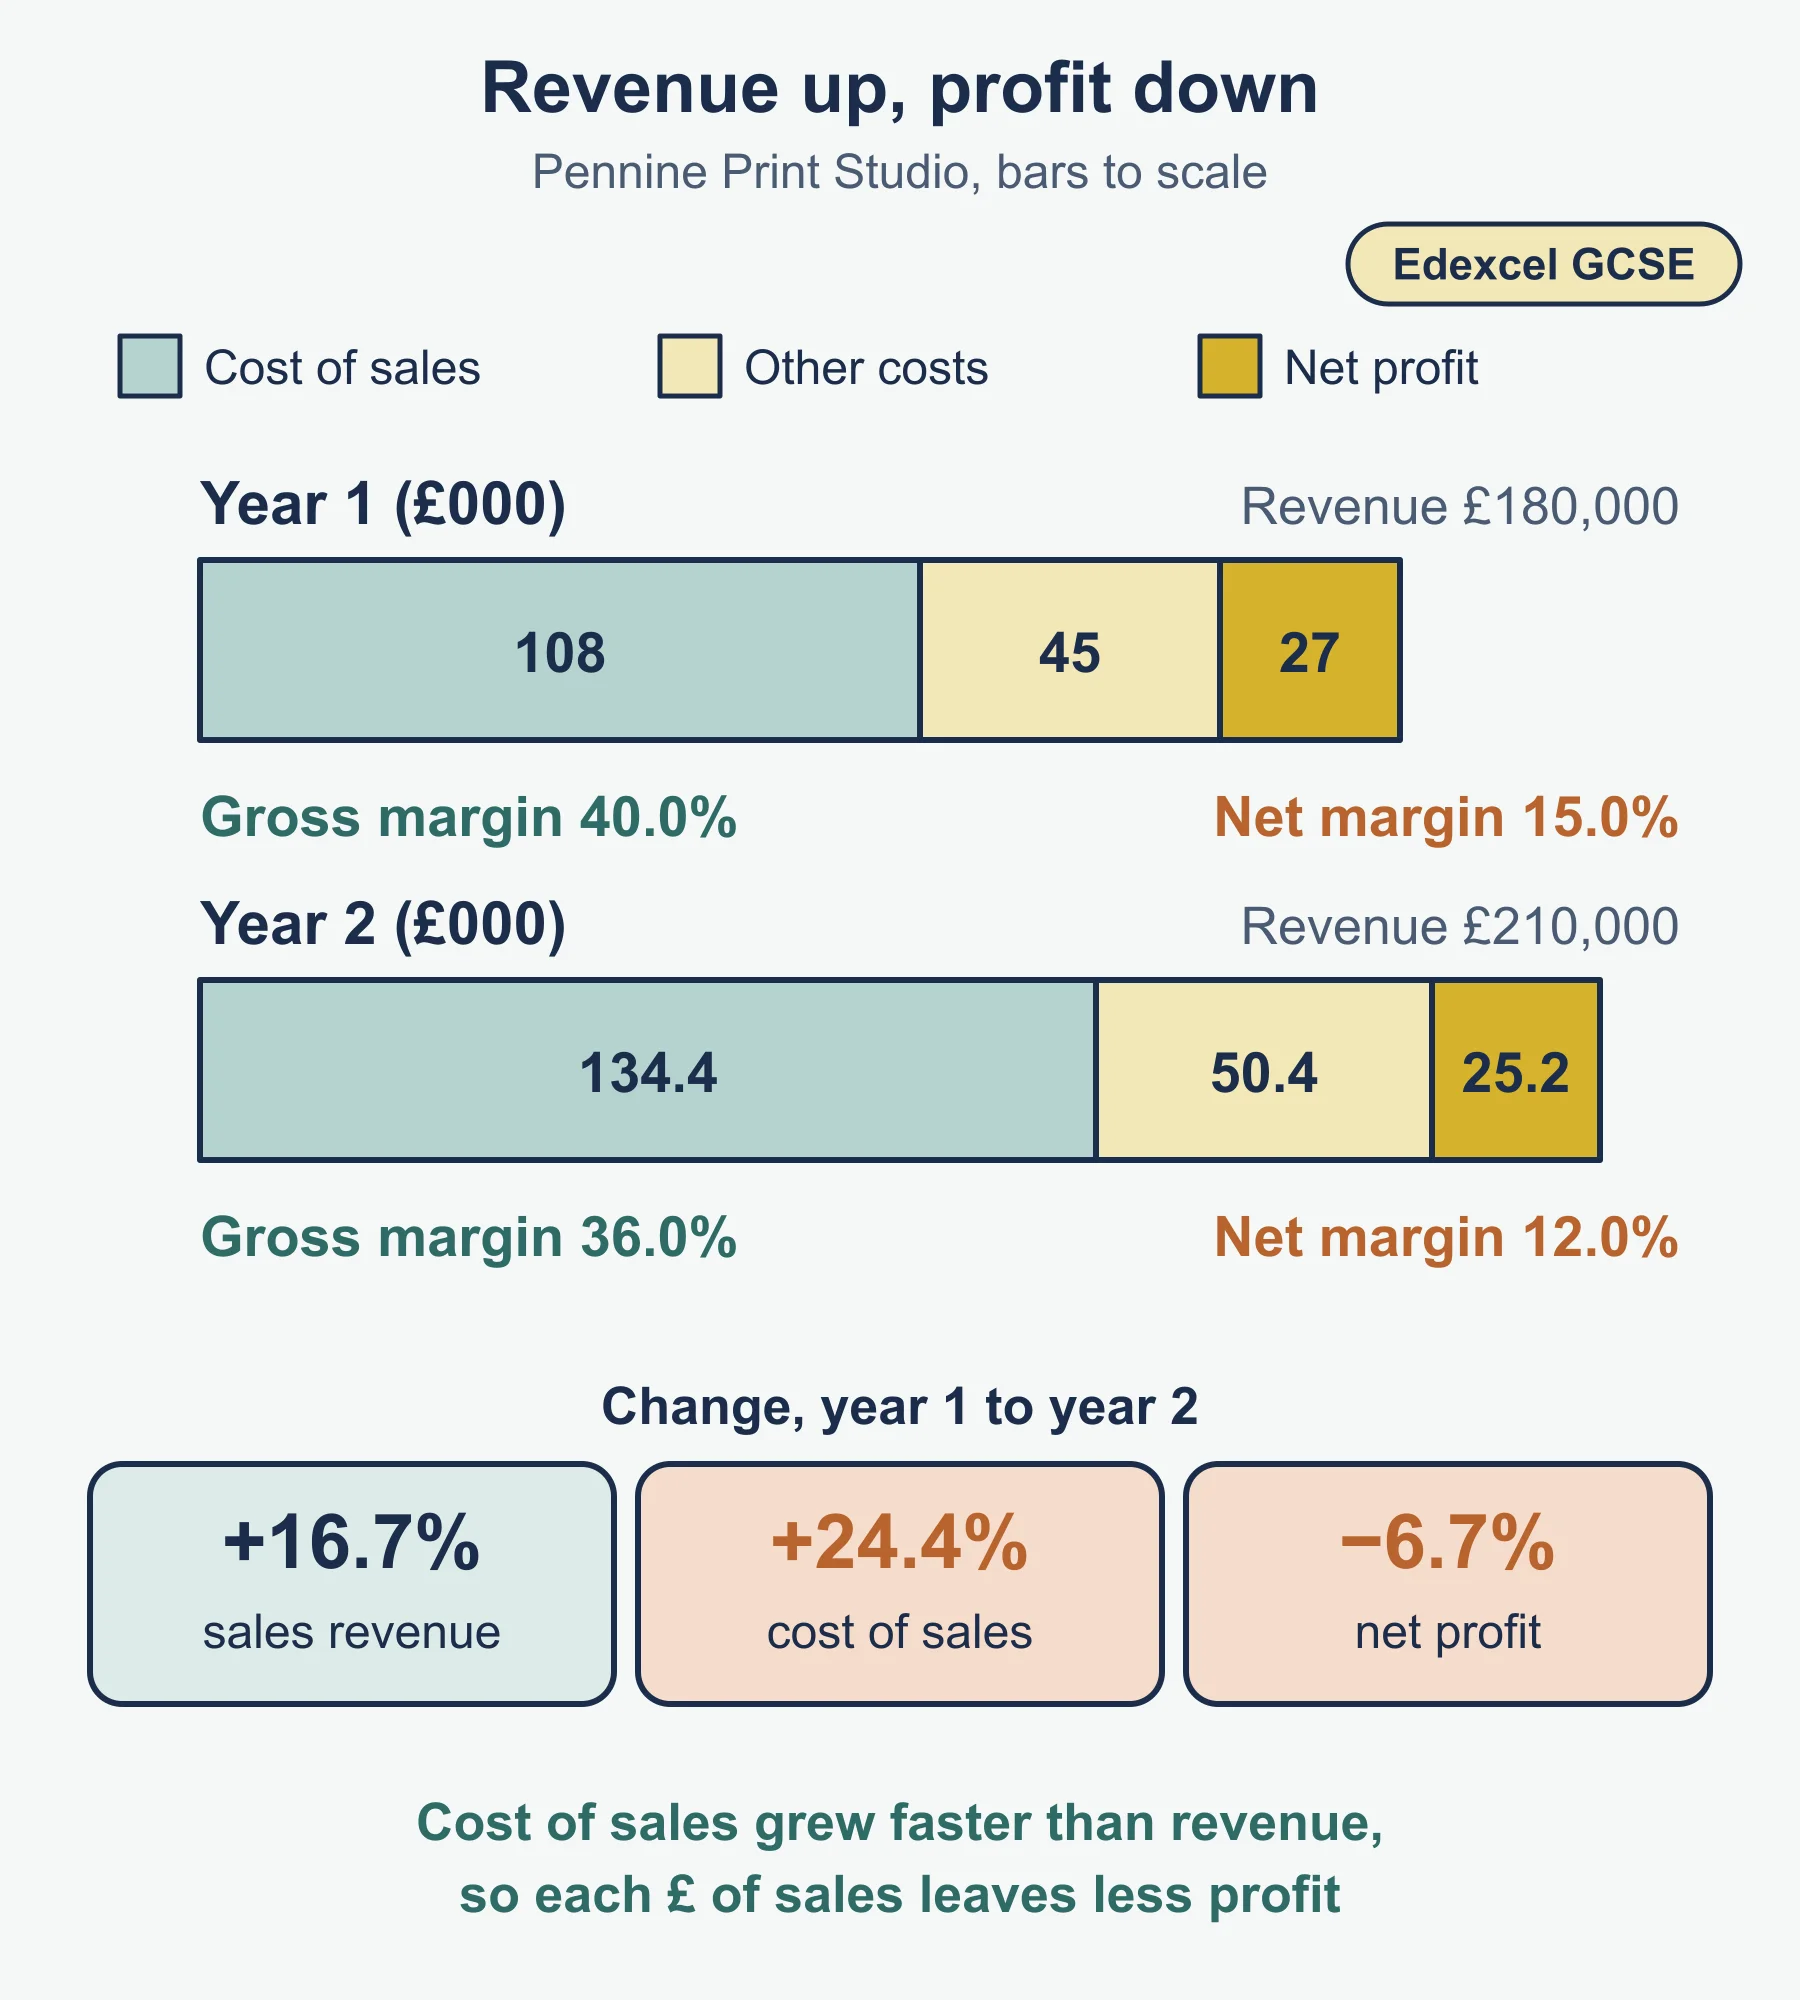
Worked example. Pennine Print Studio compares two years.
| Year 1 | Year 2 | |
|---|---|---|
| Sales revenue | £180,000 | £210,000 |
| Cost of sales | £108,000 | £134,400 |
| Gross profit | £72,000 | £75,600 |
| Other operating expenses and interest | £45,000 | £50,400 |
| Net profit | £27,000 | £25,200 |
| Gross profit margin | 40.0% | 36.0% |
| Net profit margin | 15.0% | 12.0% |
Interpretation: sales revenue rose 16.7%, yet net profit fell 6.7%. Cost of sales rose 24.4%, much faster than revenue, so each pound of sales leaves less gross profit. The studio should look at supplier prices or its selling prices before it does anything about overheads.
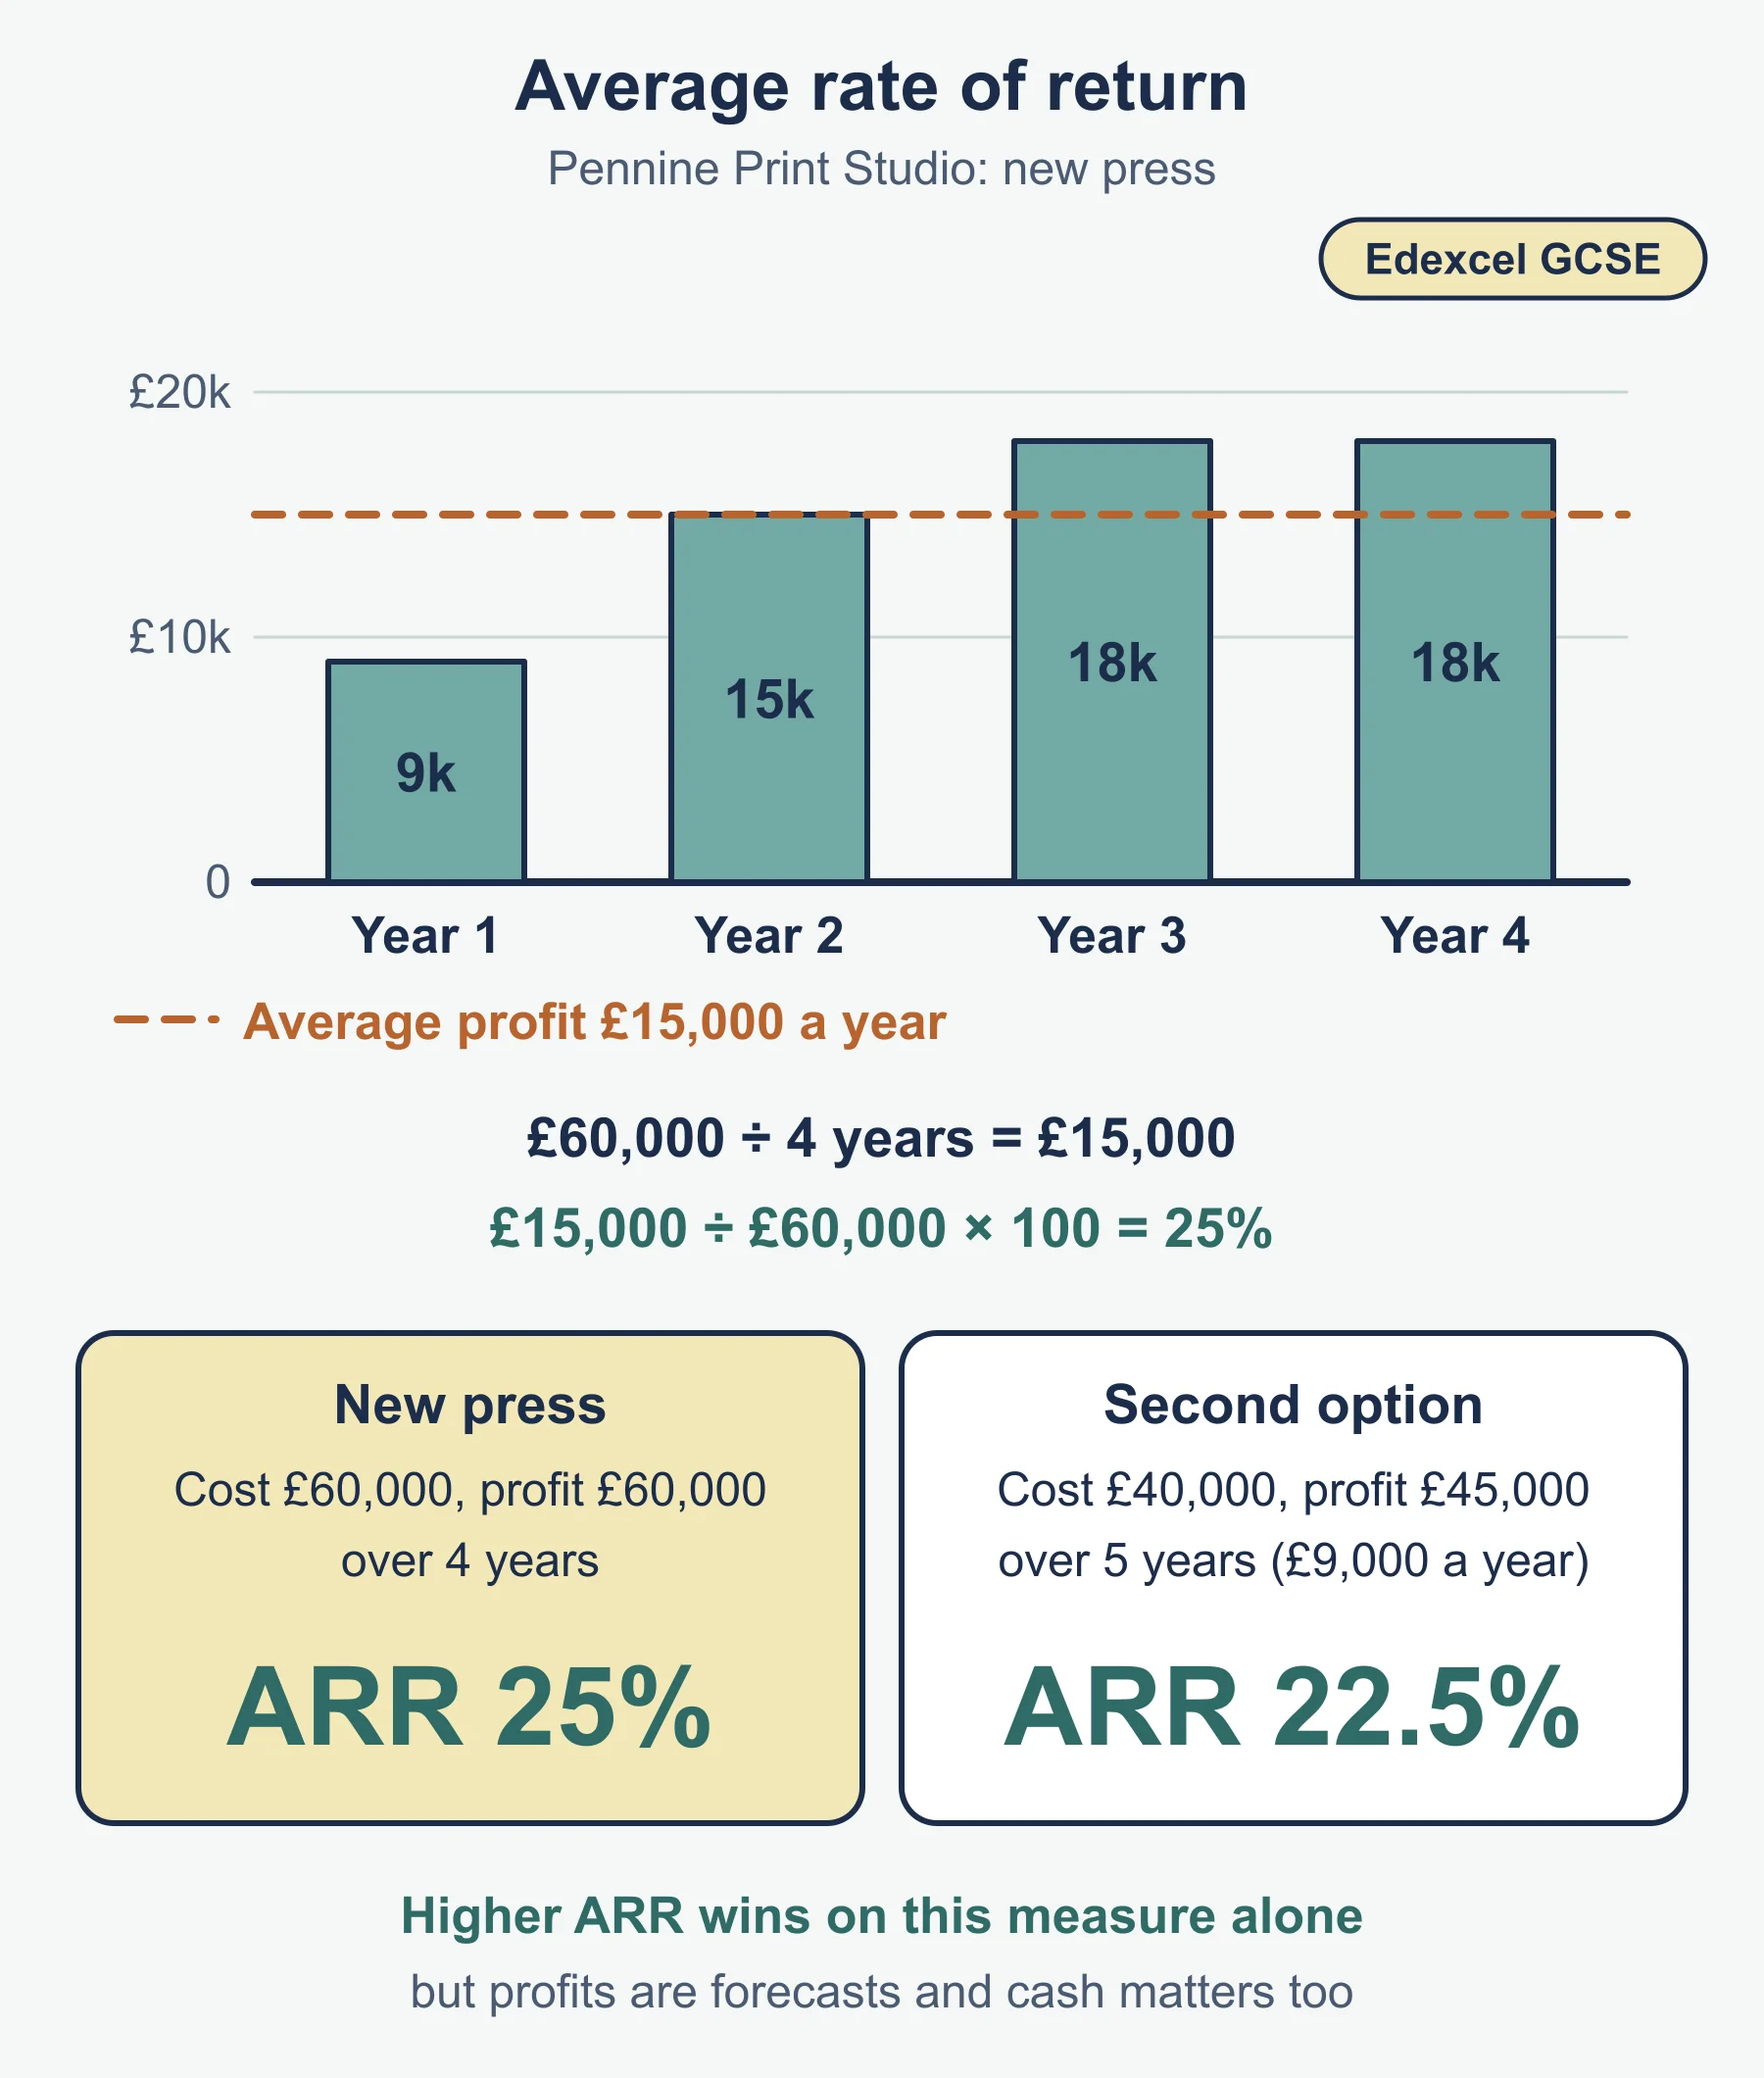
Average rate of return (ARR). The studio can buy a new press for £60,000 with expected profits of £9,000, £15,000, £18,000 and £18,000 over four years. Total profit = £60,000. Average annual profit = 60,000 / 4 = £15,000. ARR = 15,000 / 60,000 × 100 = 25%. A second option costs £40,000 and gives £45,000 profit over five years: 45,000 / 5 = £9,000, so ARR = 9,000 / 40,000 × 100 = 22.5%. On ARR alone the press is better. A “justify” answer should say that, then add what the figure leaves out (see section 6).
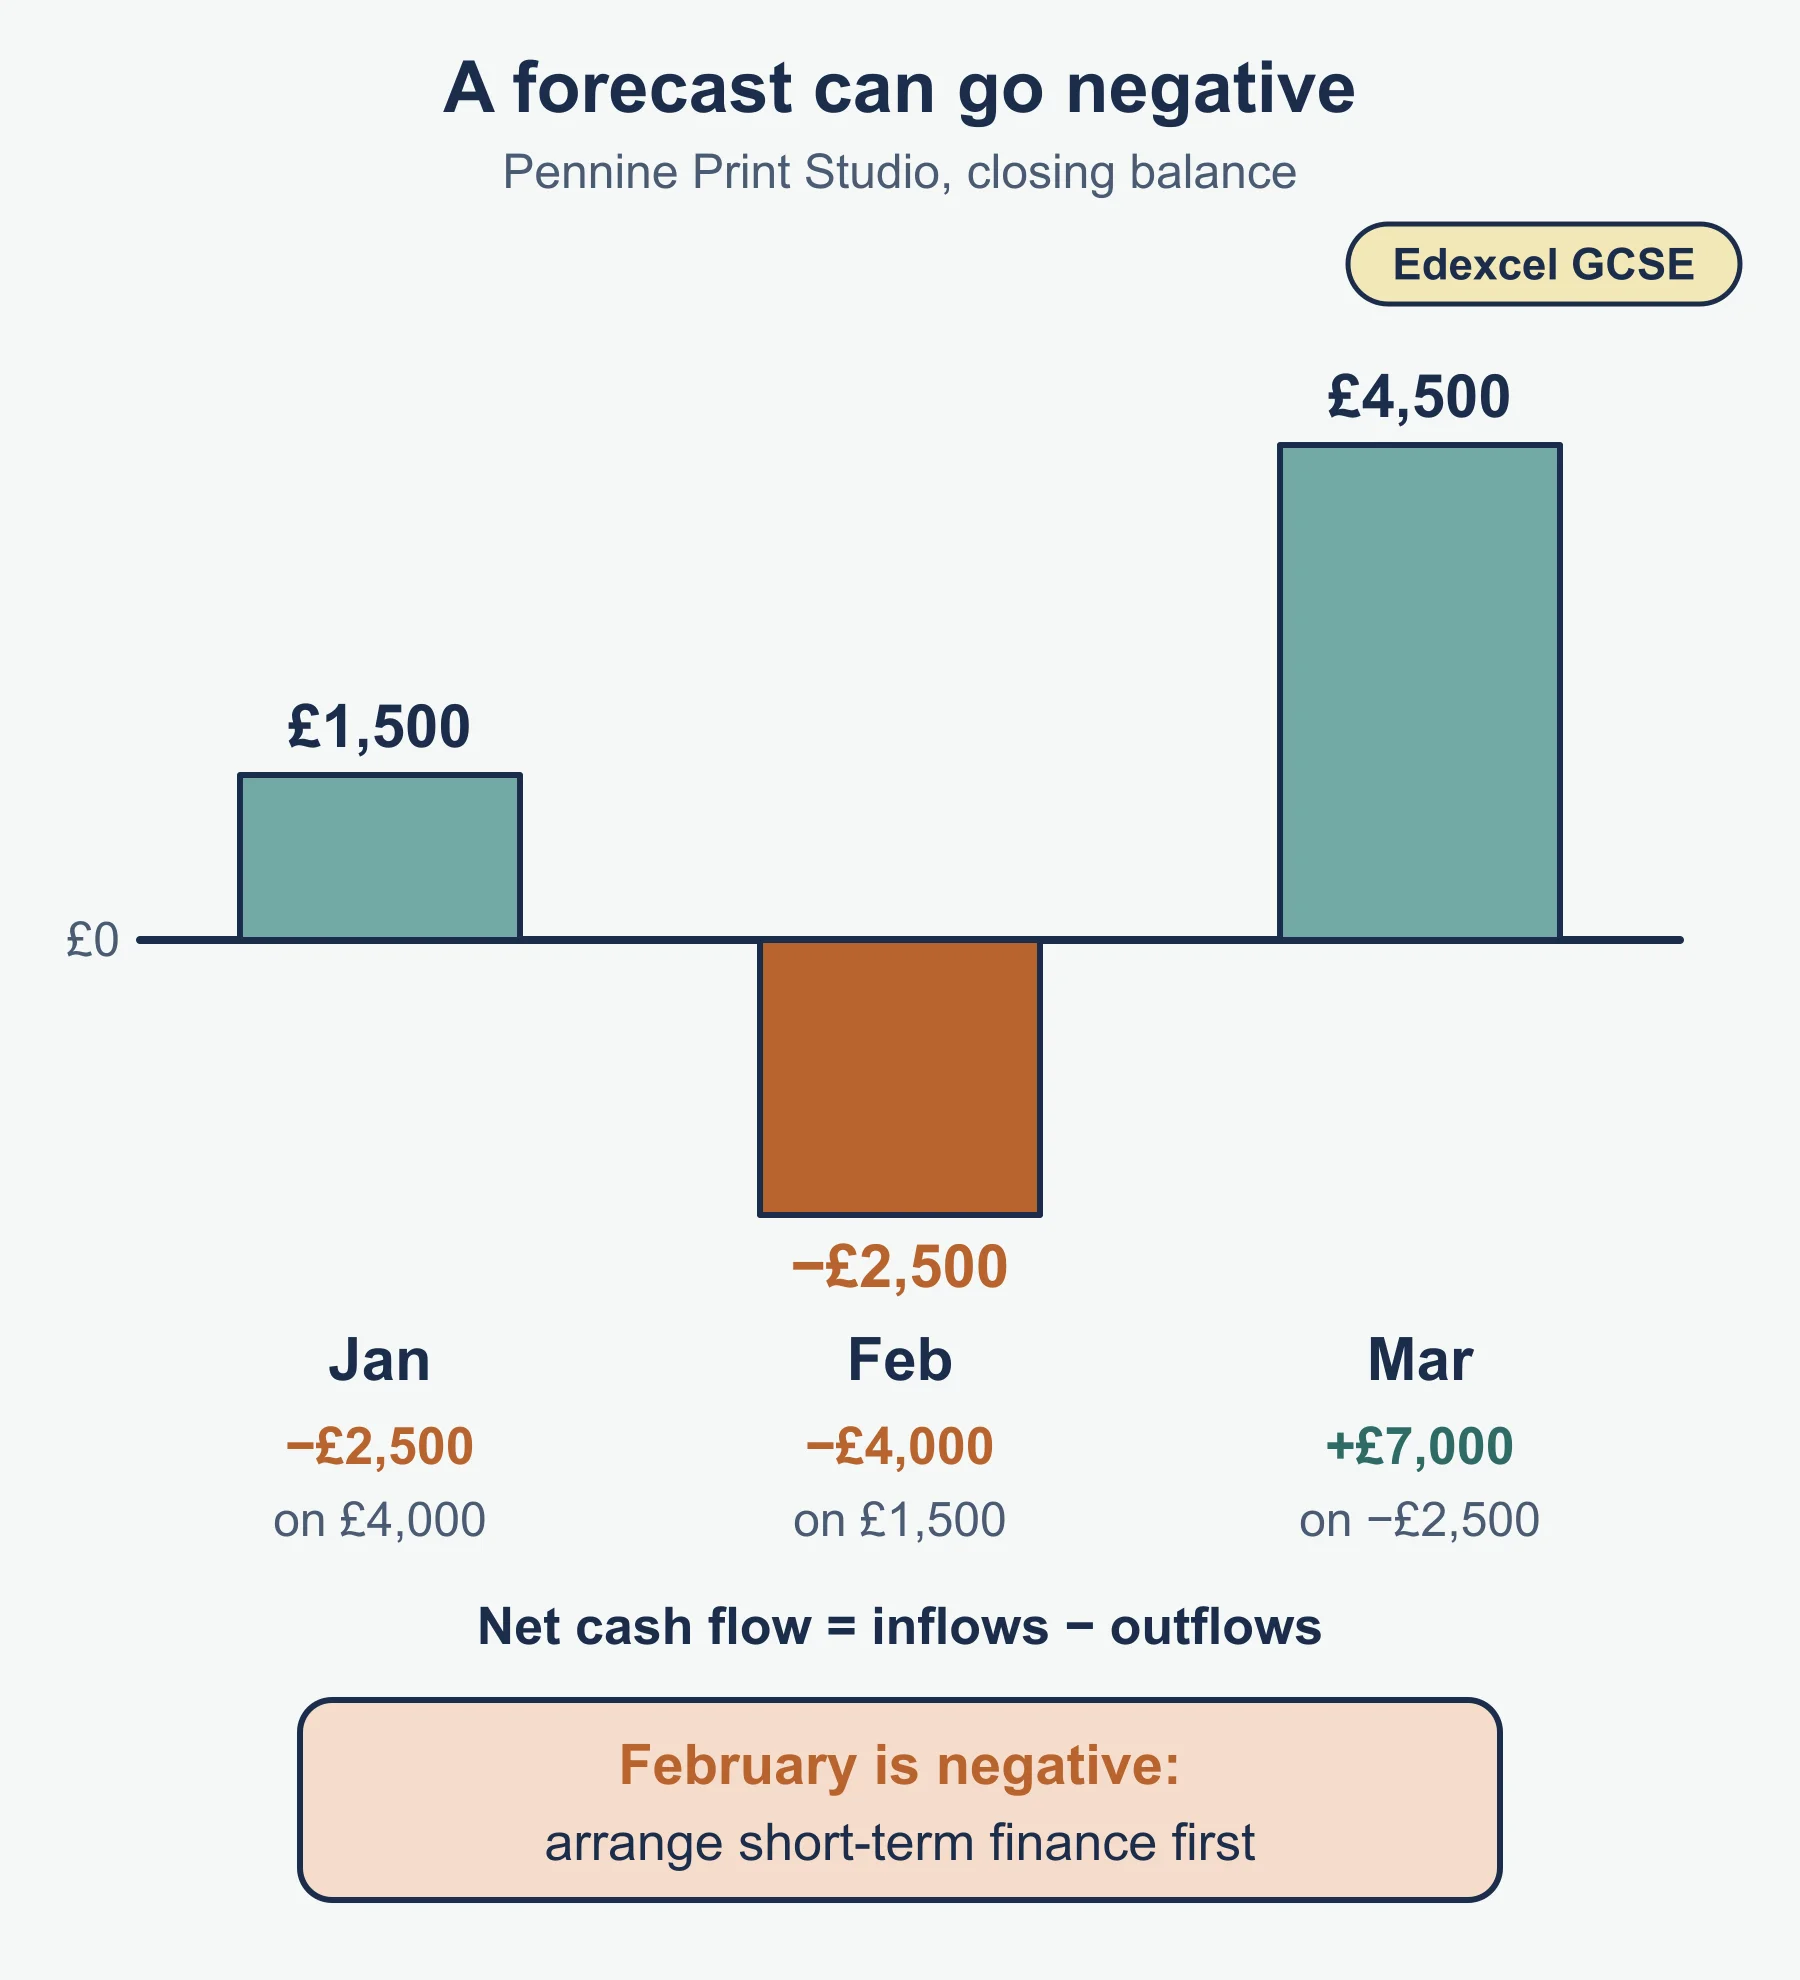
Cash-flow forecast. The studio’s three-month forecast, opening balance £4,000 in January:
| Jan | Feb | Mar | |
|---|---|---|---|
| Cash inflows | £15,000 | £14,000 | £23,000 |
| Cash outflows | £17,500 | £18,000 | £16,000 |
| Net cash flow | −£2,500 | −£4,000 | £7,000 |
| Closing balance | £1,500 | −£2,500 | £4,500 |
February’s balance is negative, so the studio needs a short-term source of finance, or must move payments, before then. A profitable business can still have a negative balance in a month.
4. Marketing data
The specification names market research data. Survey answers are the usual example, and the results of a promotion can be treated in the same way. Turn counts into percentages, then compare.
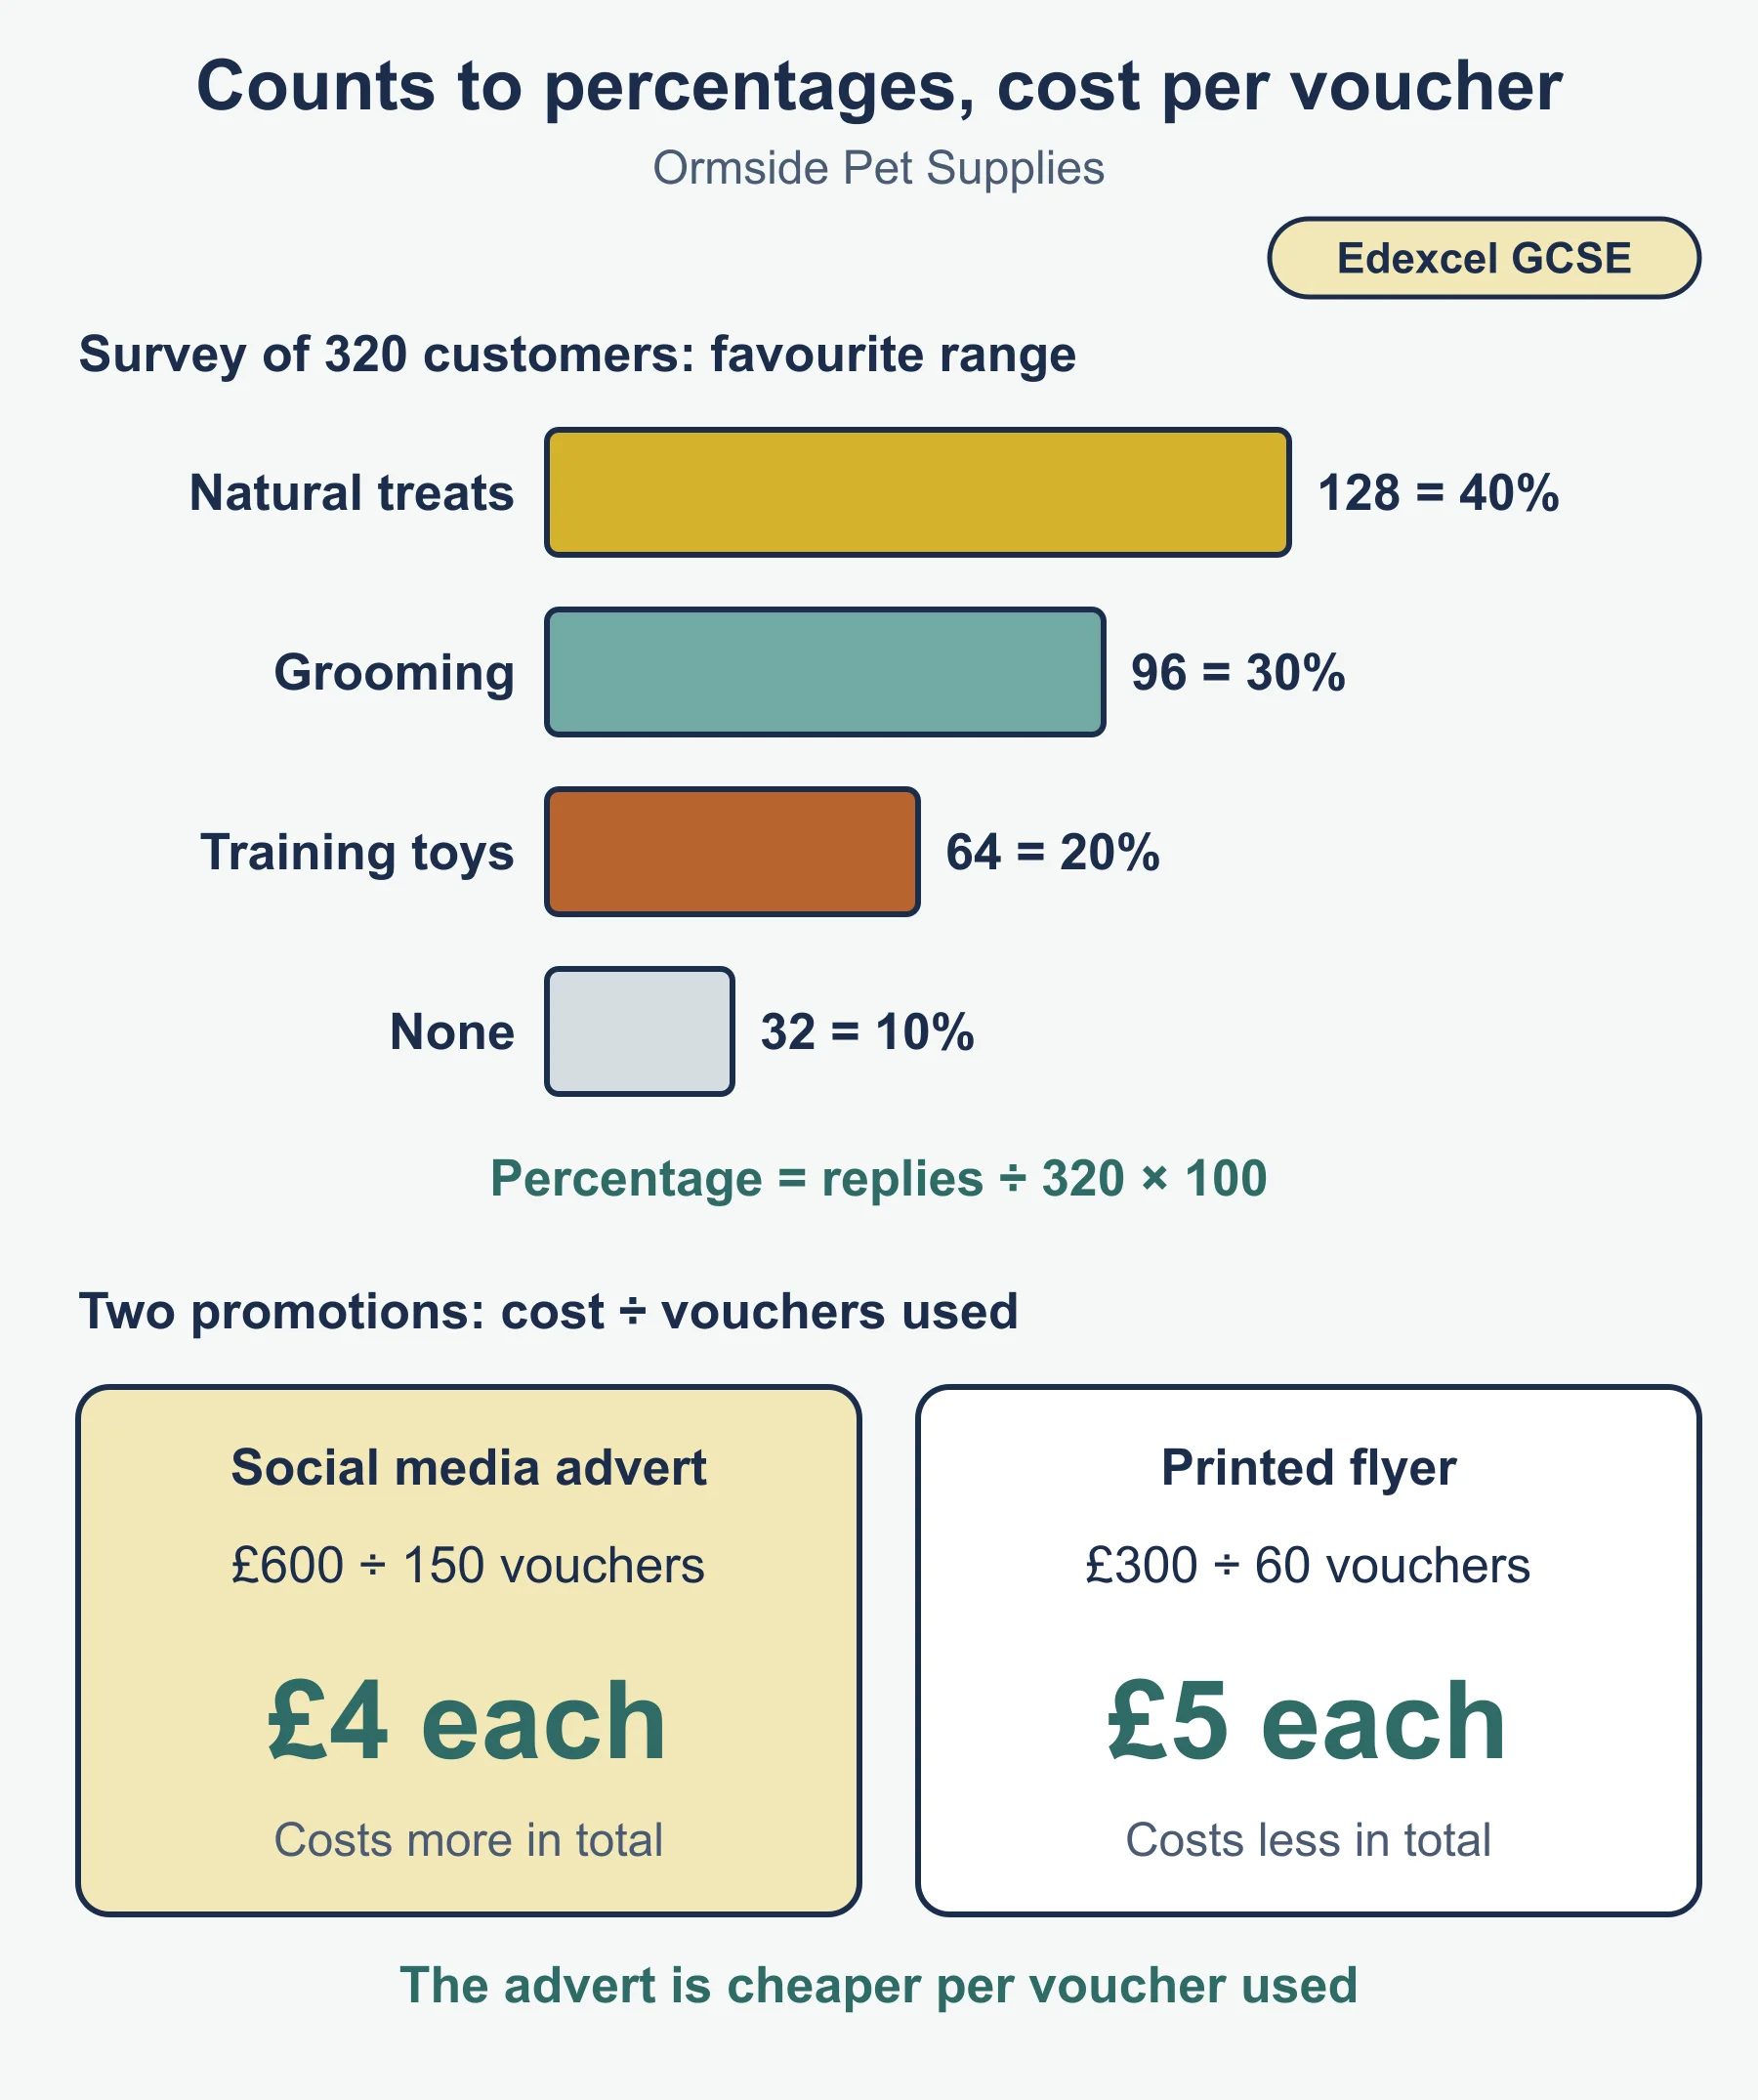
Worked example. Ormside Pet Supplies asks 320 customers which new range they want most.
| Range | Replies | Percentage |
|---|---|---|
| Natural treats | 128 | 40% |
| Grooming | 96 | 30% |
| Training toys | 64 | 20% |
| None | 32 | 10% |
Percentage = replies / 320 × 100. The treats range is the most popular choice, and 90% want at least one of the ranges. The shop also tested two promotions:
| Promotion | Cost | Vouchers used | Cost per voucher used |
|---|---|---|---|
| Social media advert | £600 | 150 | £4 |
| Printed flyer | £300 | 60 | £5 |
The advert cost more in total but less per voucher used (£600 / 150 = £4 against £300 / 60 = £5). Cautions: the people surveyed are existing customers, so they may not represent shoppers who have never visited, and saying what they want in a survey is not the same as buying.
5. Market data
Market data describes the whole market. The specification names market share, changes in costs and changes in prices.
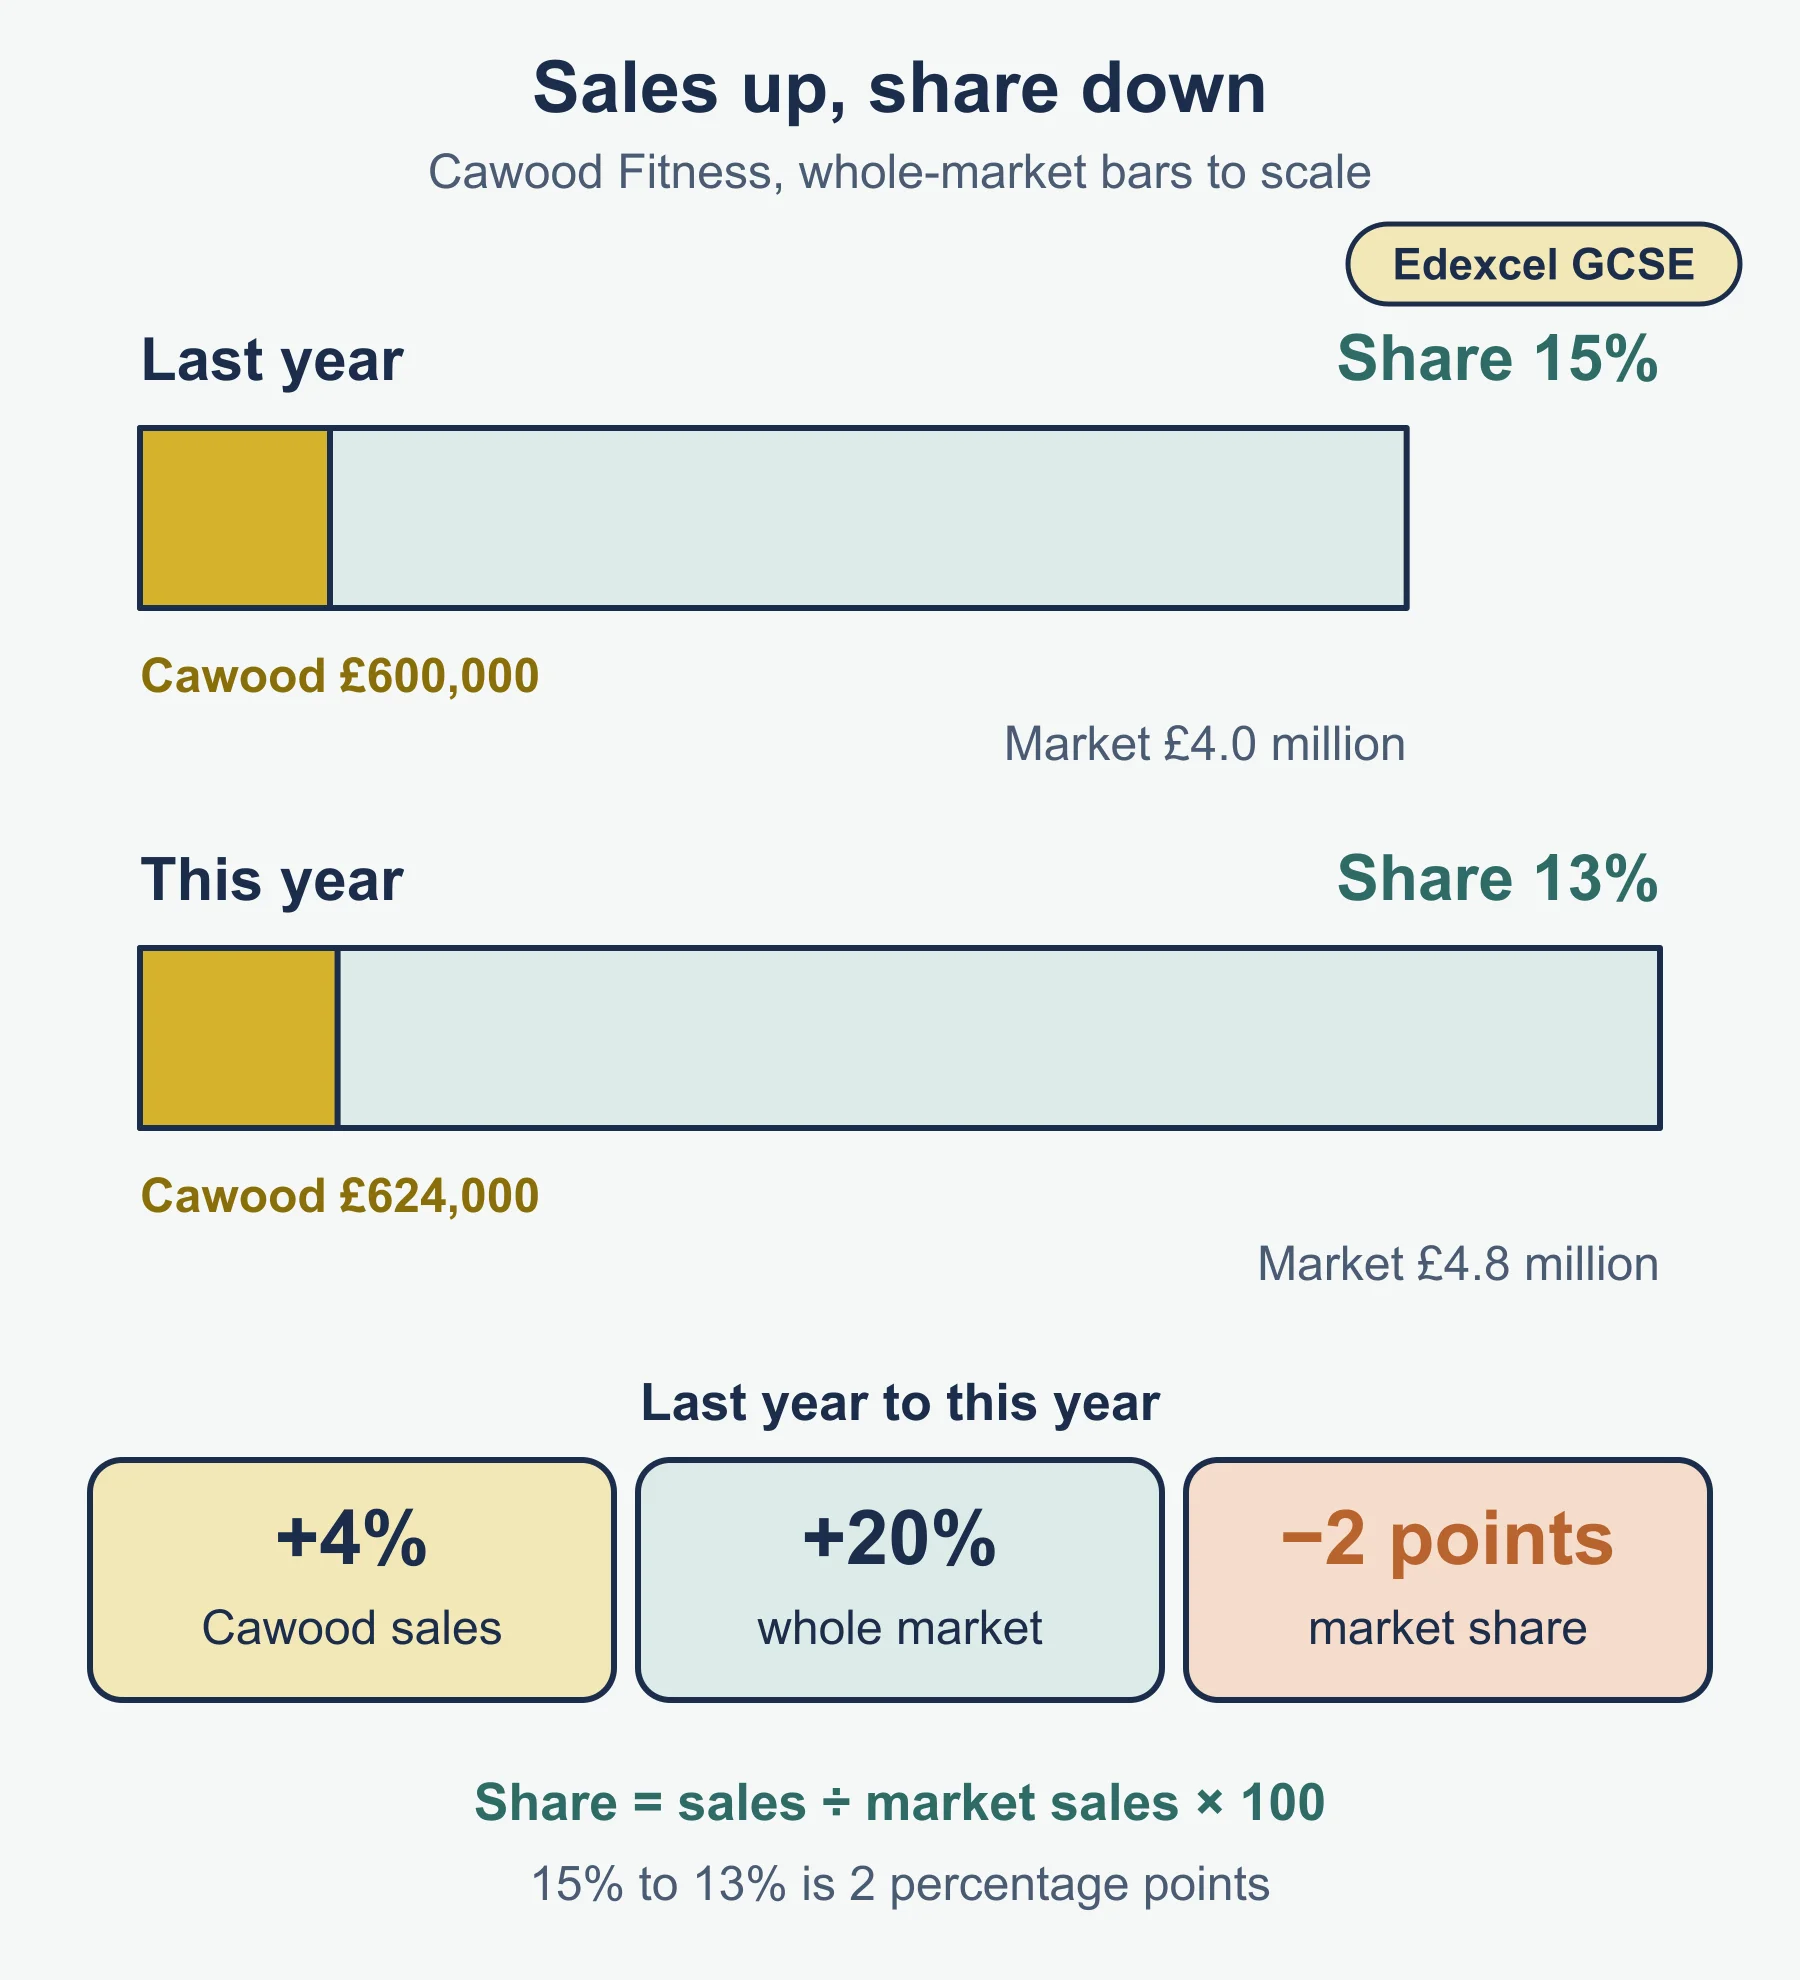
Market share (%) = the business’s sales / total market sales × 100. This is the standard form; it is not in Appendix 3.
Worked example. Cawood Fitness sells memberships in a town gym market.
| Last year | This year | |
|---|---|---|
| Cawood sales | £600,000 | £624,000 |
| Total market sales | £4,000,000 | £4,800,000 |
| Market share | 15% | 13% |
Cawood’s sales grew 4%, which looks healthy, but the market grew 20%, so its share fell by two percentage points. Competitors are growing faster. Growing sales and a falling share can happen together.
Changes in costs and prices. A supplier raises the price of a part from £2.50 to £2.75: (2.75 − 2.50) / 2.50 × 100 = 10% increase. A product sells at £6.00 and uses one part, so the profit per unit before other costs falls from £3.50 to £3.25, a 7.1% fall, if the business absorbs the rise. If it raises the price by 25p to £6.25 (a 4.2% rise), profit per unit is protected but customers may buy less or switch. Market data on competitor prices helps judge which risk is bigger.
6. Use and limitations of financial information
Understanding business performance. Financial information shows whether a business is profitable, how profit has changed, how margins compare with last year, with a target or with a competitor, and whether cash is running short.
Making business decisions. It helps a manager choose between investments (ARR), set prices, decide on borrowing (cash-flow forecast) and check whether a decision worked.
Limitations.
- It looks backwards. Accounts record what happened, and conditions may have changed.
- Forecasts are estimates. The press profits above are expected, not certain.
- It leaves out non-financial factors. Staff morale, customer loyalty, brand reputation and the environment do not appear in a margin.
- It does not explain causes. The studio’s fall in gross profit margin tells it something went wrong, not what.
- Comparisons can mislead. Different sizes, products or accounting periods make two sets of figures hard to compare.
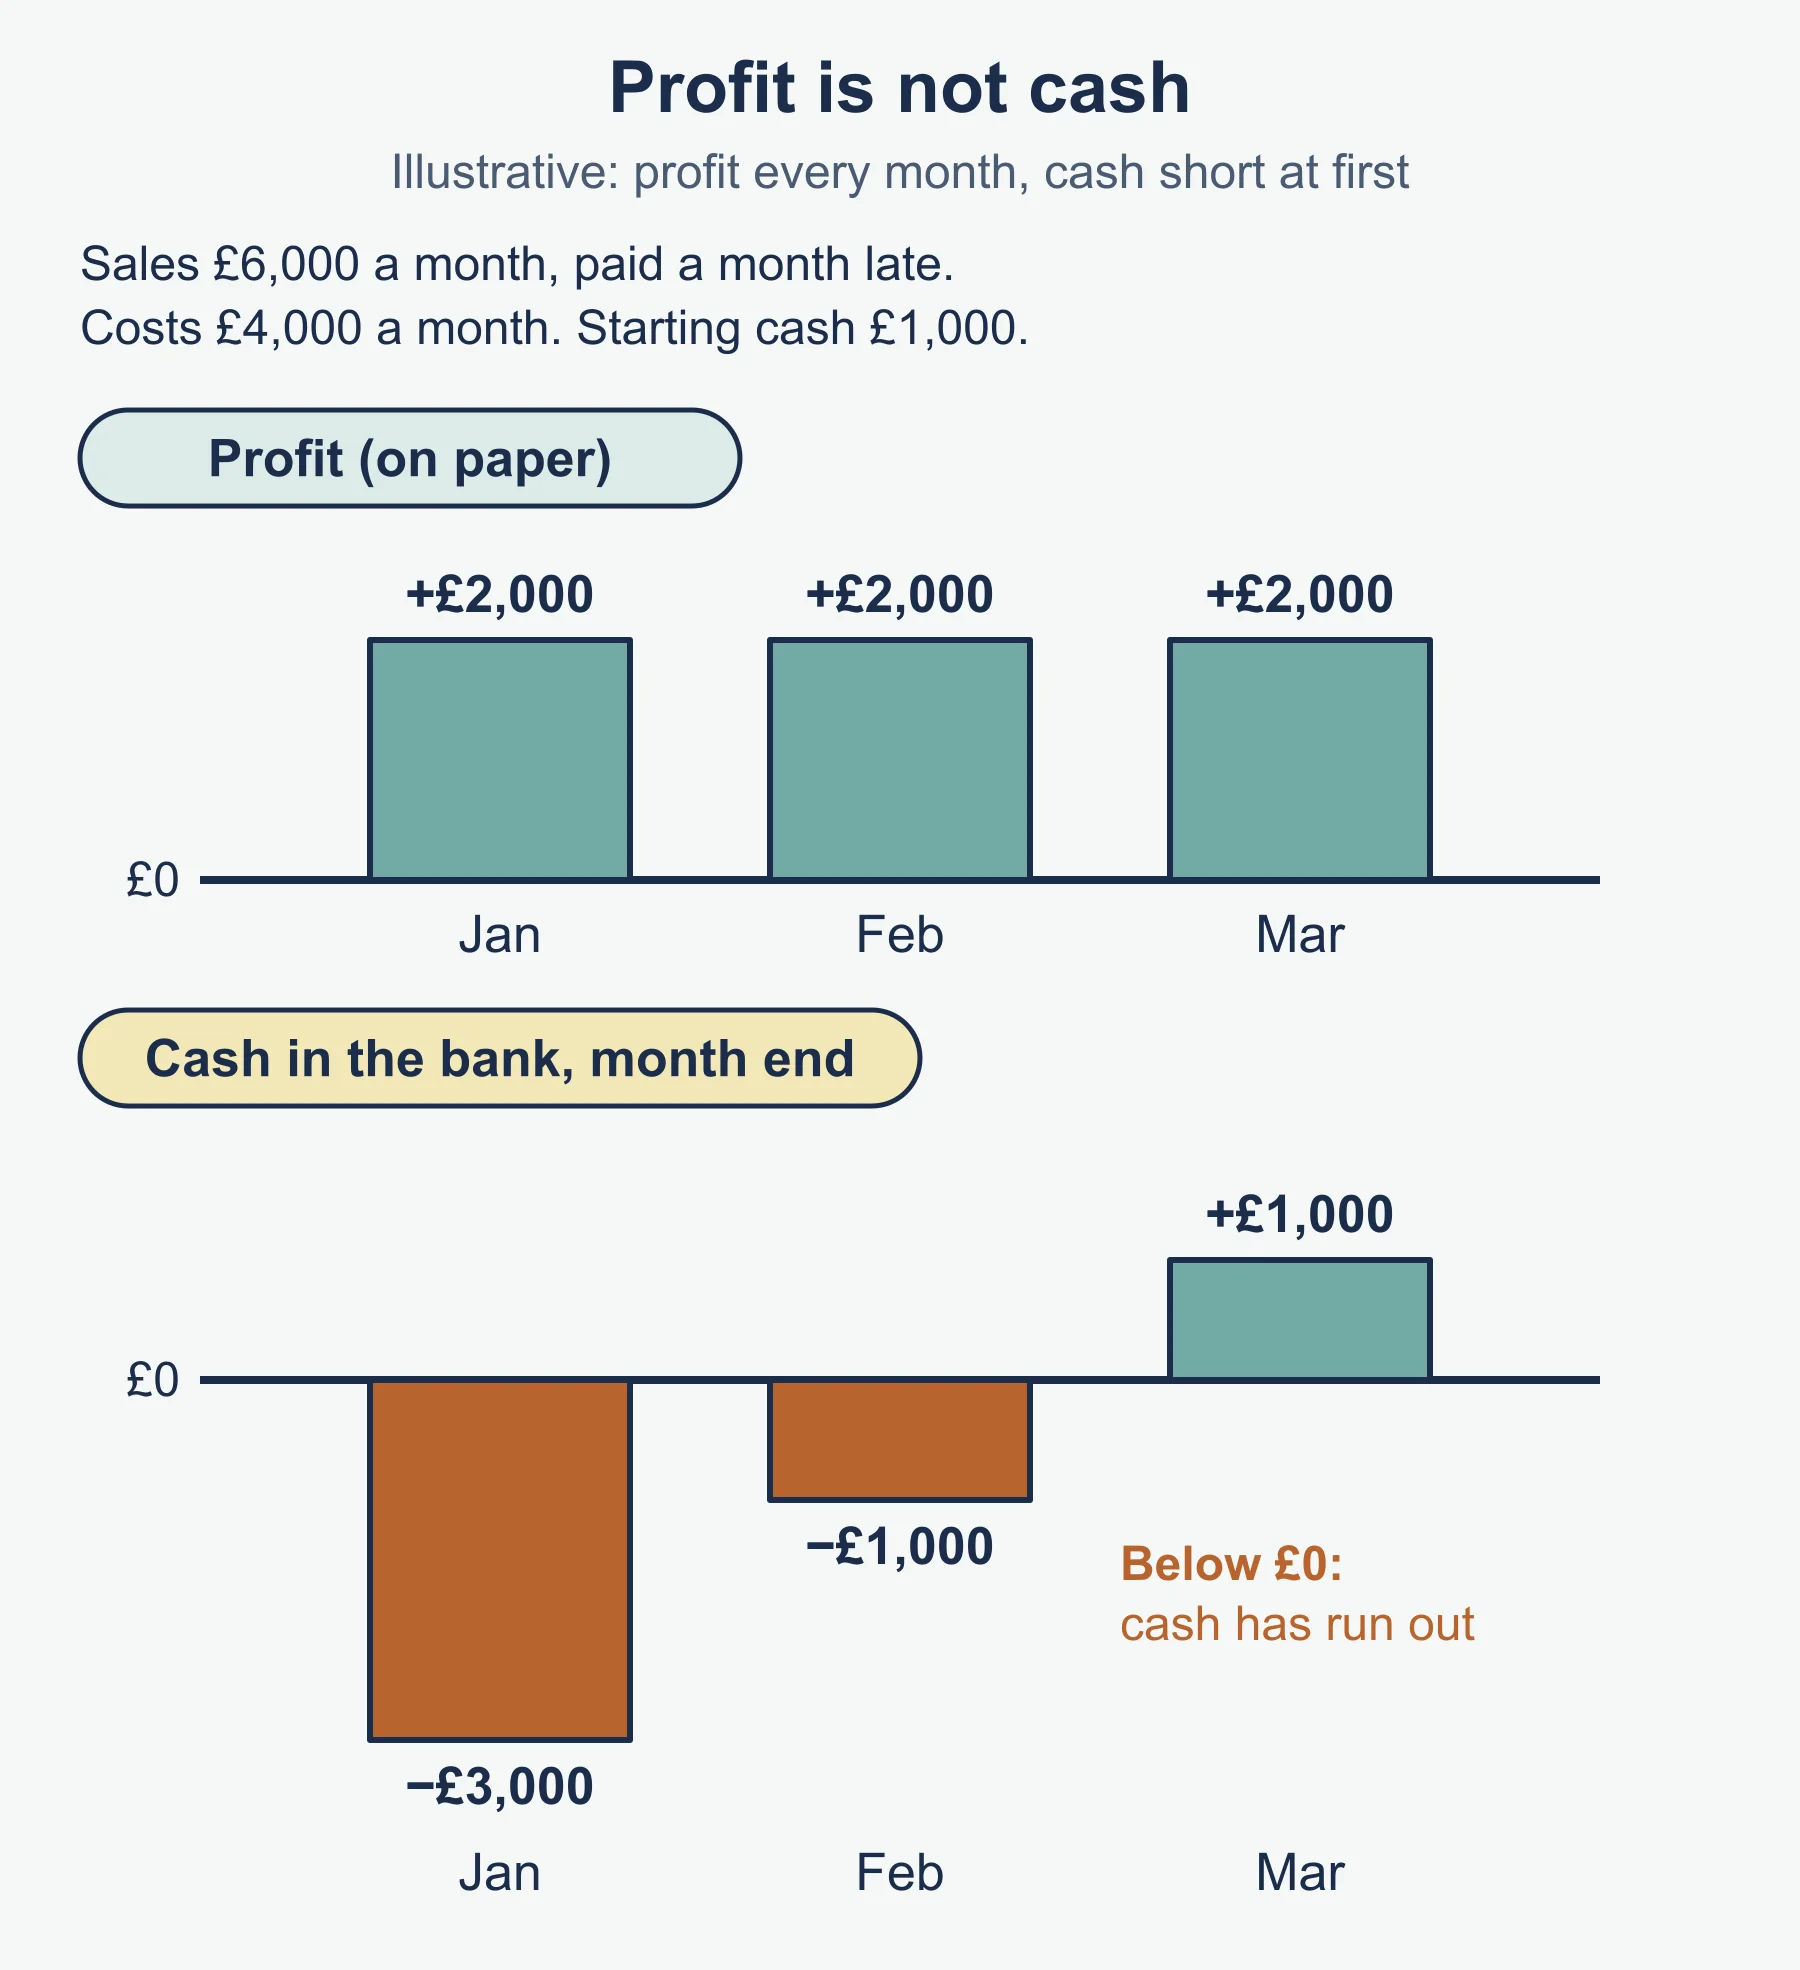
- Profit is not cash. A profit figure says nothing about when money arrives.
Worked “evaluate” structure. Should Pennine Print Studio buy the press? For: ARR of 25% beats 22.5%, and profits rise each year. Against: the profits are forecasts, the £60,000 may strain cash (the forecast shows a negative balance in February), and the margin trend suggests costs are already rising. Judgement: buy only if it can be financed without a cash shortfall and if the cost of sales problem is understood first. A conclusion that picks a side and names the deciding factor is what the command word asks for.
Common errors
- Reading a bar chart without checking where the axis starts.
- Dividing a percentage change by the new figure instead of the original.
- Treating a rise in sales revenue as a rise in profit.
- Confusing a percentage with a percentage point: 15% to 13% is a fall of 2 percentage points but a fall of 13.3% in the share itself.
- Calling a survey result a fact about all customers.
- Listing limitations with no link to the business in the question.
Frequently asked questions
How do you read a pie chart in a business exam? A sector’s share is its angle divided by 360, as a percentage. A 90° sector of £72,000 revenue is 25%, or £18,000.
Why should you check the axis of a bar chart? If the vertical axis does not start at zero, small gaps between bars can look much larger than they are. Read the title, axis labels and units before reading any values.
What level of maths is needed for Edexcel GCSE Business? The 1BS0 specification says the minimum level of mathematics in the papers is equivalent to Key Stage 3, and quantitative questions are always set in a business context.
How should you use data in an answer? Quote the figure from the case, work out what it means, such as a change, a share or a ratio, and then say what the business should do or what it risks.
Official syllabus
Pearson Edexcel Level 1/Level 2 GCSE (9-1) in Business (1BS0), Specification, Issue 2, July 2022, published by Pearson Education Limited. Theme 2, Topic 2.4 Making financial decisions, item 2.4.2. Appendix 1 (command words), Appendix 2 (quantitative skills) and Appendix 3 (formulae) are used where noted.
Get free revision emails (optional)
Occasional emails with practice questions, worked explanations and links to free resources for the qualification and subjects you choose. No spam, and you can unsubscribe from any email. The free tools on this site never need an email.
Related resources
-
Practice questions
Edexcel GCSE Business: Interpreting quantitative business data (1BS0) – Practice Questions
Original practice questions with worked answers on graphs, financial, marketing and market data and the limits of financial information.
Business · Pearson Edexcel · GCSE
Try questions -
Revision notes
Edexcel GCSE Business: Interpreting quantitative business data (1BS0) – Revision Notes
Condensed revision notes on graphs, financial, marketing and market data and the limits of financial information, for Edexcel GCSE Business.
Business · Pearson Edexcel · GCSE
Revise topic -
Study guides
Edexcel GCSE Business: Business calculations (1BS0)
Study guide to gross profit, net profit, profit margins and average rate of return for Pearson Edexcel GCSE Business 1BS0, Theme 2 topic 2.4.1.
Business · Pearson Edexcel · GCSE
Read guide
Related articles
-
teaching
A Level tuition in Dubai: Cambridge or Pearson Edexcel International A Level?
Schools in Dubai and Abu Dhabi teach either Cambridge International AS & A Level or Pearson Edexcel International A Level. How the two are structured, why it matters for tuition, and how online classes from Lahore work.
9 October 2026
-
curriculum guides
Choosing subjects at IGCSE and A Level
How subject choices at 14 and 16 affect university options later, and how to keep pathways open without overloading a timetable.
28 July 2026
Studying this with a teacher
Working through Business GCSE?
This page is free and stays free. If you would rather be taught it, Marlbridge runs Business classes one-to-one and in small groups of up to 15, online in your own time zone. The first trial class is free. WhatsApp replies within an hour (8am–11pm Pakistan time, every day); email the same day.
Pearson Edexcel Business teachers at Marlbridge

