
Revision Notes
Edexcel GCSE Business: Interpreting quantitative business data (1BS0) – Revision Notes
Condensed revision notes on graphs, financial, marketing and market data and the limits of financial information, for Edexcel GCSE Business.
- Subject
- Business
- Level
- GCSE
- Topic
- Making financial decisions
- Author
- Marlbridge Academic Team
- Updated
- Reviewed by
- Asif Iqbal (what this means)
Aligned to Pearson Edexcel GCSE Business (1BS0), Issue 2, July 2022. Official specification .
Syllabus page (what it covers and how it is assessed): Pearson Edexcel GCSE Business.
Syllabus points this page covers
1BS0
- 2.4 Making financial decisions (whole topic)
- 2.4.2 Understanding business data
Found an error? Report a correction.
Want a teacher for this? Marlbridge teaches Business online. Request a free trial class.
These notes condense Theme 2, Topic 2.4 Making financial decisions, item 2.4.2 of the Pearson Edexcel Level 1/Level 2 GCSE (9-1) in Business (1BS0) specification, Issue 2, July 2022. The specification heads the item “Understanding business performance”. Full explanations and longer worked examples are in the study guide. Test yourself with the practice questions.
Course links: the Business hub, the printable checklist and the free diagnostics. Related pages: aims, revenue, costs and profit and cash flow and sources of finance.
The four kinds of data in 2.4.2
| Kind | What it includes (Appendix 2 names the items in bold) | Typical use |
|---|---|---|
| Graphs and charts | Information from graphs and charts: bar charts, line graphs, pie charts and tables are the usual forms | Spot trends, peaks, shares |
| Financial data | Profit and loss, profitability ratios, average rate of return, cash-flow forecasts | Judge profitability and cash |
| Marketing data | Market research data; results of promotions are a natural further example | Decide product, price, promotion |
| Market data | Market share, changes in costs, changes in prices | Compare with competitors and the market |
The specification says the data is used to support, inform and justify business decisions.
Formulae
| Measure | Formula | Where it comes from |
|---|---|---|
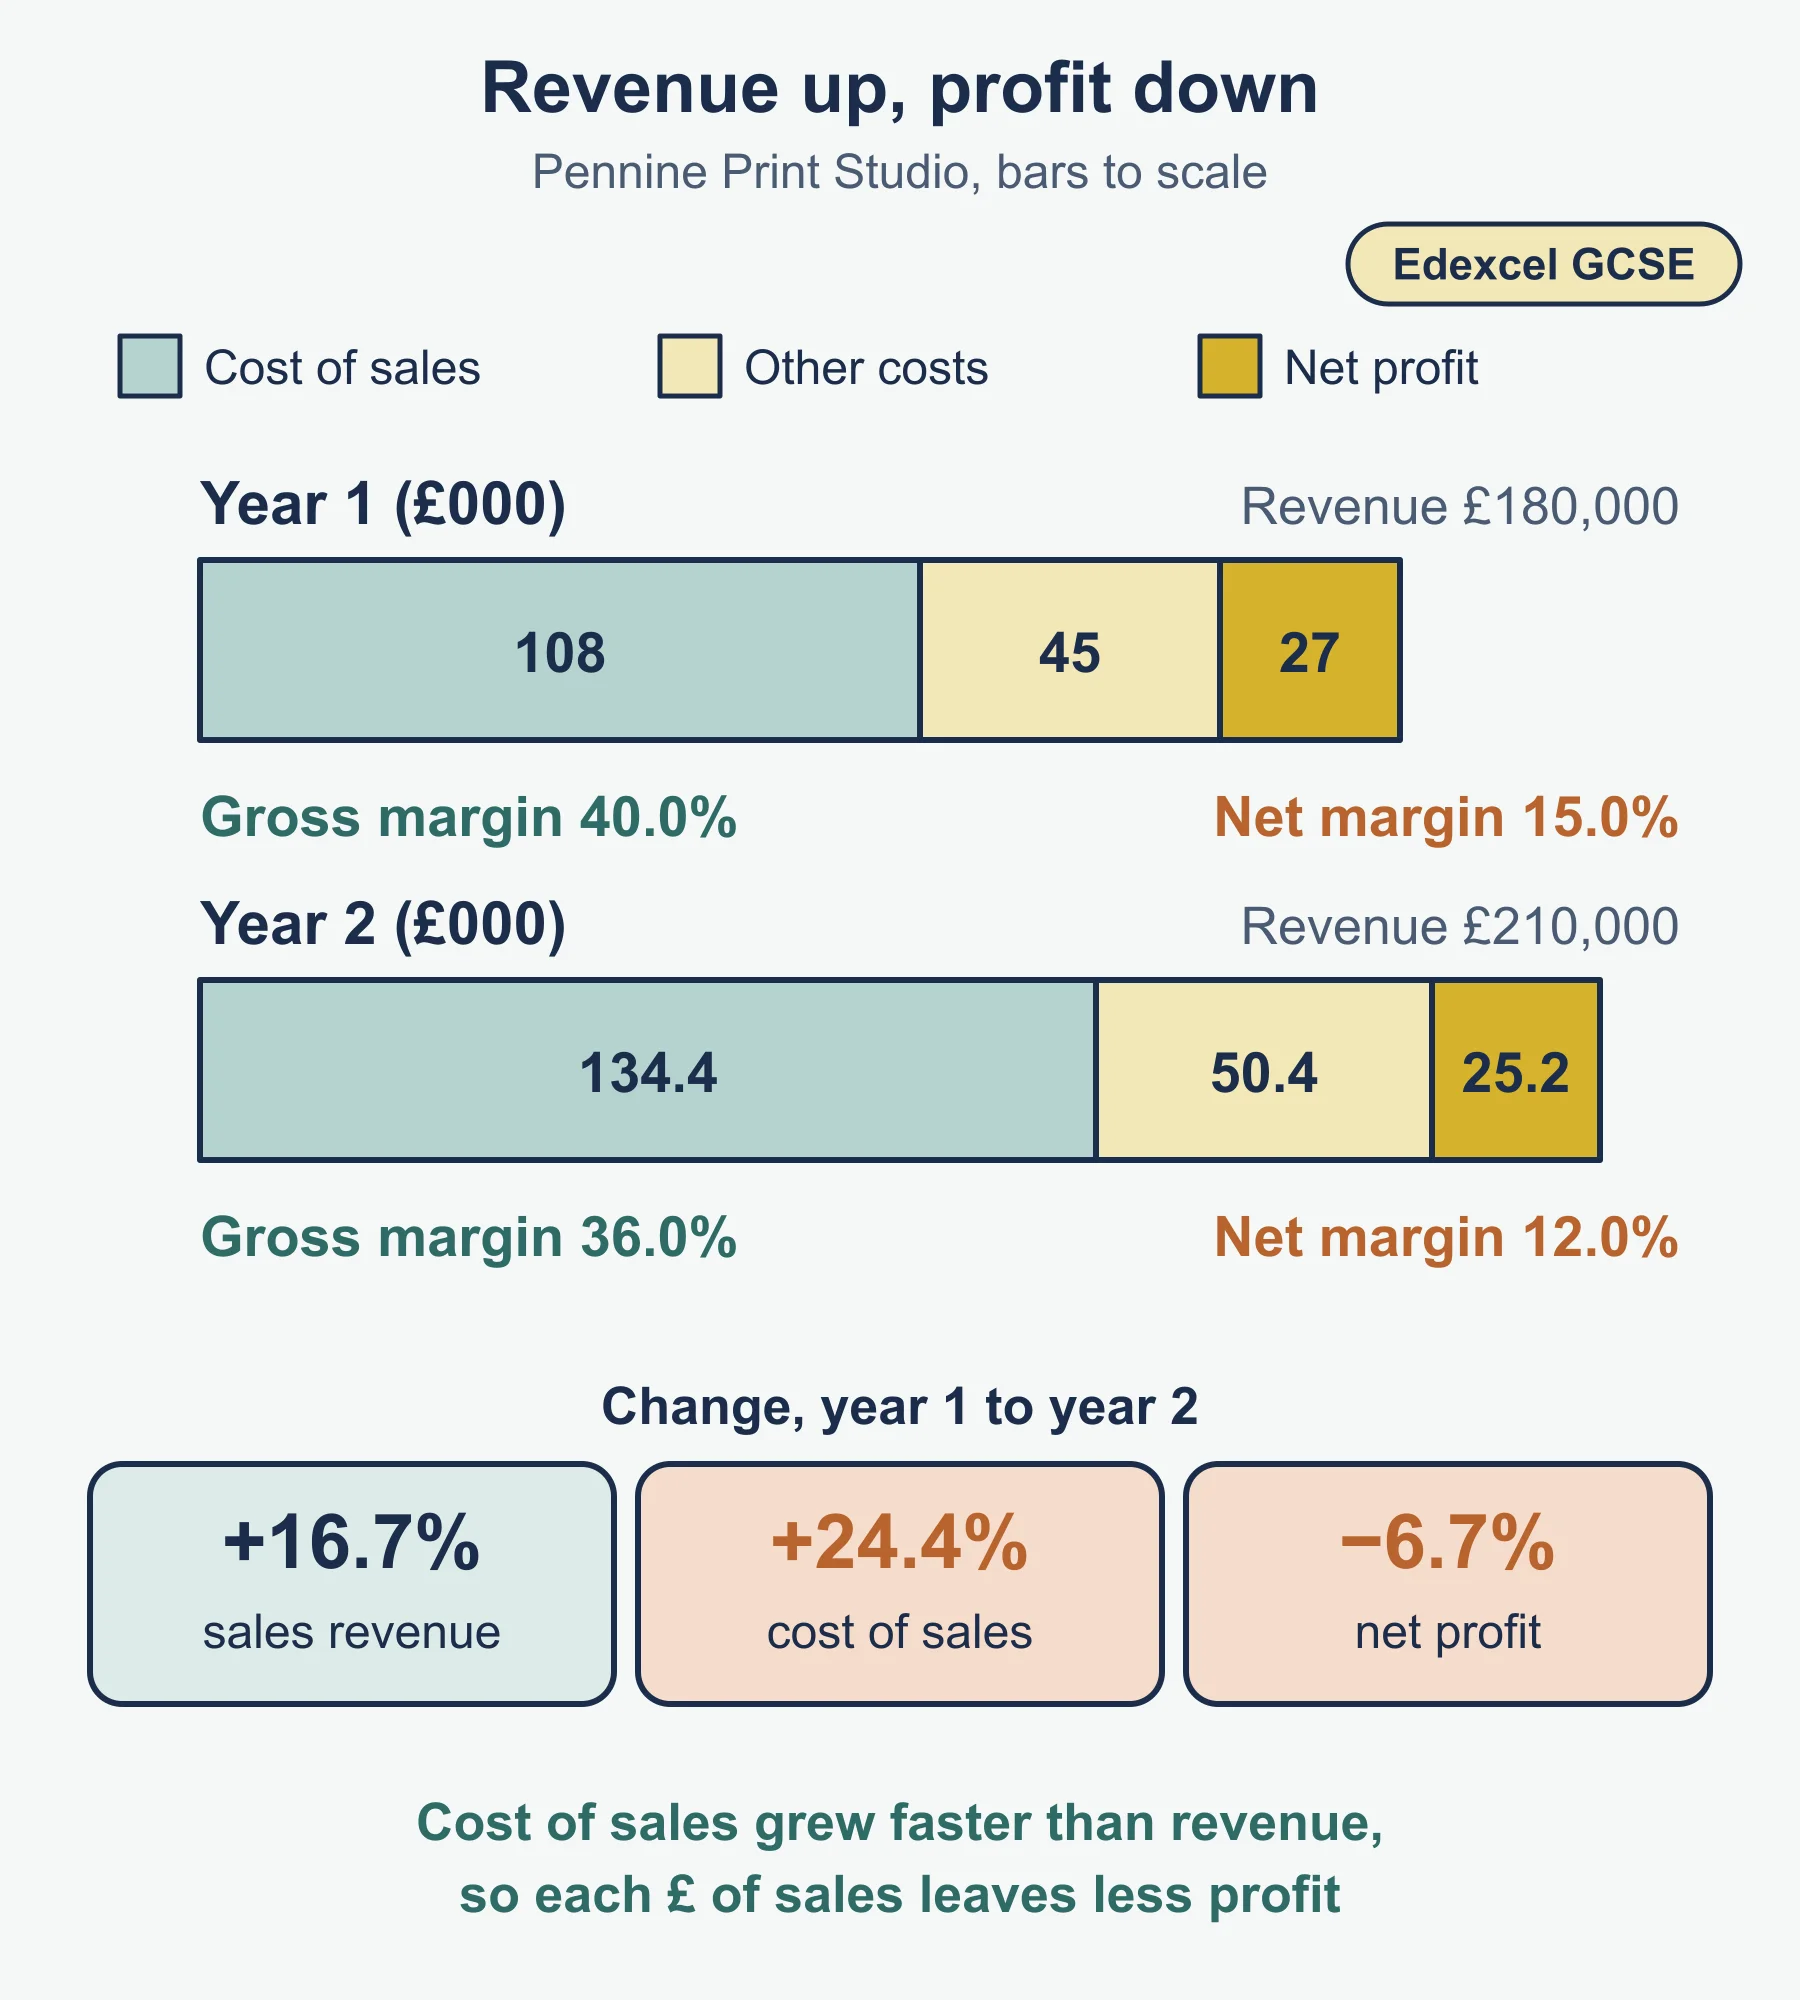
| Gross profit | sales revenue − cost of sales | Appendix 3 |
| Gross profit margin (%) | gross profit / sales revenue × 100 | Appendix 3 |
| Net profit | gross profit − other operating expenses and interest | Appendix 3 |
| Net profit margin (%) | net profit / sales revenue × 100 | Appendix 3 |
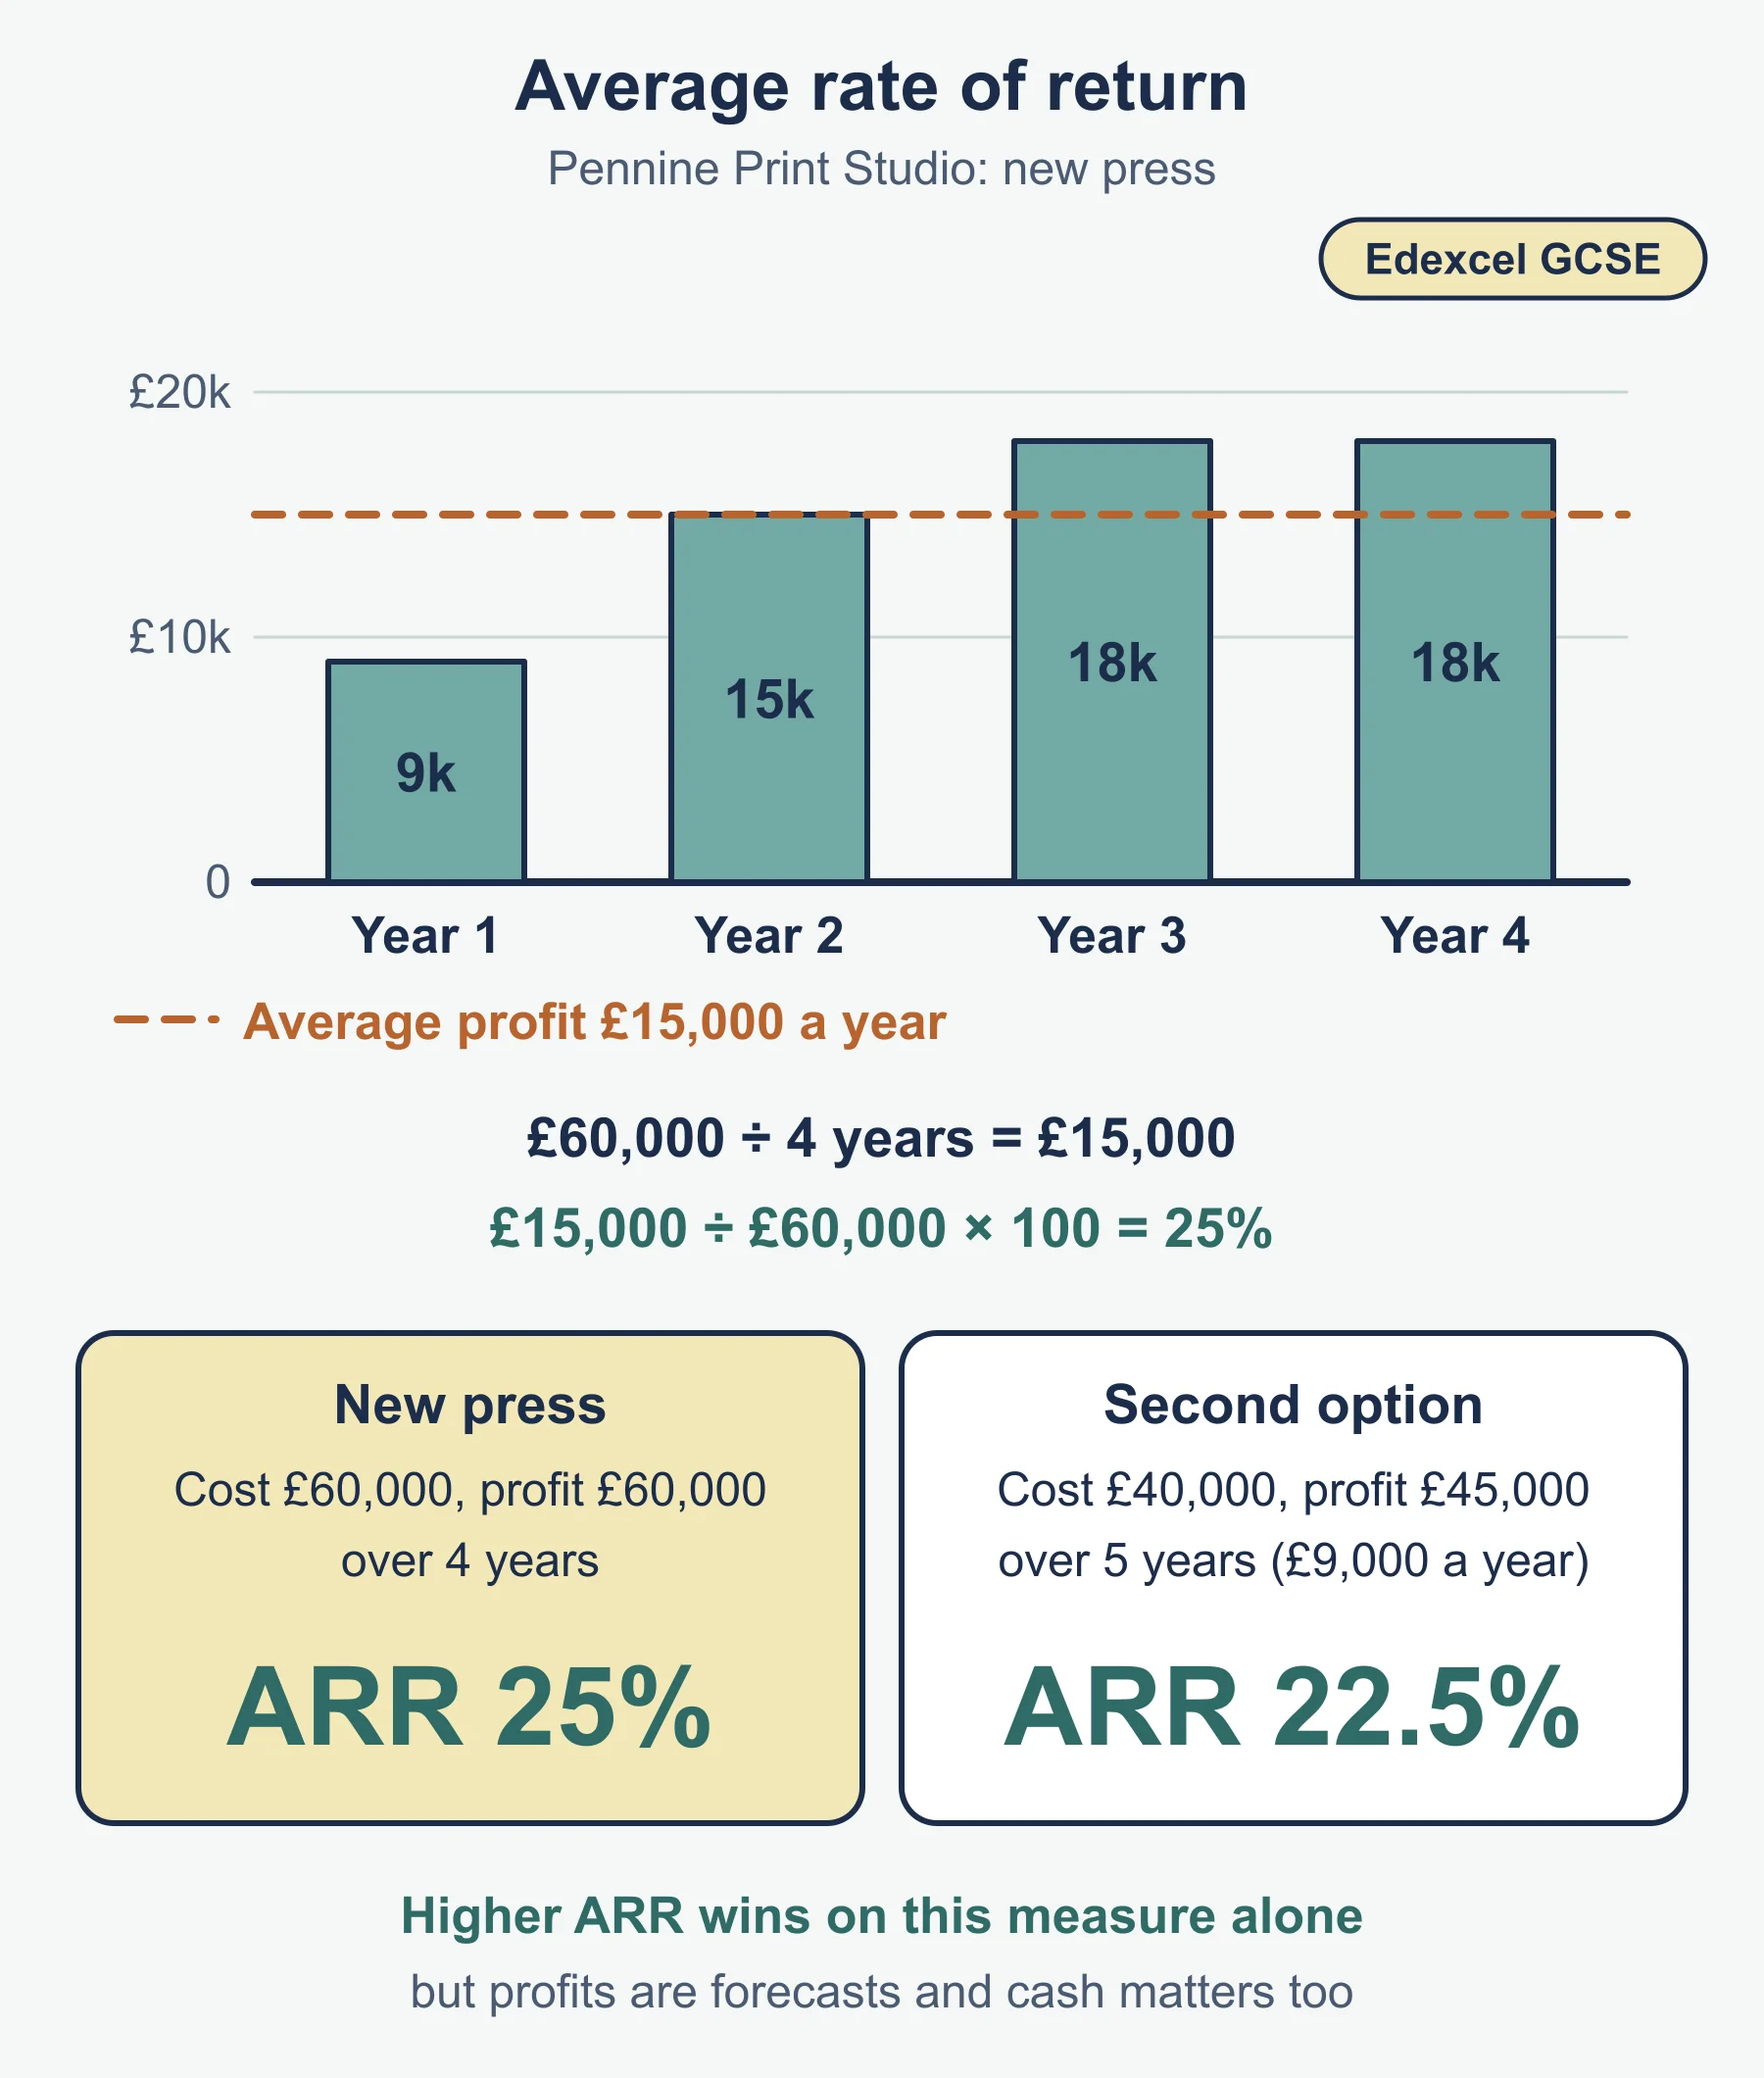
| Average rate of return (%) | average annual profit (total profit / number of years) / cost of investment × 100 | Appendix 3 |
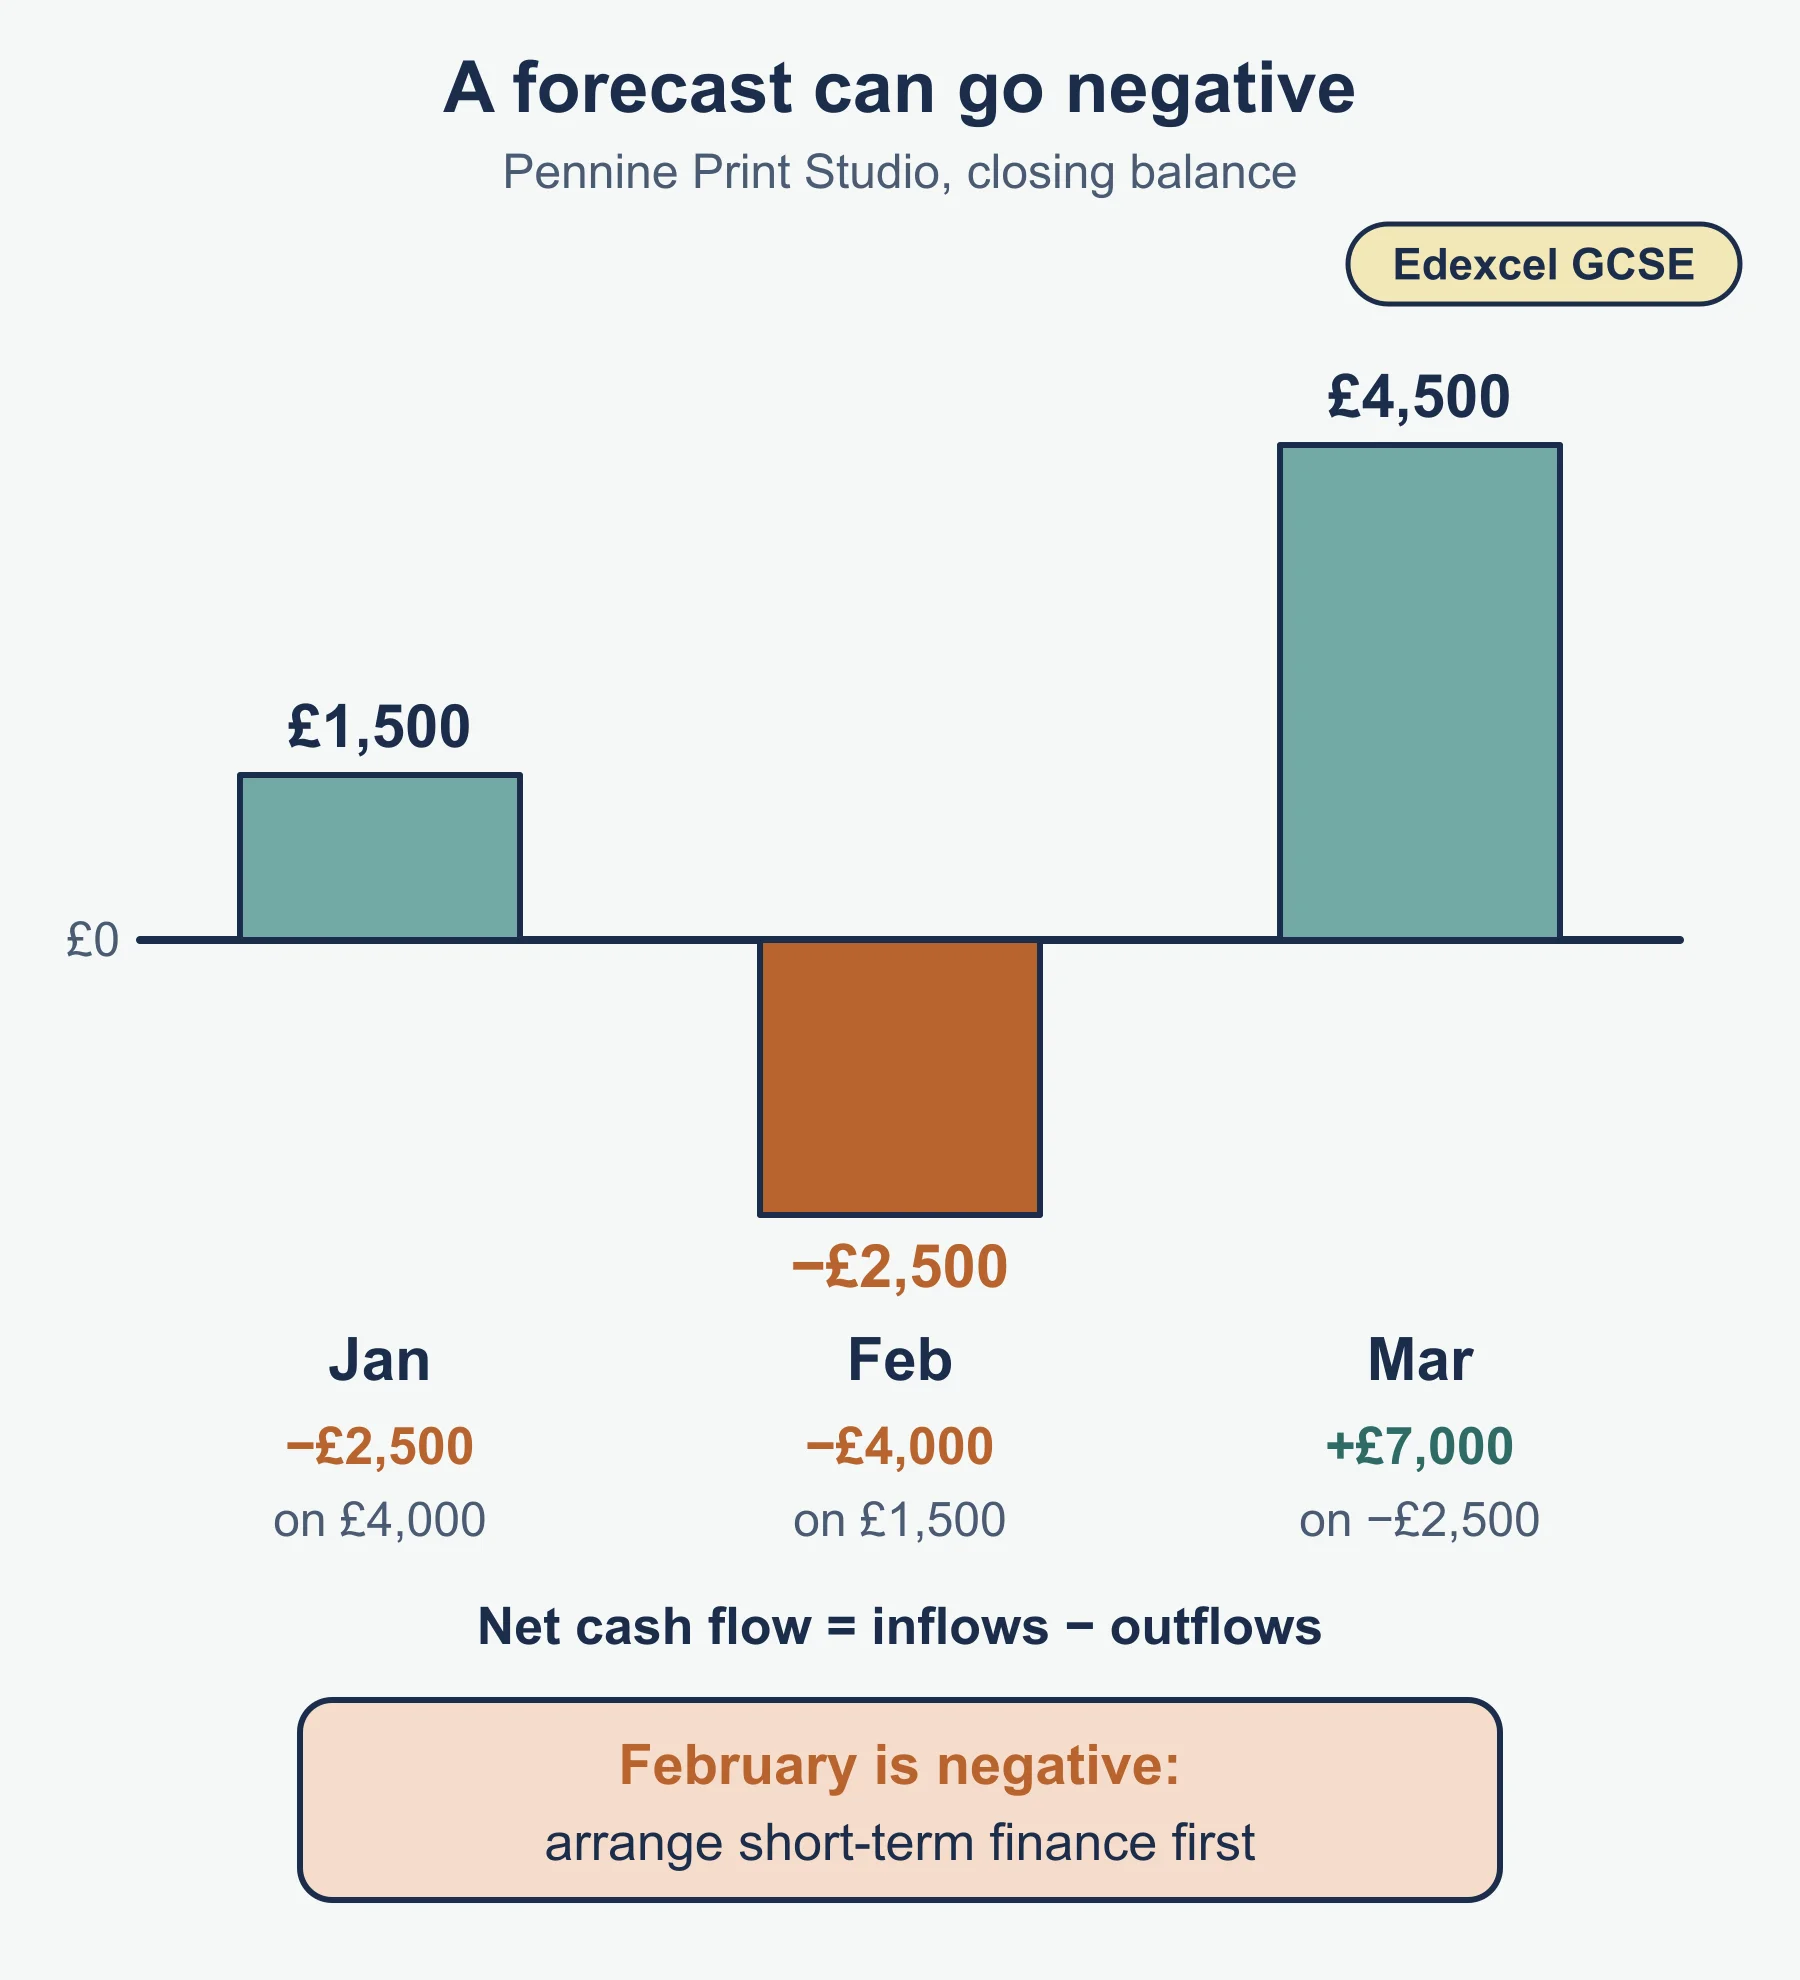
| Net cash flow | cash inflows − cash outflows | Appendix 3 |
| Closing balance | opening balance + net cash flow | Appendix 3 |
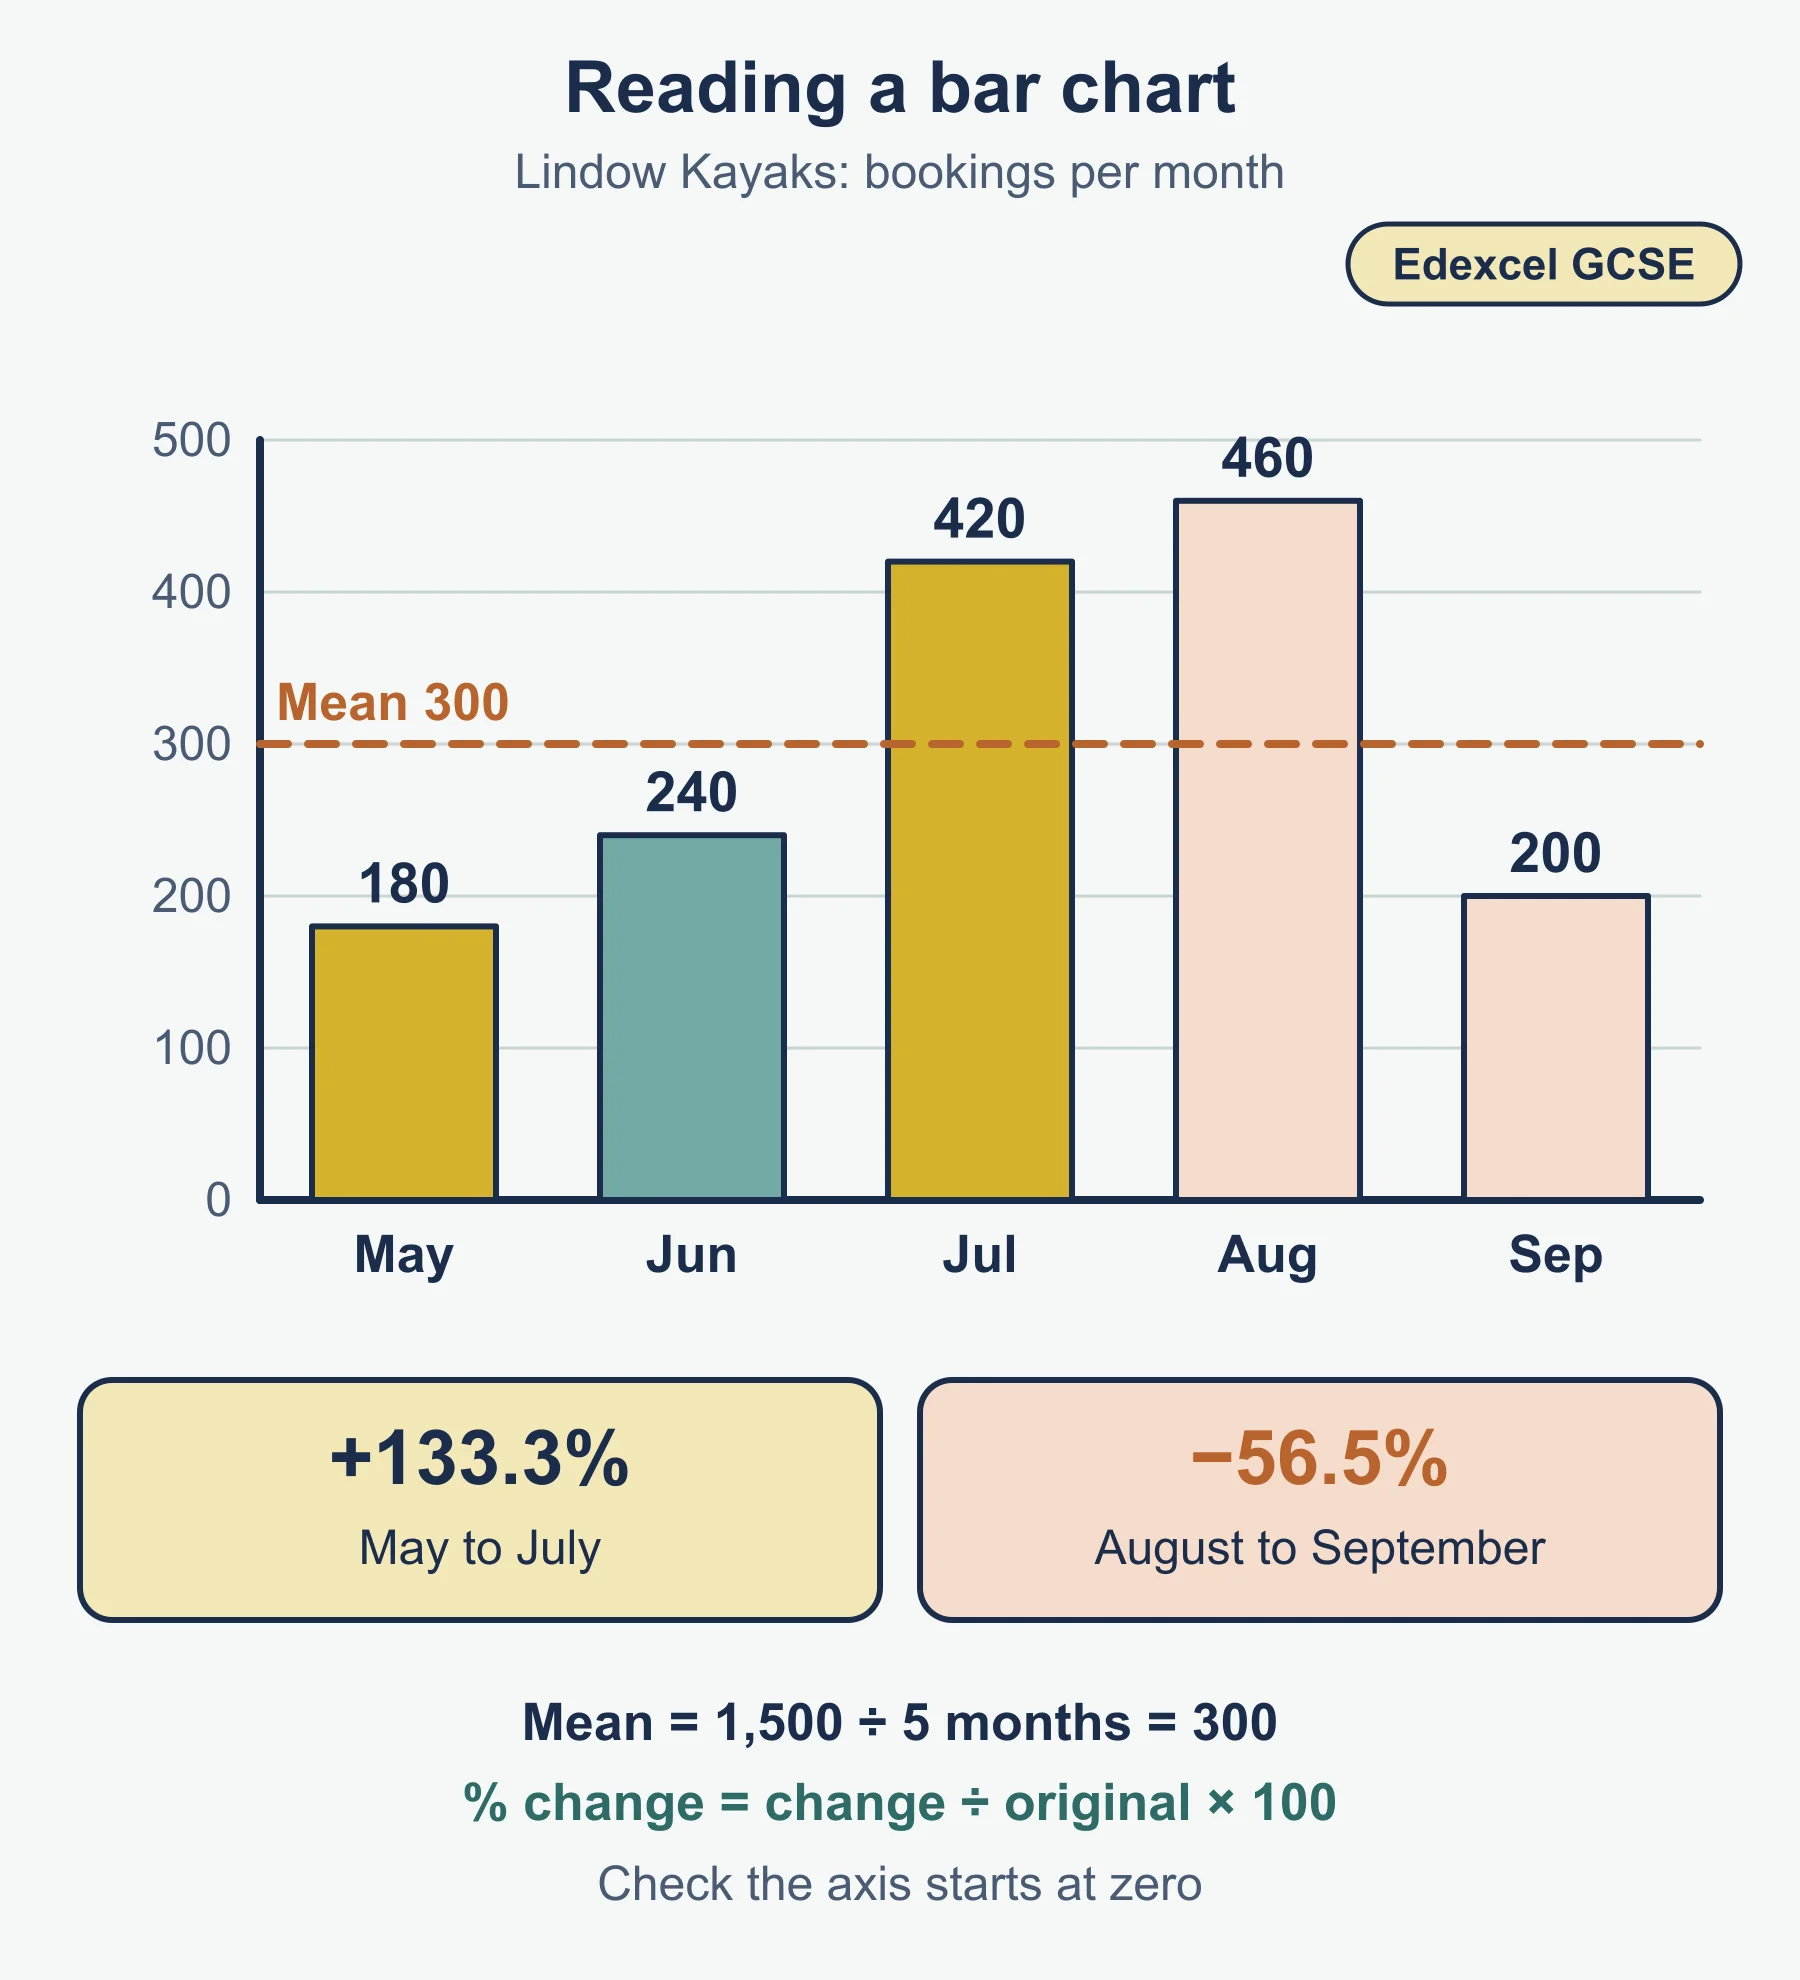
| Percentage change | change / original × 100 | Standard form |
| Mean (average) | total of the values / number of values | Standard form |
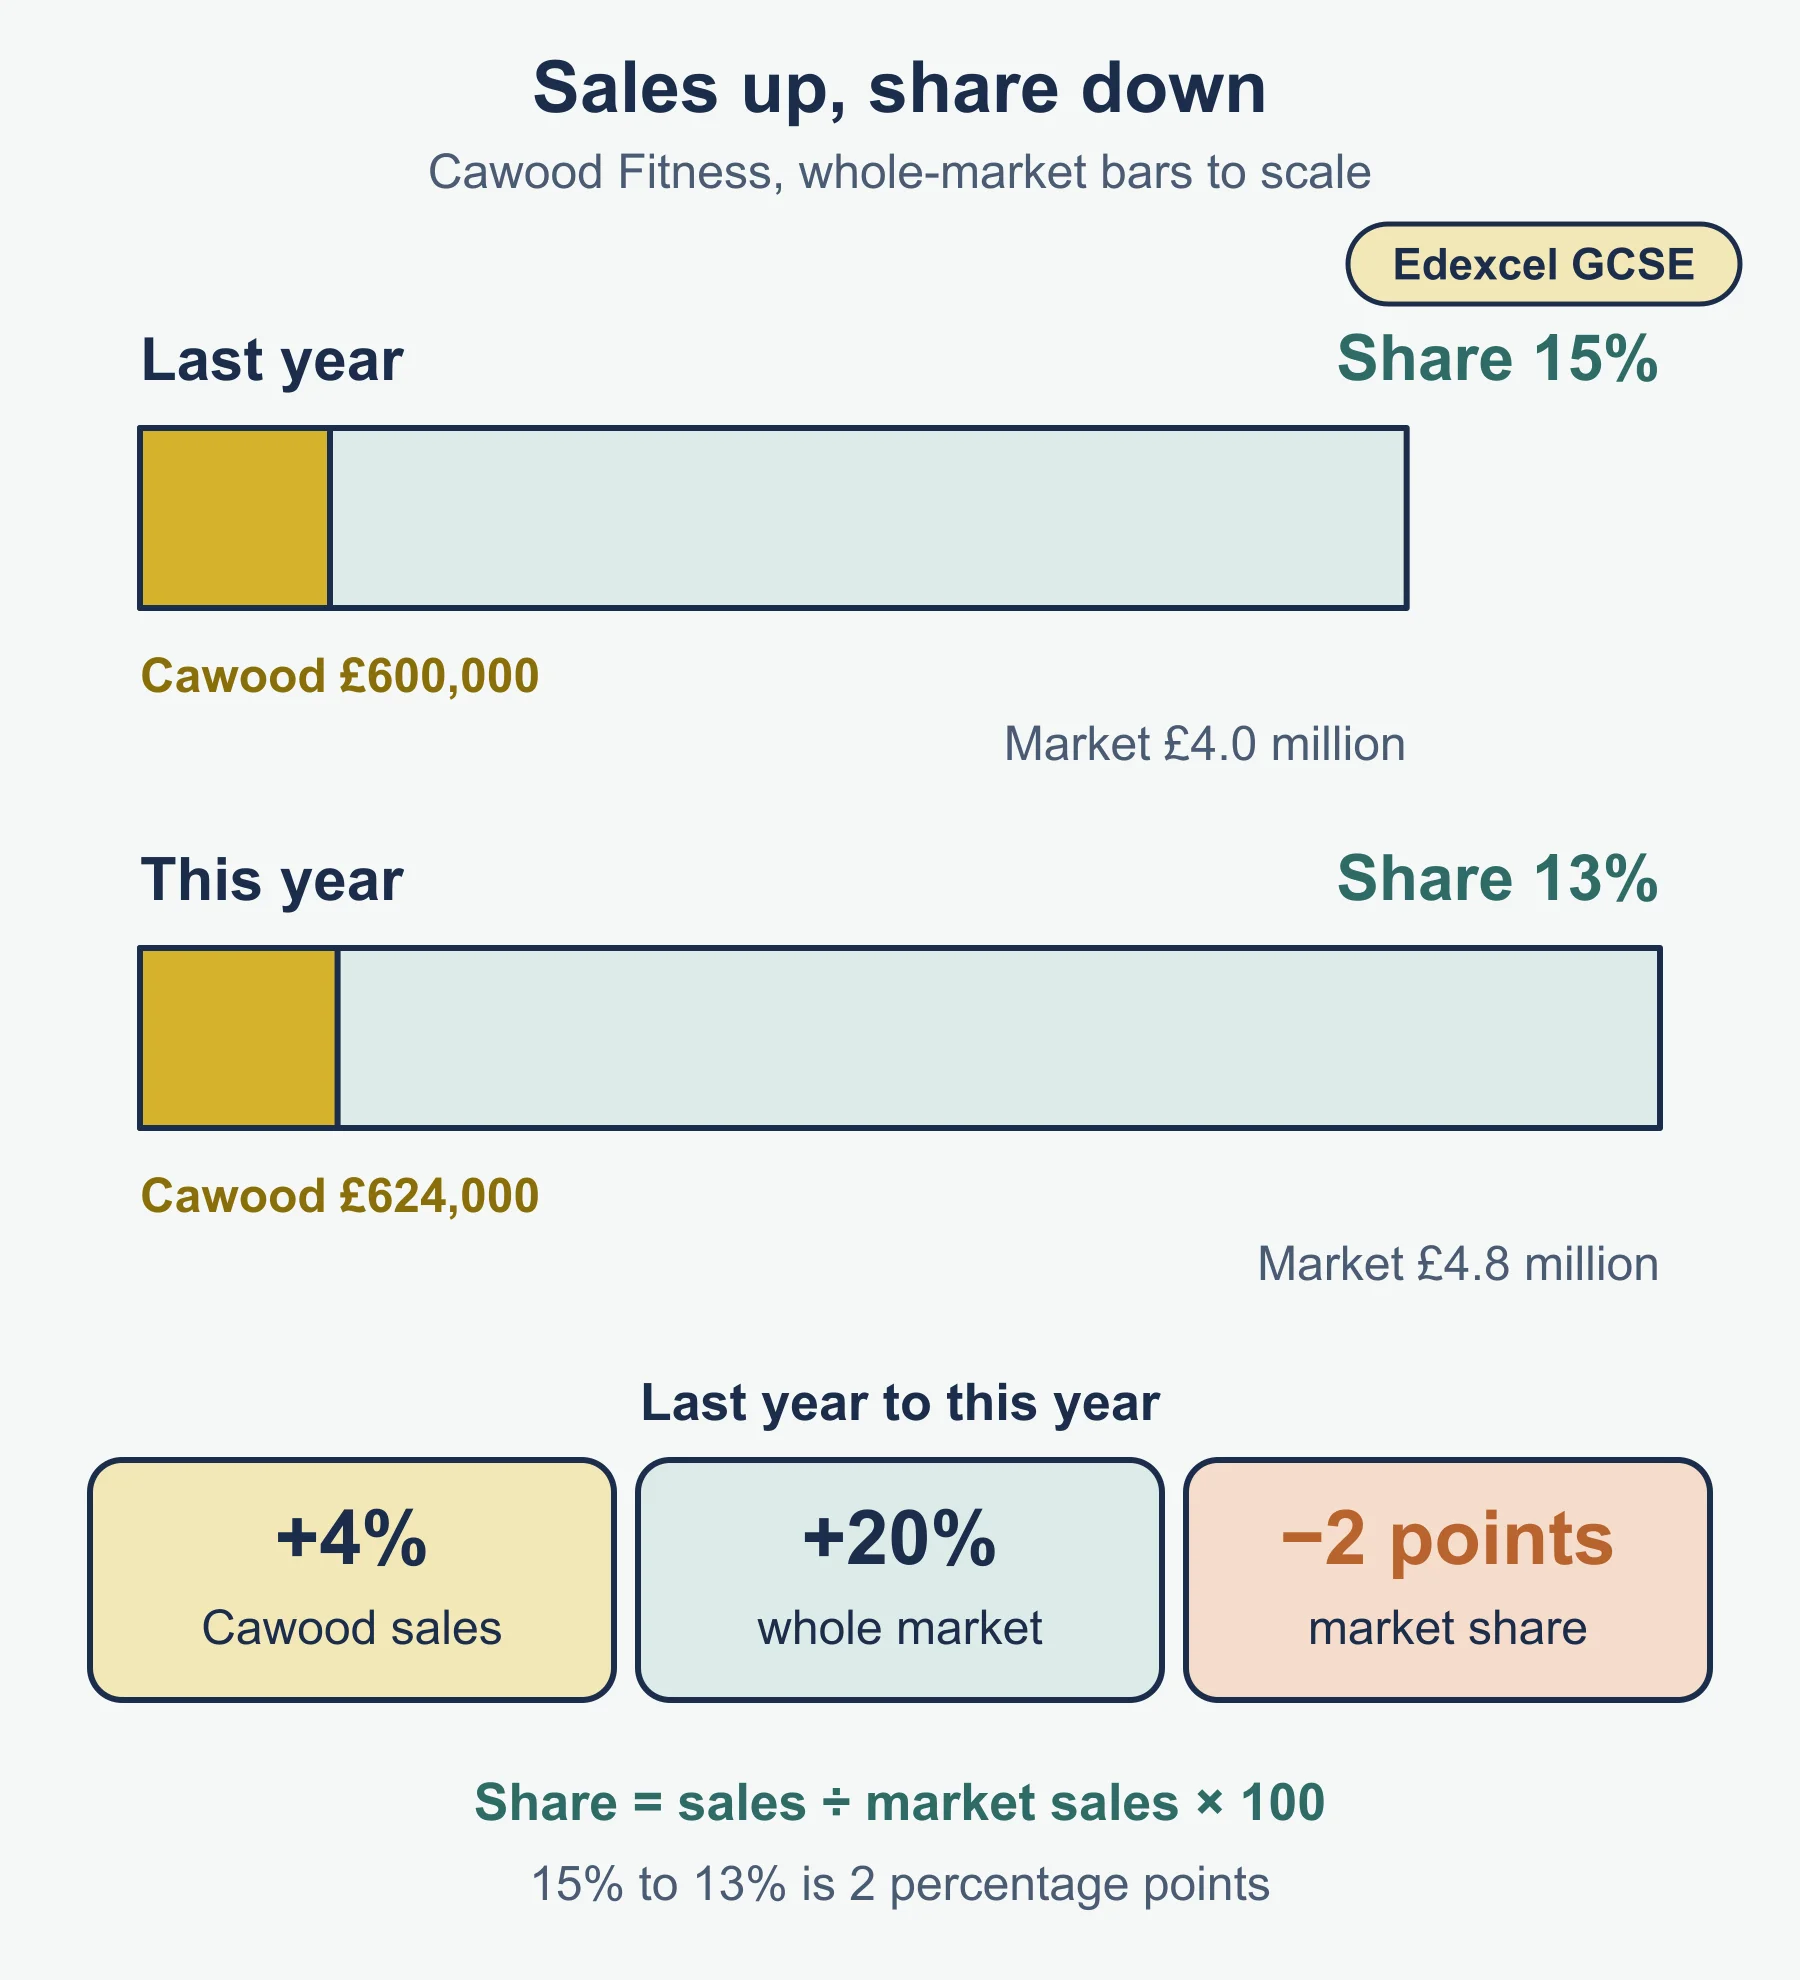
| Market share (%) | business sales / total market sales × 100 | Standard form |
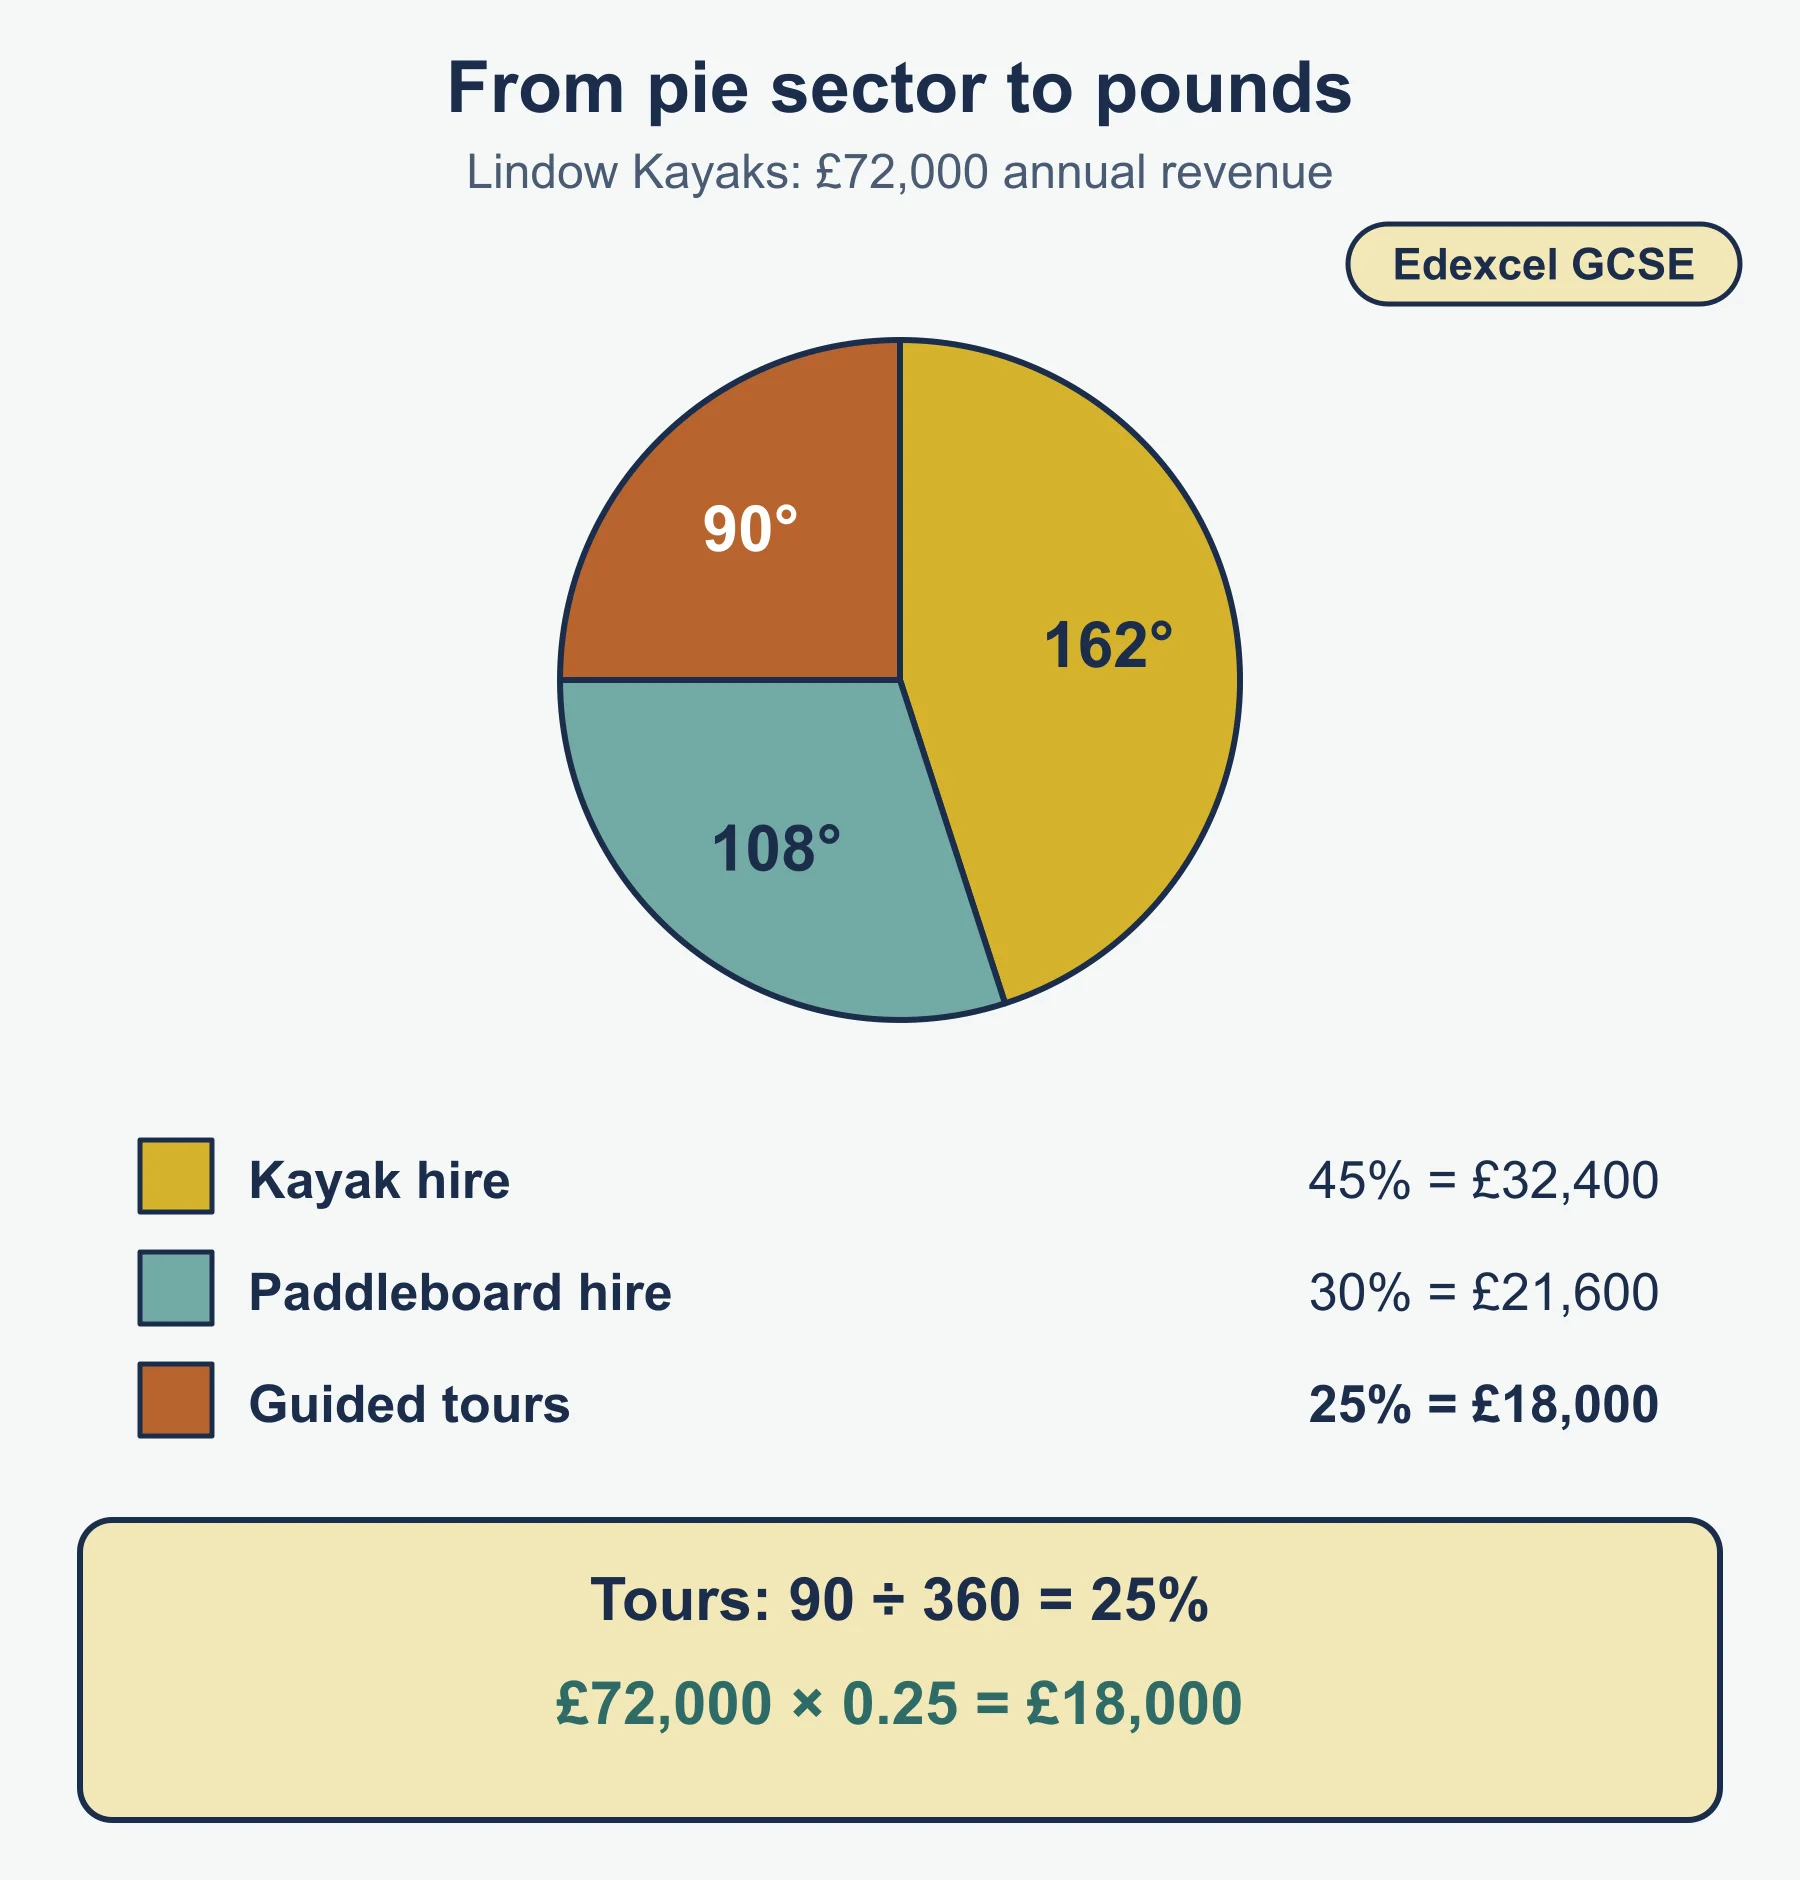
| Pie chart share | sector angle / 360 × 100 | Standard form |
Formulae are not provided in the examinations, and calculators may be used.
Method boxes
Percentage change
- Subtract old from new (keep the sign).
- Divide by the old (original) figure.
- Multiply by 100 and say increase or decrease.
Comparing two years of profit information
- Work out gross profit and net profit for both years.
- Work out both margins.
- Compare the margins first, then the profit totals.
- Find which cost line moved most and link it to the business.
ARR
- Add the yearly profits to get the total profit.
- Divide by the number of years.
- Divide by the cost of the investment and multiply by 100.
Cash-flow row by row
- Net cash flow = inflows − outflows.
- Closing balance = opening balance + net cash flow.
- Carry the closing balance forward as next month’s opening balance.
Worked reminders (Calder Cycles)
| Year A | Year B | |
|---|---|---|
| Sales revenue | £250,000 | £275,000 |
| Cost of sales | £160,000 | £187,000 |
| Gross profit | £90,000 | £88,000 |
| Other operating expenses and interest | £60,000 | £55,000 |
| Net profit | £30,000 | £33,000 |
| Gross profit margin | 36% | 32% |
| Net profit margin | 12% | 12% |
Sales revenue rose 10%. Cost of sales rose 16.9%, so gross profit fell by £2,000 and the gross profit margin dropped four percentage points. Lower overheads (down £5,000) lifted net profit to £33,000, so the net profit margin stayed at 12%. Reading: the shop controlled overheads but pays more for the bikes it sells. Look at supplier prices and the selling price.
ARR: a repair workshop costs £20,000 and is expected to earn £4,000, £6,000, £8,000 and £6,000 in four years. Total profit = £24,000. Average annual profit = £6,000. ARR = 6,000 / 20,000 × 100 = 30%.
Reading graphs and charts
- Check the title, axis labels, units and the starting value of the axis.
- “Identify” means read the value from the graph or table. Add the unit.
- A line graph shows change over time: describe direction, peak and any turning point.
- A pie chart shows shares of a whole. A 72° sector is 72 / 360 = 20%.
- A chart shows what happened, not why. Say what else you would need to know.
Marketing data
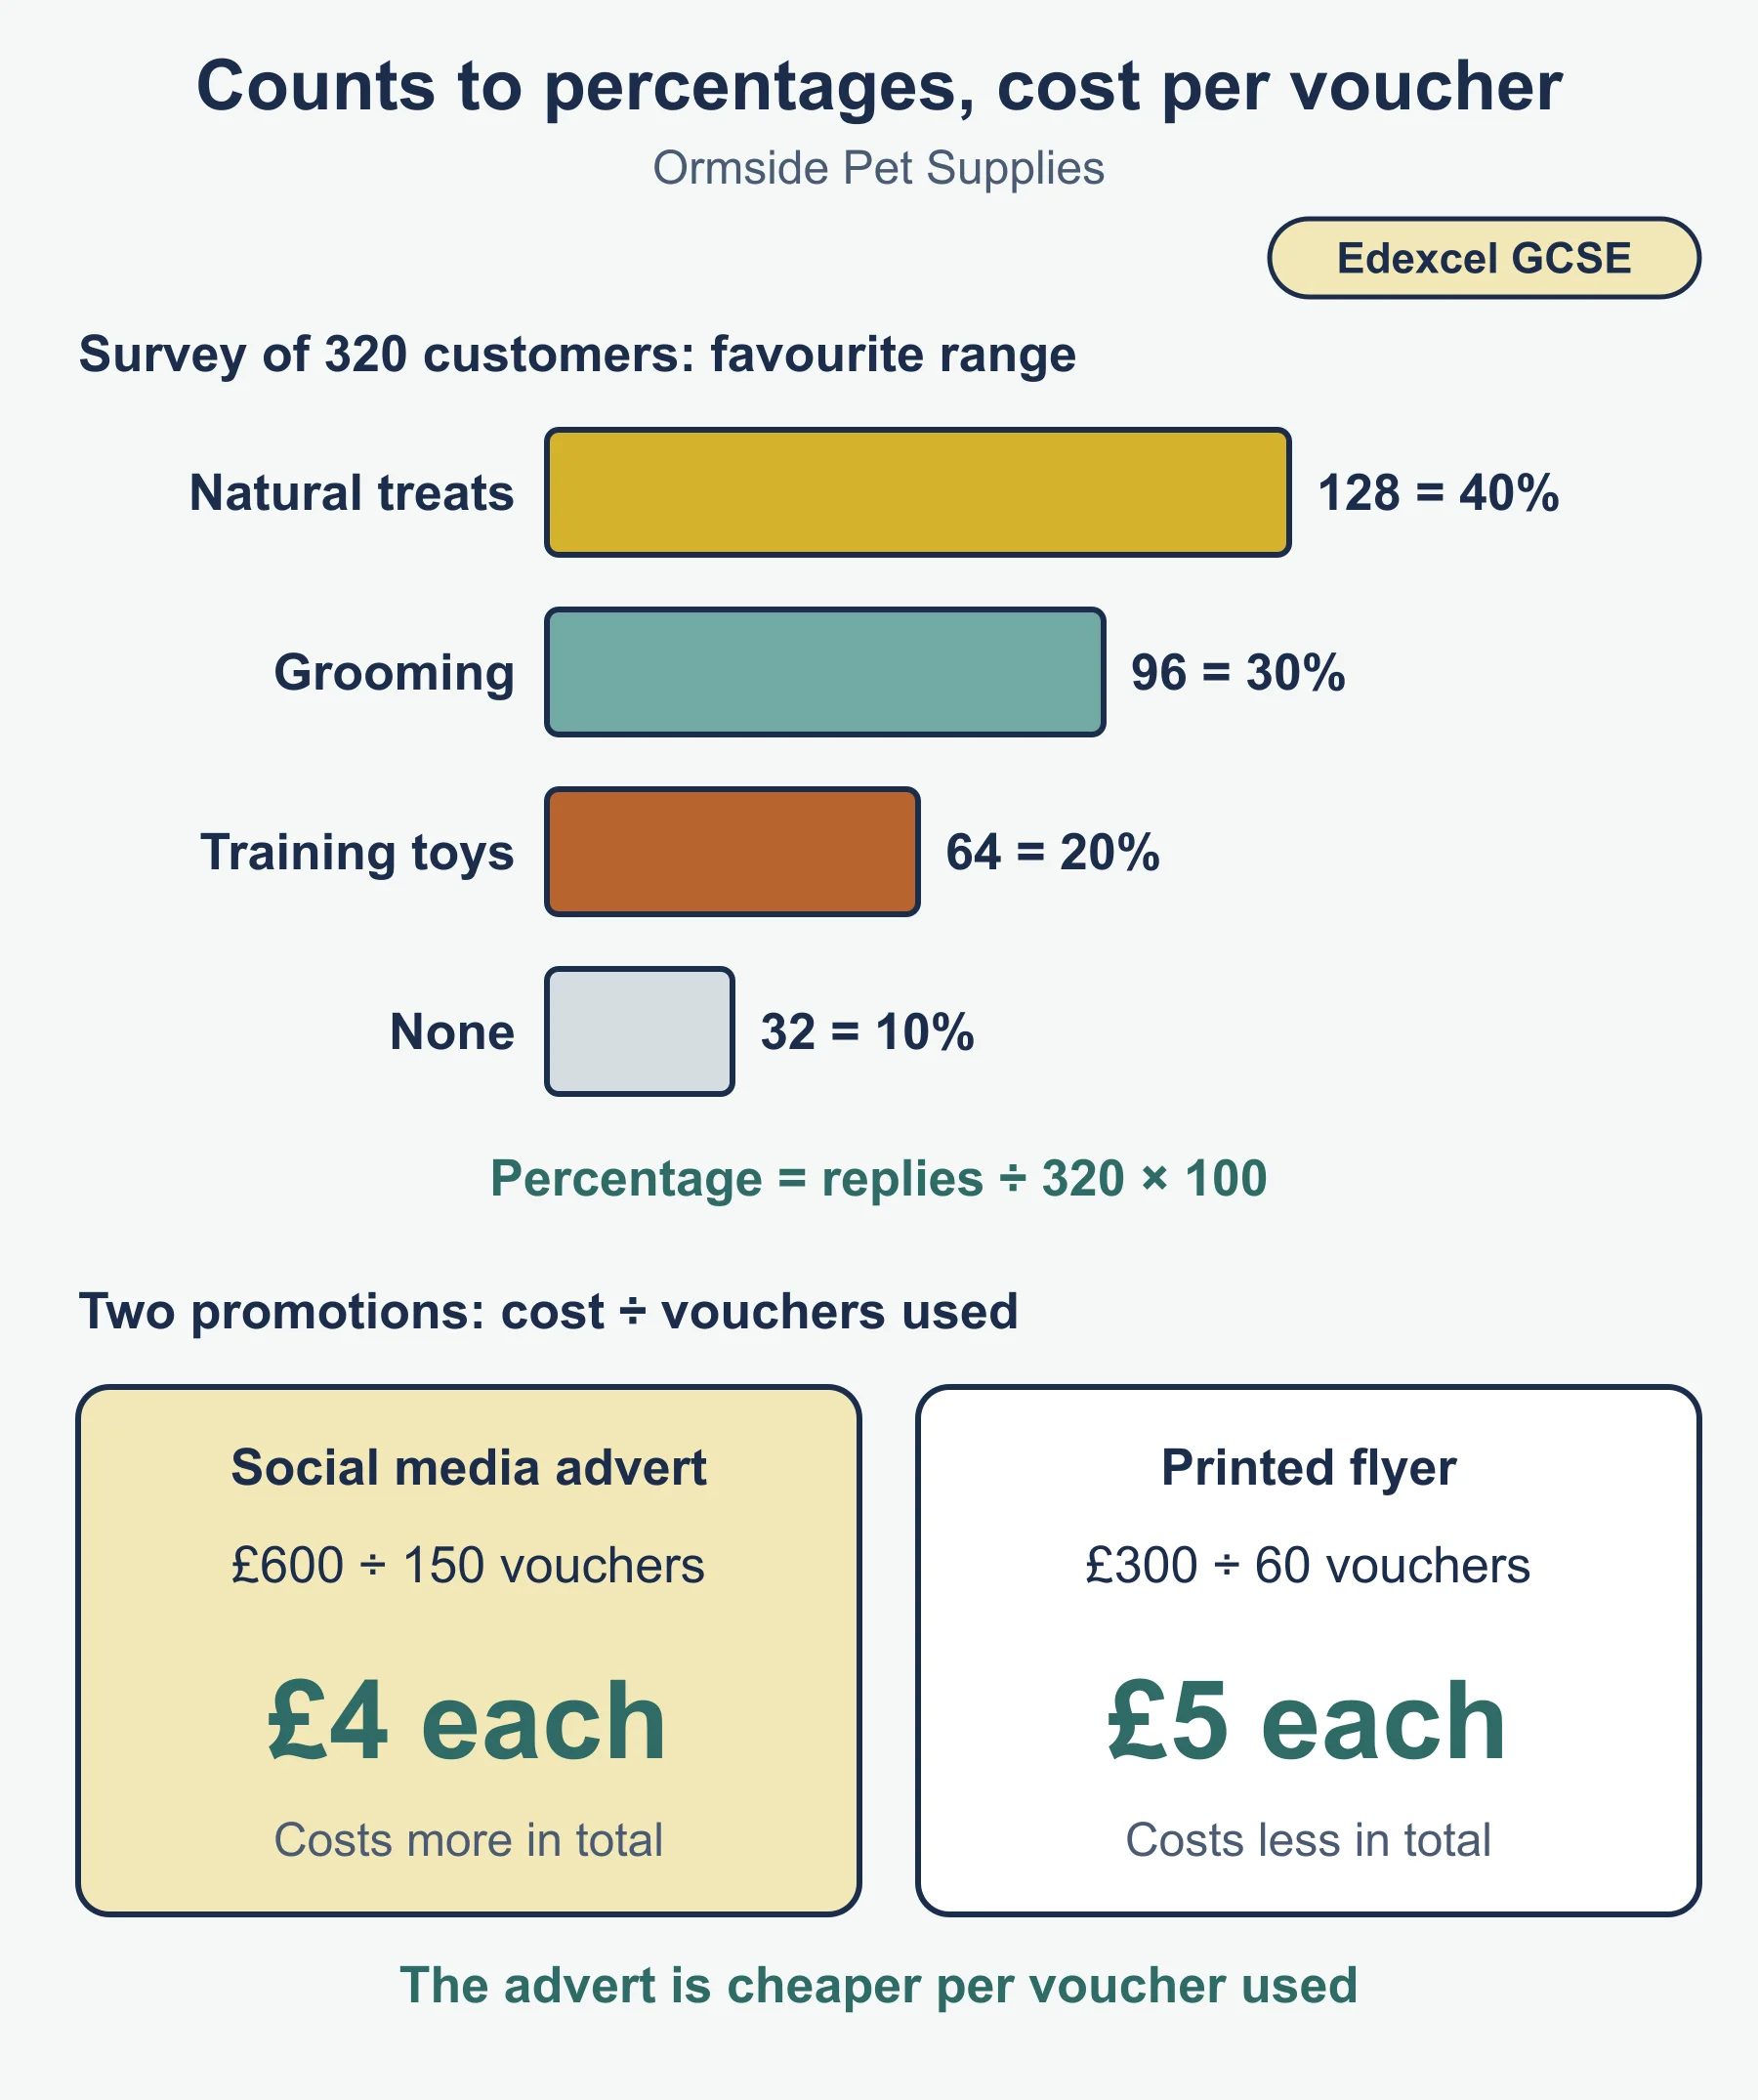
- Convert survey counts into percentages before comparing.
- Compare cost per result across promotions: total cost / number of responses.
- Think about the sample: how many people, and are they the right people?
- Stated intentions may not turn into purchases.
Market data
- Market share can fall while sales rise, if the market grows faster than the business.
- A 15% share is changed by percentage points, not percentages: 15% to 13% is two percentage points.
- A rise in a supplier’s price is a percentage change in costs: £8.00 to £8.60 is 7.5%.
- Business choices after a cost rise: absorb it, raise the price, or find a cheaper supplier. Each has a risk.
Use and limitations of financial information
| In understanding business performance | In making business decisions | |
|---|---|---|
| Use | Shows profit, margins, cash, change over time, comparison with a target or a competitor | Compares investments (ARR), sets prices, plans borrowing from a forecast |
| Limitation | Backward-looking; says what, not why; ignores quality, reputation and staff | Forecasts are estimates; non-financial factors matter; figures can be out of date |
Must-know distinctions:
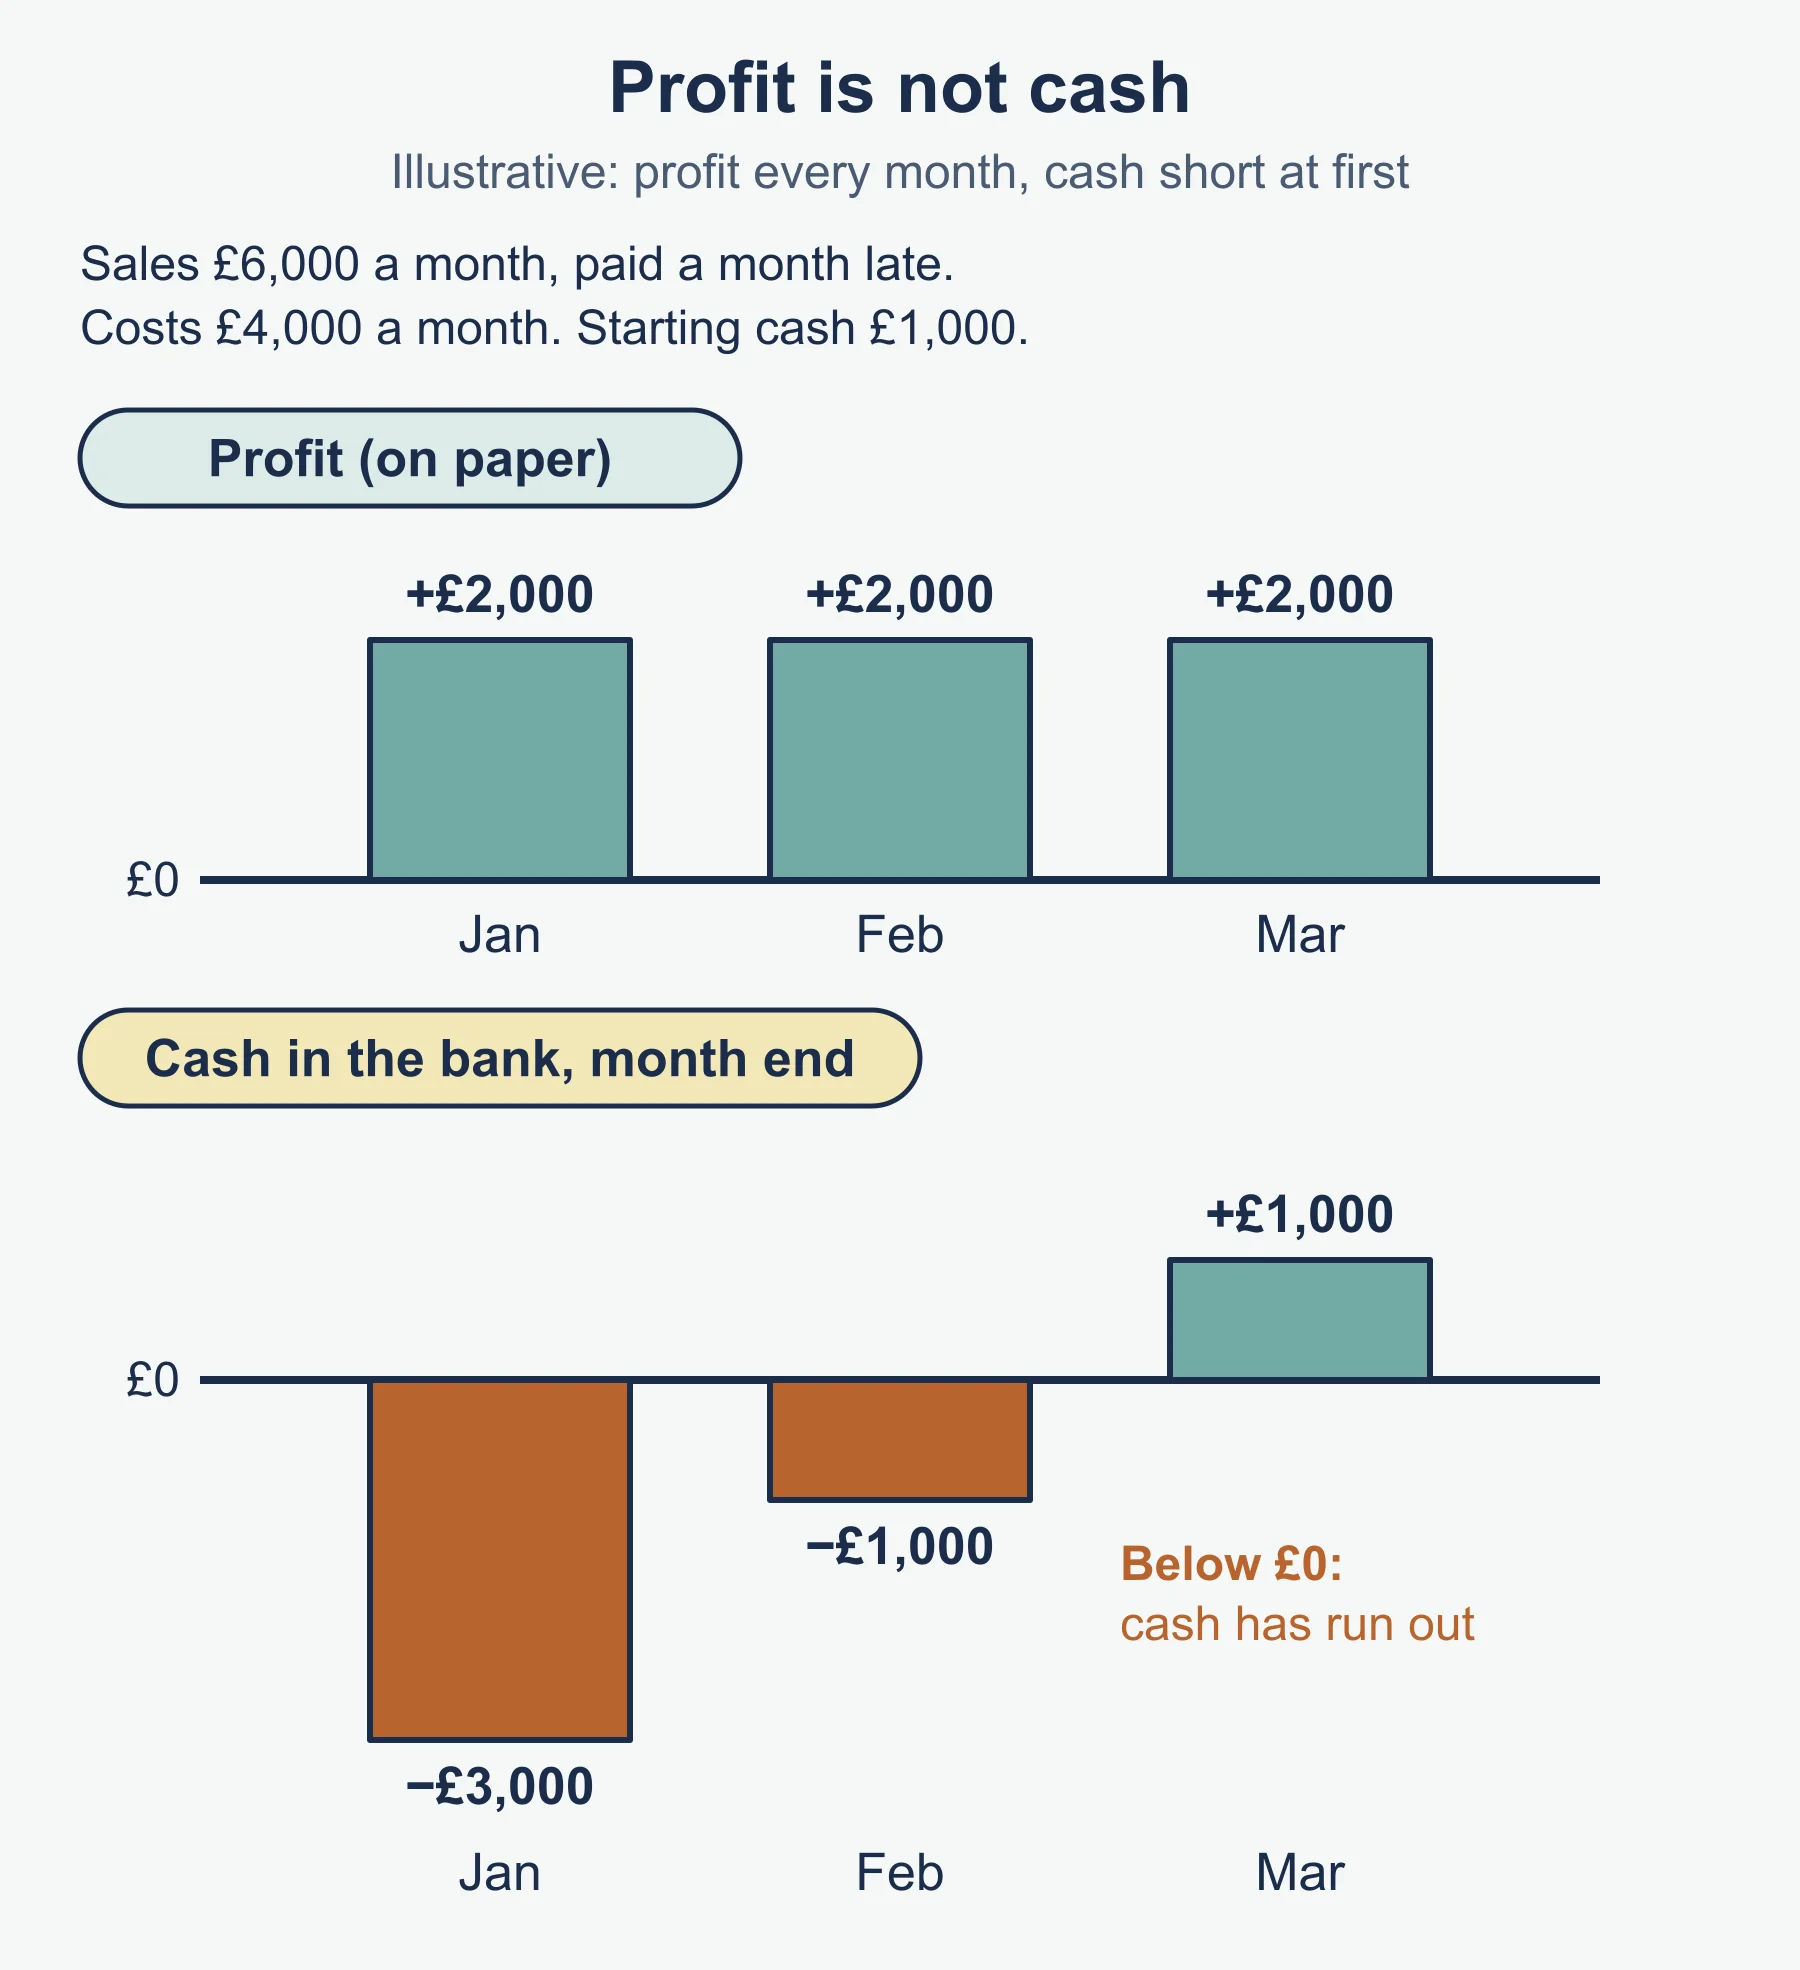
- Profit is not cash. A business can be profitable and still run short of cash.
- Gross profit margin looks at cost of sales only. Net profit margin also includes other operating expenses and interest.
- Percentage change is not percentage points.
- A forecast is an estimate; an actual figure is a record of what happened.
- Support, inform and justify: showing what is happening, backing a choice, and giving the reason for it.
Command words (Appendix 1): Identify (read from a graph or table), Calculate (workings given), State (up to a sentence, from the data given), Explain (a fact plus two expansion points, no context), Analyse (extended, in the context given), Justify (use the information to recommend one of two options), Evaluate (reach a supported conclusion).
Quick self-test
- A stall’s takings on five days were £52, £48, £61, £59 and £55. Calculate the mean.
- A product’s price rises from £8.00 to £8.60. Calculate the percentage increase.
- A firm has sales of £36,000 in a market worth £240,000. Calculate its market share.
- A pie chart sector is 72°. What percentage of the whole is it?
- Opening balance £1,200, cash inflows £9,800, cash outflows £10,500. Calculate the net cash flow and the closing balance.
- A £20,000 investment gives profits of £4,000, £6,000, £8,000 and £6,000 over four years. Calculate the ARR.
- Gross profit £90,000, sales revenue £250,000. Calculate the gross profit margin.
- Net profit £33,000, sales revenue £275,000. Calculate the net profit margin.
- A firm’s cost of sales rose from £160,000 to £187,000. Calculate the percentage change, to 1 decimal place.
- A firm’s sales rose 10% while its market rose 25%. What happened to its market share, and why?
- State one limitation of using a cash-flow forecast to make a decision.
Answers
- Total = 275, so the mean is 275 / 5 = £55.
- (8.60 − 8.00) / 8.00 × 100 = 7.5% increase.
- 36,000 / 240,000 × 100 = 15%.
- 72 / 360 × 100 = 20%.
- Net cash flow = 9,800 − 10,500 = −£700; closing balance = 1,200 + (−700) = £500.
- Total profit = £24,000; average = £6,000; 6,000 / 20,000 × 100 = 30%.
- 90,000 / 250,000 × 100 = 36%.
- 33,000 / 275,000 × 100 = 12%.
- (187,000 − 160,000) / 160,000 × 100 = 16.875, so 16.9% increase.
- Market share falls, because the market grew faster than the business, so rivals gained a larger slice.
- For example: the forecast is an estimate, so late-paying customers or higher costs could make the real balance different.
Where marks are usually lost
- Dividing a percentage change by the new figure instead of the original.
- Leaving out units, or the words increase and decrease, on a percentage change.
- Using net profit when the question asks for gross profit, or the reverse.
- Forgetting to divide total profit by the number of years in ARR.
- Reading a chart value from the wrong row or column.
- Describing a graph without using any numbers from it.
- Treating a rise in sales revenue as proof that profit rose.
- Writing limitations in general terms with no link to the business in the case.
- Stopping an “evaluate” or “justify” answer before stating which course of action you back.
Frequently asked questions
How do you calculate gross and net profit margin in Edexcel GCSE Business? Gross profit margin is gross profit / sales revenue × 100, and net profit margin is net profit / sales revenue × 100. Both formulae are listed in Appendix 3 of the 1BS0 specification.
How do you calculate market share? Market share (%) is the business’s sales divided by total market sales, multiplied by 100. It is the standard form and is not listed in Appendix 3.
What is the difference between a percentage and a percentage point? A market share falling from 15% to 13% is a fall of 2 percentage points, but a fall of 13.3% in the share itself. Mixing these up is a common error.
What are the limitations of financial information? It looks backwards, forecasts are only estimates, it leaves out non-financial factors such as morale and reputation, it does not explain causes, comparisons can mislead, and profit is not the same as cash.
Official syllabus
Pearson Edexcel Level 1/Level 2 GCSE (9-1) in Business (1BS0), Specification, Issue 2, July 2022, published by Pearson Education Limited. Theme 2, Topic 2.4 Making financial decisions, item 2.4.2, with Appendix 1 (command words), Appendix 2 (quantitative skills) and Appendix 3 (formulae).
Get free revision emails (optional)
Occasional emails with practice questions, worked explanations and links to free resources for the qualification and subjects you choose. No spam, and you can unsubscribe from any email. The free tools on this site never need an email.
Related resources
-
Study guides
Edexcel GCSE Business: Business calculations (1BS0)
Study guide to gross profit, net profit, profit margins and average rate of return for Pearson Edexcel GCSE Business 1BS0, Theme 2 topic 2.4.1.
Business · Pearson Edexcel · GCSE
Read guide -
Practice questions
Edexcel GCSE Business: Business calculations (1BS0) – Practice Questions
Twelve original practice questions with worked answers on profit, profit margins and average rate of return for Pearson Edexcel GCSE Business, topic 2.4.1.
Business · Pearson Edexcel · GCSE
Try questions -
Revision notes
Edexcel GCSE Business: Business calculations (1BS0) – Revision Notes
Condensed revision notes on gross profit, net profit, profit margins and average rate of return for Pearson Edexcel GCSE Business 1BS0, with a self-test.
Business · Pearson Edexcel · GCSE
Revise topic
Related articles
-
teaching
A Level tuition in Dubai: Cambridge or Pearson Edexcel International A Level?
Schools in Dubai and Abu Dhabi teach either Cambridge International AS & A Level or Pearson Edexcel International A Level. How the two are structured, why it matters for tuition, and how online classes from Lahore work.
9 October 2026
-
curriculum guides
Choosing subjects at IGCSE and A Level
How subject choices at 14 and 16 affect university options later, and how to keep pathways open without overloading a timetable.
28 July 2026
Studying this with a teacher
Working through Business GCSE?
This page is free and stays free. If you would rather be taught it, Marlbridge runs Business classes one-to-one and in small groups of up to 15, online in your own time zone. The first trial class is free. WhatsApp replies within an hour (8am–11pm Pakistan time, every day); email the same day.
Pearson Edexcel Business teachers at Marlbridge

