
Revision Notes
IB DP Business Management: Production planning (HL only) – Revision Notes
Condensed revision notes for IB DP Business Management 5.6 (HL only): formulas, method steps, distinctions and a self-test on production planning.
- Subject
- Business
- Level
- IB
- Topic
- Unit 5: Operations management
- Author
- Marlbridge Academic Team
- Updated
- Reviewed by
- Salman Ahmad (what this means)
Aligned to International Baccalaureate IB Diploma Programme Business (DP Business Management), First assessment 2024. Official specification .
Syllabus page (what it covers and how it is assessed): IB Diploma Programme Business.
Syllabus points this page covers
DP Business Management
- 5.6 Production planning (HL only)
Found an error? Report a correction.
Need help with this topic? Request a free trial class for IB Diploma Programme Business (DP Business Management).
These notes condense section 5.6, Production planning, from Unit 5 of the IB Business management guide, first assessment 2024. The whole section is HL only. For full explanations and worked examples, read the study guide, then test yourself with the practice questions.
Related pages: the course hub, the syllabus checklist, the free diagnostics and costs and revenues for contribution.
Checklist of the content points
- Local and global supply chain process.
- Difference between JIT and just-in-case (JIC).
- Stock control charts: lead time, buffer stock, reorder level, reorder quantity.
- Capacity utilization rate.
- Defect rate.
- Labour productivity, capital productivity, productivity rate, operating leverage.
- Cost to buy (CTB) and cost to make (CTM).
Definitions
| Term | Meaning |
|---|---|
| Supply chain | All the steps and organizations from raw materials to the customer |
| Local supply chain | Most stages within one region or country |
| Global supply chain | Stages spread across several countries |
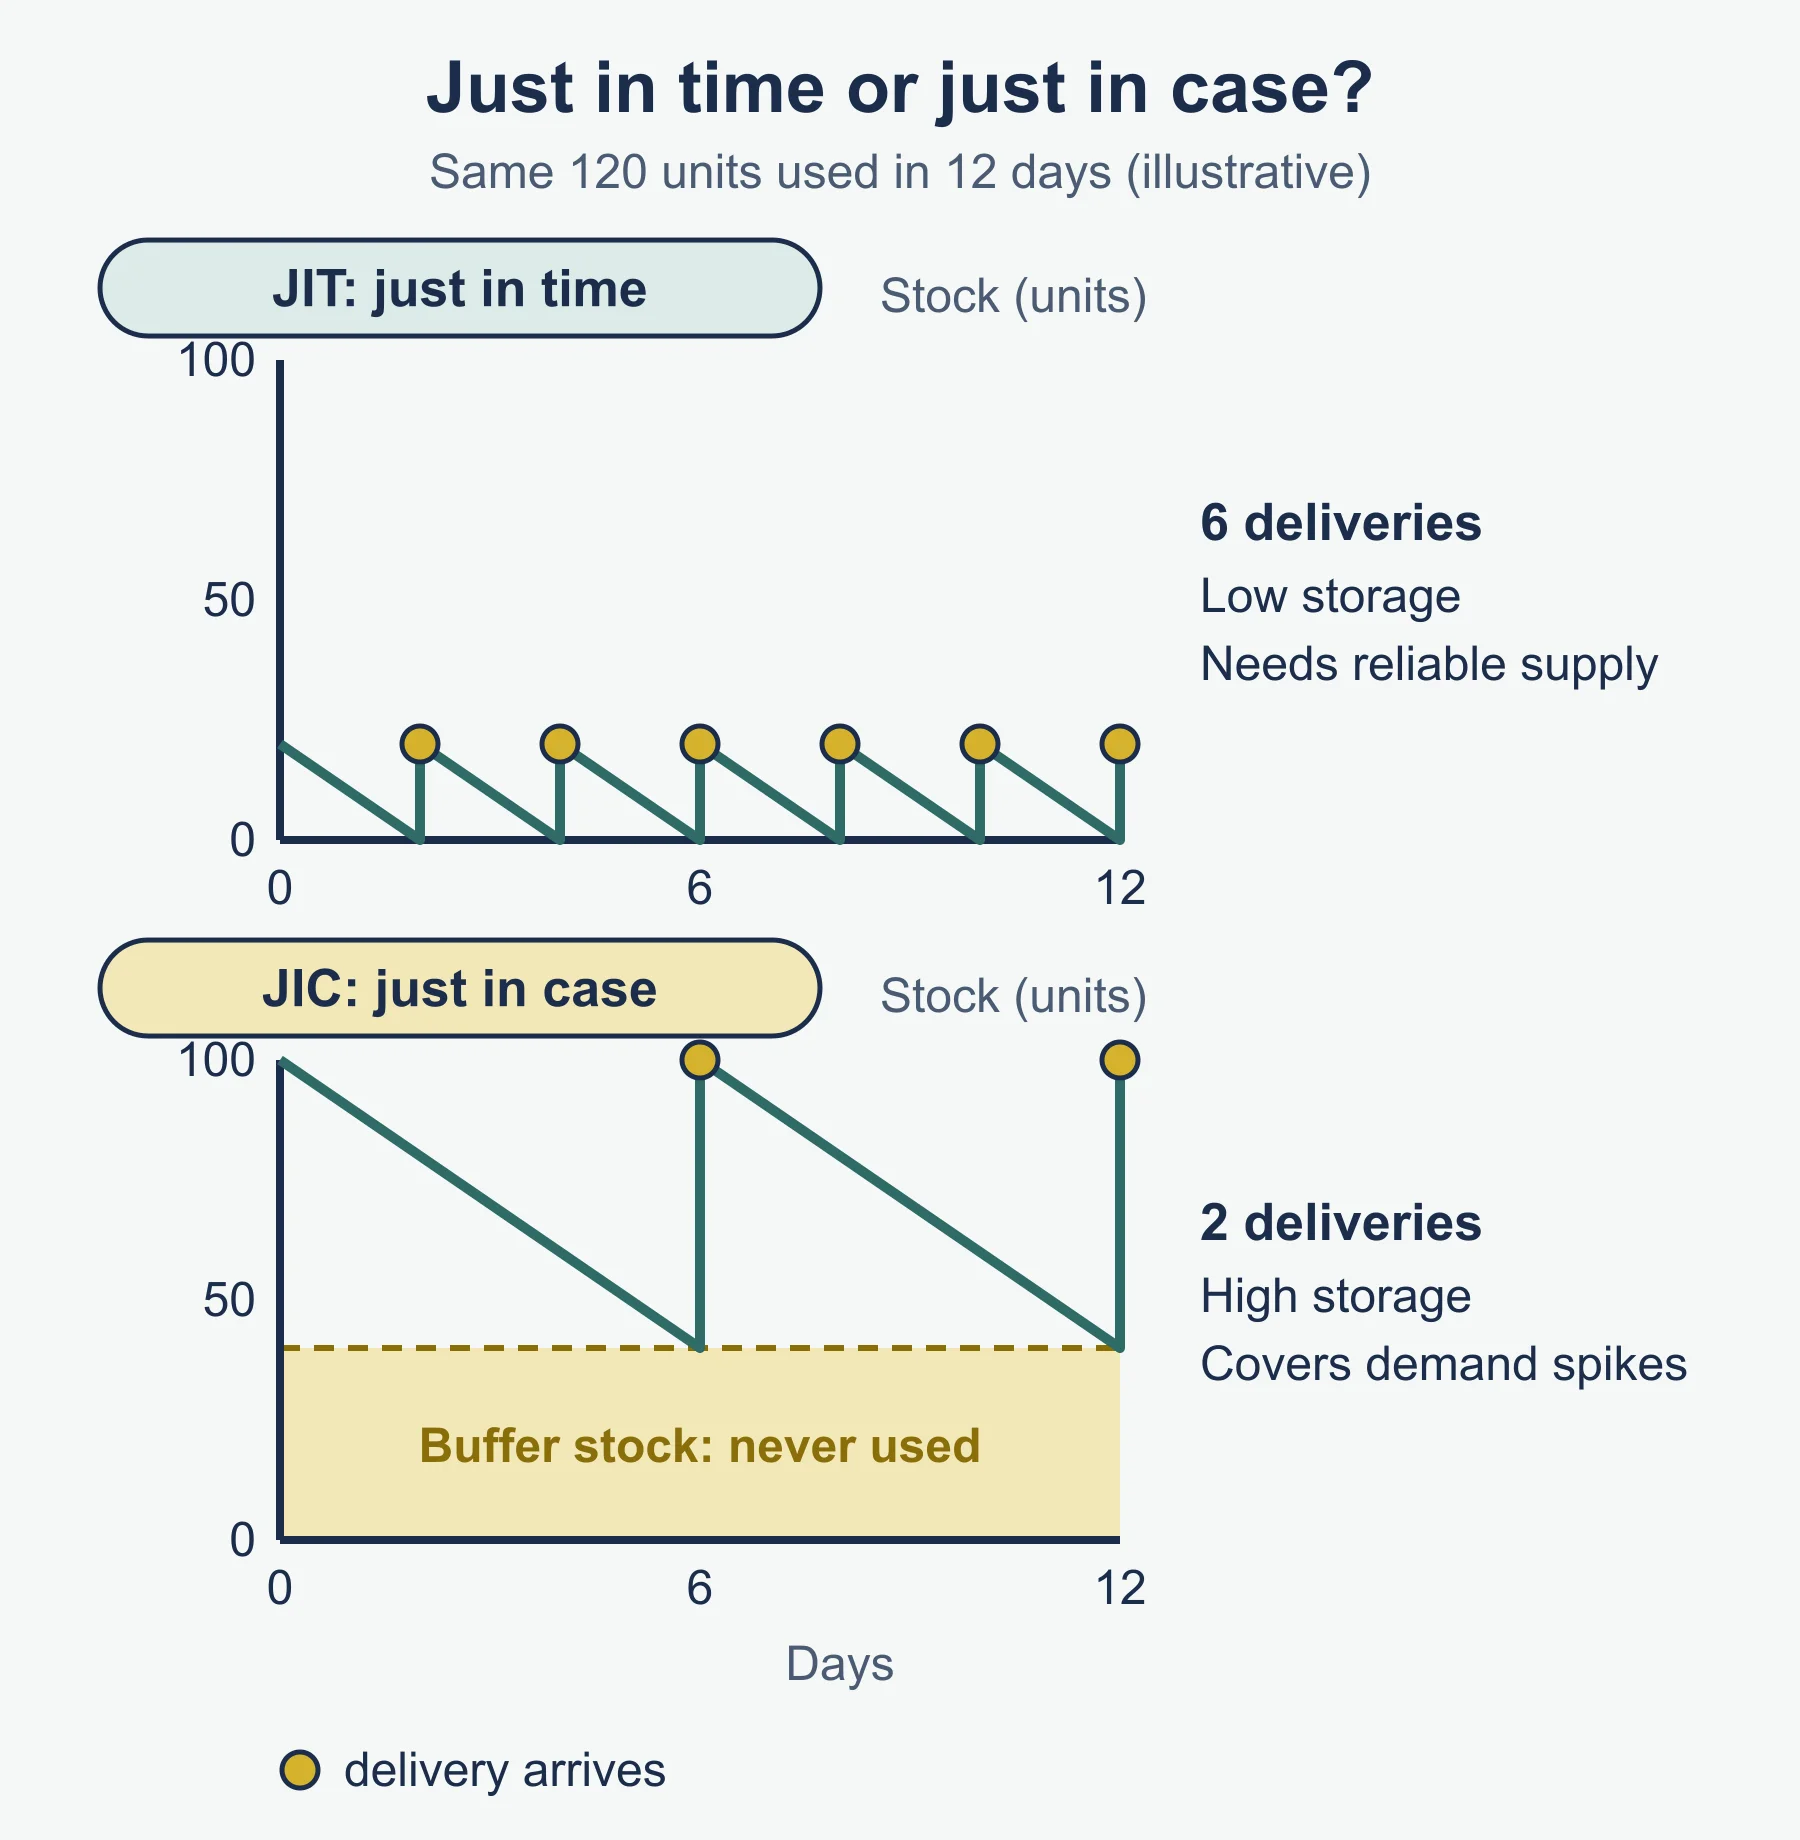
| JIT | Ordering and producing only what is needed, when needed, to keep stock minimal |
| JIC | Holding larger stocks in case of delay or a demand surge |
| Lead time | Time from placing an order to receiving it |
| Buffer stock | Minimum stock kept as a safety margin |
| Reorder level | Stock level that triggers a new order |
| Reorder quantity | Amount ordered each time |
| Capacity | Maximum output with present resources |
| Defect rate | Share of output that fails quality checks |
| Operating leverage | How strongly a change in sales changes profit, because of fixed costs |
Formulas
The guide’s formulae section gives the first two rows. The rest are standard forms, so say “standard form” in an answer.
| Measure | Formula | In the guide’s formulae section? |
|---|---|---|
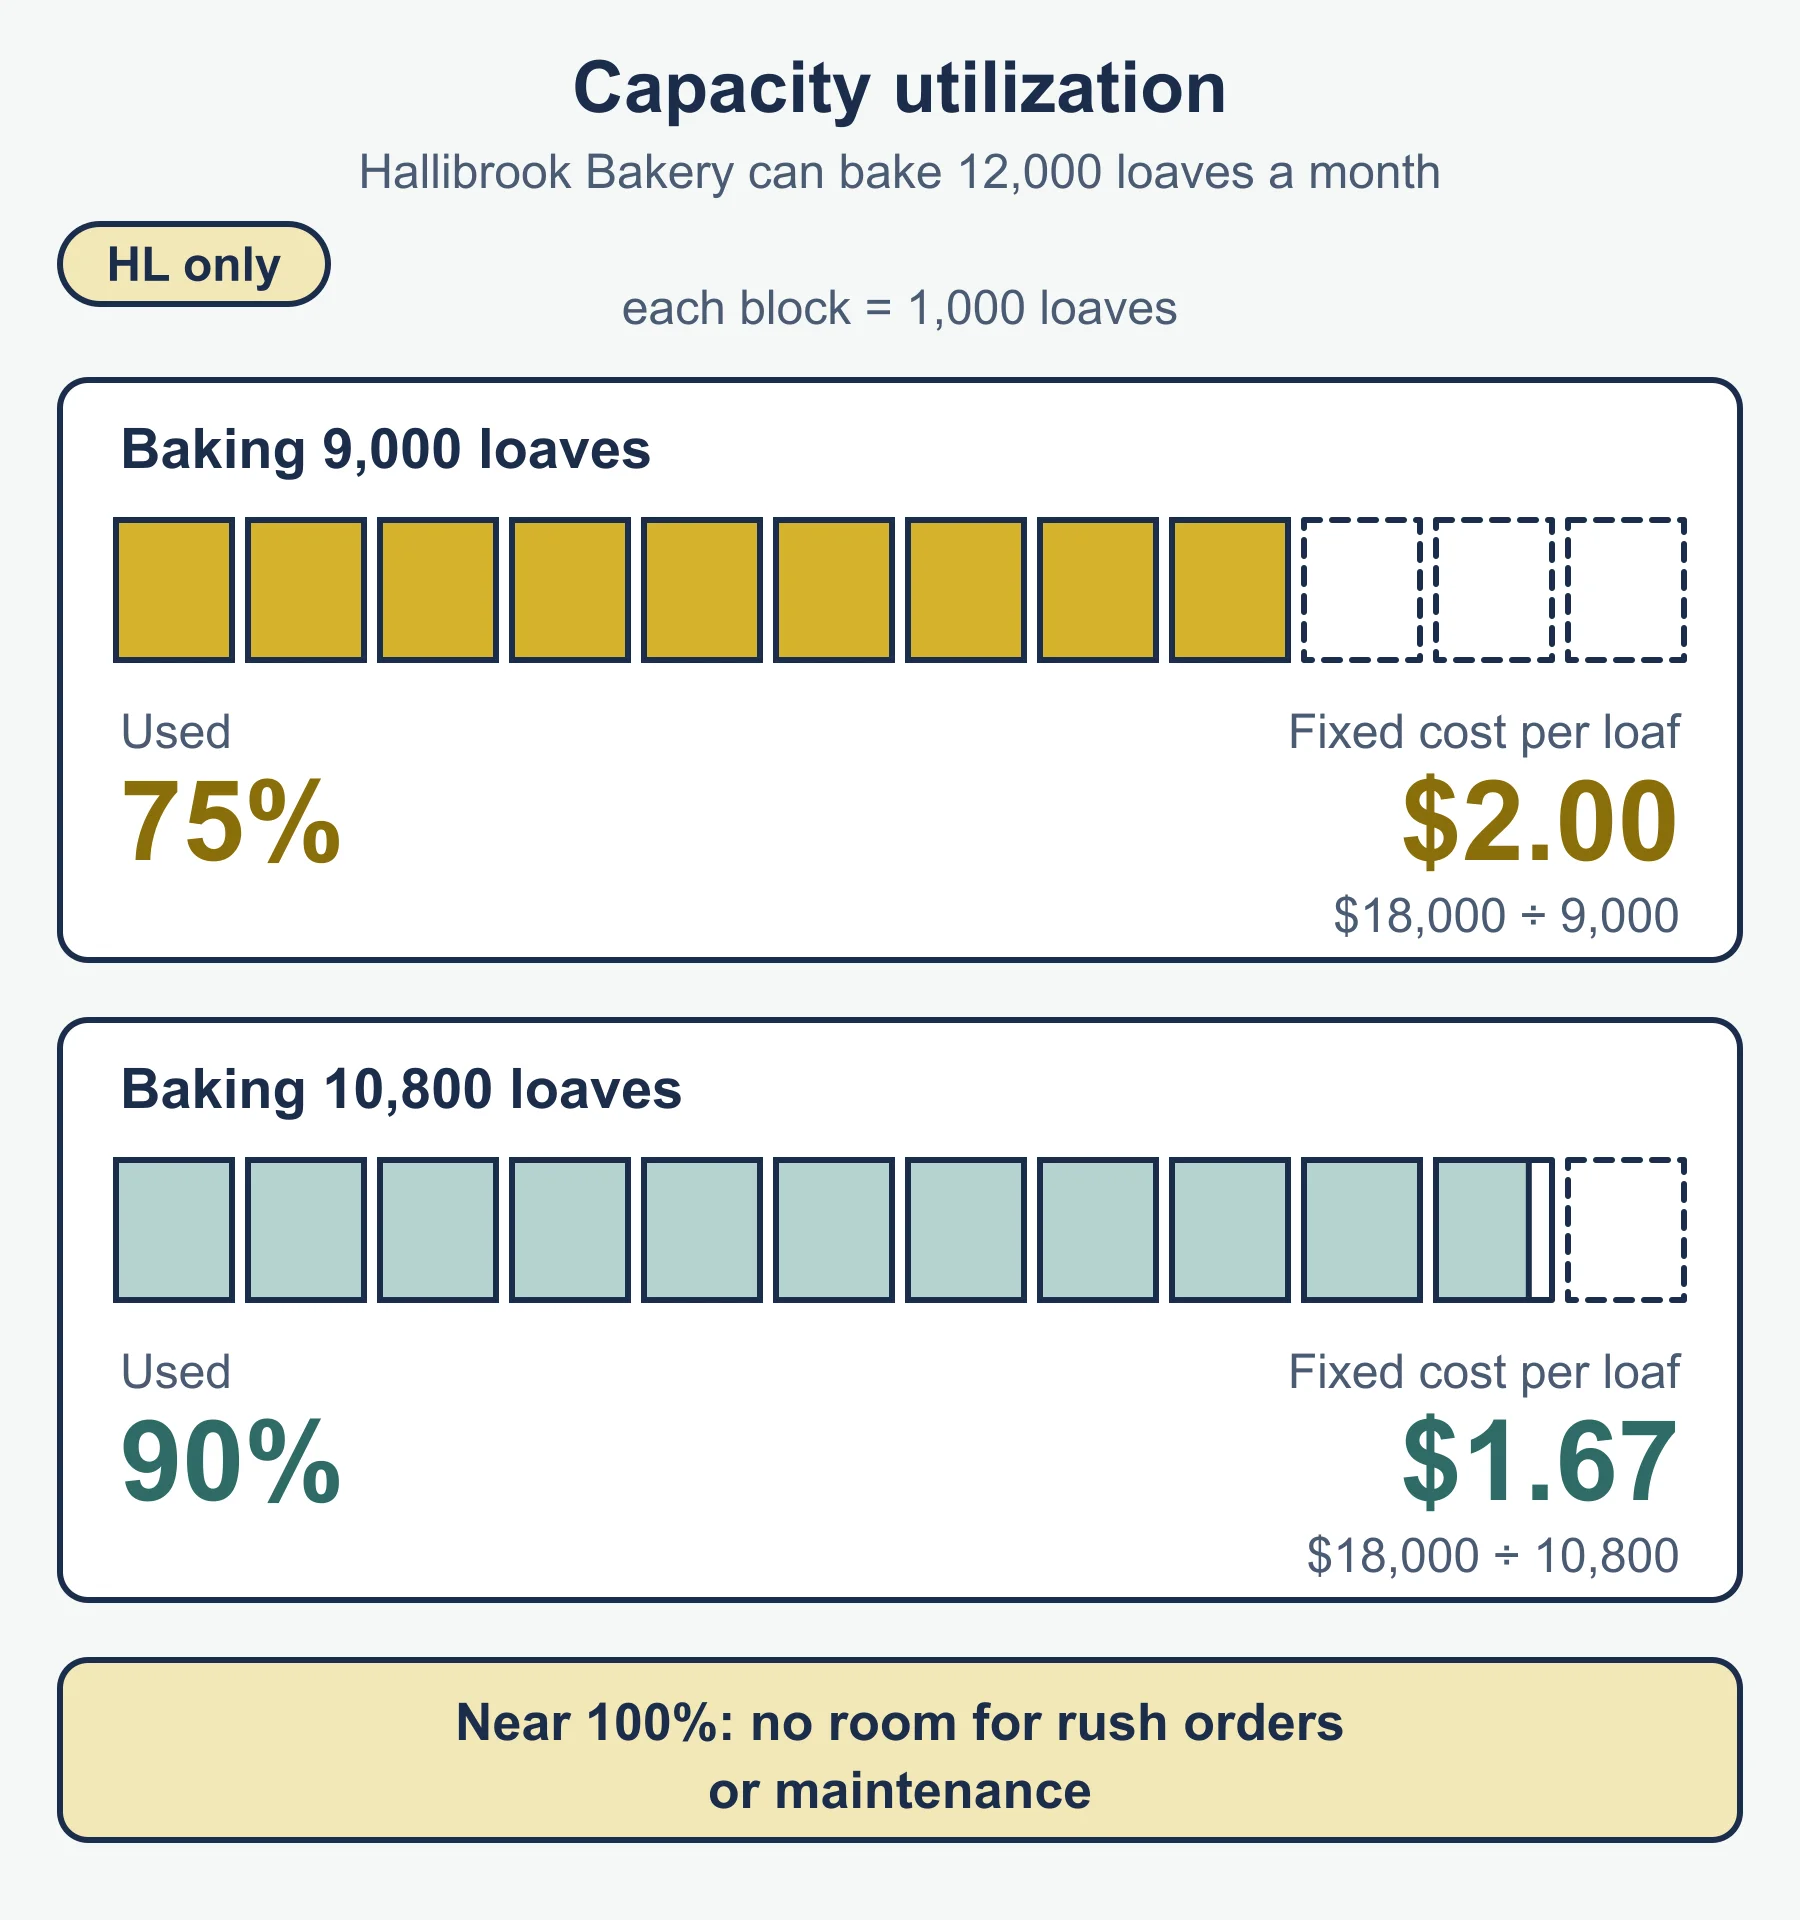
| Capacity utilization rate | actual output ÷ productive capacity × 100 | Yes |
| Productivity rate | total output ÷ total input × 100 | Yes |
| Reorder level | buffer stock + (usage per day × lead time) | No, standard form |
| Maximum stock | buffer stock + reorder quantity | No, standard form |
| Days between orders | reorder quantity ÷ usage per day | No, standard form |
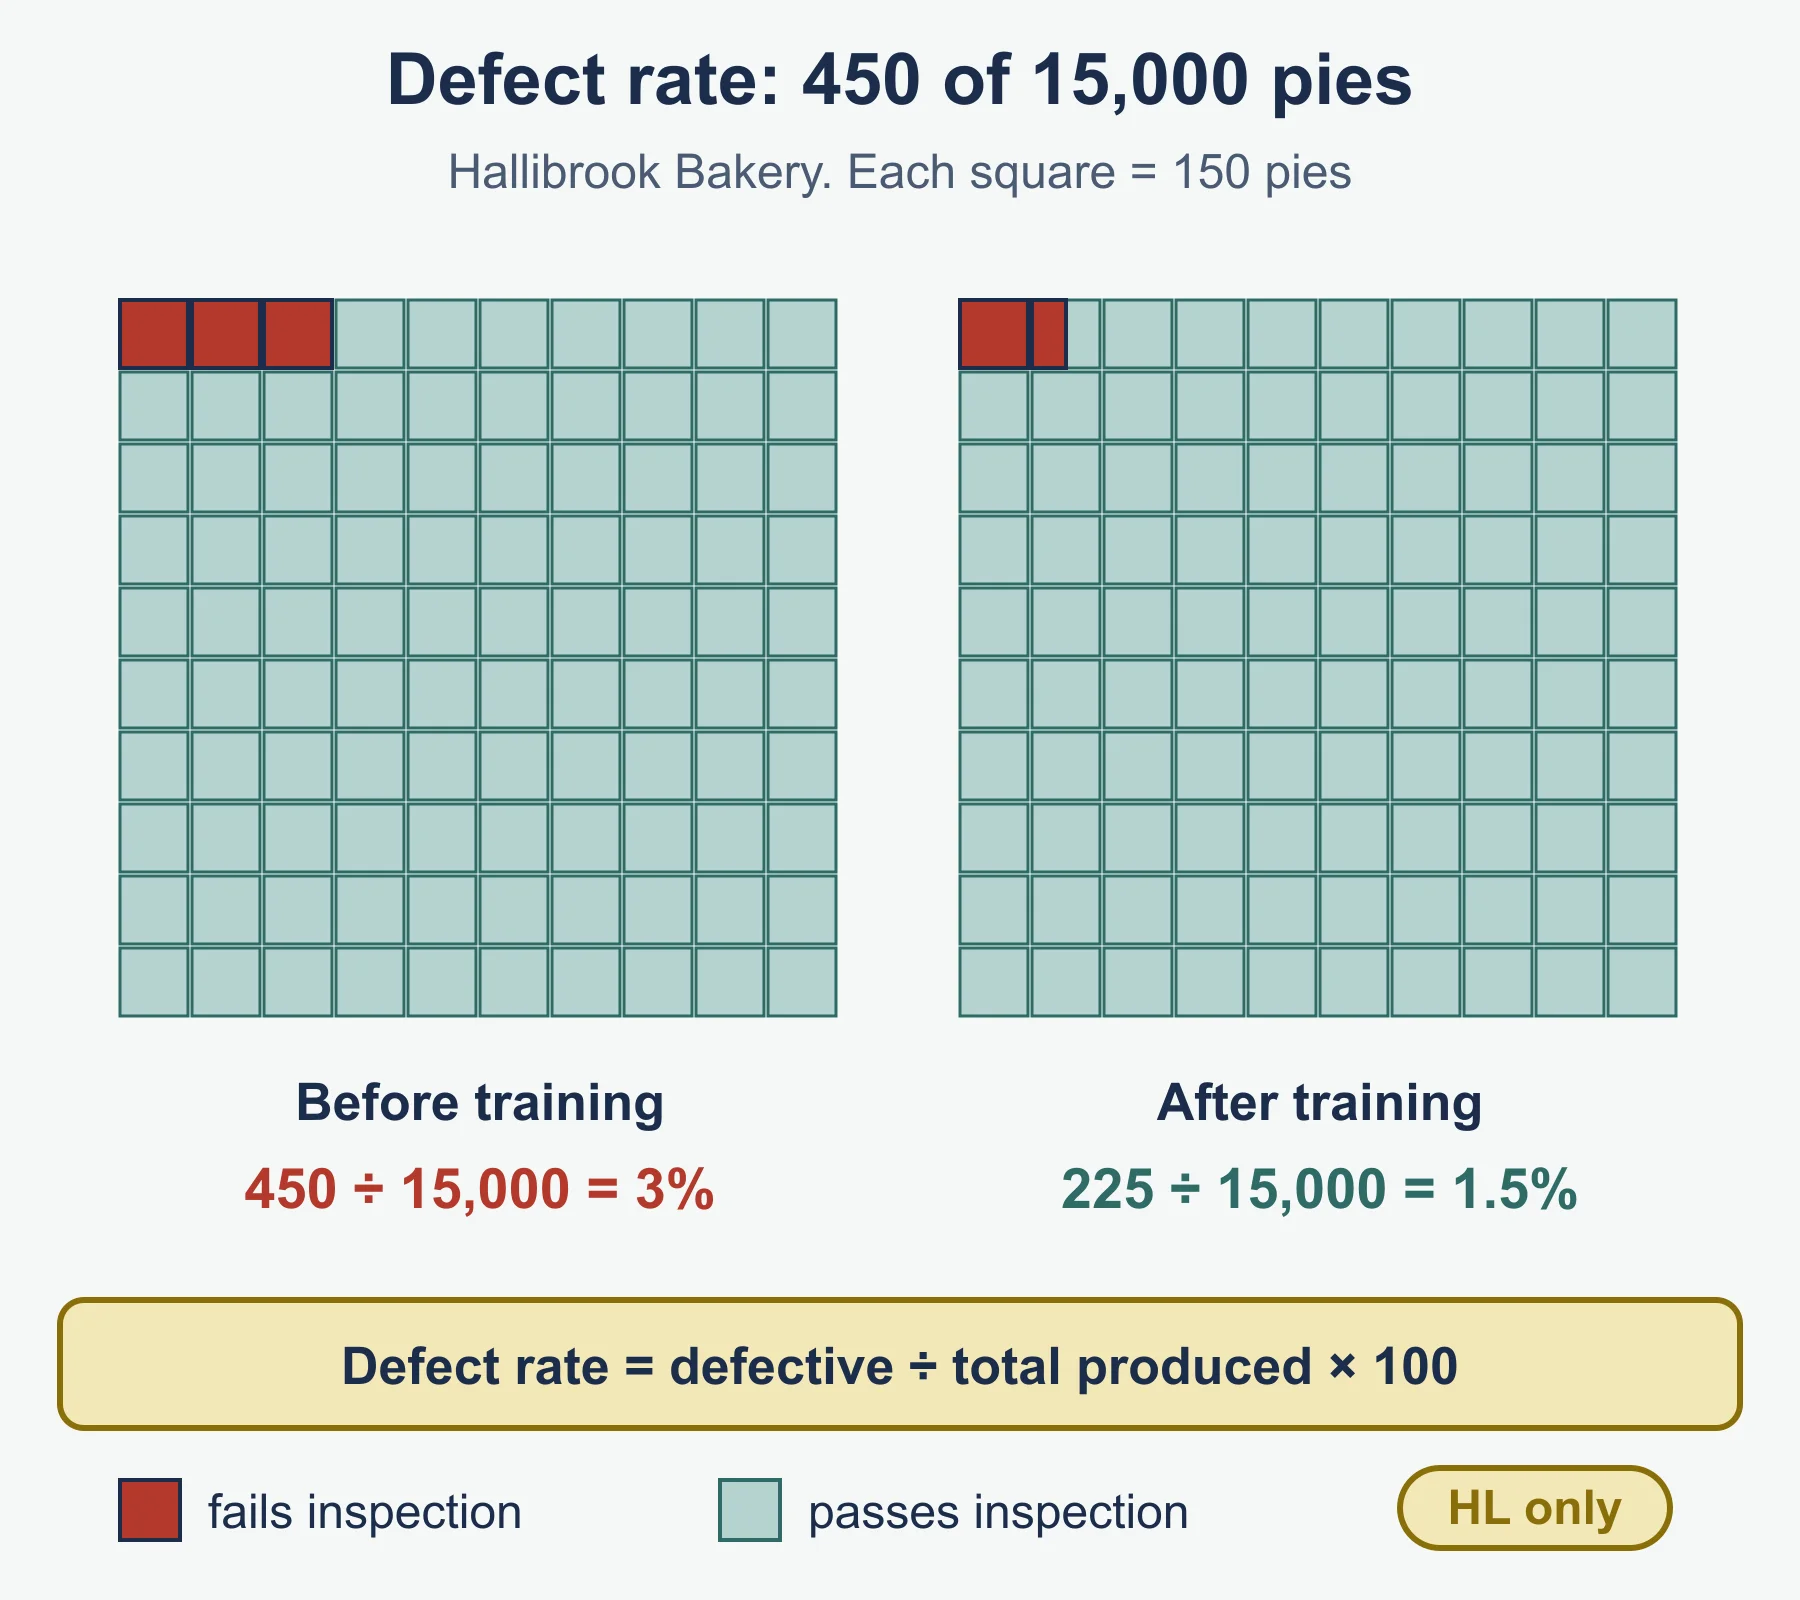
| Defect rate | defective units ÷ total units × 100 | No, standard form |
| Labour productivity | output ÷ number of employees | No, standard form |
| Capital productivity | output ÷ capital employed | No, standard form |
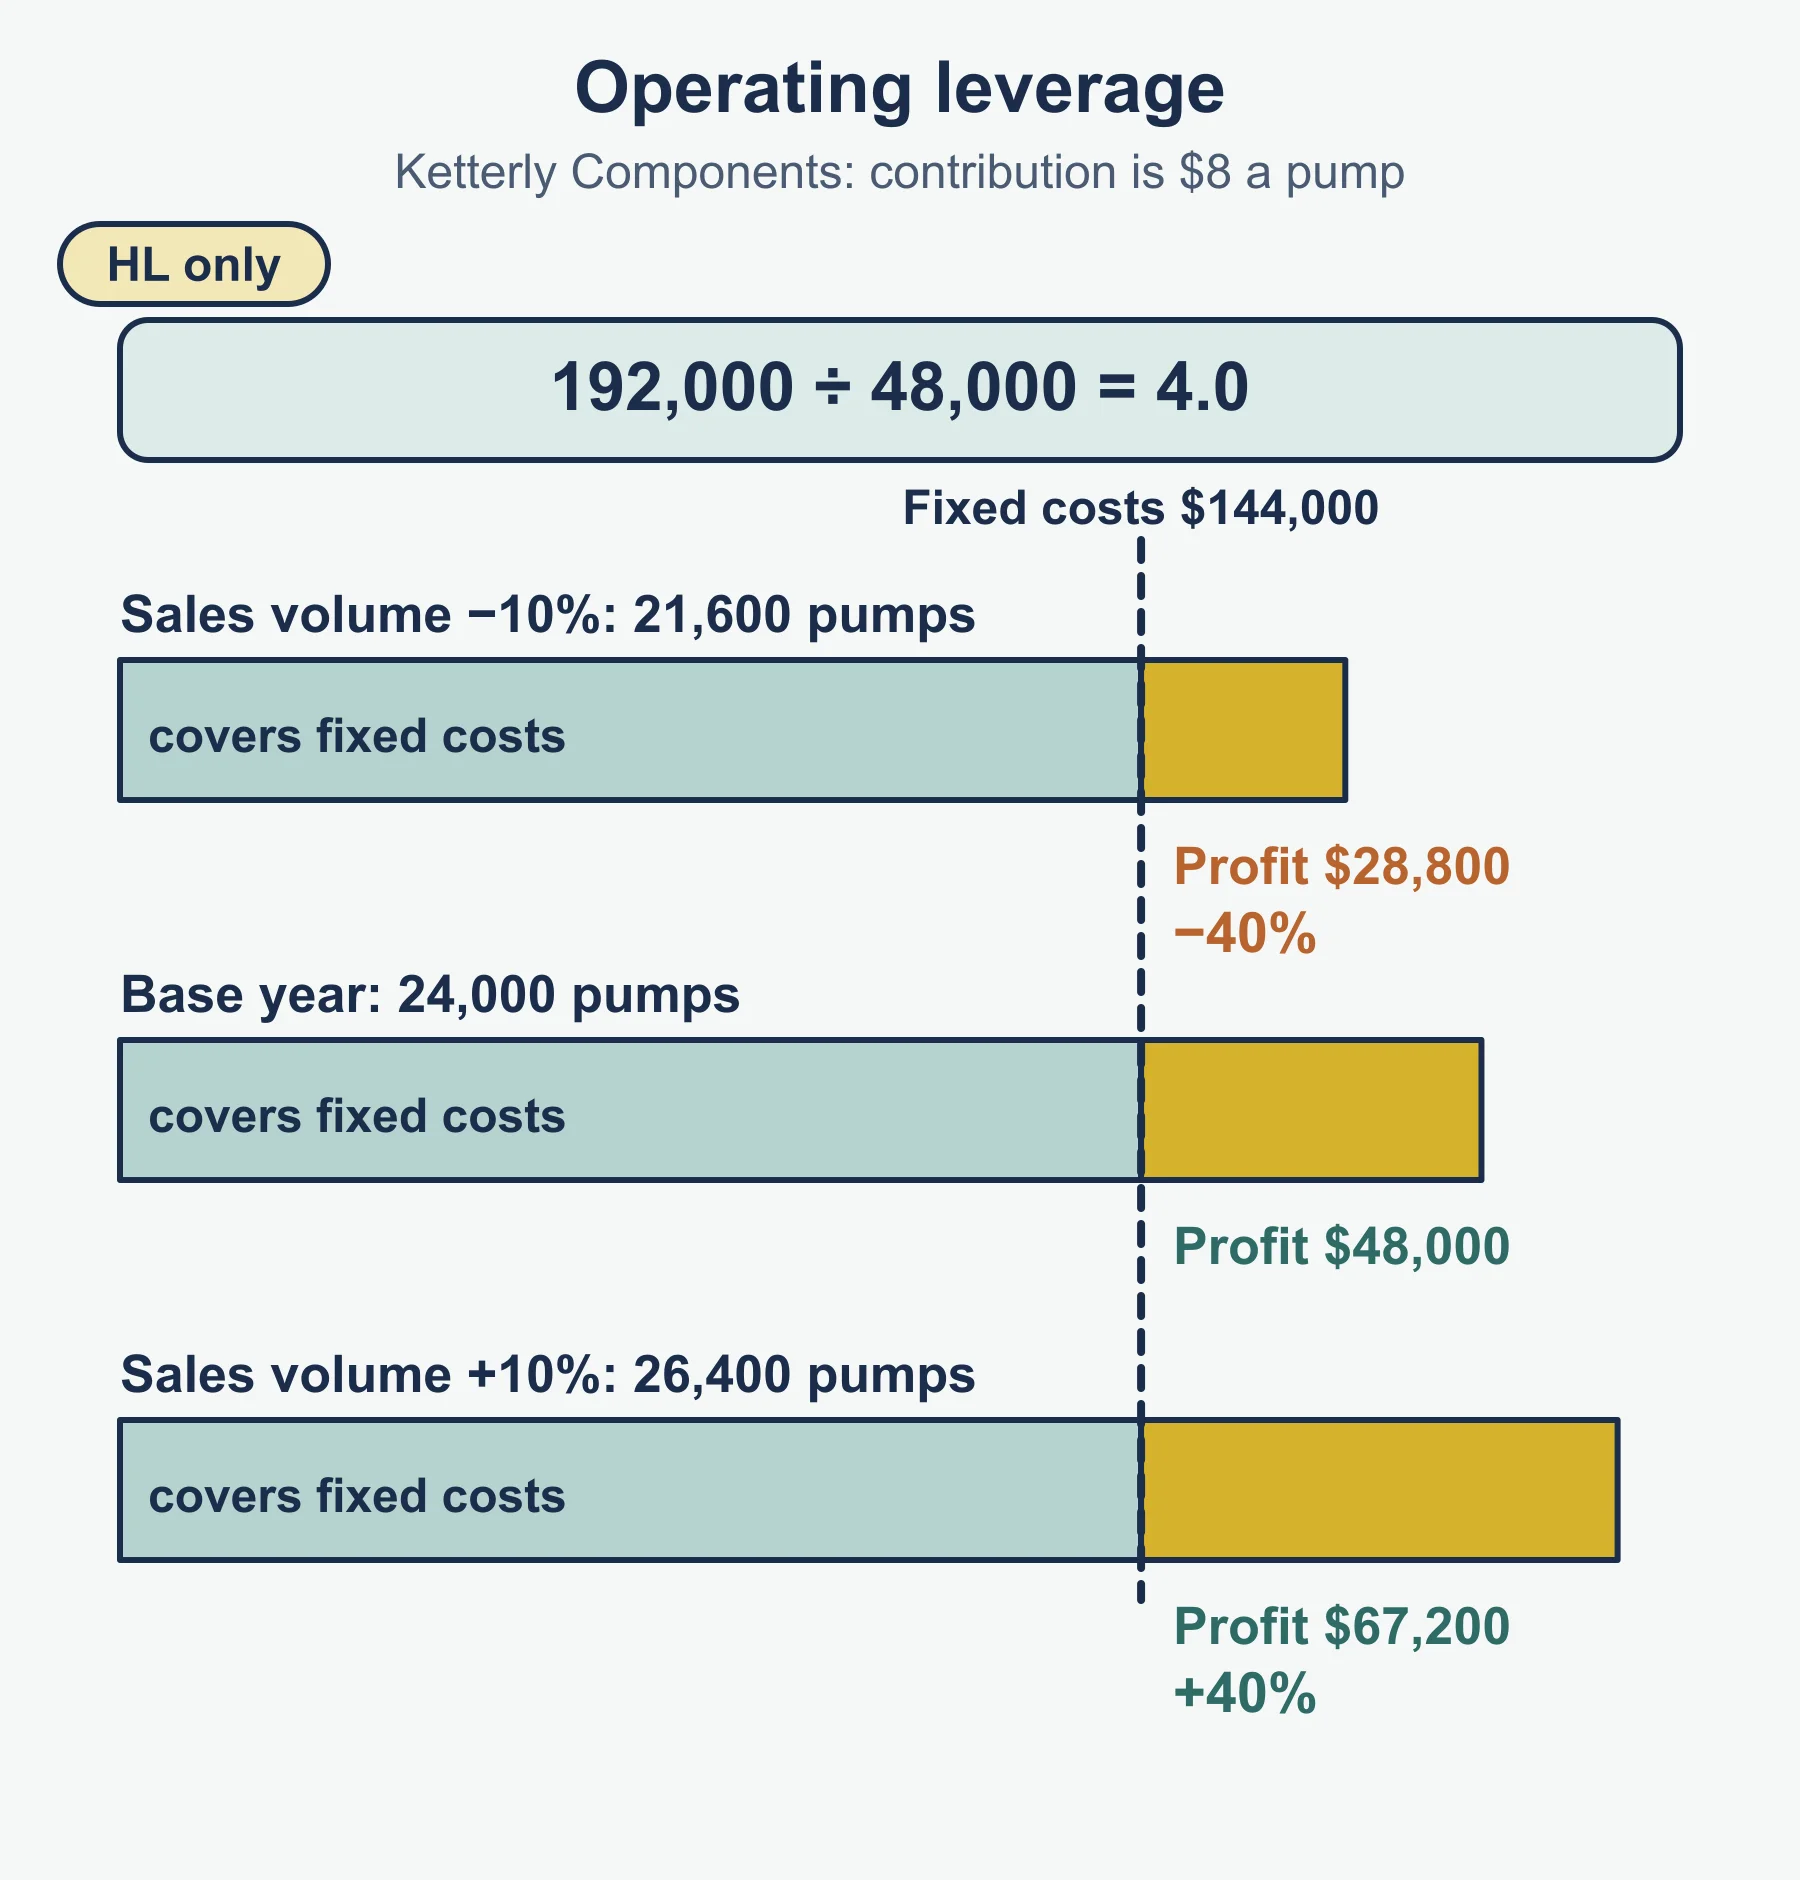
| Operating leverage | total contribution ÷ profit from operations | No, standard form |
| CTB | price per unit × quantity | No, standard form |
| CTM | variable cost per unit × quantity + extra fixed cost | No, standard form |
Method in steps
Stock control chart
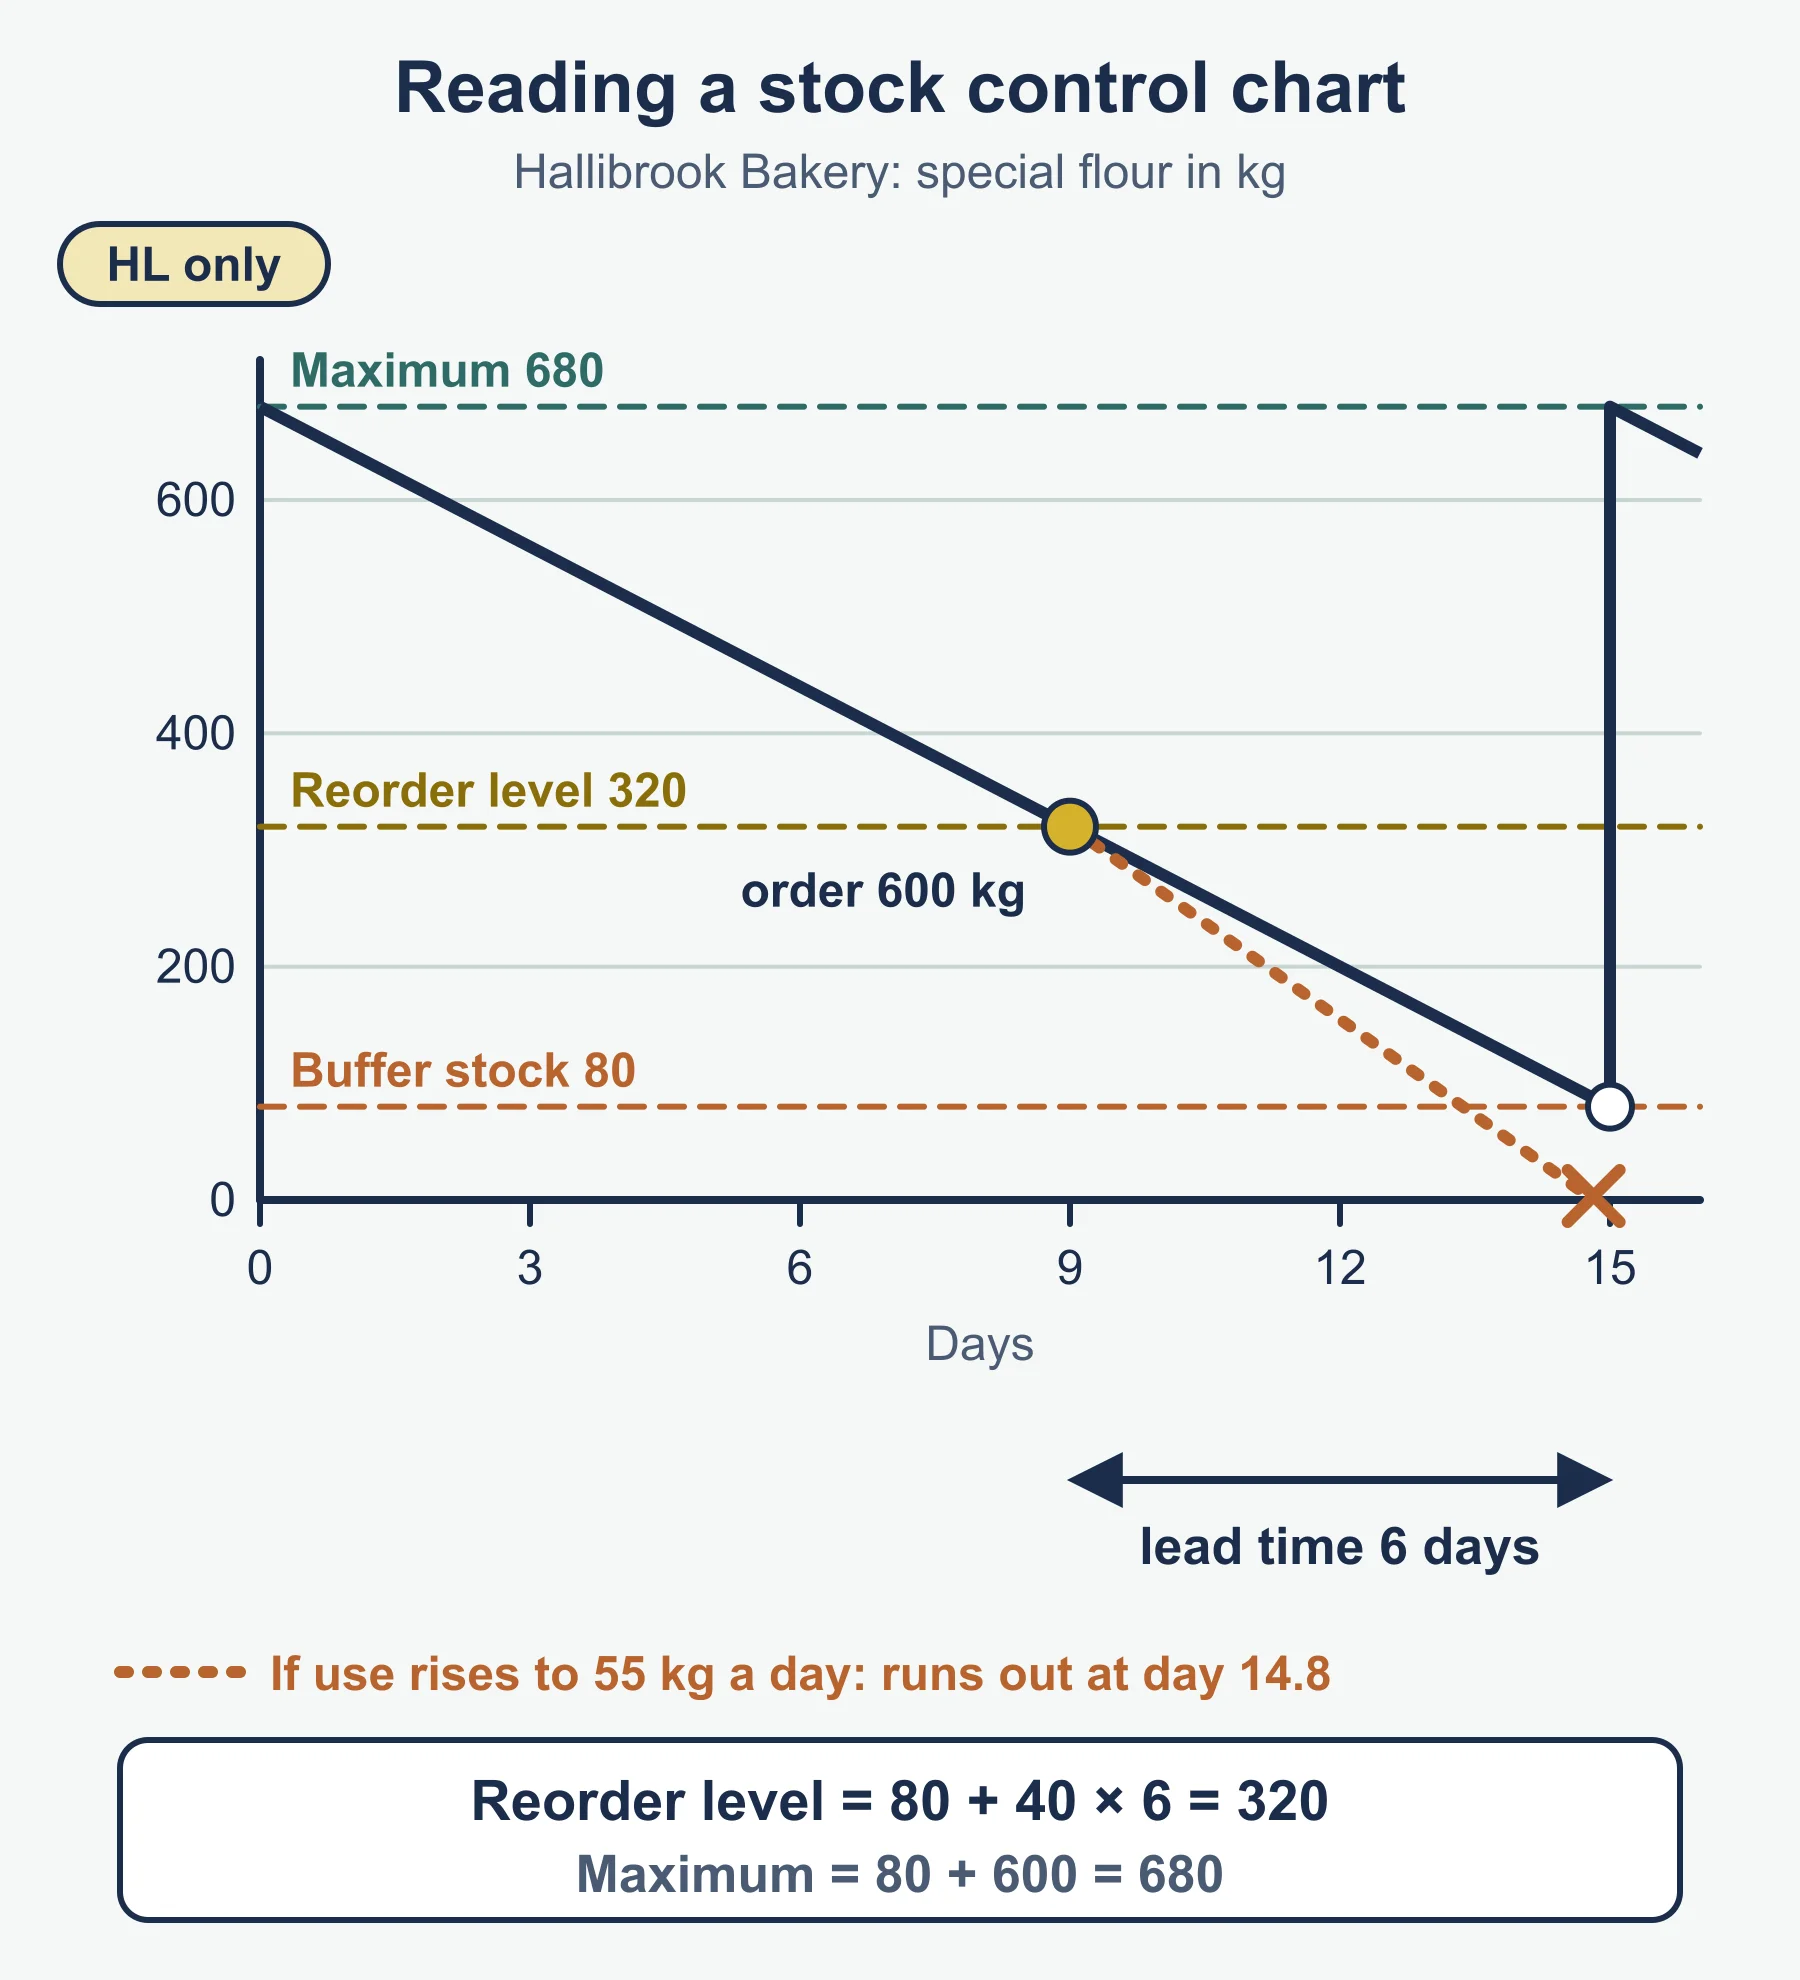
- Work out usage during lead time: daily usage × lead time.
- Add the buffer stock to get the reorder level.
- Add the reorder quantity to the buffer to get maximum stock.
- Divide reorder quantity by daily usage for the days between deliveries.
- If use rises, recheck whether the delivery arrives before stock falls below zero.
Make or buy
- Find CTB: unit price × quantity.
- Find CTM: extra fixed cost + variable cost per unit × quantity.
- Compare. The lower cost is cheaper for that quantity.
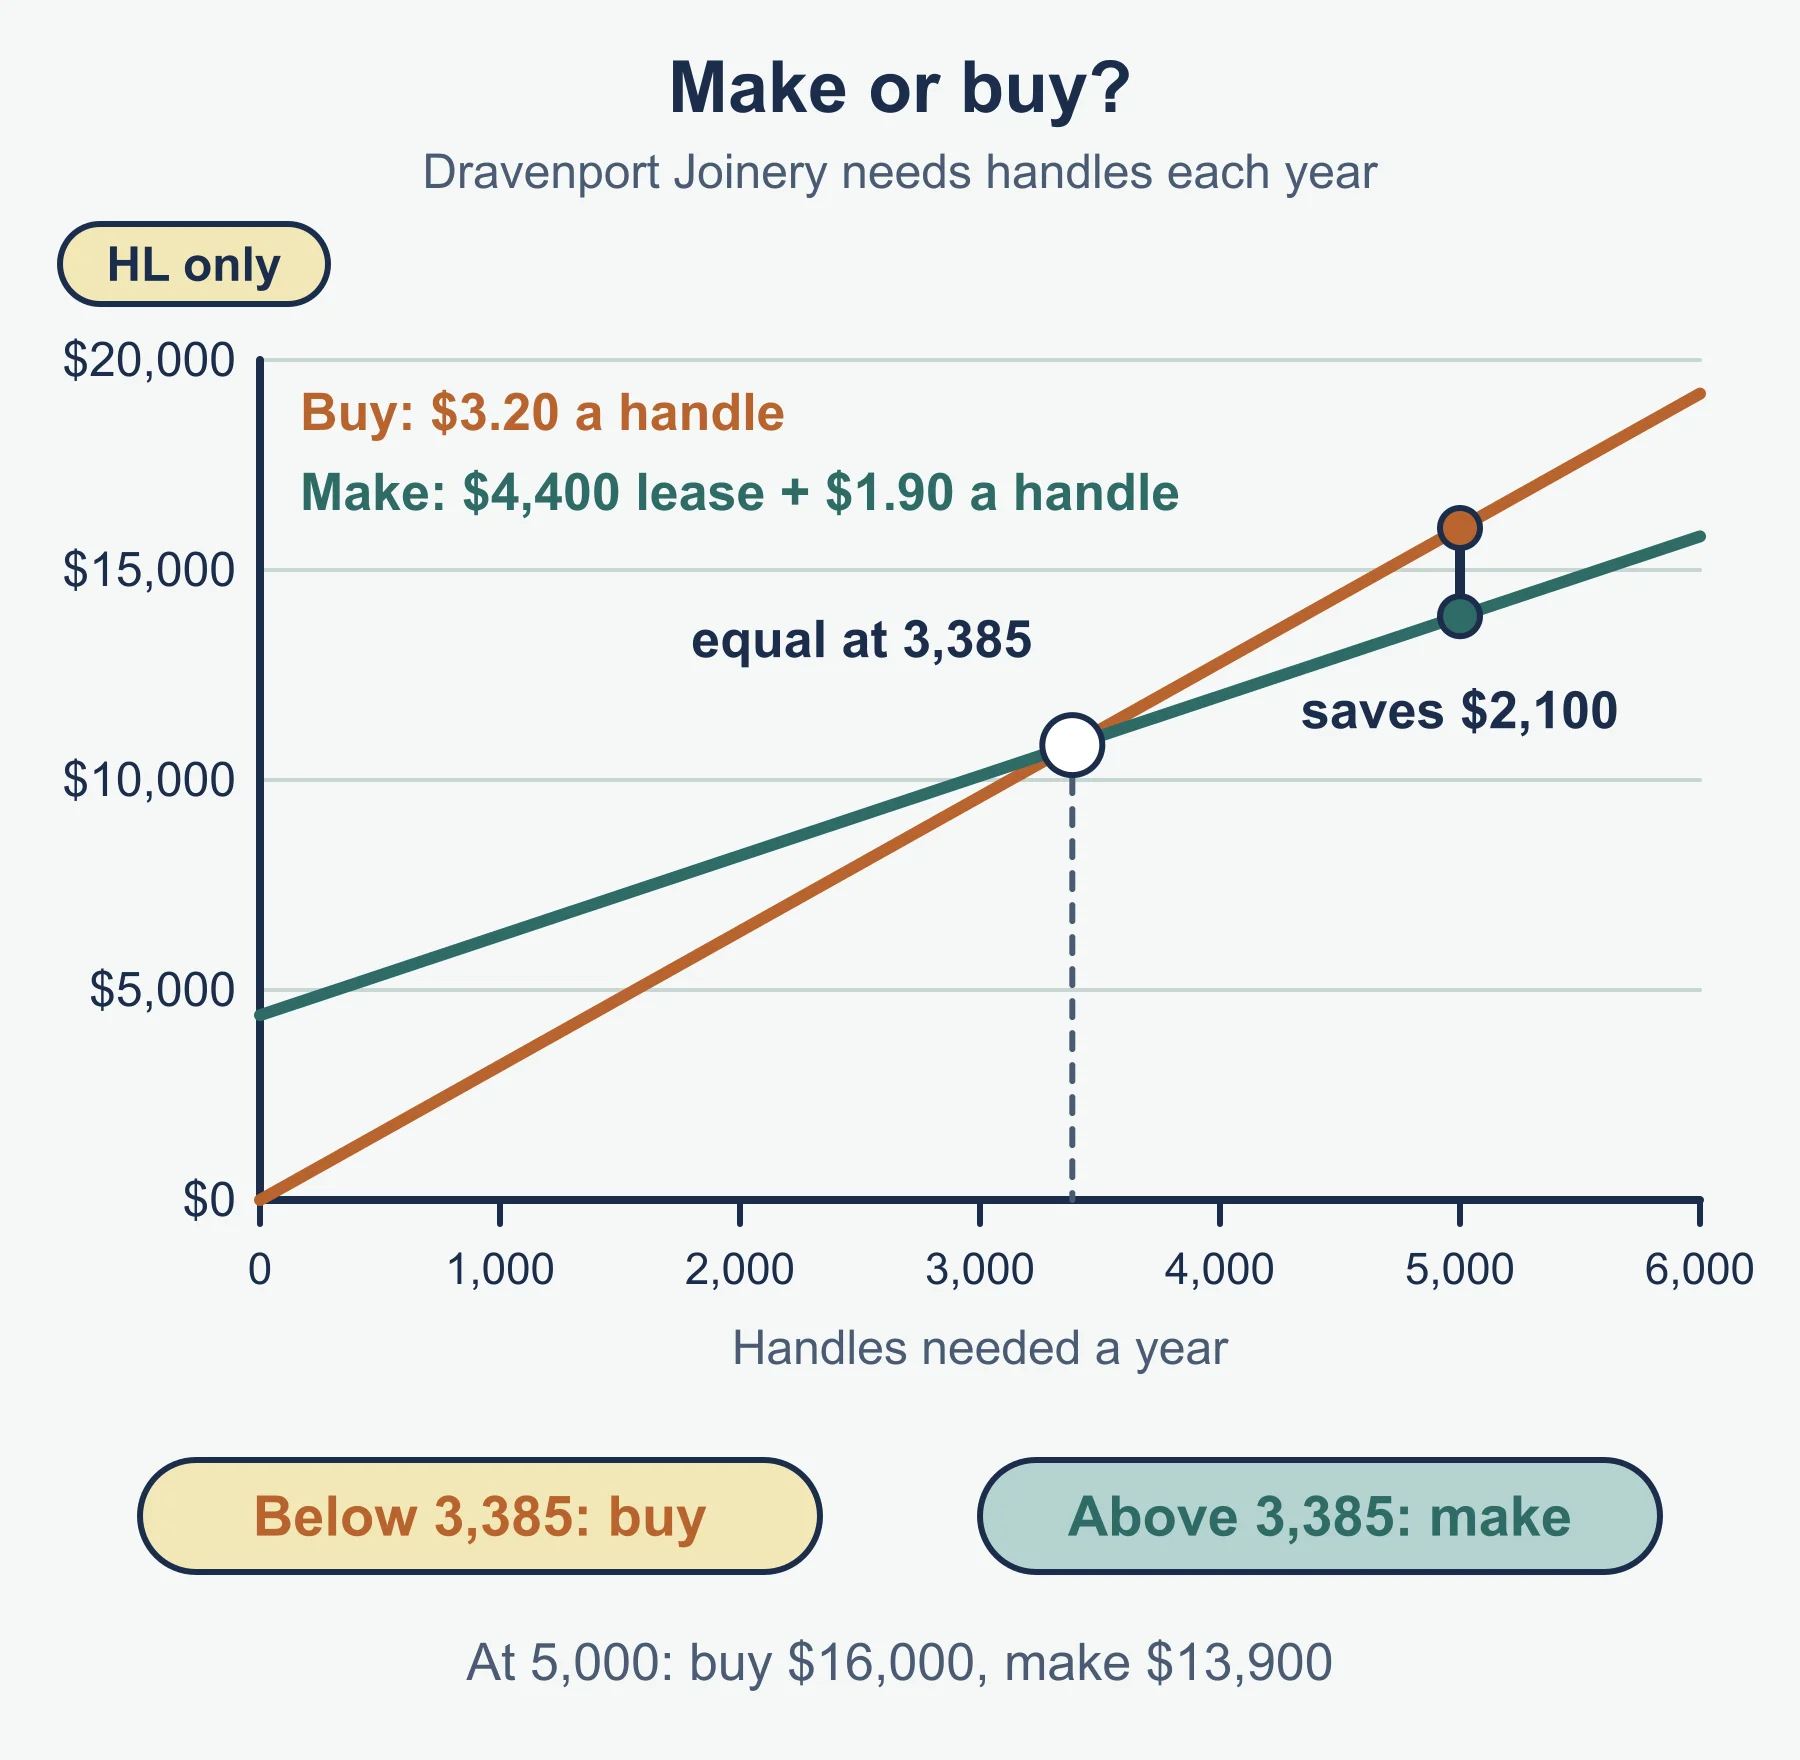
- Find the crossover: extra fixed cost ÷ (buy price − variable cost).
- Add non-numerical factors: quality, control, reliability, flexibility, capacity, confidentiality, stakeholders.
- Reach a judgement linked to the forecast volume.
Operating leverage
- Contribution per unit = price − variable cost per unit.
- Total contribution = contribution per unit × output.
- Profit = total contribution − fixed costs.
- Operating leverage = total contribution ÷ profit.
- Percentage change in profit is roughly operating leverage × percentage change in sales volume (with price, variable cost per unit and fixed costs unchanged).
Small worked reminder
Sedgewick Tiles makes 18,000 tiles with 45 workers. Sales value is USD 90,000 and total input cost is USD 75,000, of which USD 45,000 is variable cost and USD 30,000 is fixed cost.
- Labour productivity = 18,000 ÷ 45 = 400 tiles per worker.
- Productivity rate = 90,000 ÷ 75,000 × 100 = 120%.
Total contribution = 90,000 − 45,000 = USD 45,000 and profit = 90,000 − 75,000 = USD 15,000, so operating leverage = 45,000 ÷ 15,000 = 3. A 5% rise in sales volume gives about a 15% rise in profit.
Must-know distinctions
JIT versus JIC
- JIT: low holding cost, little cash tied up, high dependence on suppliers, risk of stoppage.
- JIC: high holding cost, more cash tied up, protection against delays and surges, risk of waste and obsolescence.
Local versus global supply chain
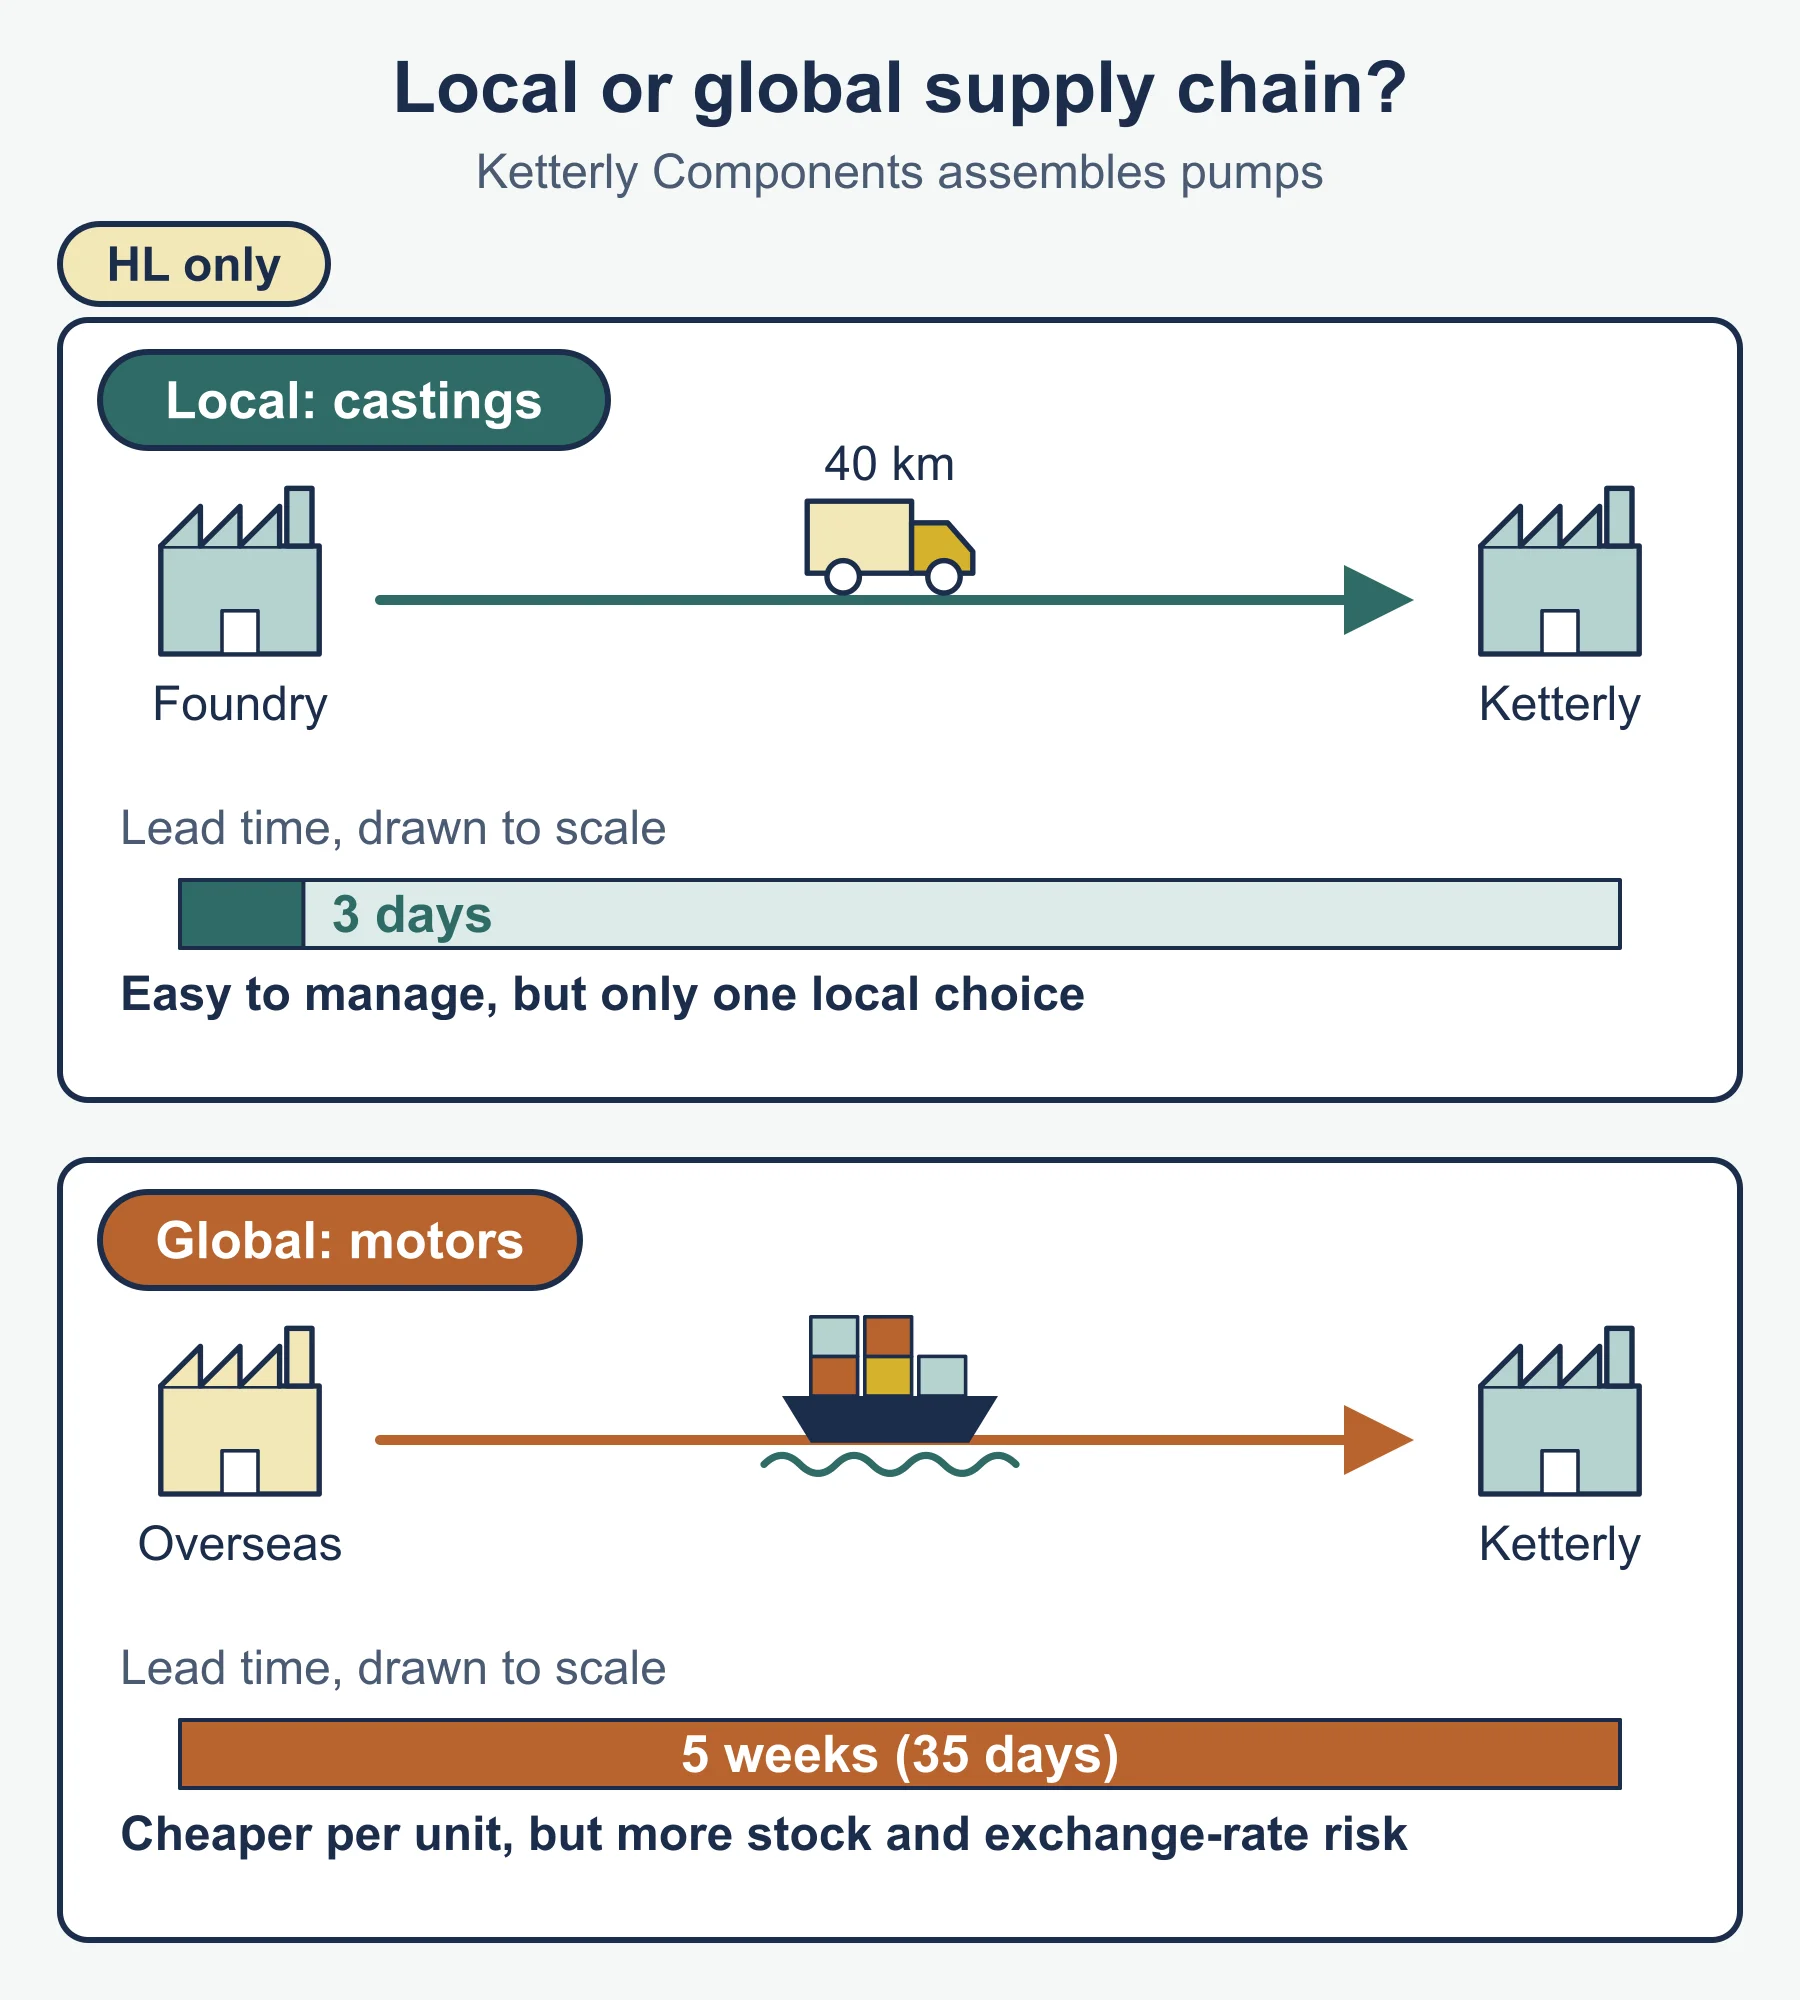
- Local: shorter lead time, easier control, often higher input price, less transport.
- Global: often lower unit cost, longer lead time, exchange-rate and disruption risk, harder oversight.
Buffer stock versus reorder level
- Buffer stock is the floor you try not to go below.
- Reorder level is higher: it equals the buffer plus the stock used while waiting for delivery.
Labour productivity versus productivity rate
- Labour productivity is output per worker or hour, in physical units.
- Productivity rate compares total output with total input, as a percentage, with both measured the same way.
CTB versus CTM
- CTB is mostly variable in quantity. CTM includes extra fixed cost, so making wins at high volume and buying at low volume.
Evaluation prompts for AO3 points
Several points in 5.6 carry AO3, so practise weighing, not only calculating. For each, state a point, develop it with the case, then judge.
- JIT or JIC: What does a stoppage cost compared with the cost of holding stock? How reliable are the suppliers? How steady is demand? Is cash tight? A reasoned judgement often favours JIT with a small buffer, but only if the case supports it.
- Local or global chain: Does the lower unit price outweigh longer lead time, extra stock and exchange-rate risk? Which stakeholders gain or lose, for example workers, suppliers and communities? Would a mix of both reduce risk?
- CTB or CTM: Is the demand forecast reliable enough to commit to the fixed cost of making? What happens to the answer if volume falls below the crossover? Does the business have spare capacity, skills and space? Would making protect quality or confidential designs?
A short model structure for a 6-mark or 8-mark answer: one definition, two developed points for one side, two for the other, a link to the business named in the case, and a final sentence beginning “overall” that makes a choice and gives its condition.
Linking the measures
The measures work together. A rise in capacity utilization usually raises labour productivity, because fixed labour is spread over more output. A rising defect rate lowers the value of useful output, so productivity rate falls even if units made are unchanged. High operating leverage makes profit sensitive to utilization, since low utilization leaves fixed costs uncovered. A short buffer lowers holding costs but raises the risk that a delayed delivery cuts output and utilization. When asked to analyse a business, use two or three of these links and quote the figures.
Quick self-test
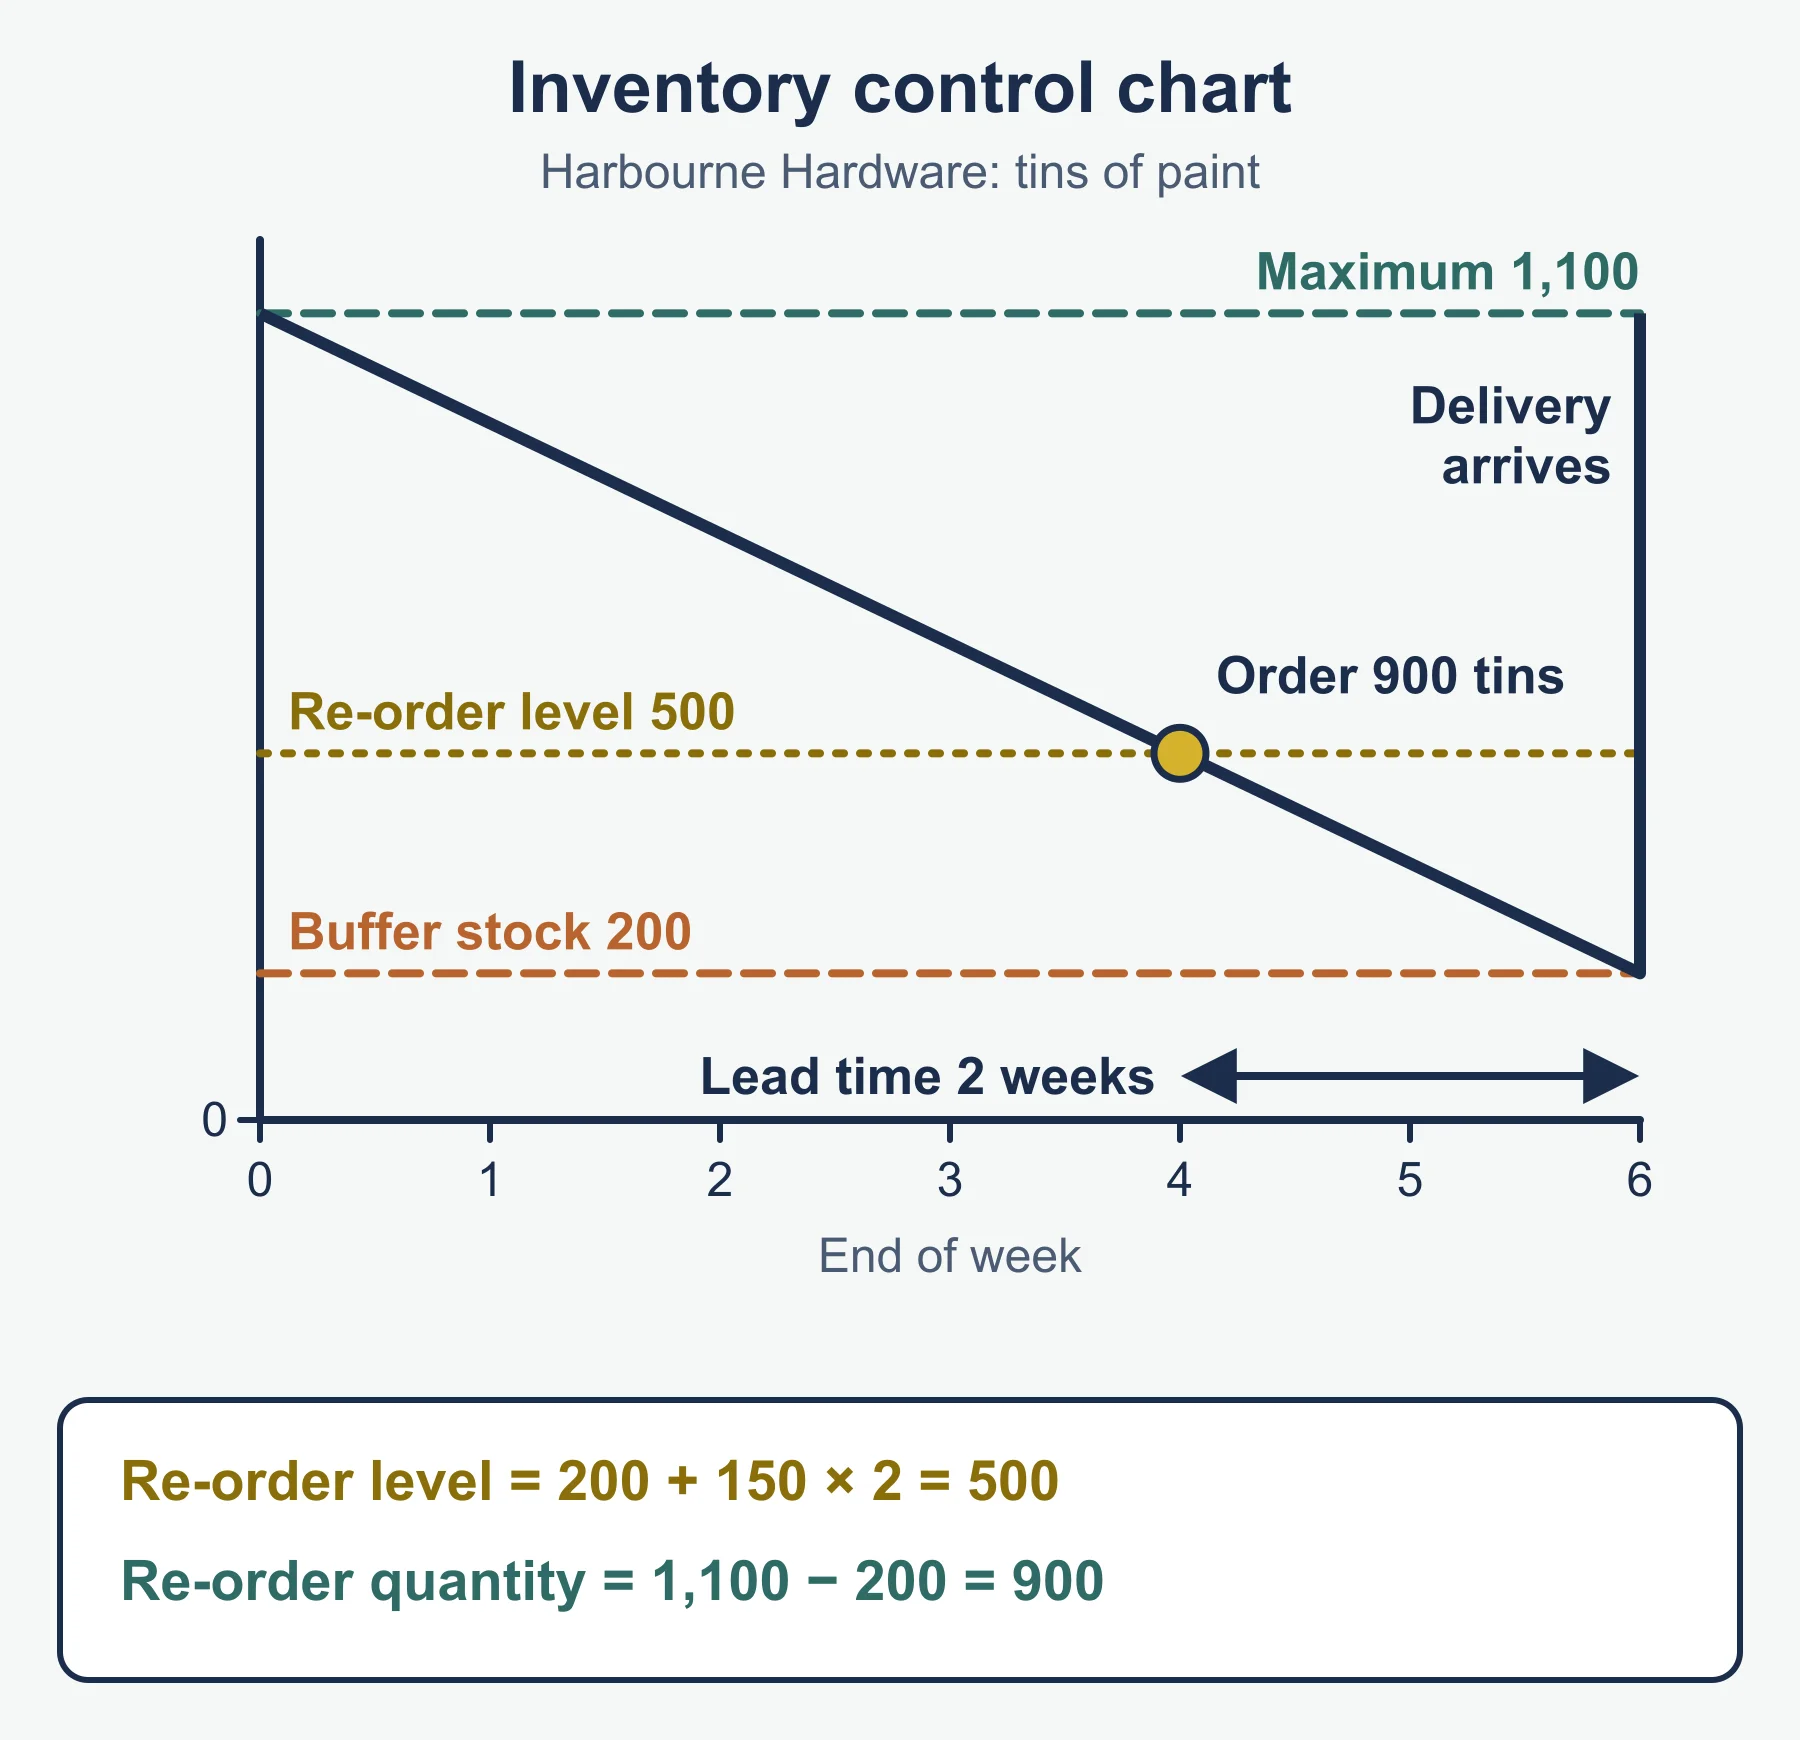
- A business uses 30 units a day, lead time is 4 days and buffer stock is 60 units. Calculate the reorder level.
- The reorder quantity in question 1 is 360 units. Calculate the maximum stock and the days between orders.
- Capacity is 800 units a month and output is 640. Calculate the capacity utilization rate.
- Output rises by 80 units in question 3. State the new rate.
- A firm makes 1,200 units and 48 are defective. Calculate the defect rate.
- Give one cost of a high defect rate and one possible cause.
- Explain one advantage and one disadvantage of a global supply chain.
- State one condition that makes JIT more suitable than JIC.
- Operating leverage is 3. Sales volume falls 5%. Estimate the change in profit.
- Buying costs USD 8 per unit. Making costs USD 5 per unit variable plus USD 4,500 fixed. For 2,000 units, compare CTB and CTM, then find the crossover quantity.
Answers
- 60 + (30 × 4) = 180 units.
- Maximum stock = 60 + 360 = 420 units. Days between orders = 360 ÷ 30 = 12 days.
- 640 ÷ 800 × 100 = 80%.
- 720 ÷ 800 × 100 = 90%.
- 48 ÷ 1,200 × 100 = 4%.
- Cost: scrap, rework, refunds or damaged reputation. Cause: worn machinery, poor materials or inadequate training.
- Advantage: often lower unit cost. Disadvantage: longer lead time and more exposure to delay, exchange rates or disruption.
- Reliable, nearby suppliers with fast delivery, and predictable demand.
- Profit falls by about 15%.
- CTB = 8 × 2,000 = 16,000. CTM = 4,500 + (5 × 2,000) = 14,500. Making is cheaper by 1,500. Crossover = 4,500 ÷ (8 − 5) = 1,500 units. At 1,200 units buying costs 9,600 and making costs 10,500, so buying wins below the crossover.
Where marks are usually lost
- Leaving out the buffer when calculating reorder level.
- Stating a formula but not showing the substitution.
- Dividing utilization by actual output instead of capacity.
- Reporting a percentage without the percent sign or a figure without units.
- Mixing units in the productivity rate.
- Describing JIT or JIC with no link to the business in the case.
- Comparing CTB and CTM with numbers only and no non-numerical factors, or the reverse.
- Writing a one-sided evaluation with no judgement.
- Treating high capacity utilization as always good, with no mention of the lack of slack.
Frequently asked questions
How do you calculate the reorder level? The reorder level is buffer stock plus usage during the lead time, which is daily usage multiplied by lead time in days. This is a standard form, as the guide does not give the formula.
What is the difference between buffer stock and reorder level? Buffer stock is the minimum stock kept as a safety margin, the floor you try not to go below. The reorder level is higher: it equals the buffer plus the stock used while waiting for a delivery.
How do you find the volume at which making and buying cost the same? Divide the extra fixed cost of making by the difference between the buy price and the variable cost of making per unit. Above that volume making is cheaper; below it buying is cheaper.
Which production planning formulas are given in the IB guide? The guide’s formulae section gives capacity utilization rate (actual output divided by productive capacity, times 100) and productivity rate (total output divided by total input, times 100). Other measures, such as defect rate and operating leverage, use standard forms.
Official syllabus
IB Diploma Programme Business management guide, first assessment 2024, published by the International Baccalaureate Organization. This page covers section 5.6, Production planning (HL only).
Get free revision emails (optional)
Occasional emails with practice questions, worked explanations and links to free resources for the qualification and subjects you choose. No spam, and you can unsubscribe from any email. The free tools on this site never need an email.
Related resources
-
Study guides
IB DP Business Management: Research and development (HL only) and Management information systems (HL only)
Study guide to IB DP Business Management 5.8 and 5.9 (HL only): R&D, intellectual property, innovation, data, AI, cybersecurity and ethics.
Business · International Baccalaureate · IB
Read guide -
Practice questions
IB DP Business Management: R&D (HL only) and Management information systems (HL only) – Practice Questions
Original practice questions with worked answers for IB DP Business Management 5.8 R&D and 5.9 management information systems (HL only).
Business · International Baccalaureate · IB
Try questions -
Revision notes
IB DP Business Management: R&D (HL only) and Management information systems (HL only) – Revision Notes
Condensed IB DP Business Management revision notes for 5.8 R&D and 5.9 management information systems (both HL only), with a self-test.
Business · International Baccalaureate · IB
Revise topic
Related articles
-
teaching
A Level tuition in Dubai: Cambridge or Pearson Edexcel International A Level?
Schools in Dubai and Abu Dhabi teach either Cambridge International AS & A Level or Pearson Edexcel International A Level. How the two are structured, why it matters for tuition, and how online classes from Lahore work.
9 October 2026
-
curriculum guides
Choosing subjects at IGCSE and A Level
How subject choices at 14 and 16 affect university options later, and how to keep pathways open without overloading a timetable.
28 July 2026
Studying this with a teacher
Working through Business IB?
This page is free and stays free. If you would rather be taught it, Marlbridge runs Business classes one-to-one, online in your own time zone. The first trial class is free. WhatsApp replies within an hour (8am–11pm Pakistan time, every day); email the same day.
IB Business teachers at Marlbridge

