
Study Guides
IB DP Geography: Fieldwork (internal assessment) – Study Guide
How to plan, collect, present and evaluate fieldwork data for the IB Diploma Programme Geography internal assessment, with a worked Spearman's rank example.
- Subject
- Geography
- Level
- IB
- Topic
- Fieldwork (internal assessment)
- Author
- Marlbridge Academic Team
- Updated
- Reviewed by
- Azam Siddique (what this means)
Aligned to International Baccalaureate IB Diploma Programme Geography (DP Geography), First assessments 2019. Official specification .
Syllabus page (what it covers and how it is assessed): IB Diploma Programme Geography.
Syllabus topics and points this page is mapped to
DP Geography
- 14 Fieldwork (internal assessment) (topic-level mapping)
"Topic-level mapping" means this page belongs to that topic; it does not claim to cover every point in it.
This guide covers the fieldwork internal assessment (IA) in IB Diploma Programme Geography (first assessments 2019). The IA is an investigation you carry out yourself: you identify a geographical question, collect primary data in the field, process and present it, analyse it and evaluate the whole investigation in a written report. Because the task is individual and your teacher supports but does not direct it, the quality of your planning matters as much as the quality of your writing. This guide teaches the method and a sensible report structure. Always check the current subject guide and your teacher’s instructions for the exact requirements, word limit and marking criteria, because those take priority over anything here.
What the IA is for
Fieldwork tests whether you can behave as a geographer: ask a focused question, choose methods that can answer it, gather reliable evidence, and judge how far the evidence supports a conclusion. Marks reward clarity of purpose, appropriate methods, sound handling of data, honest analysis and critical evaluation. They do not reward the size or exotic location of the study. A small, well-designed investigation in your own locality usually beats an ambitious one that cannot be completed carefully.
Planning the investigation
- Choose a manageable question. It should be focused, answerable with data you can collect yourself, and linked to ideas from the geography course. A question that asks how one variable changes with another, or whether two places differ, is easier to test than a broad “why” question.
- State the geographical context. Explain where the study takes place, why the place suits the question, and the underlying theory or expectation, using ideas you can support.
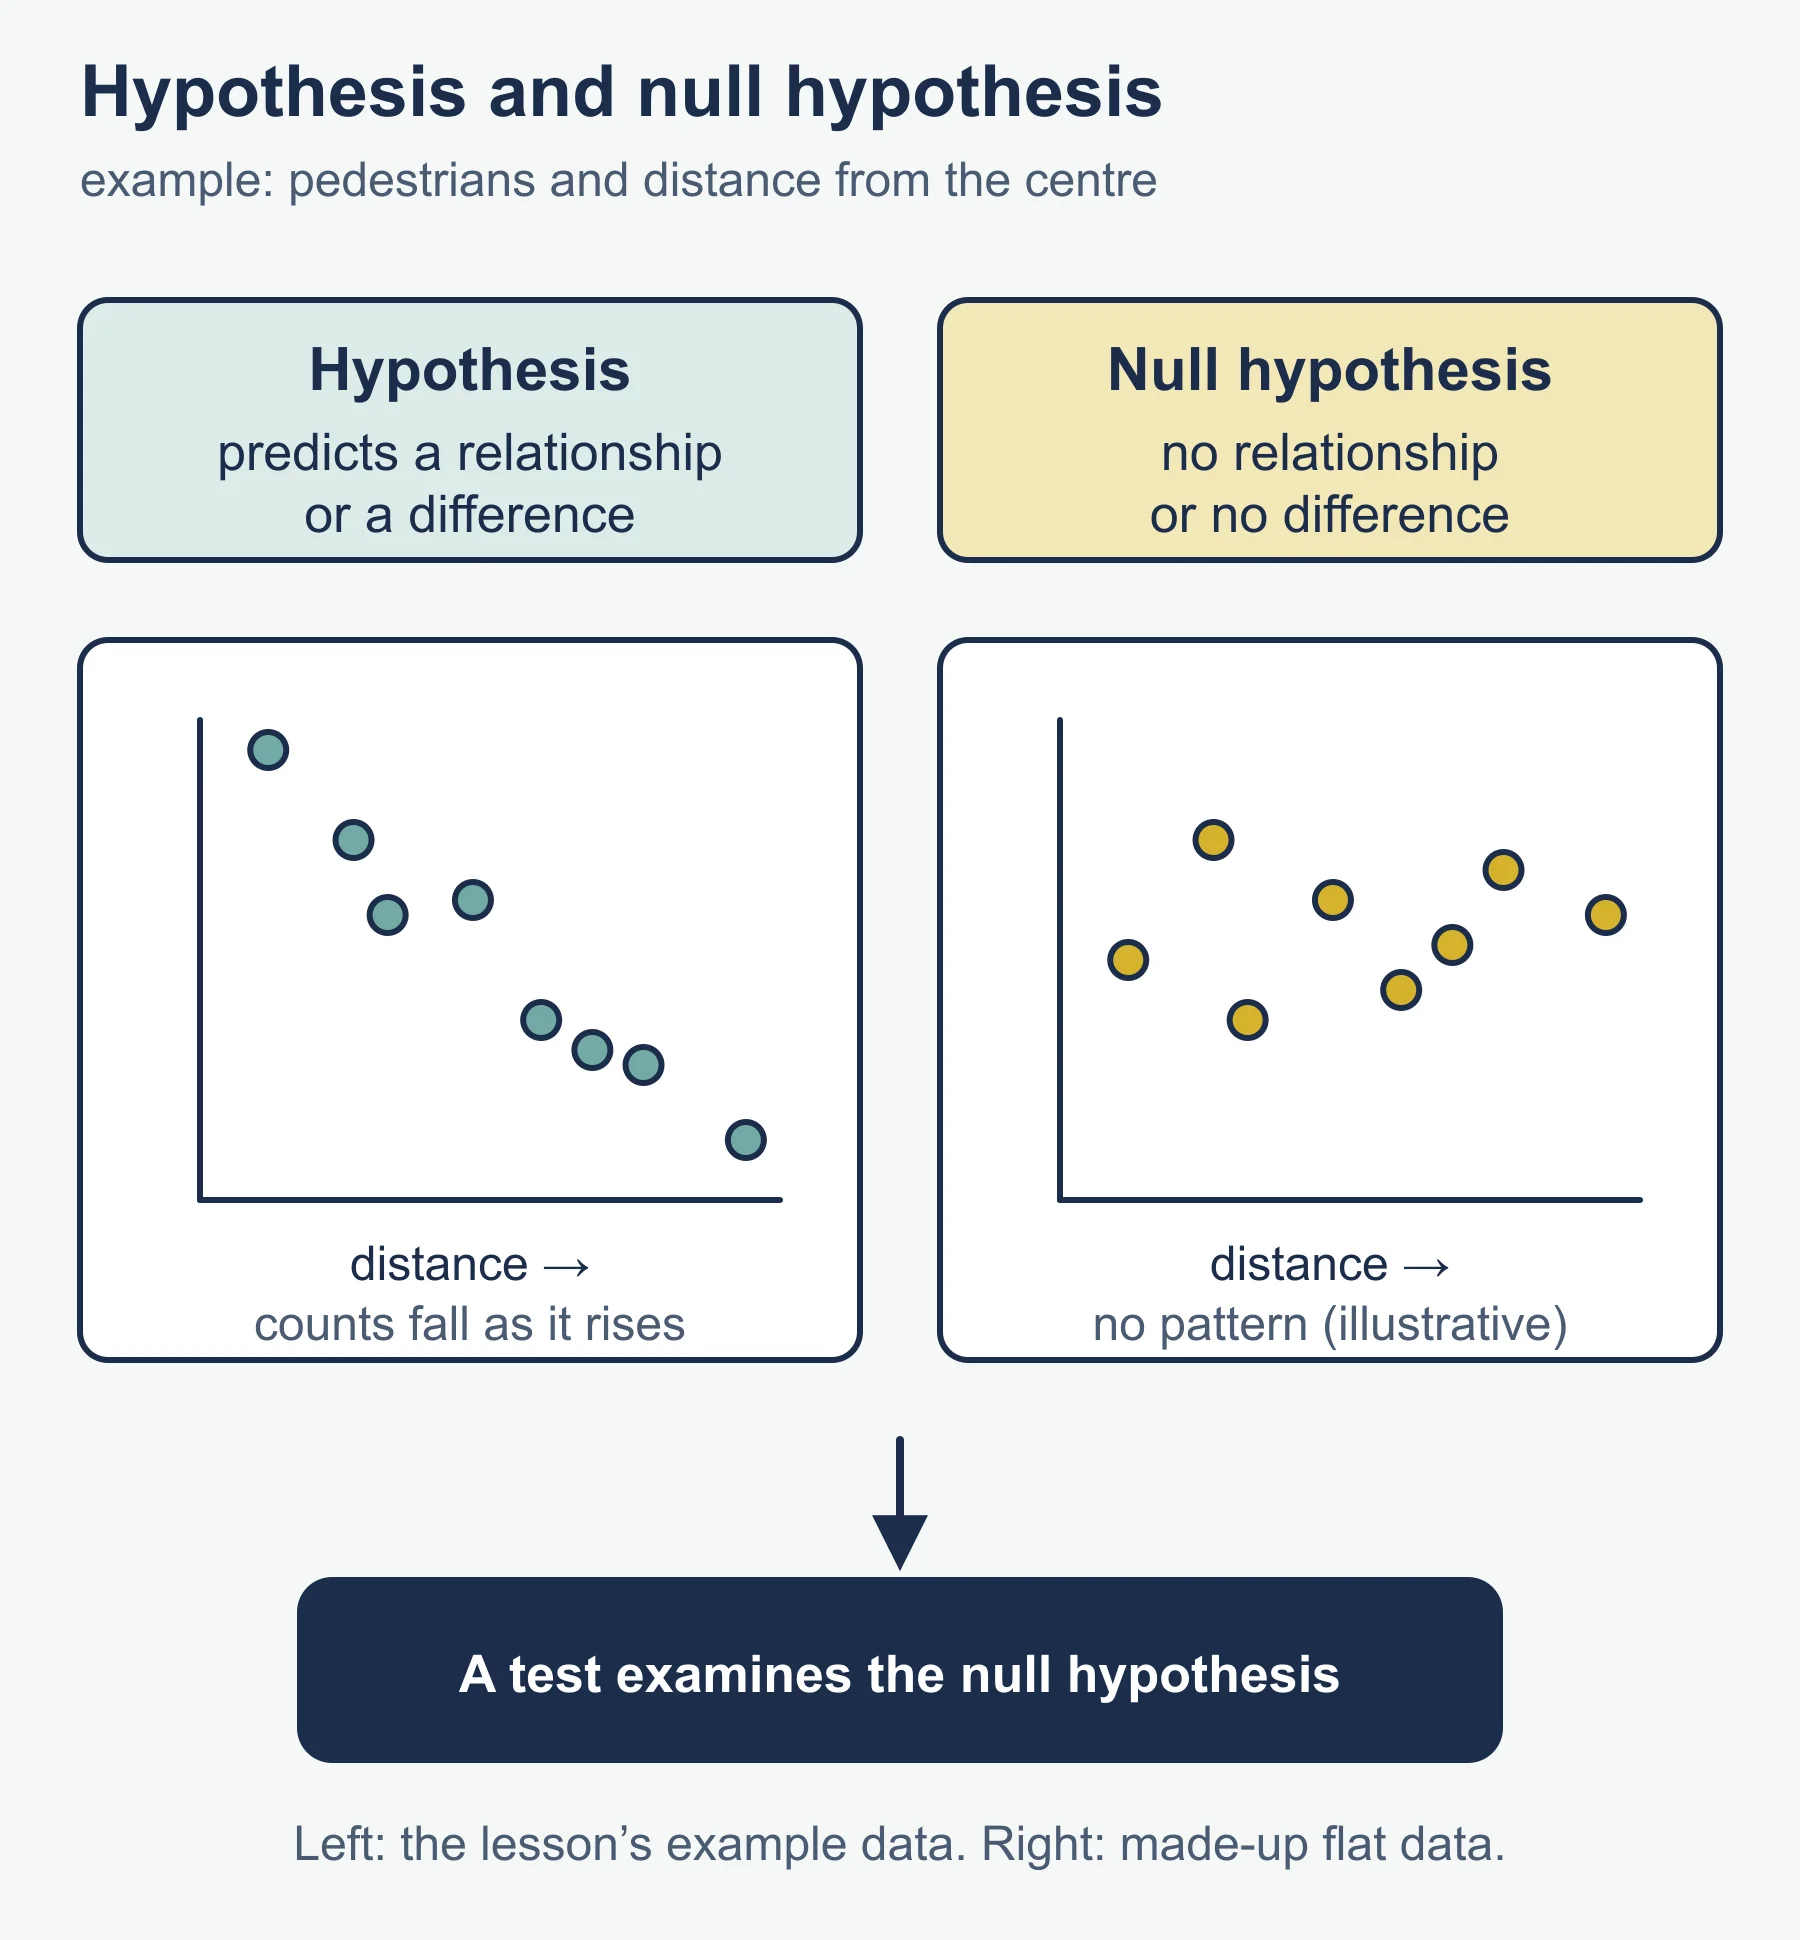
- Write hypotheses. A hypothesis predicts a relationship or difference. A null hypothesis states that there is no relationship or difference, and is what a statistical test actually examines.
- Decide what data you need. List variables, how each will be measured, and the units. Check that the methods can produce enough data to analyse.
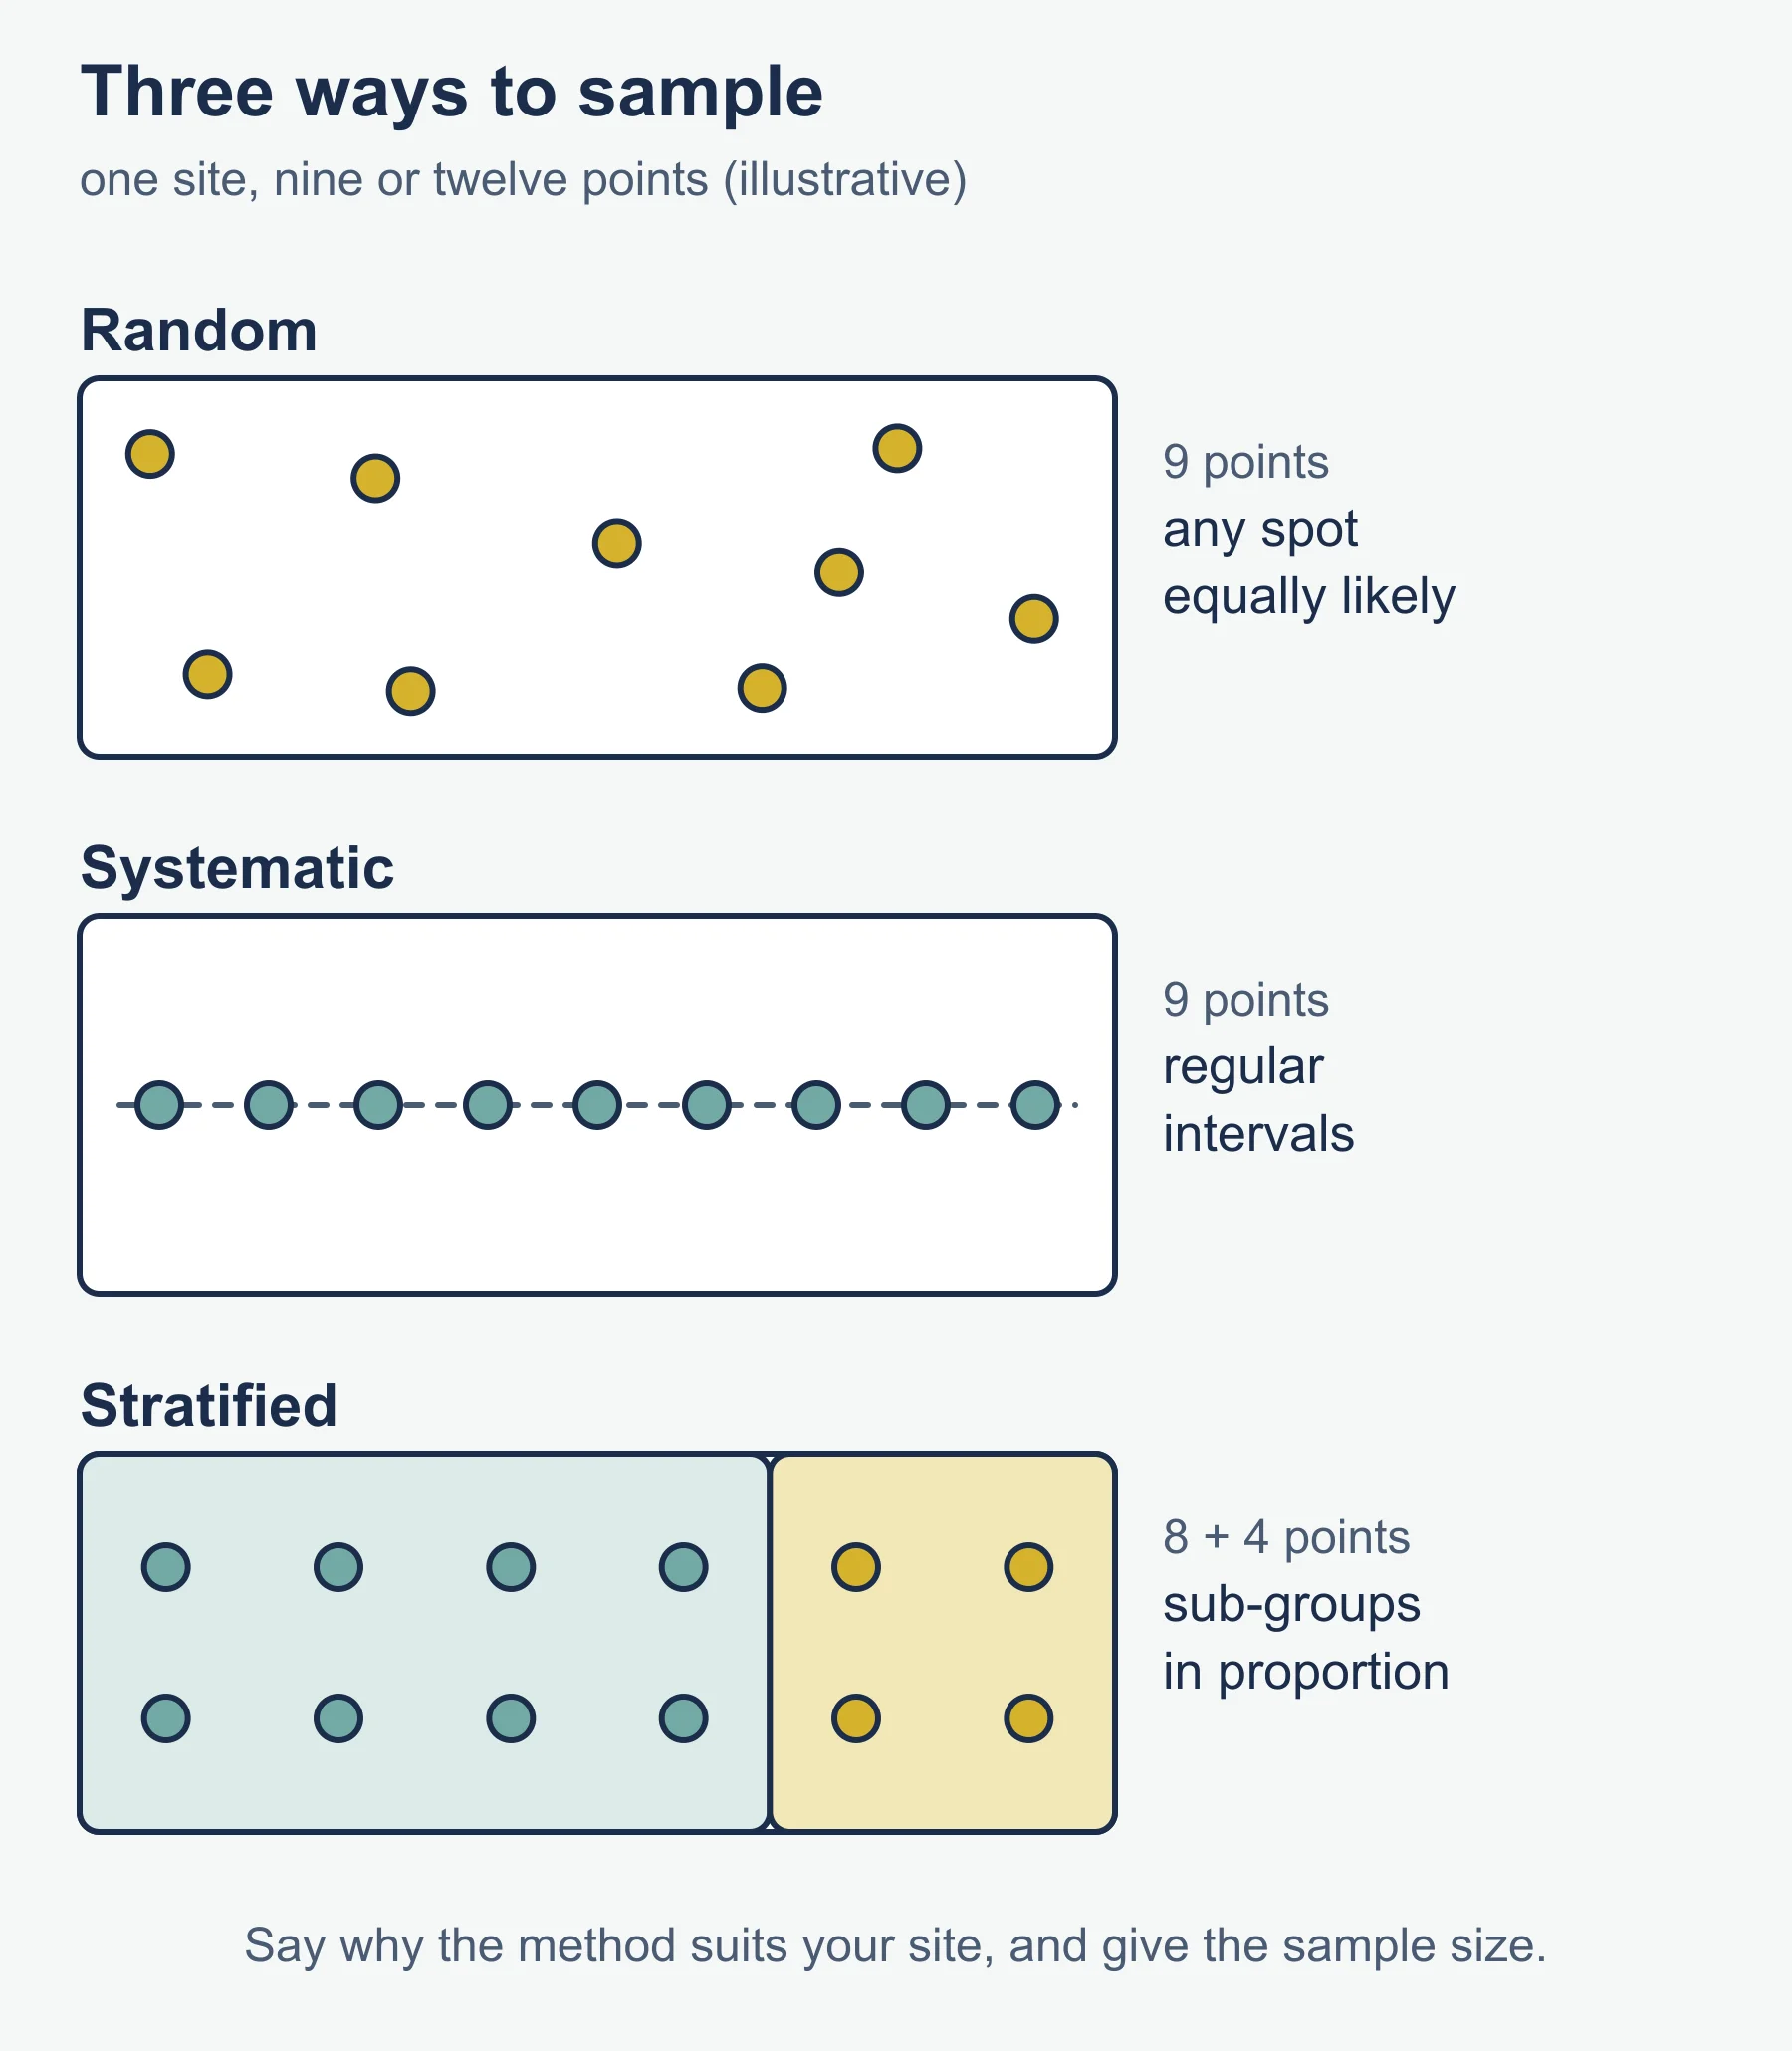
- Plan sampling. Random sampling avoids bias; systematic sampling takes points at regular intervals; stratified sampling ensures each sub-group is represented in proportion. Explain why the method suits your site and give the sample size and its limits.
- Pilot and risk-assess. A short trial exposes problems in equipment, timing or definitions. A risk assessment covers hazards, such as traffic, weather and water, and the precautions you take. Consider ethical points such as consent when you ask people questions, and respect for private property and wildlife.
Collecting data
Record data directly on prepared sheets, with units, times, dates and exact locations. Keep conditions as comparable as possible, and note anything that could affect results, such as weather or time of day. Take more readings than the minimum: repeat measures reduce the effect of anomalies. For questionnaires, write clear, unbiased, closed questions and aim for a fair spread of respondents. Keep the raw data so that you can show it, and use a secondary source only to add context, not to replace your own data.
Processing and presenting data
Choose techniques to fit the data and the question.
- Graphs: scatter graphs for relationships, bar charts for categories, line graphs for change, kite or radial diagrams where the pattern is spatial.
- Maps and annotated photographs or sketches to show location and spatial patterns.
- Summary statistics: mean, median, range and interquartile range.
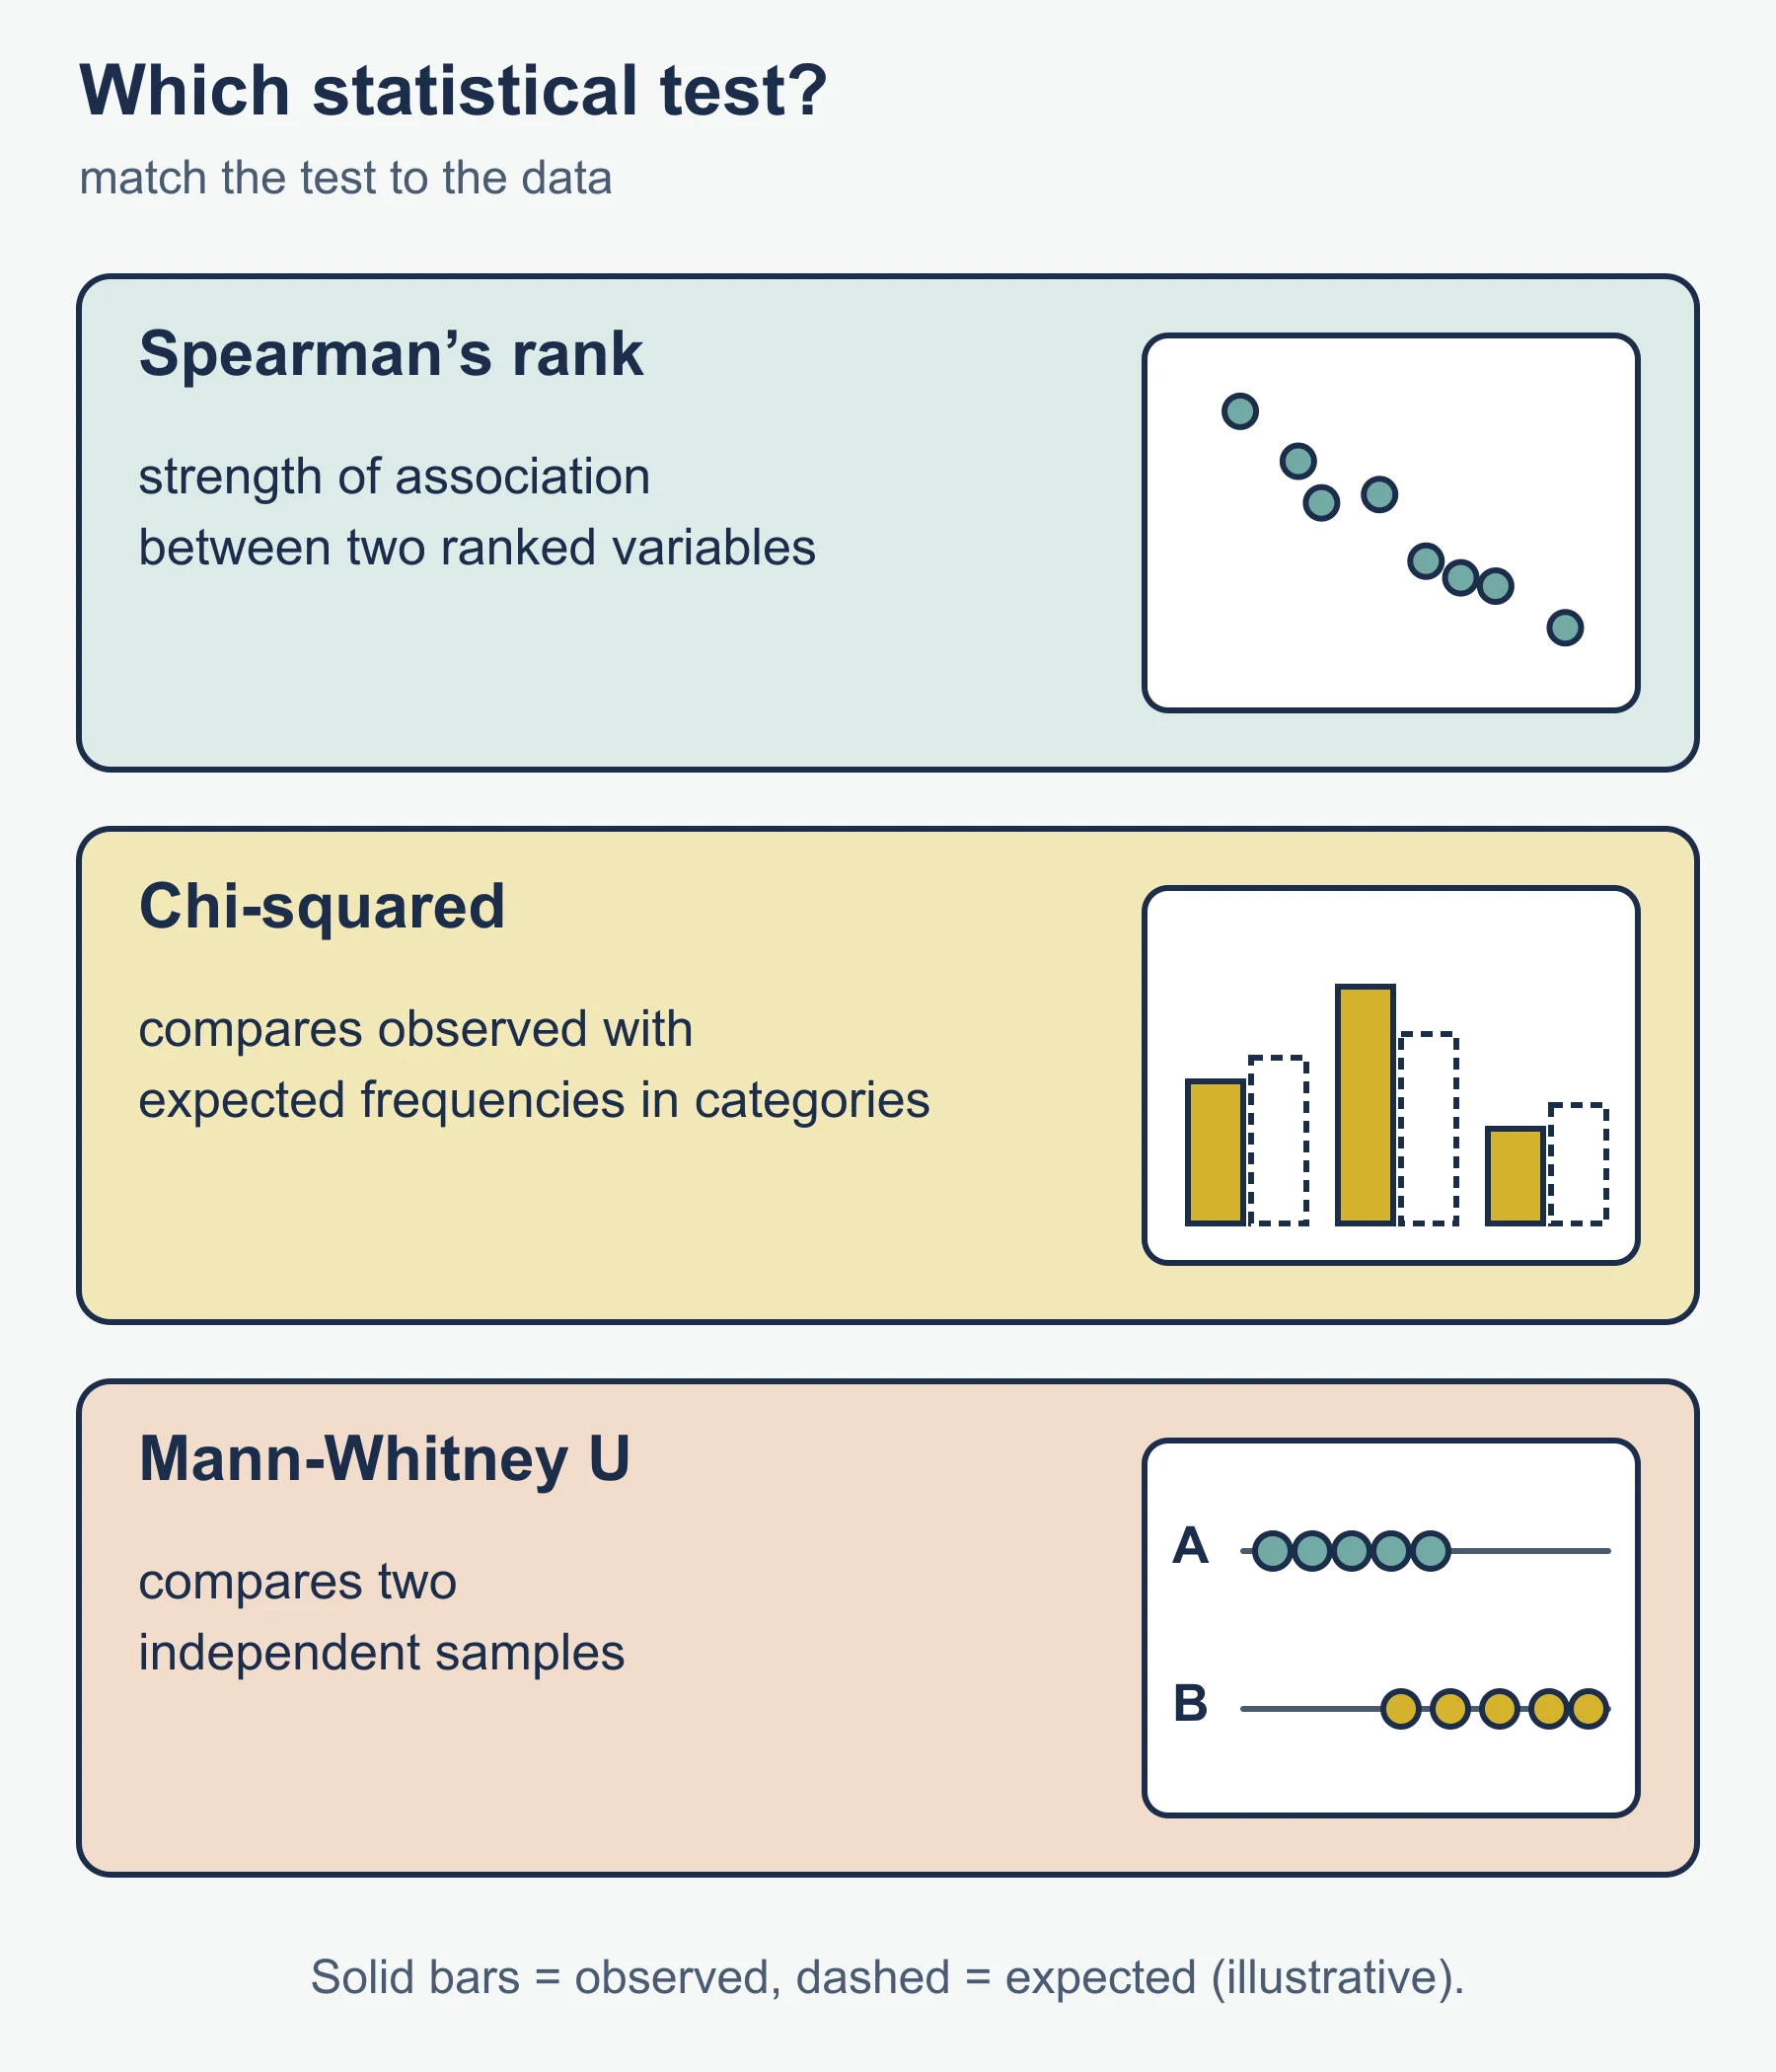
- Statistical tests: choose a test that matches your data. Spearman’s rank correlation tests the strength of association between two ranked variables. A chi-squared test compares observed with expected frequencies in categories. A Mann-Whitney U test compares two independent samples.
Every figure should have a title, labelled axes with units, and a source, and each should be referred to in the text. Do not include presentation for its own sake: each graph or test must help answer the question.
Analysis, conclusion and evaluation
In the analysis, describe patterns first, then explain them with geographical reasoning, and refer to numbers and anomalies. Interpret test results carefully: statistical significance is a statement about the chance of seeing such data if the null hypothesis were true, not proof. The conclusion should answer the original question directly and say whether the hypothesis is supported.
The evaluation looks critically at the whole investigation.
- Reliability and accuracy of measurements, and the effect of sample size.
- Sampling bias and whether the site was representative.
- Validity: did the data really measure what the question asked?
- Limits of time, access and equipment.
- Realistic improvements and how they would change the confidence of your conclusion.
A sensible report structure
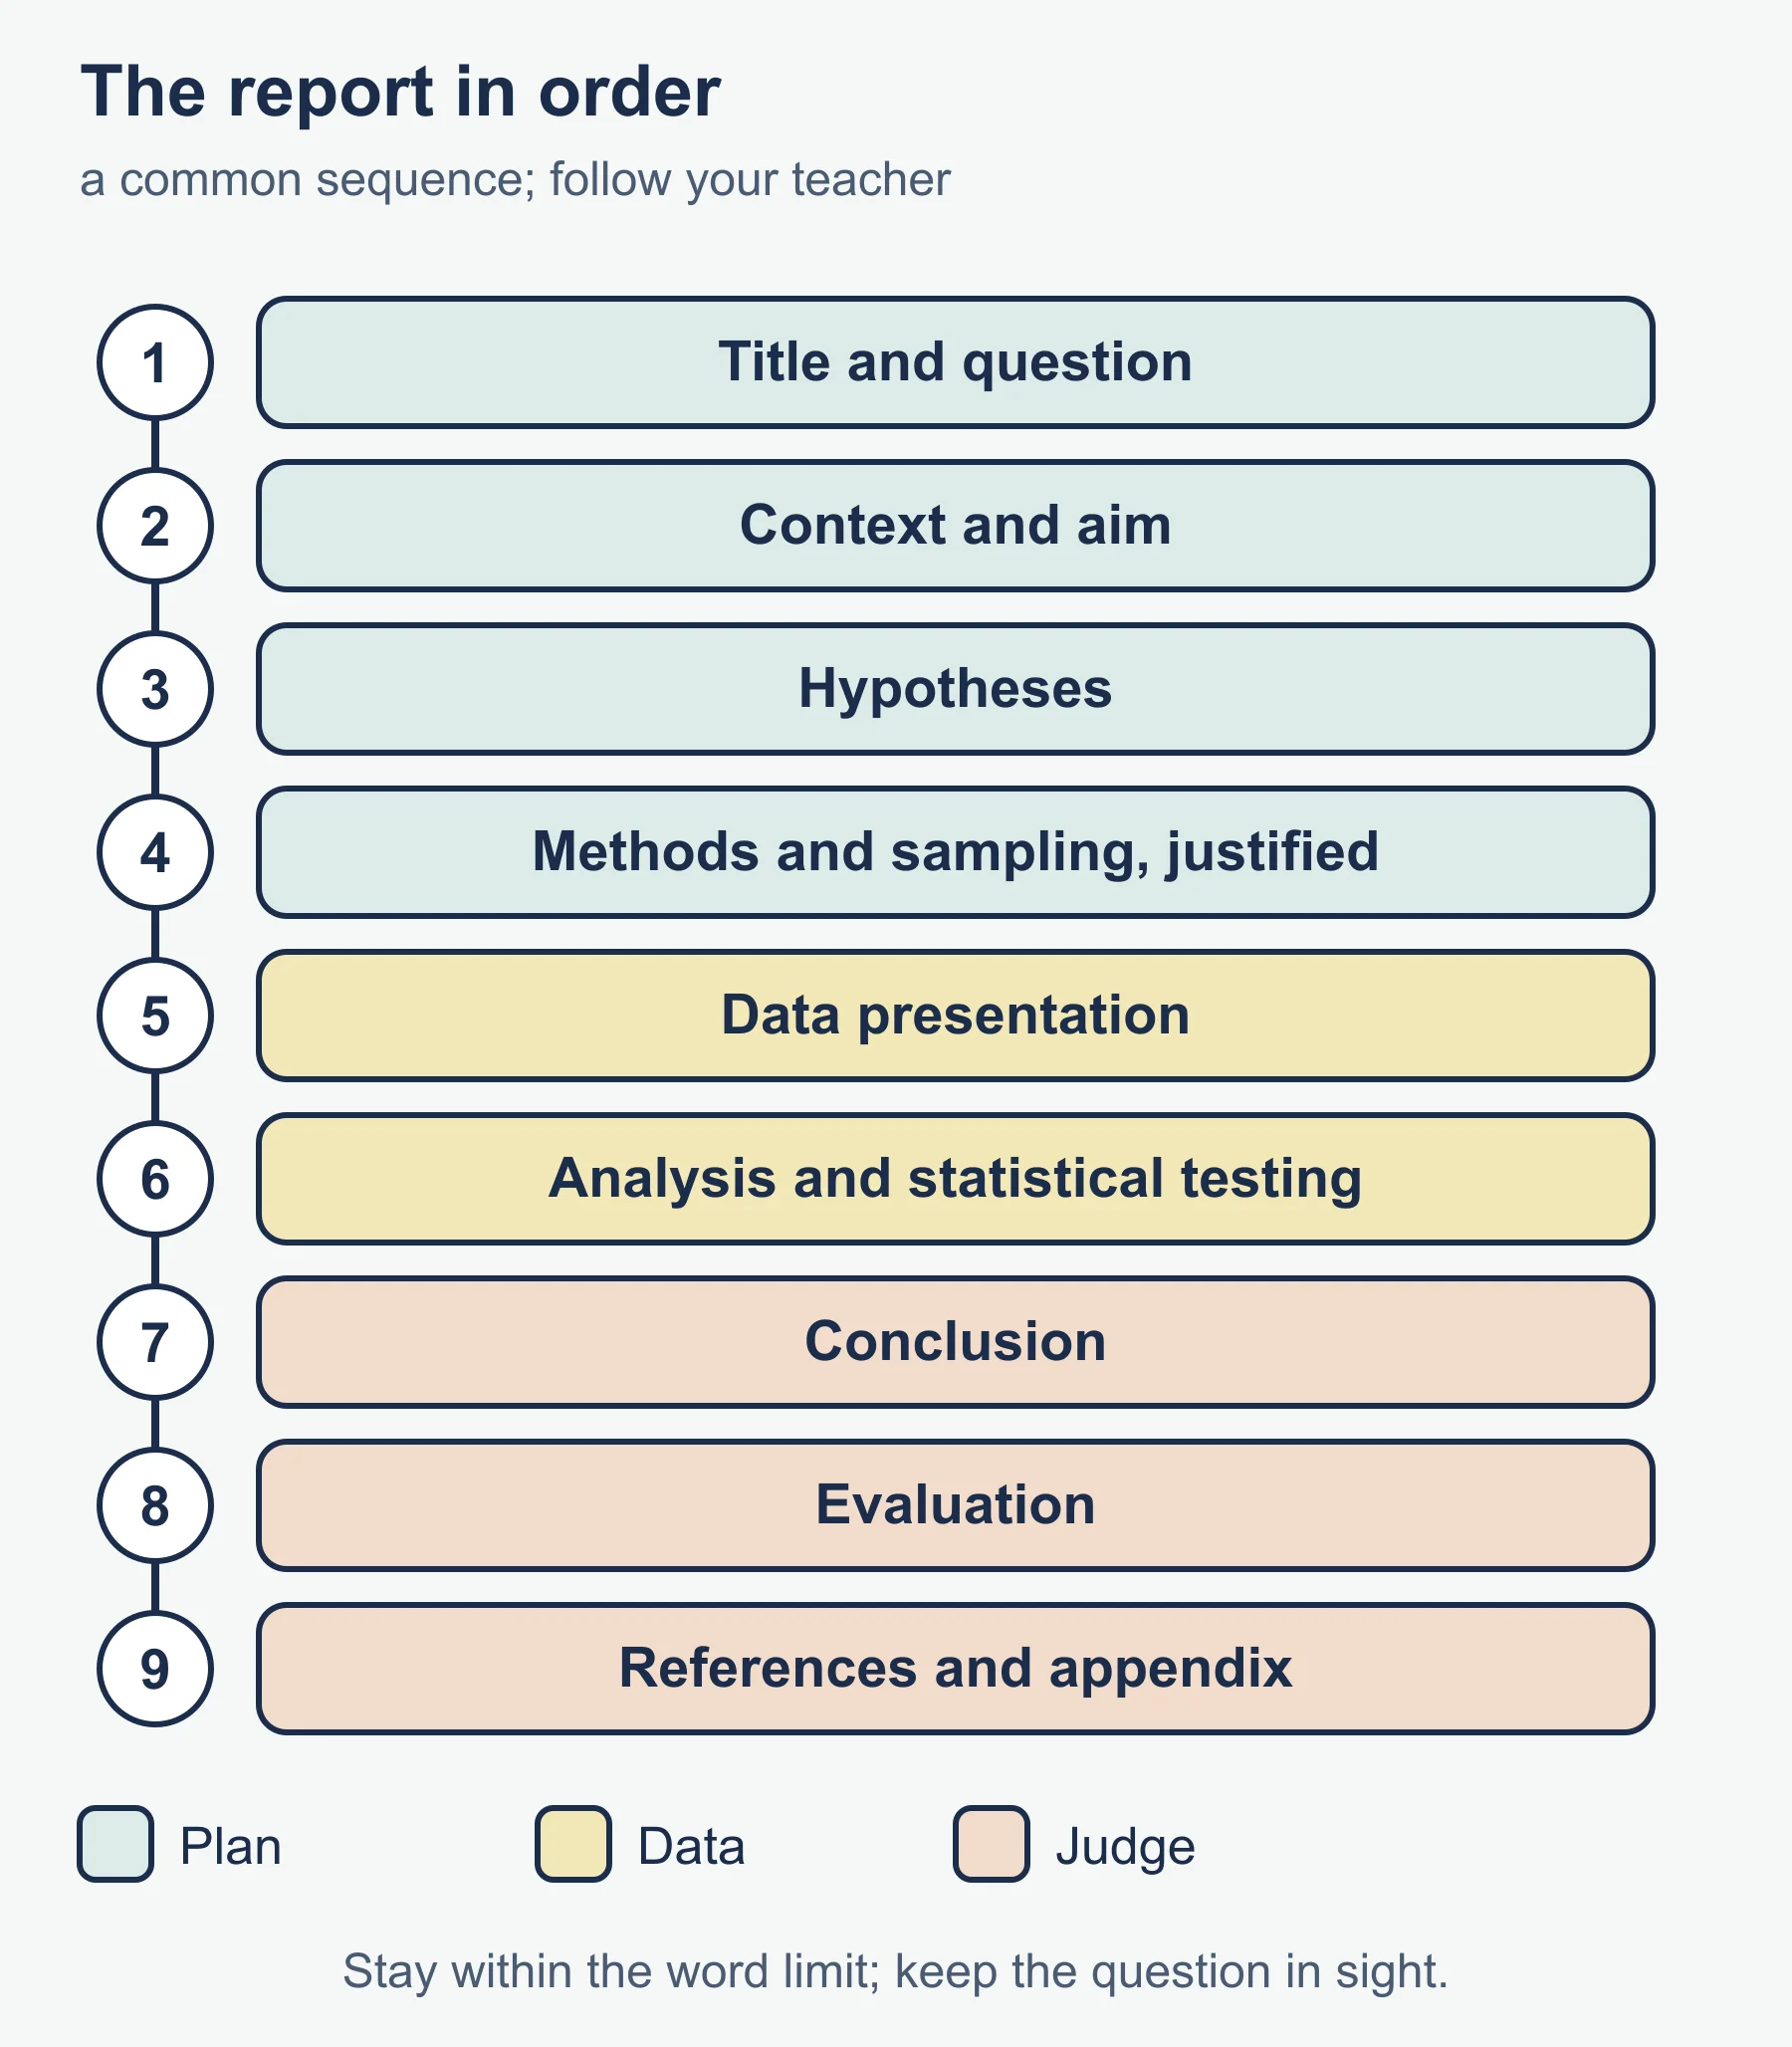
Follow the order the criteria suggest and your teacher advises. A common sequence is: title and question; context and aim; hypotheses; methods and sampling with justification; data presentation; analysis and statistical testing; conclusion; evaluation; references and appendix for raw data where permitted. Write concisely, keep the question in sight, and stay within the word limit.
Worked example: Spearman’s rank correlation
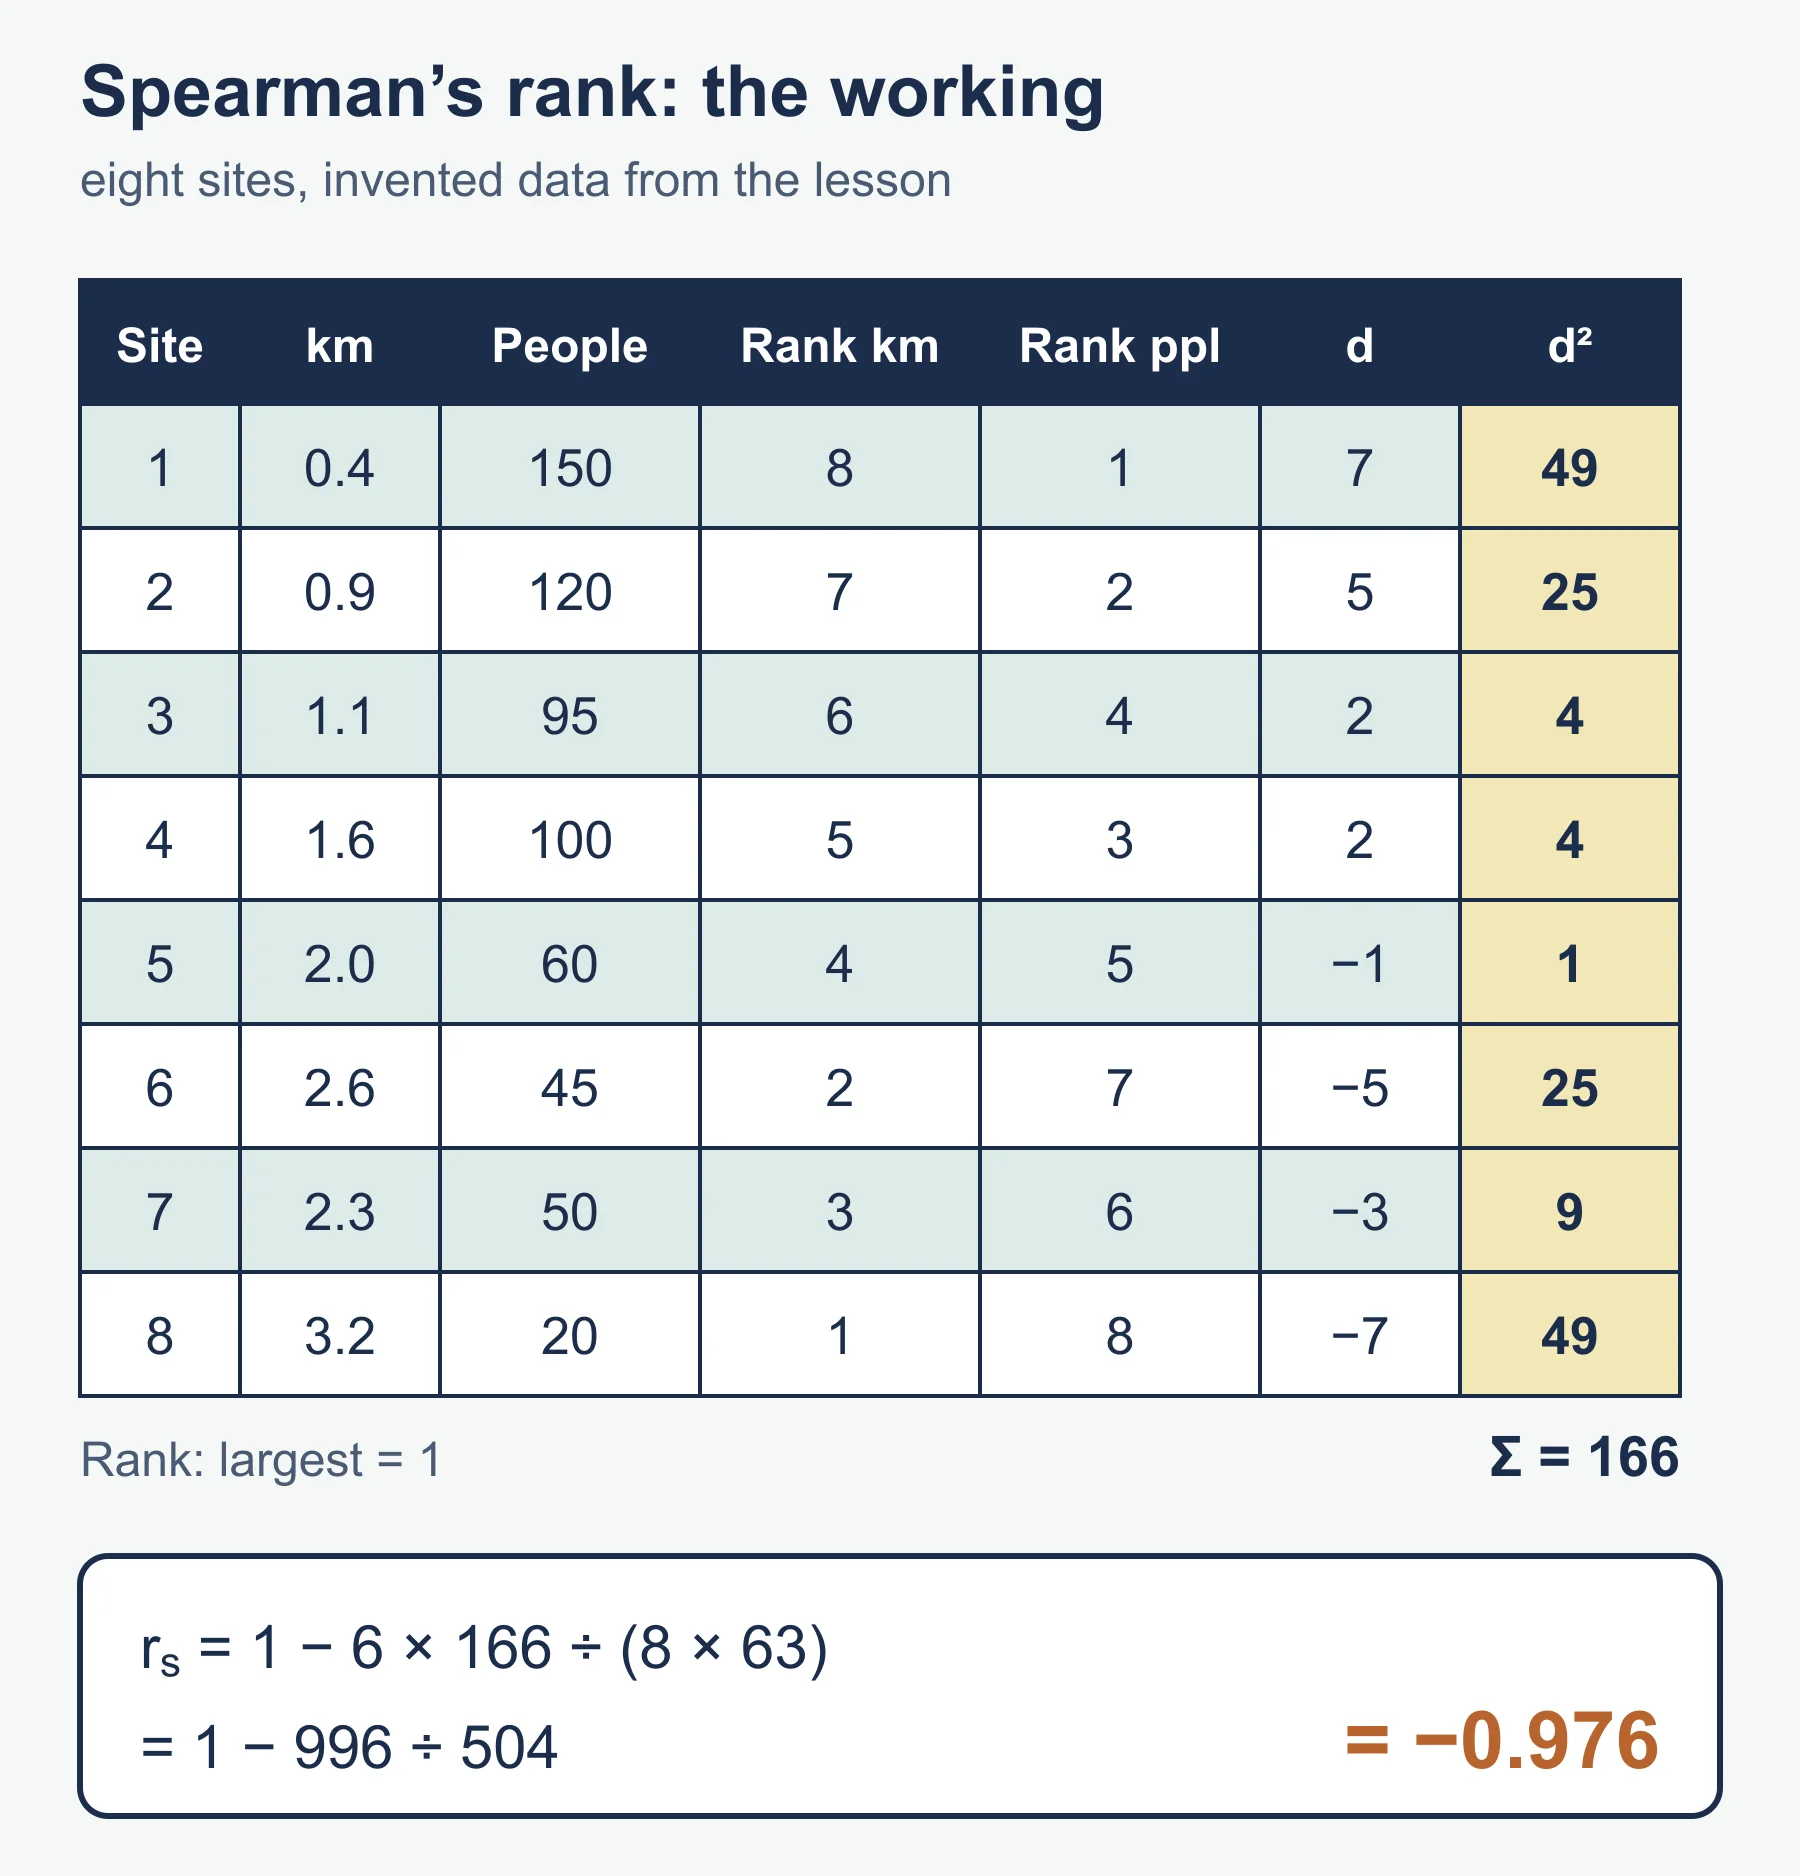
Suppose a student tests whether pedestrian counts fall with distance from the centre of a town. They sample eight sites. The data below are invented.
| Site | Distance (km) | Pedestrians per 10 min | Rank distance (largest = 1) | Rank pedestrians (largest = 1) | d | d squared |
|---|---|---|---|---|---|---|
| 1 | 0.4 | 150 | 8 | 1 | 7 | 49 |
| 2 | 0.9 | 120 | 7 | 2 | 5 | 25 |
| 3 | 1.1 | 95 | 6 | 4 | 2 | 4 |
| 4 | 1.6 | 100 | 5 | 3 | 2 | 4 |
| 5 | 2.0 | 60 | 4 | 5 | -1 | 1 |
| 6 | 2.6 | 45 | 2 | 7 | -5 | 25 |
| 7 | 2.3 | 50 | 3 | 6 | -3 | 9 |
| 8 | 3.2 | 20 | 1 | 8 | -7 | 49 |
The sum of d squared is 49 + 25 + 4 + 4 + 1 + 25 + 9 + 49 = 166. With n = 8, rs = 1 - (6 x 166) / (n(n squared - 1)) = 1 - 996 / (8 x 63) = 1 - 996 / 504 = 1 - 1.976 = -0.976.
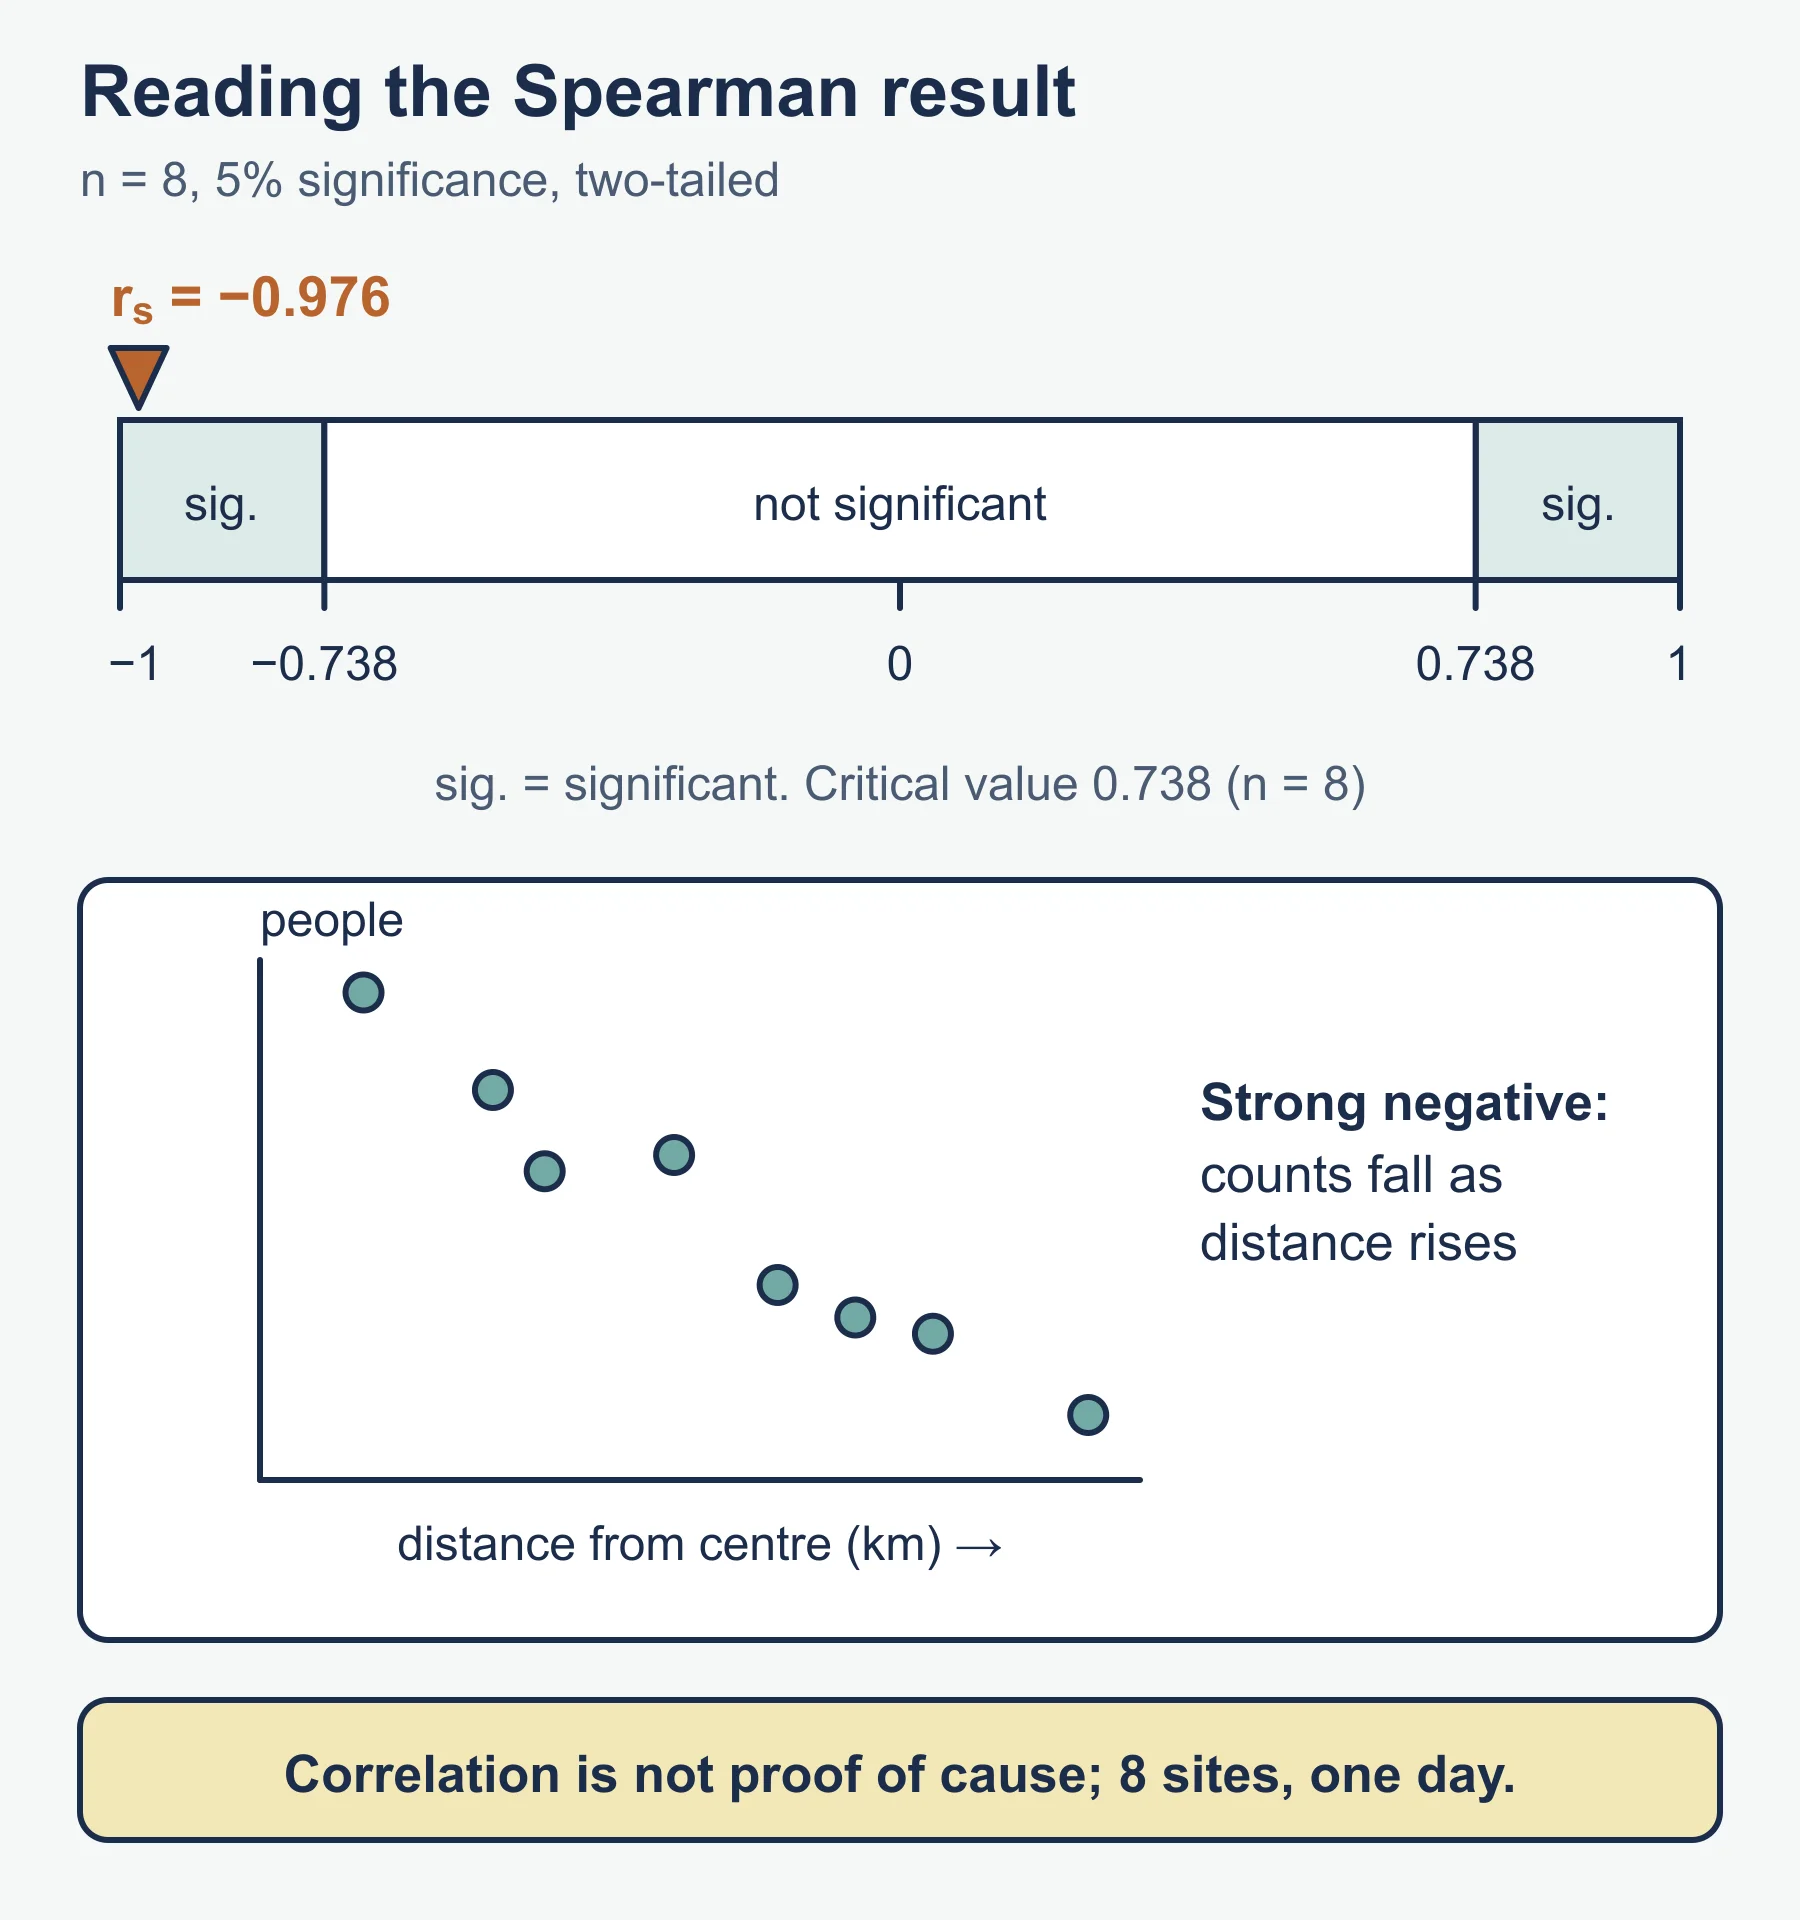
The value is close to -1, a very strong negative correlation: pedestrian numbers fall as distance rises. For n = 8, the critical value at the 5 per cent significance level (two-tailed) is 0.738, so the result is significant and the null hypothesis can be rejected. Check the table in your own materials. Then evaluate: correlation does not prove cause, eight sites is a small sample, and one count per site on one day may not be representative.
Common mistakes
- A question too broad to answer with the data you can collect.
- Methods described but not justified, or sample sizes too small to analyse.
- Graphs without units or reference in the text.
- Choosing a statistical test that does not fit the data, or treating a significant result as proof.
- A long description of method followed by a thin evaluation.
- Not keeping raw data and dated field notes.
Check your understanding
- Why write a null hypothesis? Answer: Statistical tests examine whether the data are consistent with there being no relationship or difference.
- Distinguish systematic from stratified sampling. Answer: Systematic sampling uses regular intervals; stratified sampling represents each sub-group in proportion.
- Why run a pilot study? Answer: To find problems in methods, timing and equipment before the main collection.
- Calculate rs when the sum of d squared is 10 and n = 10. Answer: 1 - (6 x 10) / (10 x 99) = 1 - 60/990 = 0.939.
- Give two limitations a fieldwork evaluation might raise. Answer: For example, a small sample and data collected on a single day.
- What should every graph include? Answer: A title, labelled axes with units and a source, and a reference in the text.
- Why is a strong correlation not proof of cause? Answer: Other factors could explain the pattern, so further evidence is needed.
Get free revision emails (optional)
Occasional emails with practice questions, worked explanations and links to free resources for the qualification and subjects you choose. No spam, and you can unsubscribe from any email. The free tools on this site never need an email.
Related resources
-
Study guides
IB DP Geography: Option F: Food and health – Study Guide
A study guide to the Food and health option in IB DP Geography: measuring food and health, food systems and disease, stakeholders, and future security.
Geography · International Baccalaureate · IB
Read guide -
Study guides
IB DP Geography: Option A: Freshwater – Study Guide
A study guide to the Freshwater option in IB DP Geography: drainage basins, flooding, water scarcity and quality, and how water might be managed in future.
Geography · International Baccalaureate · IB
Read guide -
Study guides
IB DP Geography: Option D: Geophysical hazards – Study Guide
A study guide to the Geophysical hazards option in IB DP Geography: tectonic systems, hazard risk, vulnerability and the adaptation needed for future resilience.
Geography · International Baccalaureate · IB
Read guide
Related articles
-
teaching
A Level tuition in Dubai: Cambridge or Pearson Edexcel International A Level?
Schools in Dubai and Abu Dhabi teach either Cambridge International AS & A Level or Pearson Edexcel International A Level. How the two are structured, why it matters for tuition, and how online classes from Lahore work.
9 October 2026
-
curriculum guides
Choosing subjects at IGCSE and A Level
How subject choices at 14 and 16 affect university options later, and how to keep pathways open without overloading a timetable.
28 July 2026
Studying this with a teacher
Working through Geography IB?
This page is free and stays free. Marlbridge is not offering Geography classes at the moment, so there is no tuition to book for it. The free study resources stay open to everyone.