
Study Guides
IB DP Geography: Option D: Geophysical hazards – Study Guide
A study guide to the Geophysical hazards option in IB DP Geography: tectonic systems, hazard risk, vulnerability and the adaptation needed for future resilience.
- Subject
- Geography
- Level
- IB
- Topic
- Topic 4: Option D: Geophysical hazards
- Author
- Marlbridge Academic Team
- Updated
- Reviewed by
- Azam Siddique (what this means)
Aligned to International Baccalaureate IB Diploma Programme Geography (DP Geography), First assessments 2019. Official specification .
Syllabus page (what it covers and how it is assessed): IB Diploma Programme Geography.
Syllabus points this page covers
DP Geography
- 4.1 Geophysical systems
- 4.2 Geophysical hazard risks
- 4.3 Hazard risk and vulnerability
- 4.4 Future resilience and adaptation
This page covers all 4 subtopics recorded here in topic 4, Option D: Geophysical hazards.
Geophysical hazards is one of the teacher-selected options in the geographic themes part of IB Diploma Programme Geography. It examines the Earth systems that produce earthquakes, volcanic eruptions and related hazards, why those hazards become disasters for some people and not others, and how societies can build resilience. Check that your school teaches this option. The IB DP Geography syllabus guide explains how it relates to the compulsory core, and the Global Climate core guide develops the vulnerability and resilience ideas that also appear there.
Where this fits in the course
Options are assessed in Paper 1. You will be asked to use located examples, so prepare at least one earthquake and one volcanic event you can describe in terms of cause, impact and response. Keep examples general if you cannot recall specifics reliably; exam credit comes from accurate geography, not from impressive-sounding numbers.
4.1 Geophysical systems
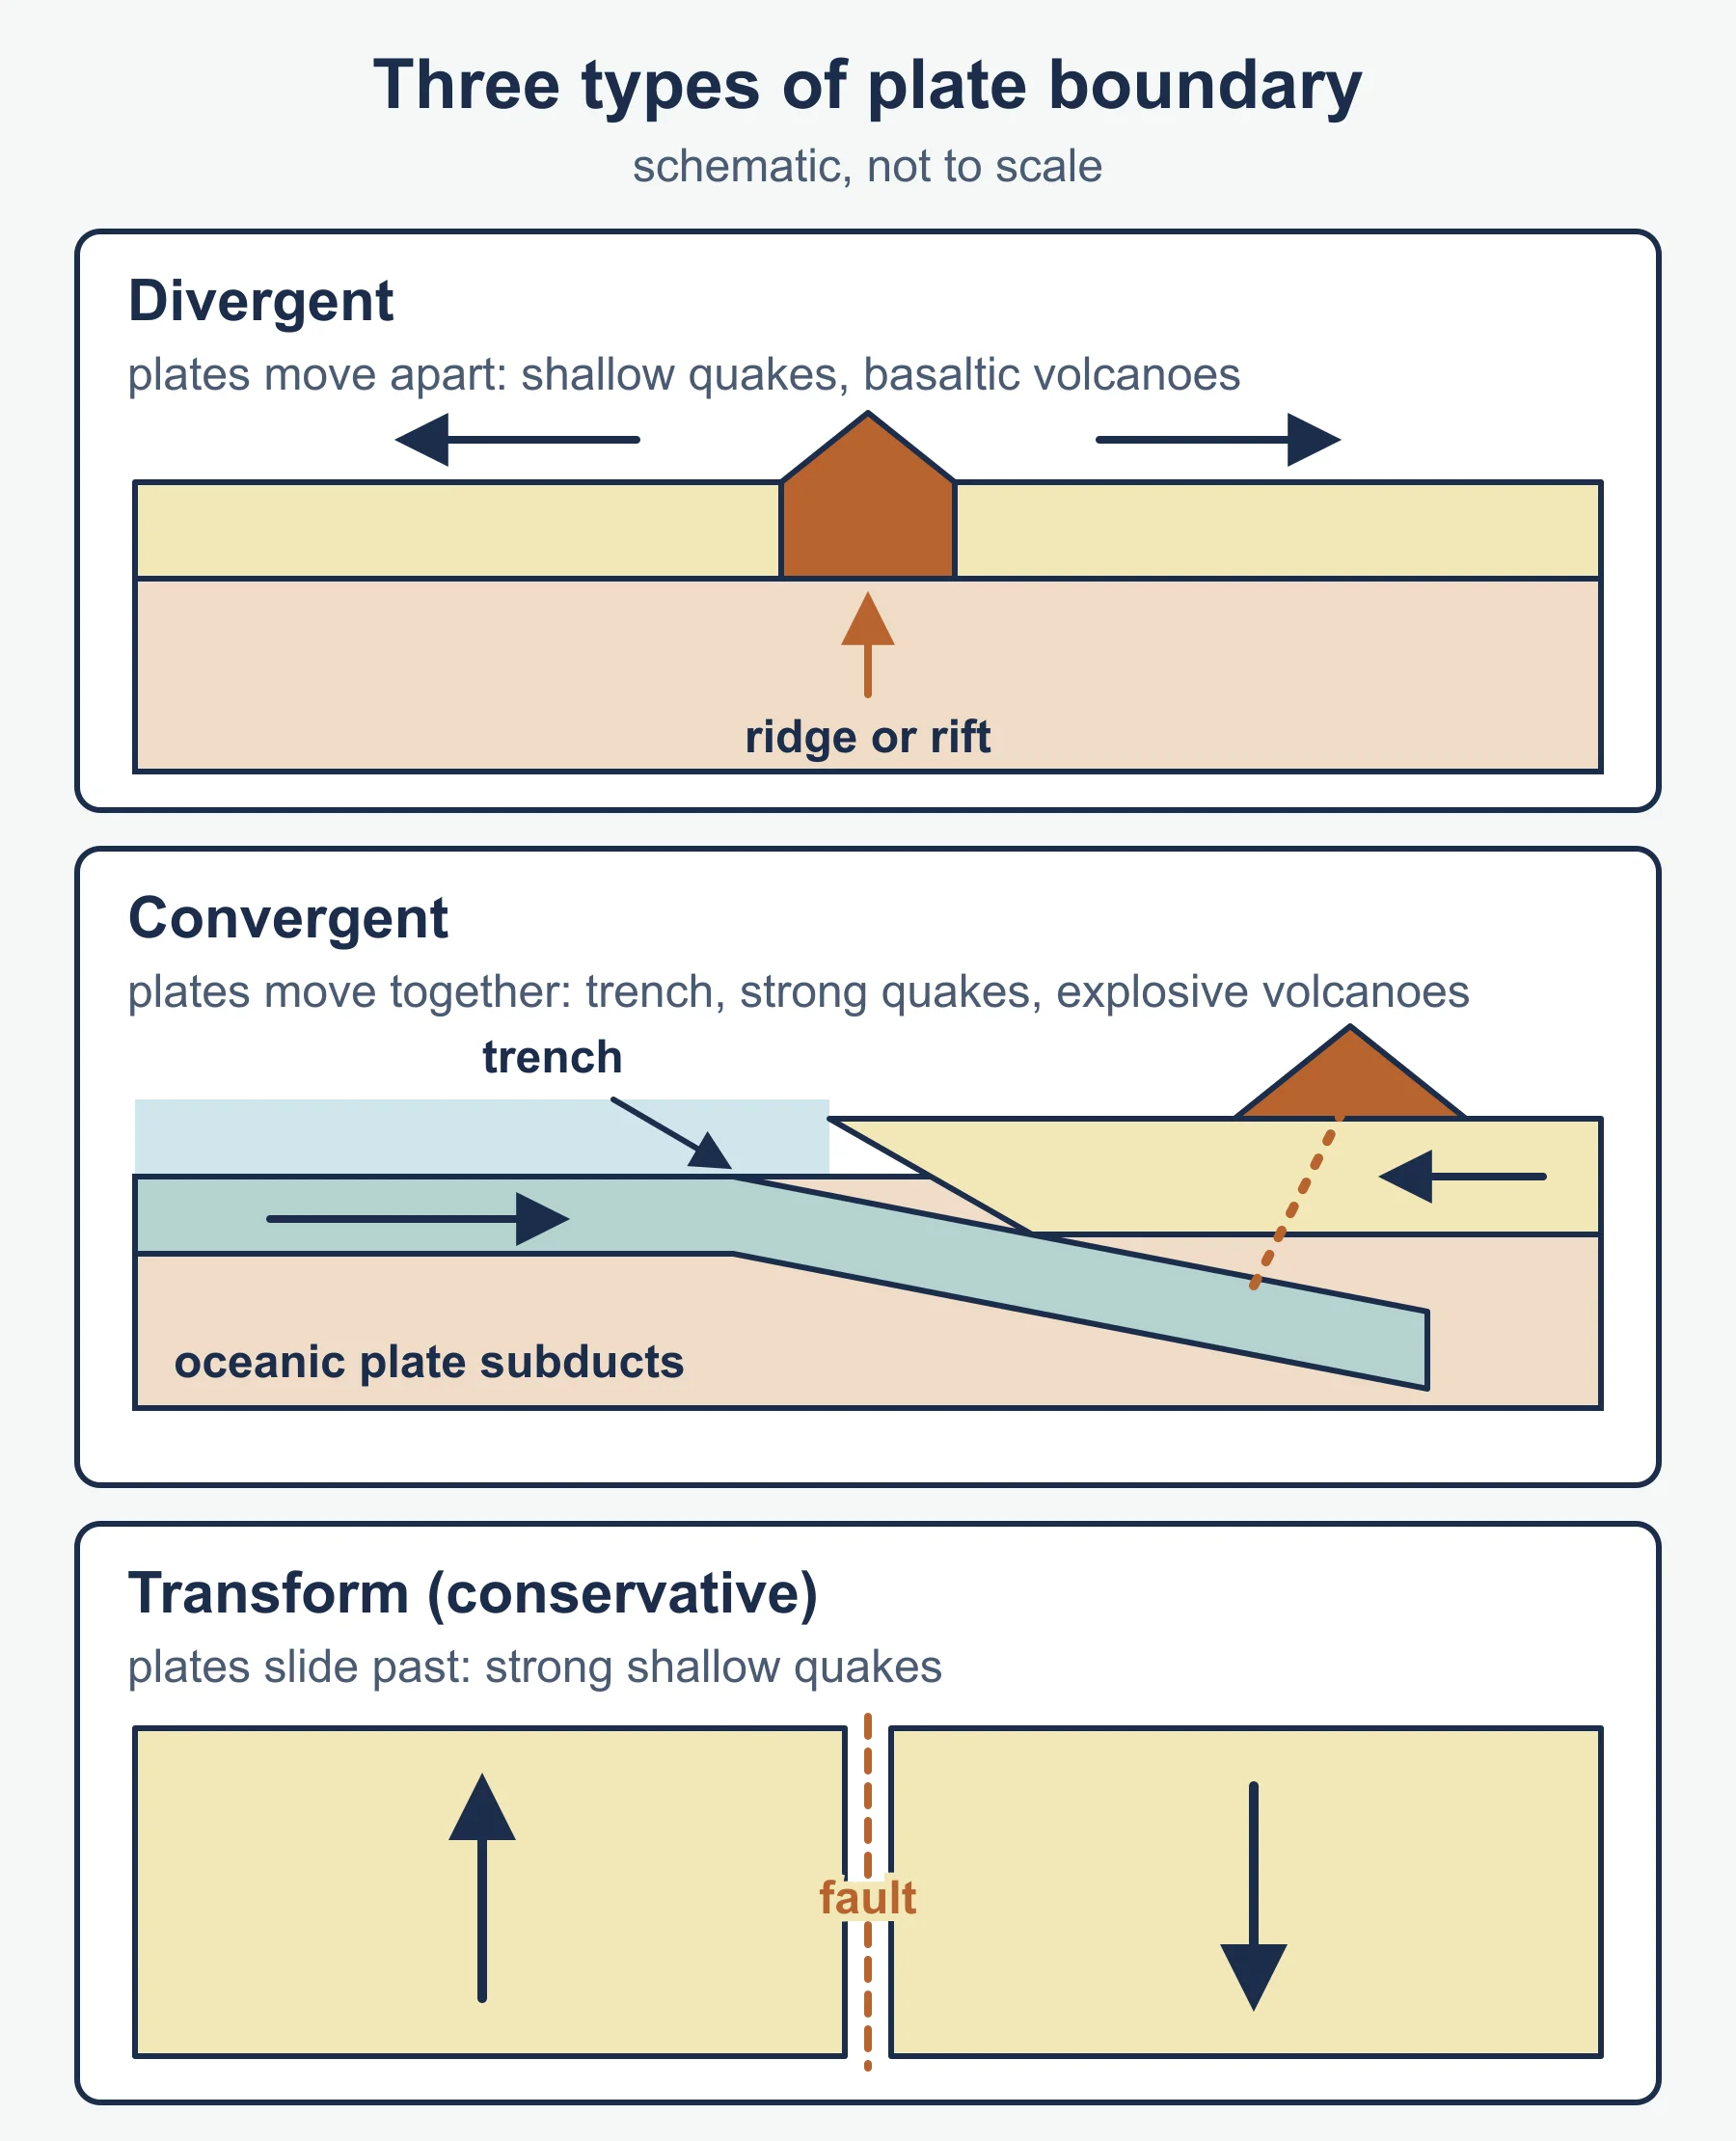
The Earth has a crust, a mantle and a core. The lithosphere, made up of the crust and uppermost mantle, is broken into tectonic plates that move because of processes in the mantle, including convection, slab pull and ridge push. Plate boundaries are of three main types:
- Divergent: plates move apart, as at mid-ocean ridges and continental rifts, with shallow earthquakes and basaltic volcanism.
- Convergent: plates move together. Oceanic crust is subducted beneath continental or other oceanic crust, giving deep ocean trenches, powerful earthquakes and explosive volcanoes. Continental collision builds fold mountains.
- Transform (conservative): plates slide past each other, producing strong shallow earthquakes without destroying crust.
Volcanoes also occur at hotspots, away from boundaries, where mantle plumes rise beneath moving plates.
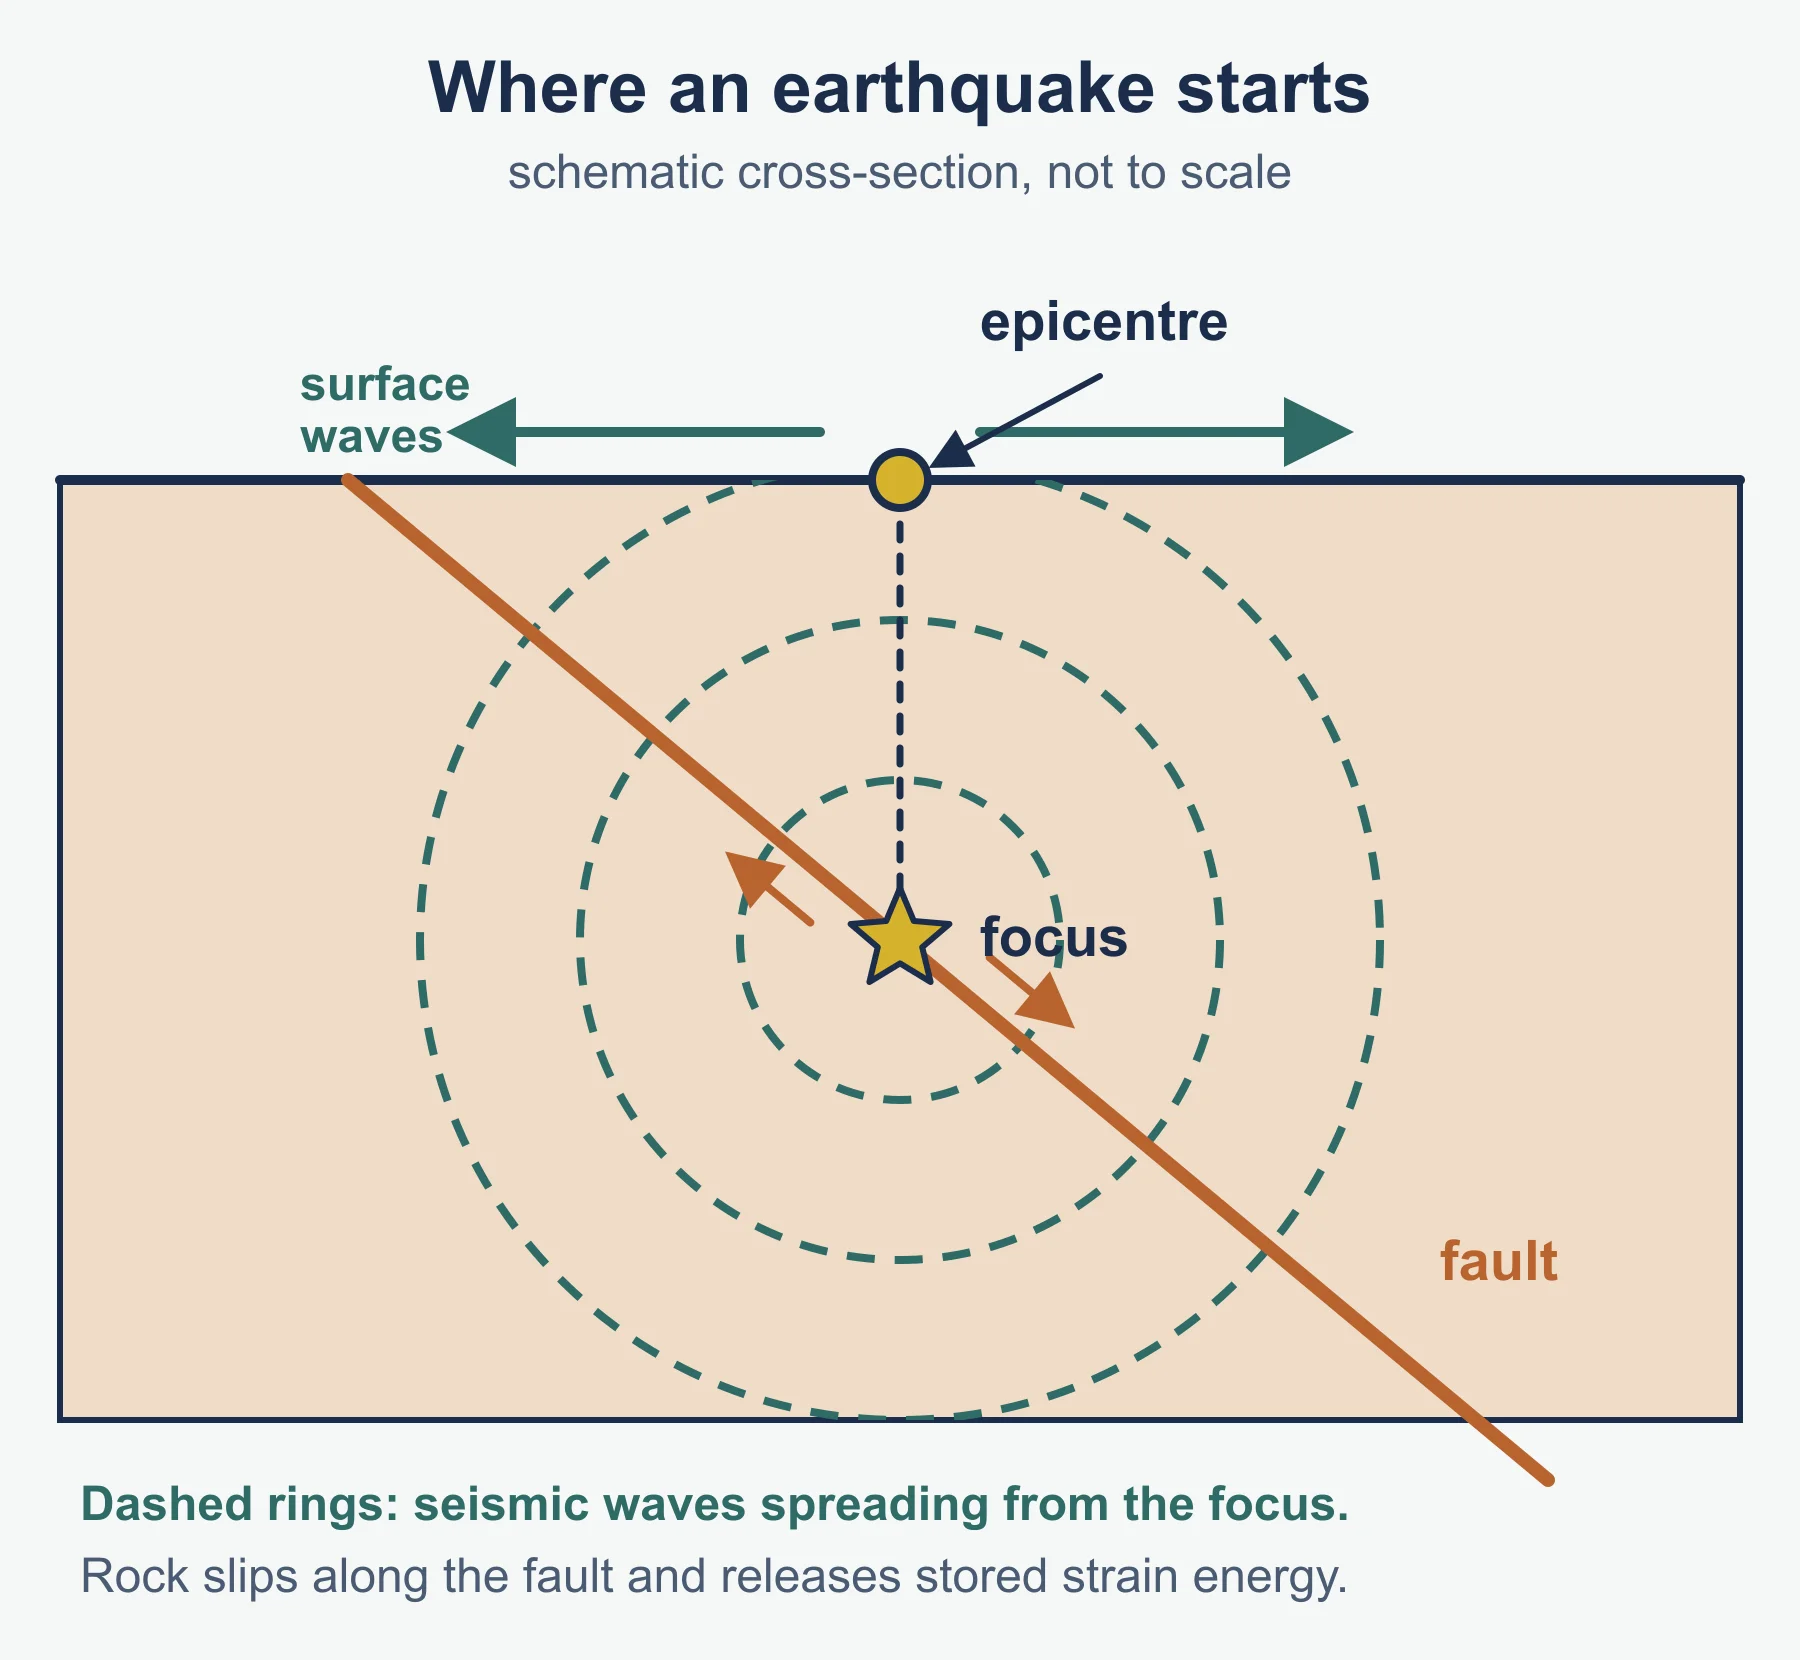
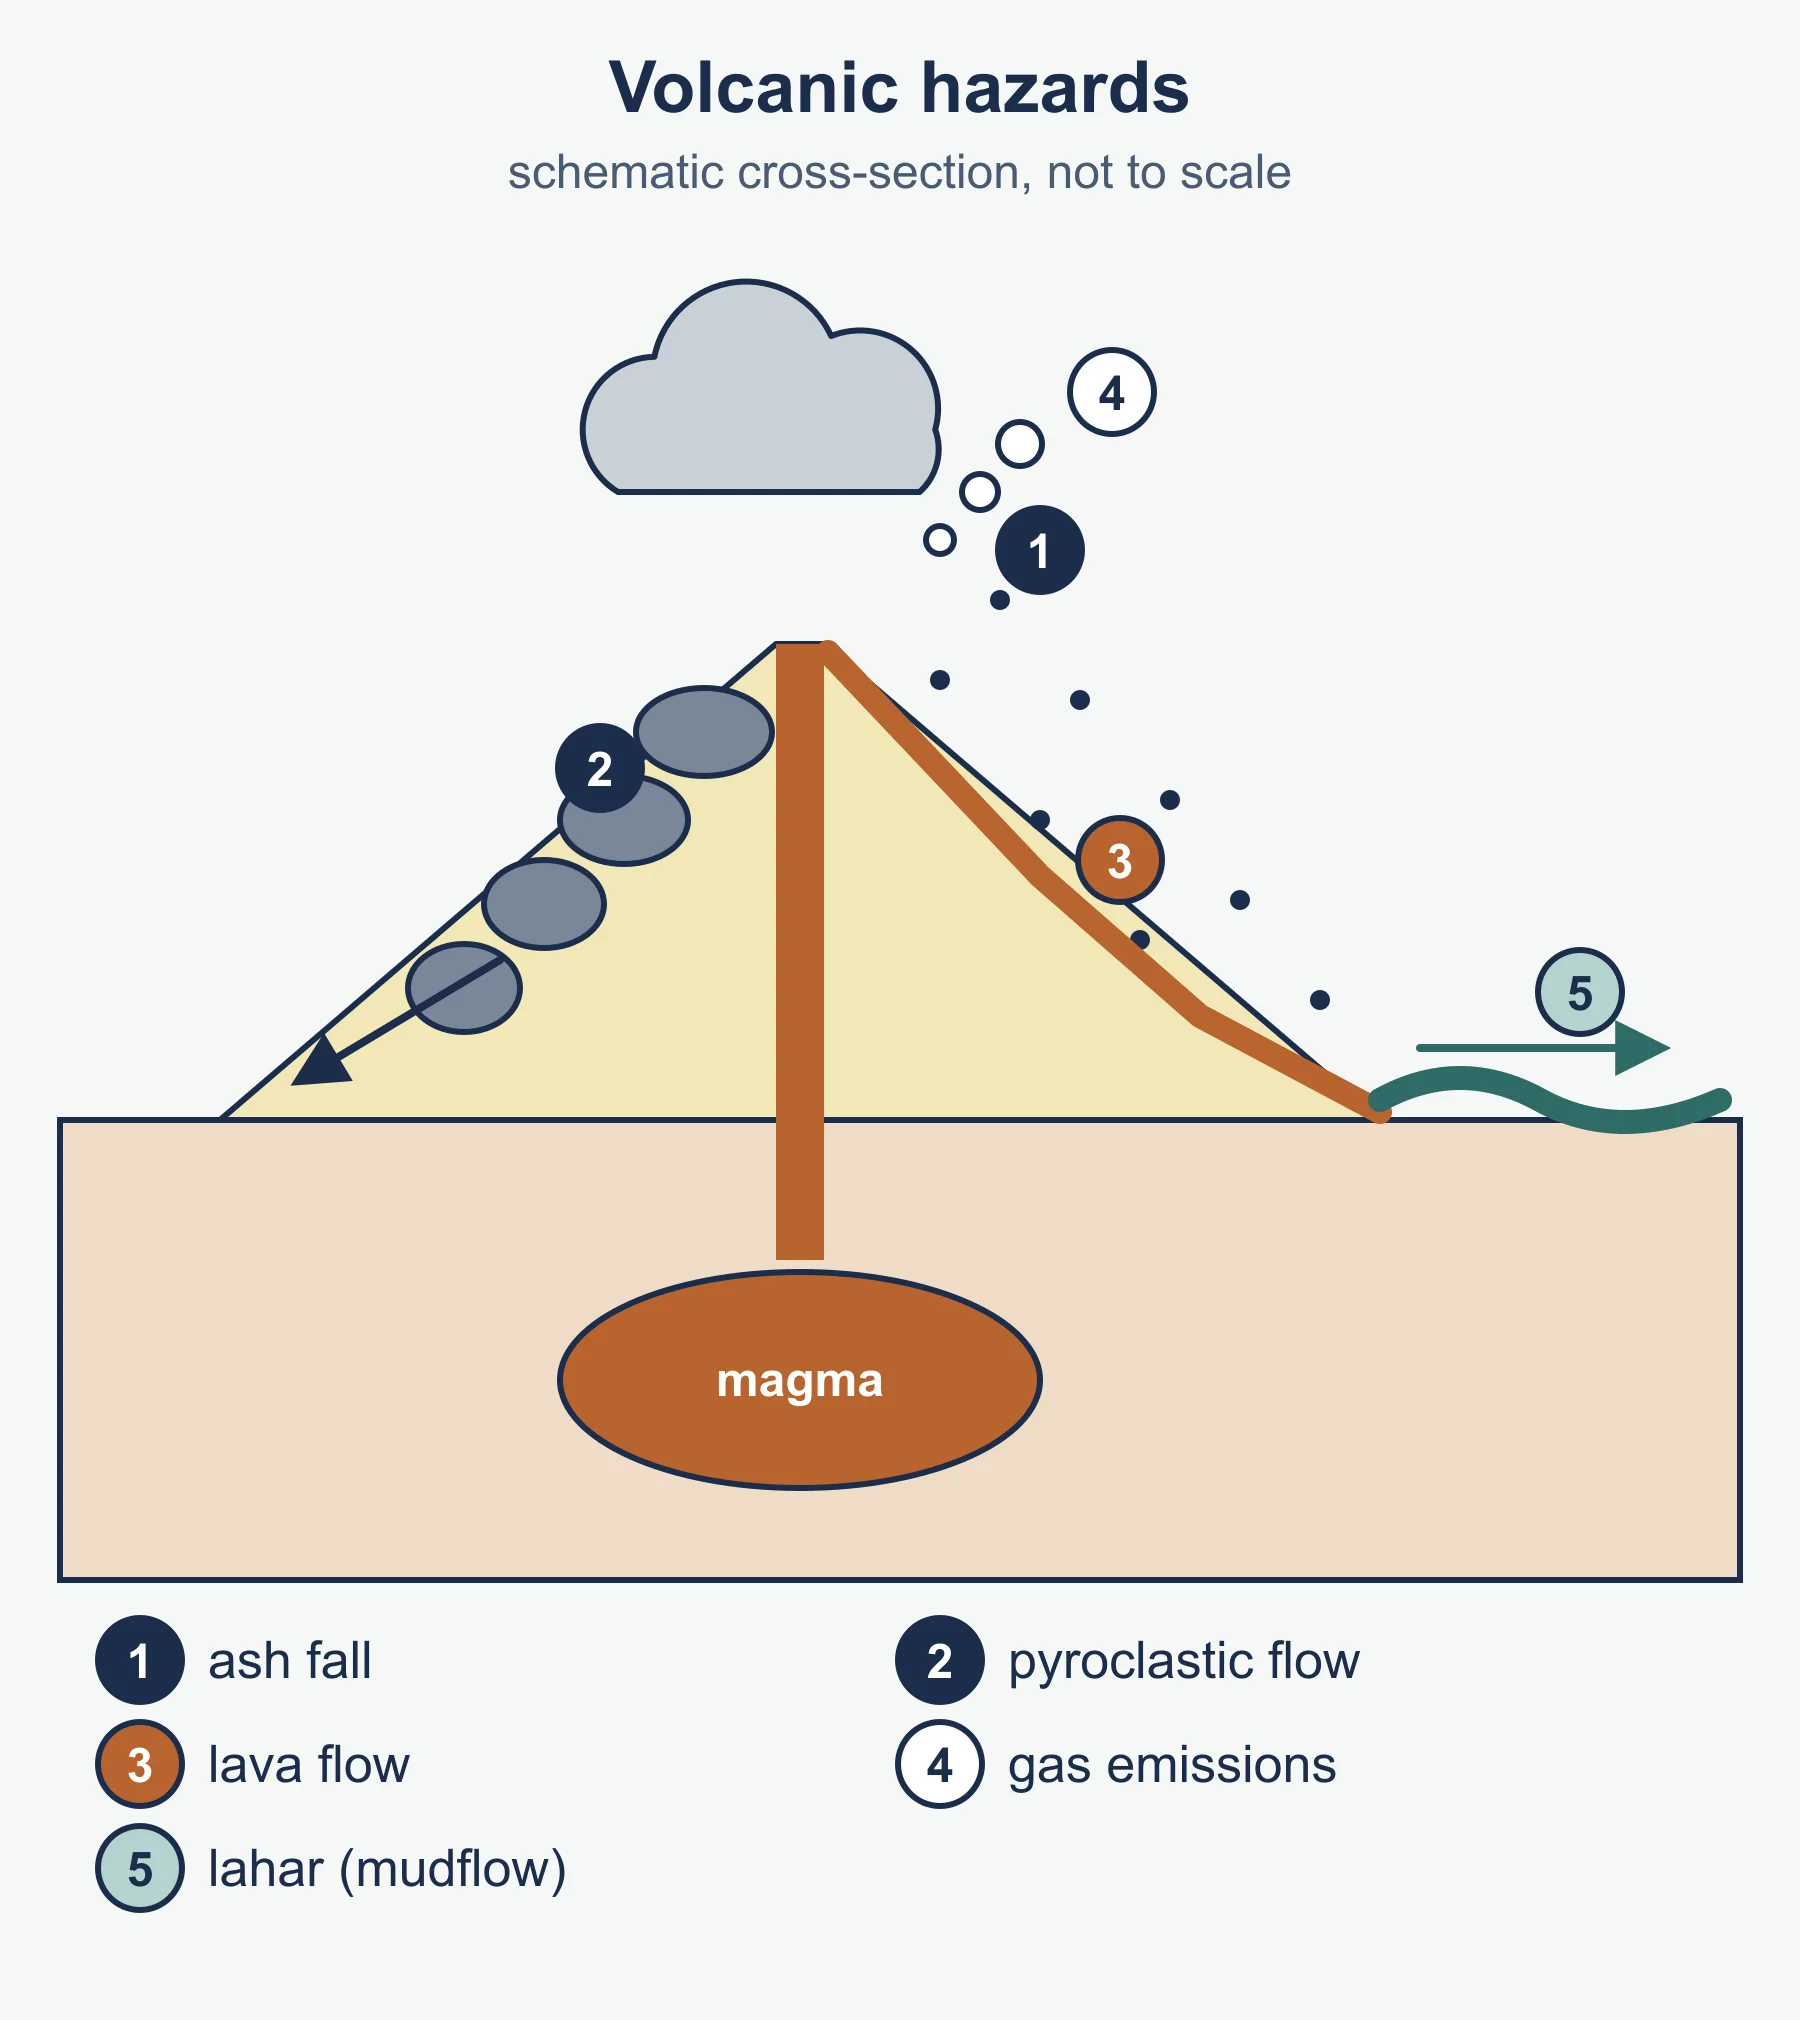
Earthquakes release stored strain energy when rock suddenly slips along a fault. The focus is the point of rupture, and the epicentre is the point on the surface above it. Seismic waves (P, S and surface waves) transmit energy. Magnitude is measured on the moment magnitude scale, which is logarithmic, while intensity is described using the Modified Mercalli scale, based on observed effects. Volcanic hazards include lava flows, pyroclastic flows, ash fall, gas emissions, lahars and, for submarine or coastal events, tsunami. The Volcanic Explosivity Index classifies eruption size. Be able to link magma composition (viscosity and gas content) with eruption style.
Other related hazards include landslides, liquefaction and tsunamis. Tsunamis form when sudden displacement of the sea floor moves a large volume of water.
4.2 Geophysical hazard risks
Risk is the probability that a hazard will cause harm. It depends on the nature of the hazard (magnitude, frequency, duration, speed of onset, spatial extent and predictability) and on the exposure of people and assets. A hazard profile summarises these characteristics. Frequency and magnitude are typically inversely related: large events are rarer.
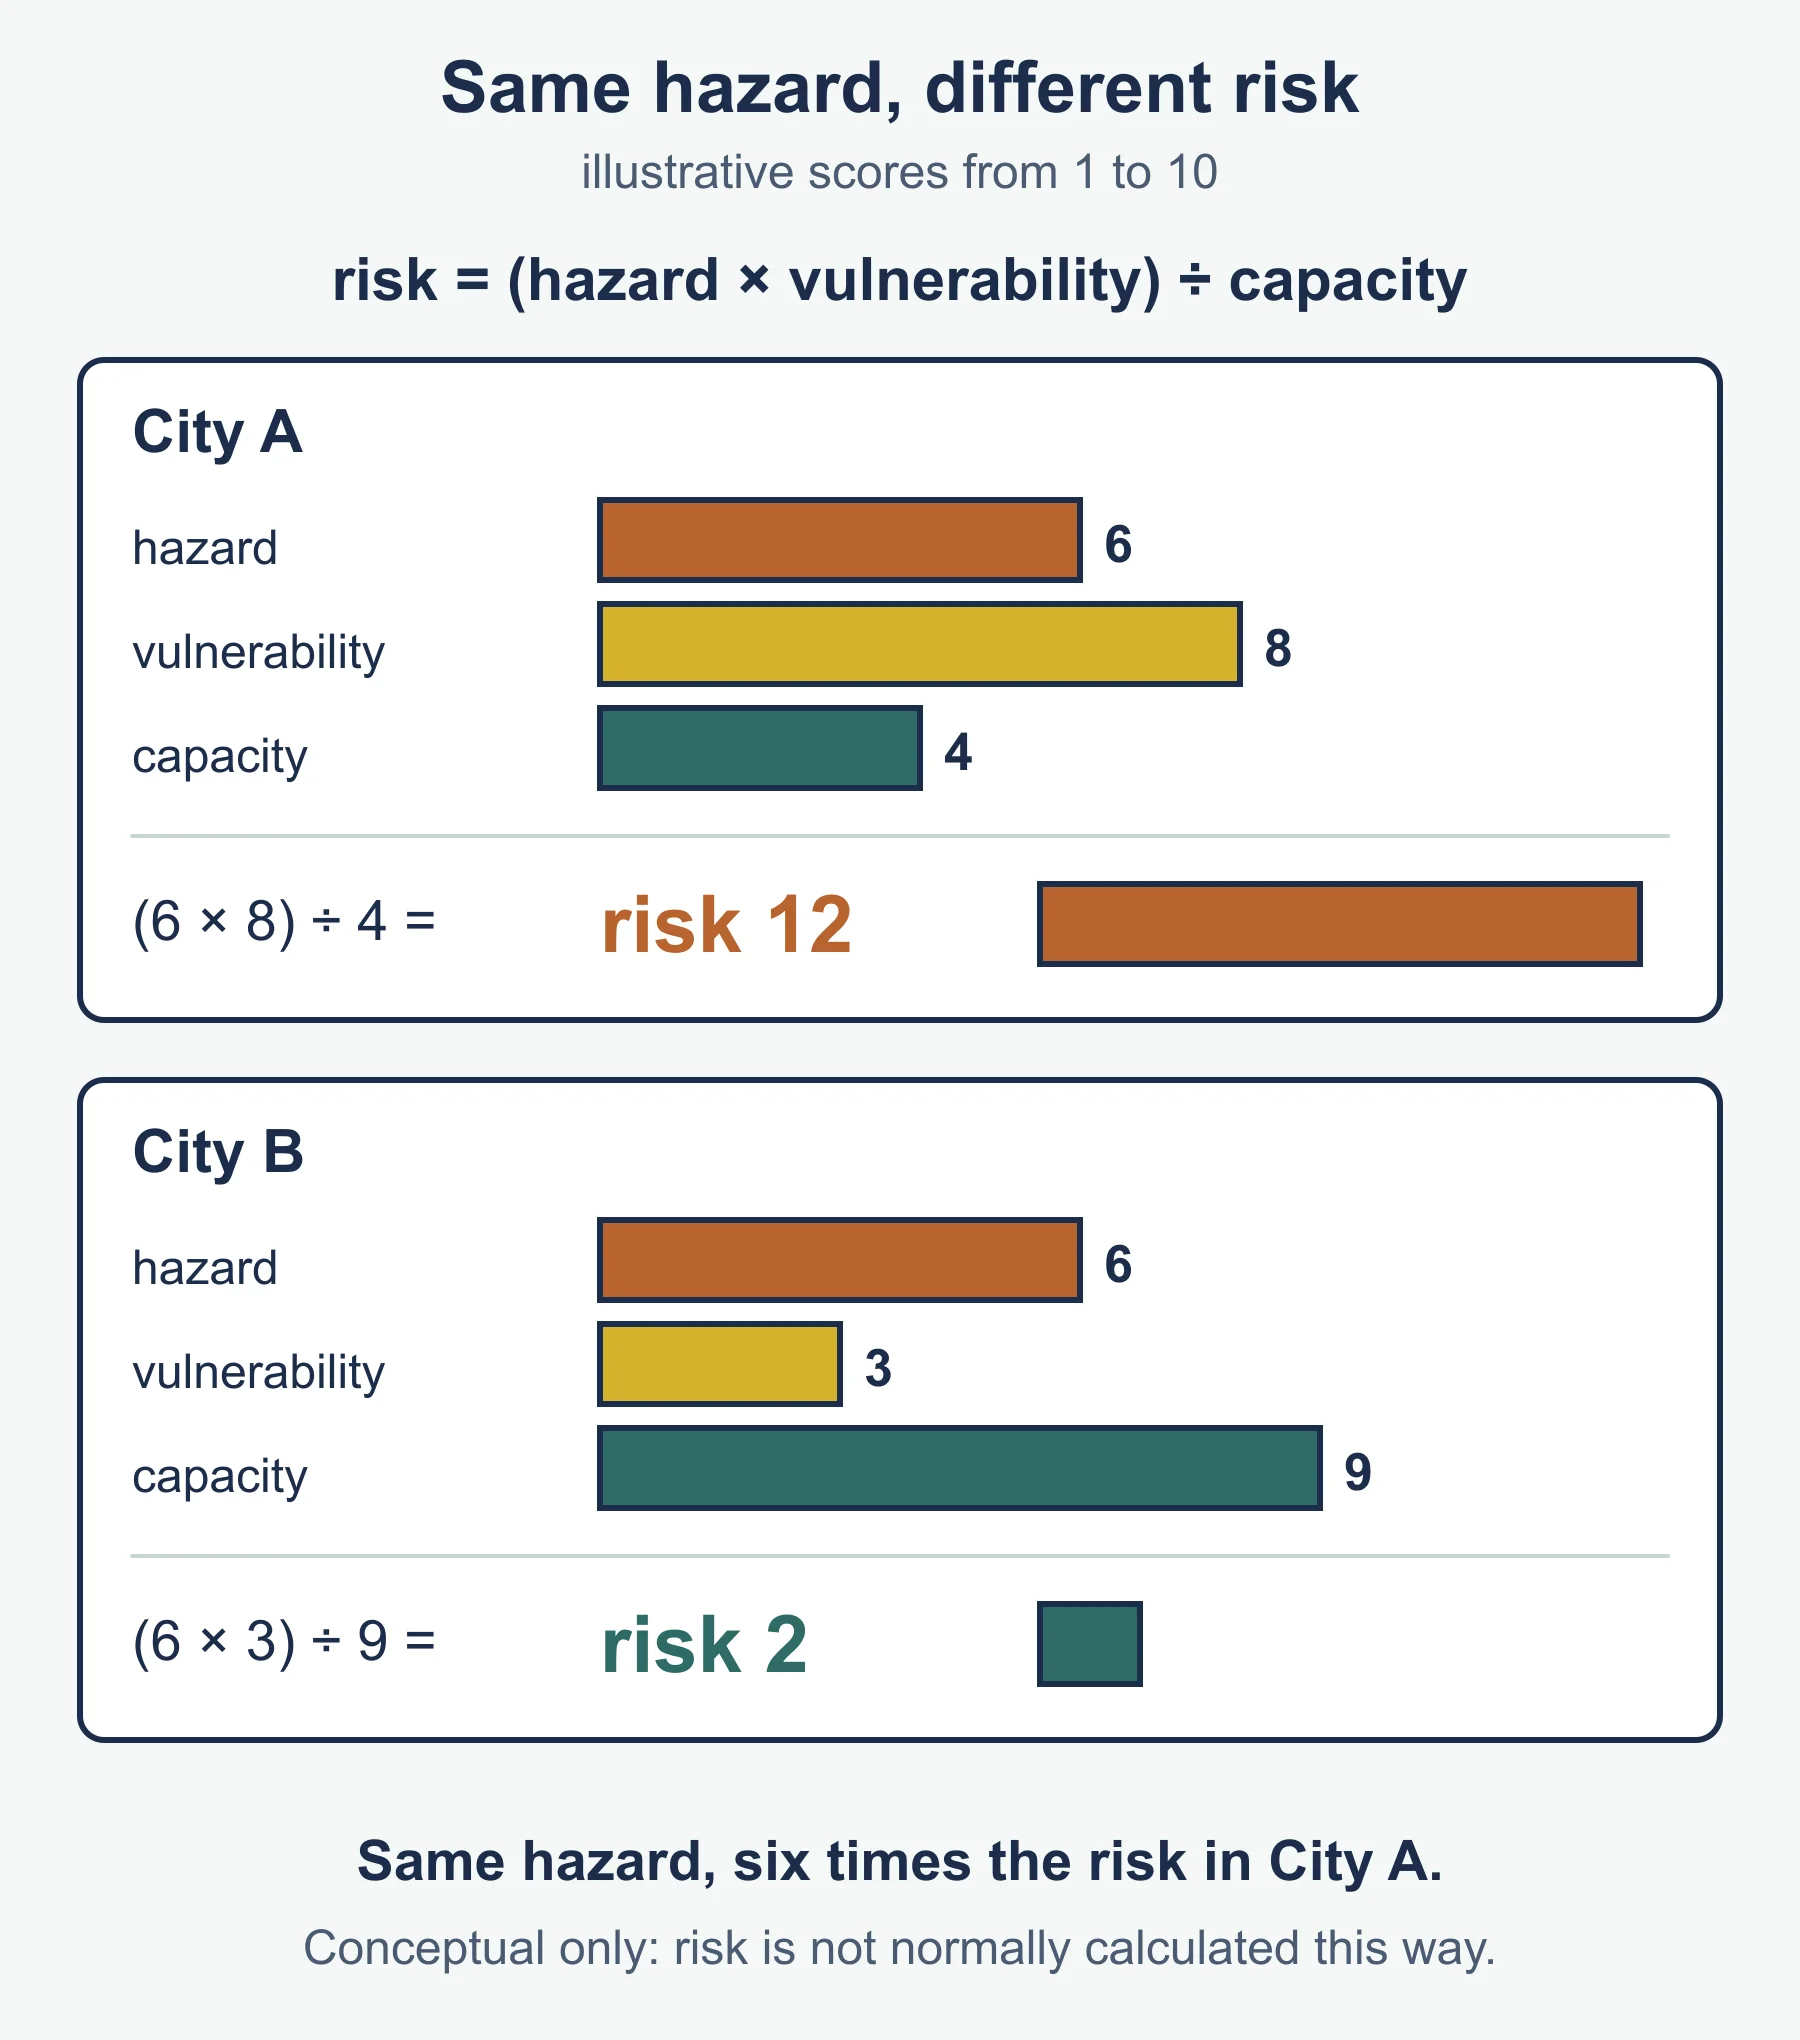
Hazard risk is often expressed conceptually as:
risk = (hazard x vulnerability) / capacity to cope
Some geophysical hazards can be monitored more successfully than others. Volcanoes often show precursors such as seismic swarms, ground deformation and gas changes, which allow warnings, though timing and scale remain uncertain. Earthquake prediction in the precise sense is not currently possible, so efforts focus on forecasting long-term probability, early warning systems that give seconds of notice and building design. Know the difference between prediction, forecasting and warning.
Hazard mapping, such as seismic hazard maps or volcanic hazard zones, shows spatial patterns. Many people live near hazards because of fertile volcanic soils, trade routes, geothermal energy or simply lack of choice.
4.3 Hazard risk and vulnerability
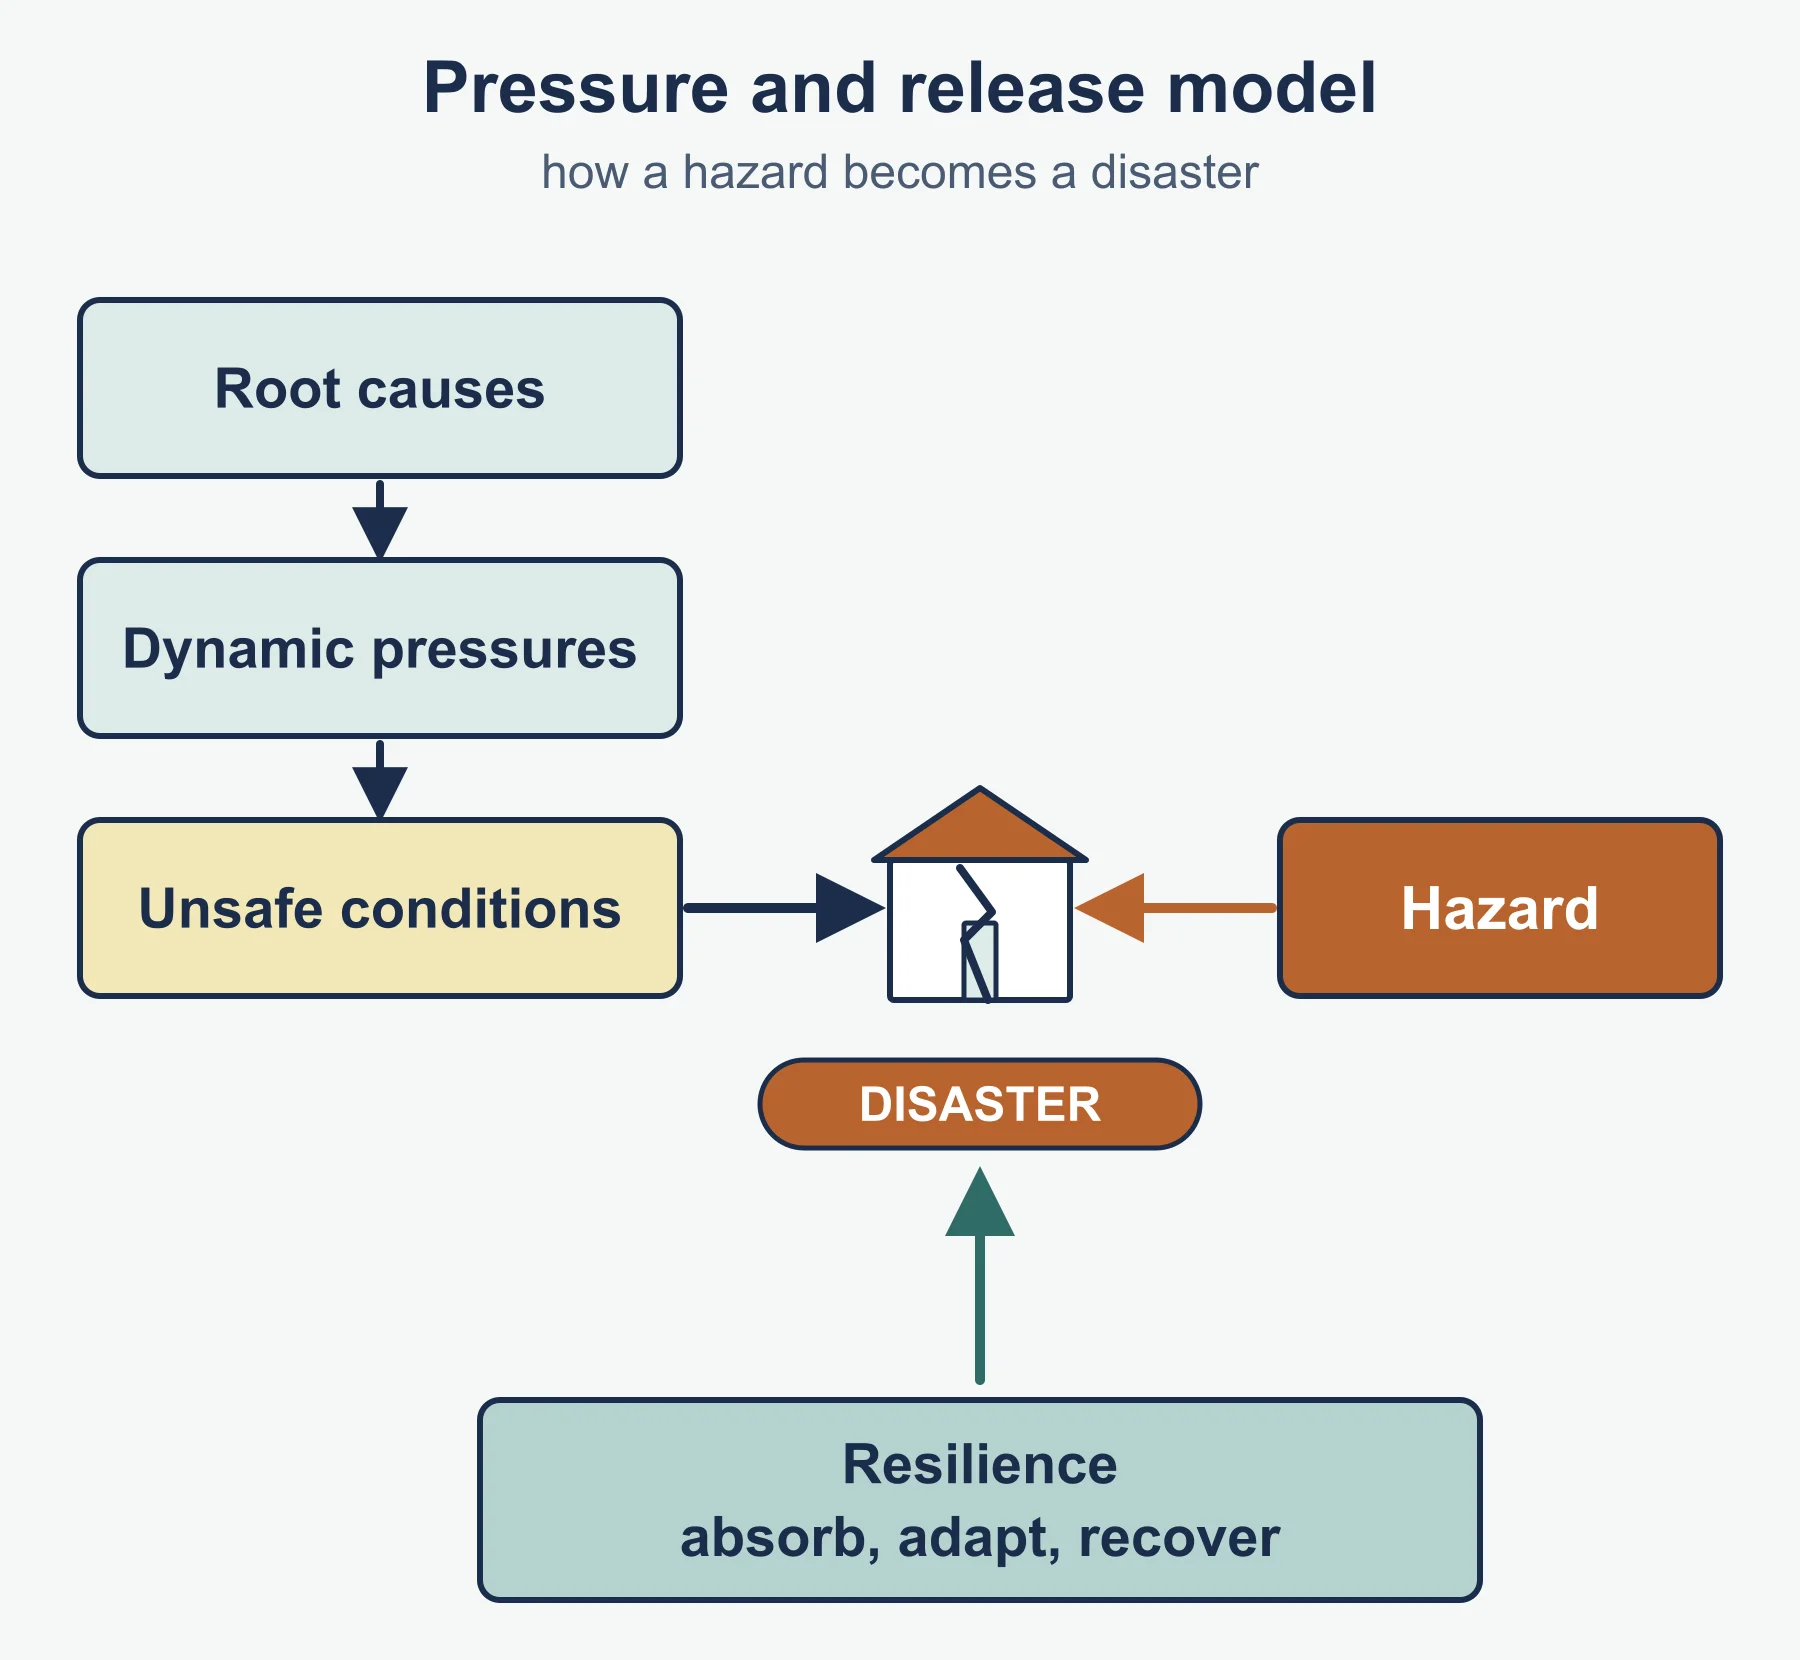
Whether a hazard becomes a disaster depends on vulnerability: the characteristics of people and places that make them susceptible to harm. Factors include poverty, urban density, building quality, governance, education, health, inequality, age, disability and access to information. The pressure and release model describes how root causes, dynamic pressures and unsafe conditions combine with a hazard to produce disaster. Resilience, the capacity to absorb shocks, adapt and recover, is the other side of the coin.
Compare similar hazards with different outcomes. Two earthquakes of comparable magnitude can cause very different casualties depending on building codes, enforcement, time of day, population density and emergency services. Economic losses tend to be larger in wealthy places because of high-value assets, while loss of life tends to be larger in poorer places. Disasters also have multiplier effects: aftershocks, landslides, disease and economic disruption.
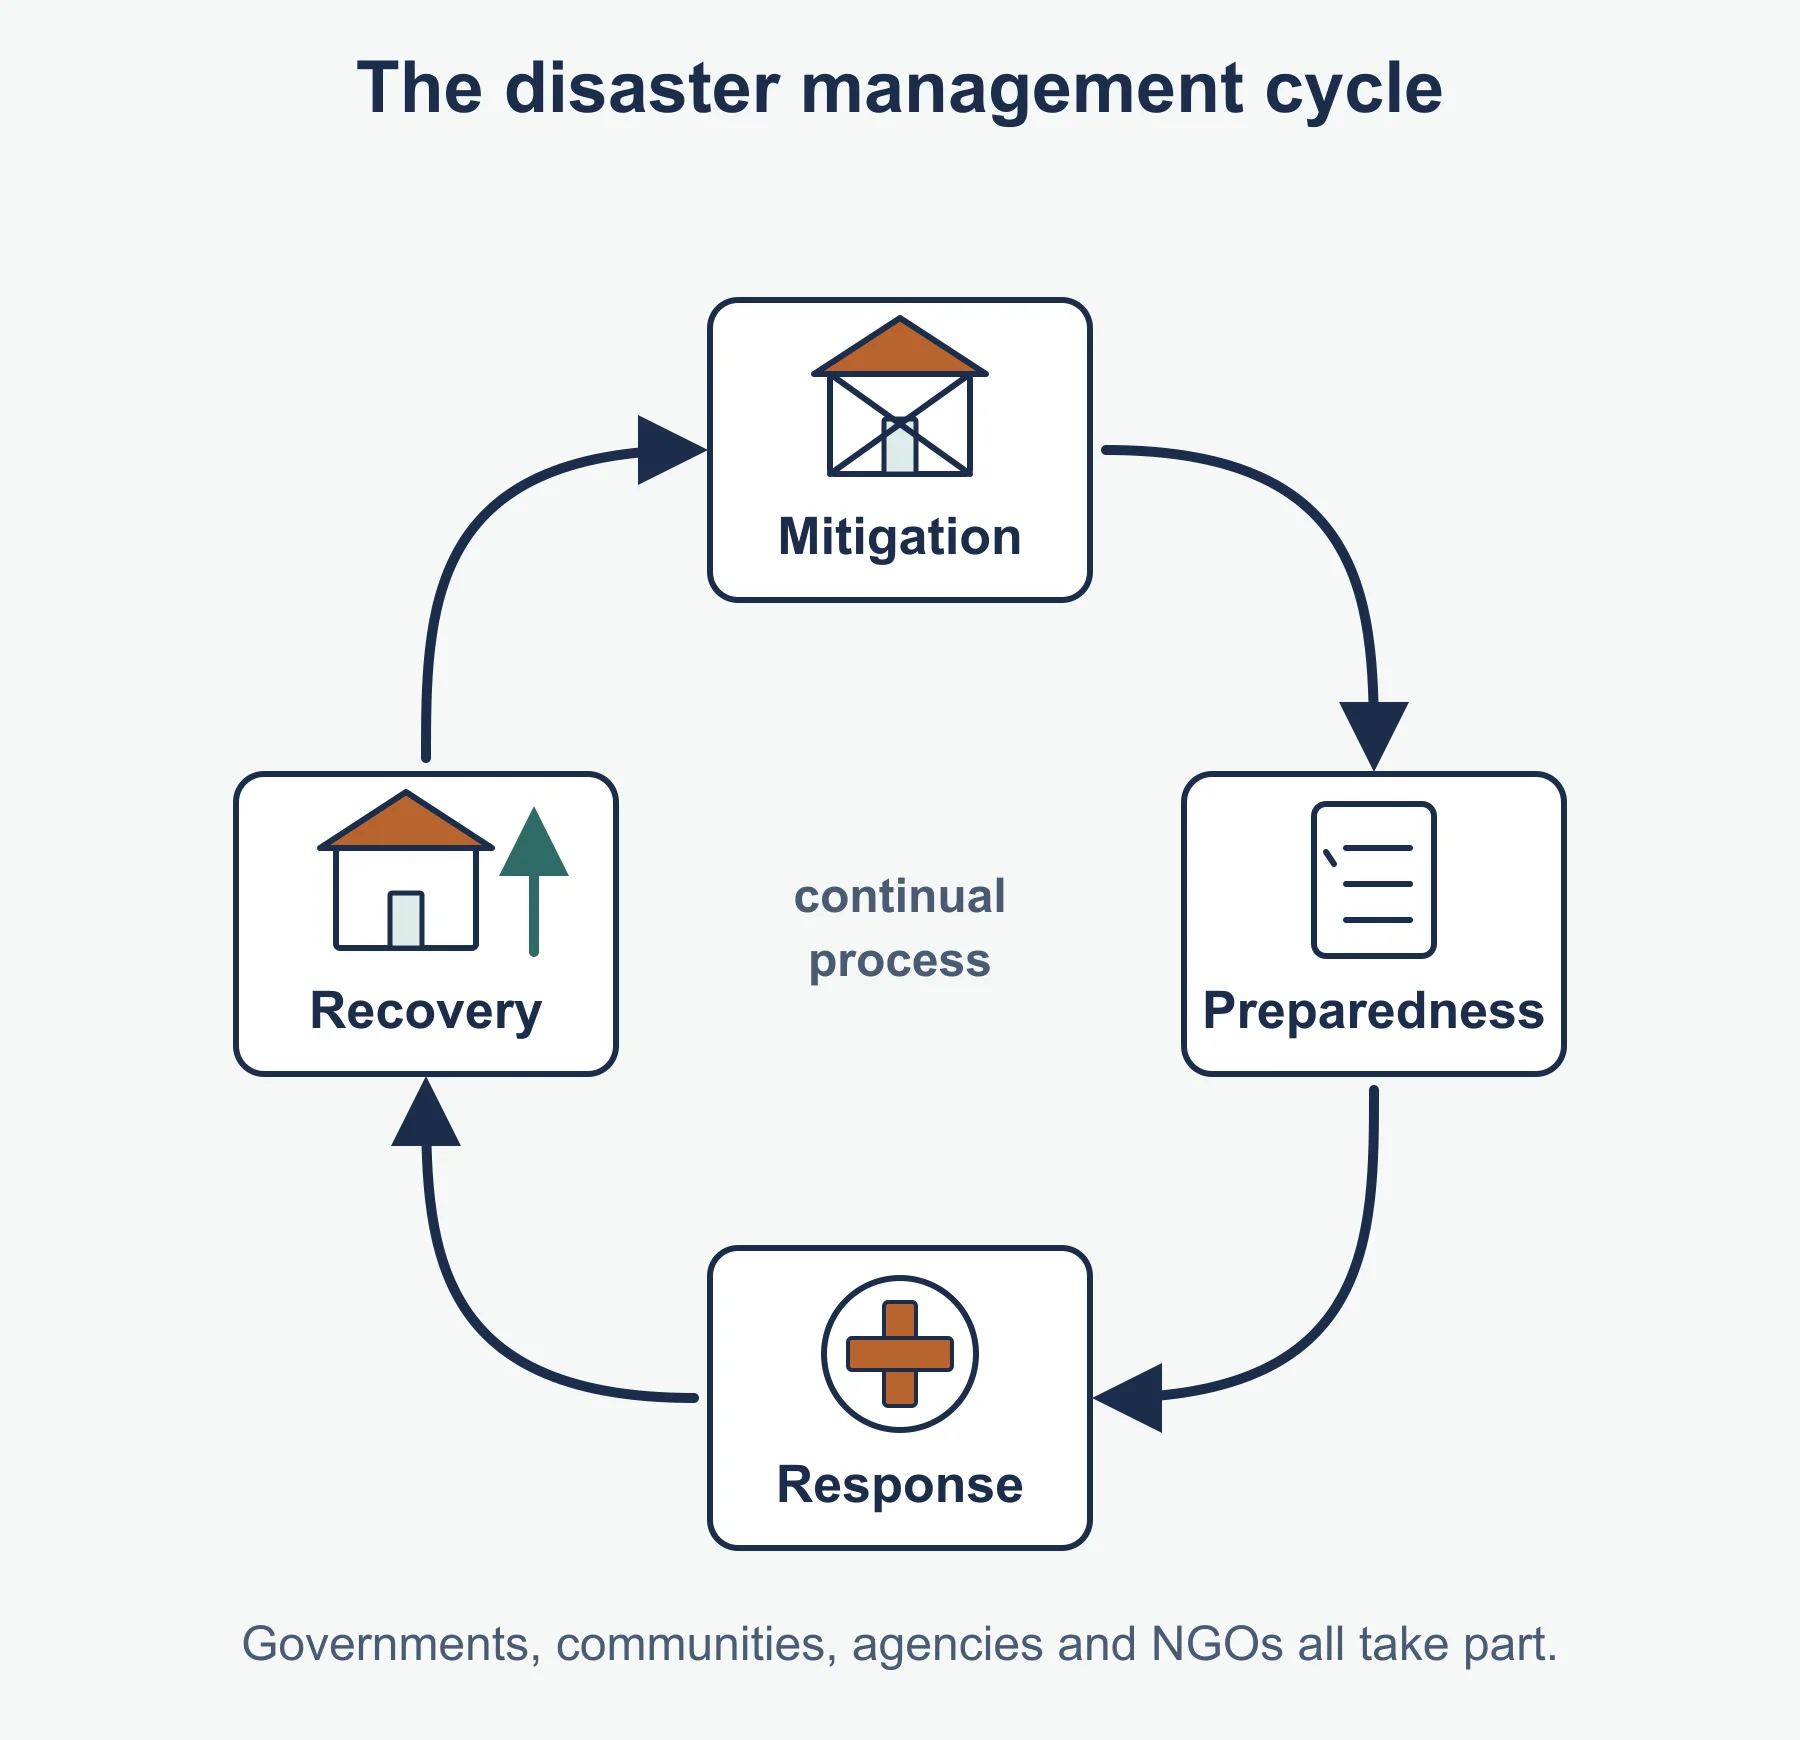
Disaster management is often described as a cycle: mitigation, preparedness, response and recovery. Responses involve governments, local communities, international agencies and non-governmental organisations. Examine how effective and equitable each stakeholder’s contribution is.
4.4 Future resilience and adaptation
This strand looks at what can reduce risk over time. Options include:
- Structural measures: earthquake-resistant design, retrofitting, tsunami barriers, lava diversion and evacuation shelters.
- Non-structural measures: land-use planning, building codes, hazard education, drills, insurance and early warning systems.
- Community-based approaches, which draw on local knowledge and build social networks.
- Governance and finance: investment in risk reduction, which international frameworks promote, rather than only paying for response.
Consider how urbanisation and population growth in hazardous areas, climate change interactions (for example intense rainfall triggering lahars or landslides) and inequality may change future risk. Evaluate strategies using criteria such as cost, feasibility, equity, speed and sustainability, and consider that adaptation is a continual process, not a single event.
Worked examples
Example 1: what a magnitude difference means
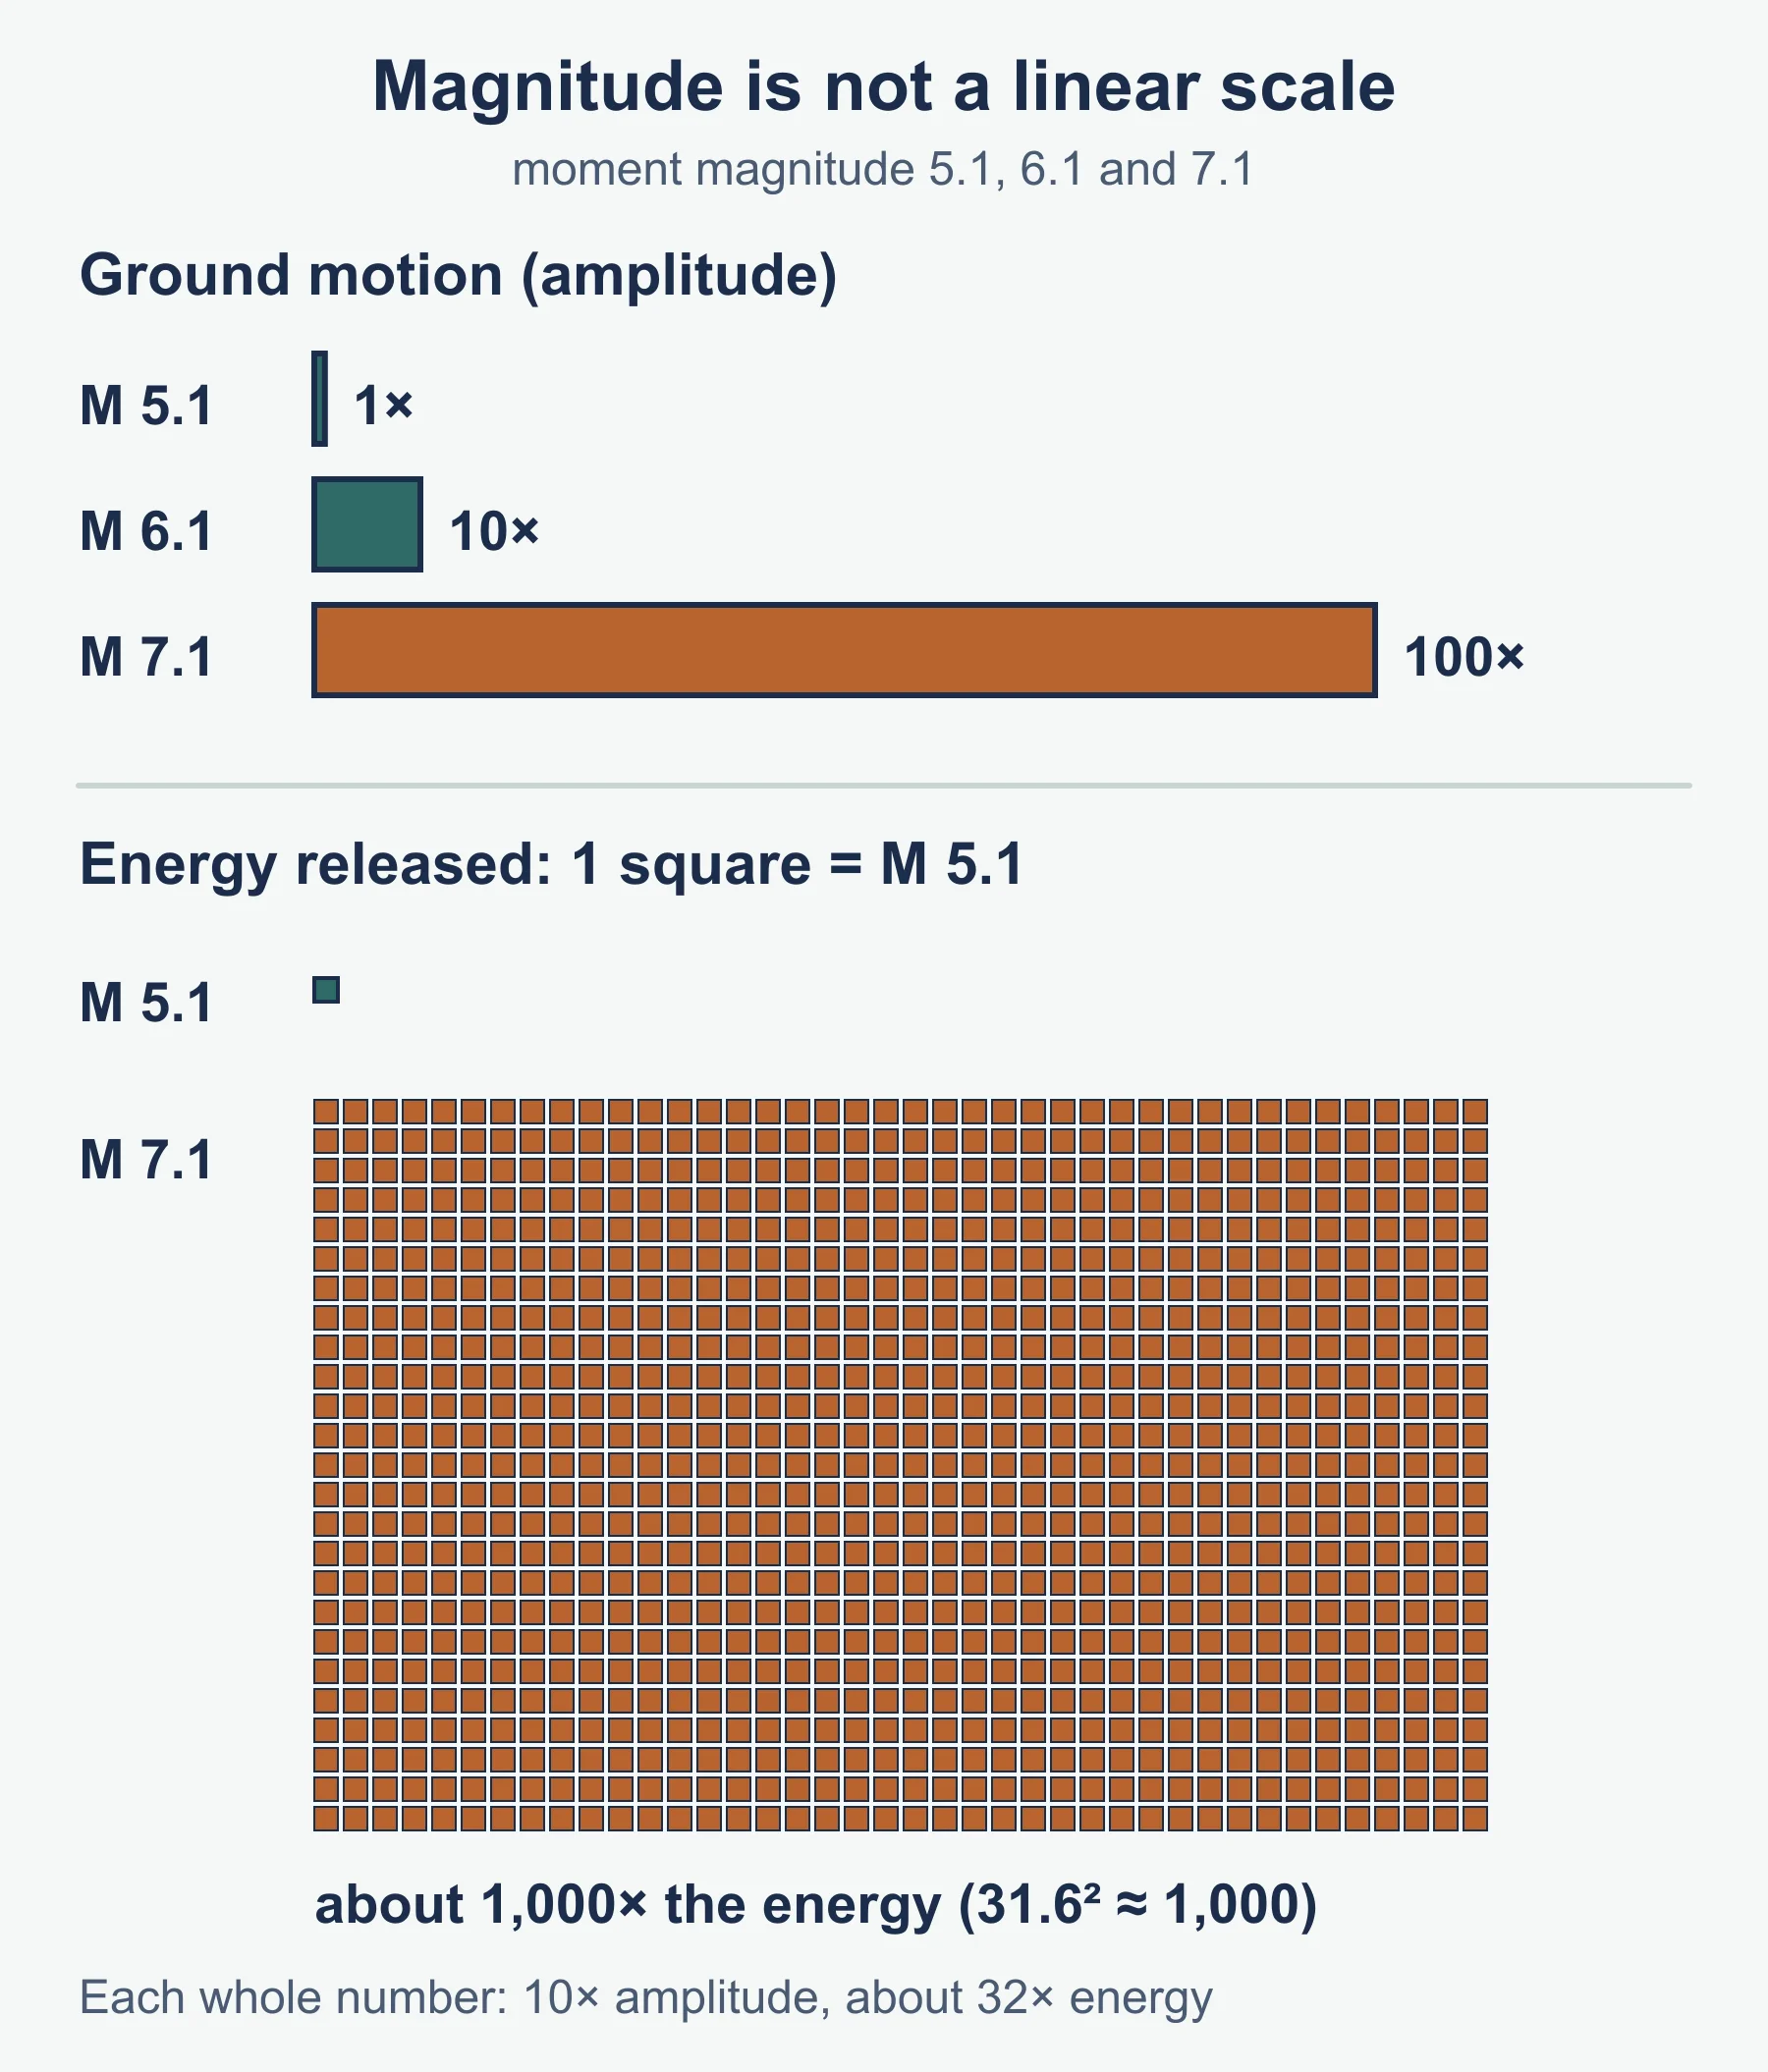
On the moment magnitude scale each whole-number increase corresponds to a tenfold increase in ground motion amplitude and roughly a 32-fold increase in energy released. Compare a magnitude 7.1 earthquake with a magnitude 5.1 earthquake.
- Difference = 2 units.
- Amplitude ratio = 10 x 10 = 100 times.
- Energy ratio = about 32 x 32 = roughly 1,000 times (more exactly 31.6 squared, close to 1,000).
So the larger event shakes the ground 100 times more and releases about 1,000 times more energy. This is why magnitude must never be read as a simple linear scale.
Example 2: an illustrative risk comparison
Using the conceptual risk formula with fictional index scores (1 to 10):
- City A: hazard 6, vulnerability 8, capacity 4. Risk = (6 x 8) / 4 = 48 / 4 = 12.
- City B: hazard 6, vulnerability 3, capacity 9. Risk = (6 x 3) / 9 = 18 / 9 = 2.
The hazard is identical, yet City A has six times the risk, showing how vulnerability and capacity, not just the hazard, determine outcomes. The numbers are illustrative, as risk is not normally calculated this way in practice.
Common mistakes
- Saying earthquakes can be predicted; distinguish forecasting from prediction.
- Treating magnitude as linear.
- Confusing focus with epicentre, or hazard with disaster.
- Explaining impacts only in terms of the physical event and ignoring vulnerability.
- Assuming wealthy places suffer fewer losses; their economic losses are often higher.
Exam technique
Pay attention to command terms. Explain requires reasons, compare needs both places addressed together, and evaluate expects a judgement with criteria. Use annotated diagrams of plate boundaries only if they add clarity. Support points with located examples and describe patterns in any graph or map provided, quoting data accurately.
Check your understanding
- Name the three plate boundary types. Answer: divergent, convergent and transform (conservative).
- What is the epicentre? Answer: the point on the Earth’s surface directly above the focus.
- By what factor does ground motion amplitude change for a 2-unit magnitude increase? Answer: 100 times.
- Give two factors that increase vulnerability. Answer: for example poverty and poor building quality.
- Calculate risk for hazard 5, vulnerability 6, capacity 3 with the conceptual formula. Answer: (5 x 6) / 3 = 10.
- Why is early warning more successful for volcanoes than earthquakes? Answer: volcanoes often show measurable precursors, while earthquakes give little or no advance sign.
- Name the four stages of the disaster management cycle. Answer: mitigation, preparedness, response and recovery.
- Give one structural and one non-structural way to build resilience. Answer: for example earthquake-resistant building design; land-use planning or education.
Get free revision emails (optional)
Occasional emails with practice questions, worked explanations and links to free resources for the qualification and subjects you choose. No spam, and you can unsubscribe from any email. The free tools on this site never need an email.
Related resources
-
Study guides
IB DP Geography: Unit 3: Global resource consumption and security – Study Guide
A study guide to Global resource consumption and security in IB DP Geography: trends in consumption, their impacts, and resource stewardship.
Geography · International Baccalaureate · IB
Read guide -
Study guides
IB DP Geography: Unit 6: Global risks and resilience – Study Guide
Geopolitical, economic and environmental risks, and local and global resilience, as studied in the Higher Level extension of IB Diploma Programme Geography.
Geography · International Baccalaureate · IB
Read guide -
Study guides
IB DP Geography: Unit 5: Human development and diversity – Study Guide
Development opportunities, changing identities and cultures, and local responses to global interactions in the Higher Level extension of IB Diploma Programme Geography.
Geography · International Baccalaureate · IB
Read guide
Related articles
-
teaching
A Level tuition in Dubai: Cambridge or Pearson Edexcel International A Level?
Schools in Dubai and Abu Dhabi teach either Cambridge International AS & A Level or Pearson Edexcel International A Level. How the two are structured, why it matters for tuition, and how online classes from Lahore work.
9 October 2026
-
curriculum guides
Choosing subjects at IGCSE and A Level
How subject choices at 14 and 16 affect university options later, and how to keep pathways open without overloading a timetable.
28 July 2026
Studying this with a teacher
Working through Geography IB?
This page is free and stays free. Marlbridge is not offering Geography classes at the moment, so there is no tuition to book for it. The free study resources stay open to everyone.