
Study Guides
IB DP Geography: Unit 3: Global resource consumption and security – Study Guide
A study guide to Global resource consumption and security in IB DP Geography: trends in consumption, their impacts, and resource stewardship.
- Subject
- Geography
- Level
- IB
- Topic
- Topic 10: Unit 3: Global resource consumption and security
- Author
- Marlbridge Academic Team
- Updated
- Reviewed by
- Azam Siddique (what this means)
Aligned to International Baccalaureate IB Diploma Programme Geography (DP Geography), First assessments 2019. Official specification .
Syllabus page (what it covers and how it is assessed): IB Diploma Programme Geography.
Syllabus points this page covers
DP Geography
- 10.1 Global trends in consumption
- 10.2 Impacts of changing trends in resource consumption
- 10.3 Resource stewardship
This page covers all 3 subtopics recorded here in topic 10, Unit 3: Global resource consumption and security.
Global resource consumption and security is a compulsory core unit of IB Diploma Programme Geography, so every student studies it regardless of which options their school teaches. It looks at how consumption of food, water and energy is changing, what the consequences are for people and environments, and how resources can be stewarded more sustainably. The IB DP Geography syllabus guide shows where it sits in the core, and the Global Climate core guide links closely to the energy and climate material here.
Where this fits in the course
Because this is part of the core, it is assessed in Paper 2 for all candidates, so it merits thorough revision. Questions typically mix data interpretation with explanation and evaluation, and often ask you to use places or case examples you have studied. Use examples you can describe accurately; if you cannot recall precise statistics, describe trends in general terms and avoid inventing numbers.
10.1 Global trends in consumption
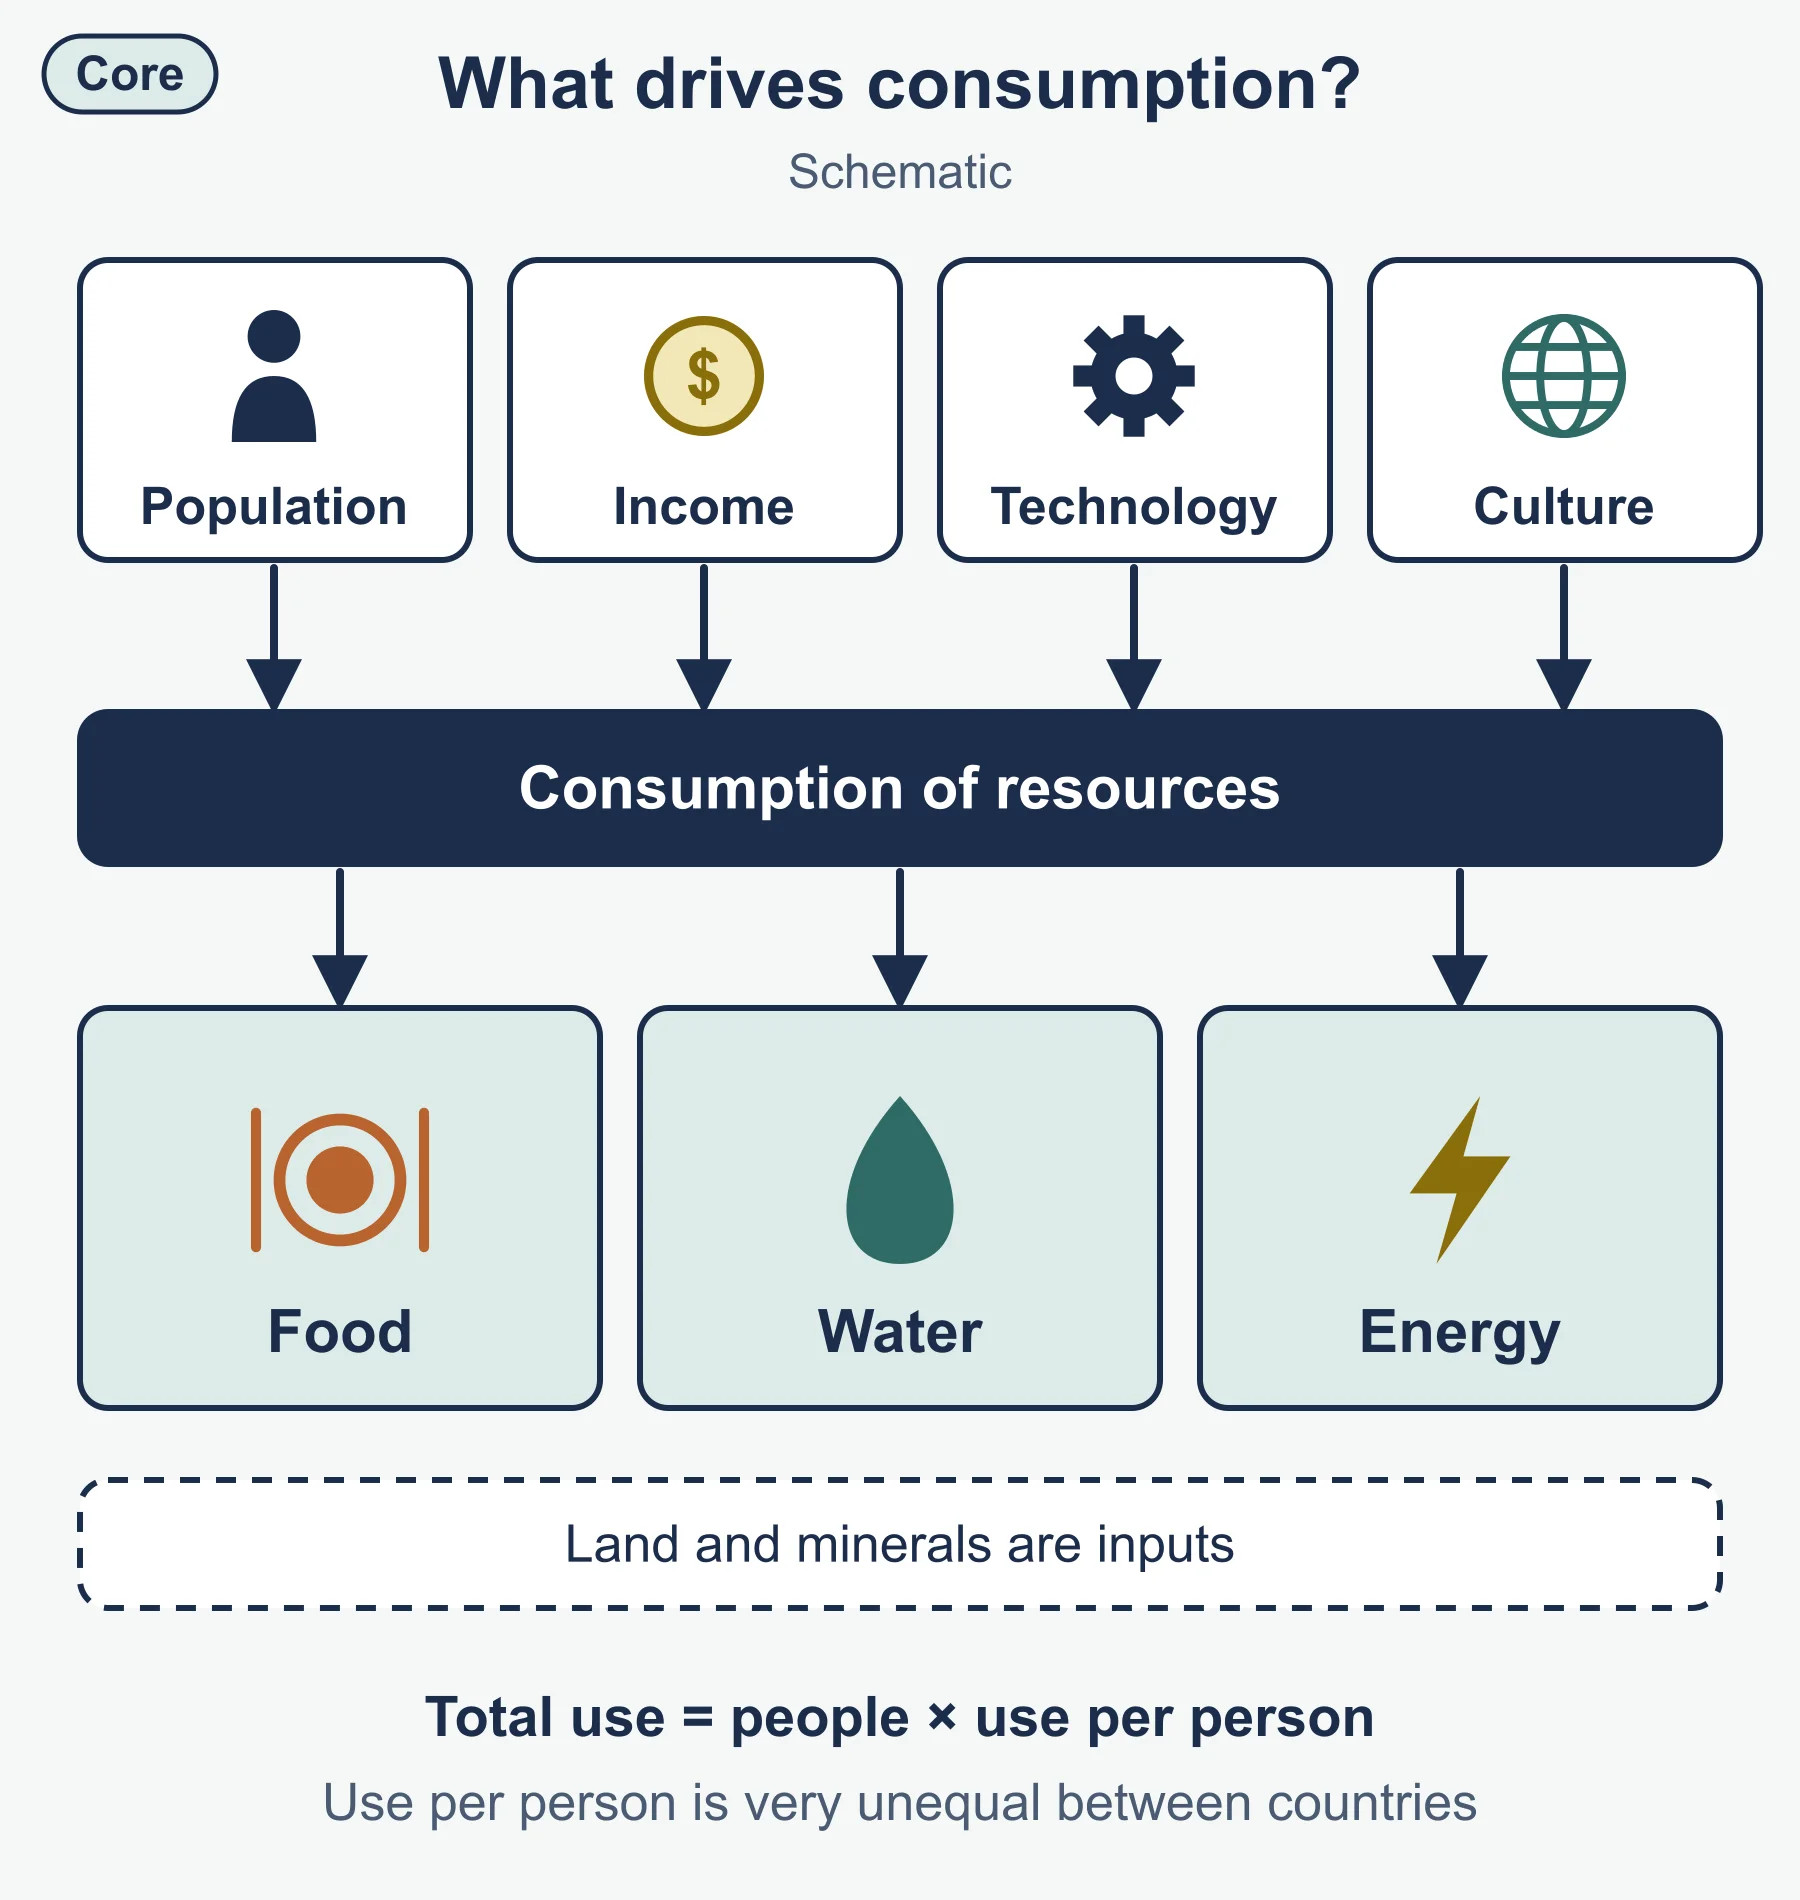
A resource is anything people use that the environment provides. Useful distinctions are renewable and non-renewable, stock and flow resources, and natural capital versus human-made. Consumption is the use of resources by people; it is shaped by population, income, technology and culture.
The three focus resources are food, water and energy, with attention to land and minerals as inputs. Consider overall trends:
- Total consumption has risen as population has grown and as incomes have risen, particularly in emerging economies.
- Per-capita consumption is very unequal. Higher-income countries generally use far more energy, water and food (including meat) per person than lower-income countries, although the gap has been narrowing in places.
- Diets are changing as incomes rise, with more demand for animal products, which require more land and water per unit of food energy.
- Energy demand is still dominated globally by fossil fuels, but renewable energy has grown quickly in many countries.
- Water use is dominated by agriculture, followed by industry and domestic use.
Know how to describe trends from graphs: state the overall direction, quote start and end values with units, identify rates of change, note anomalies and compare regions. Explain with reasons: population growth, urbanisation, the rise of a middle class, technology, trade and government policy.
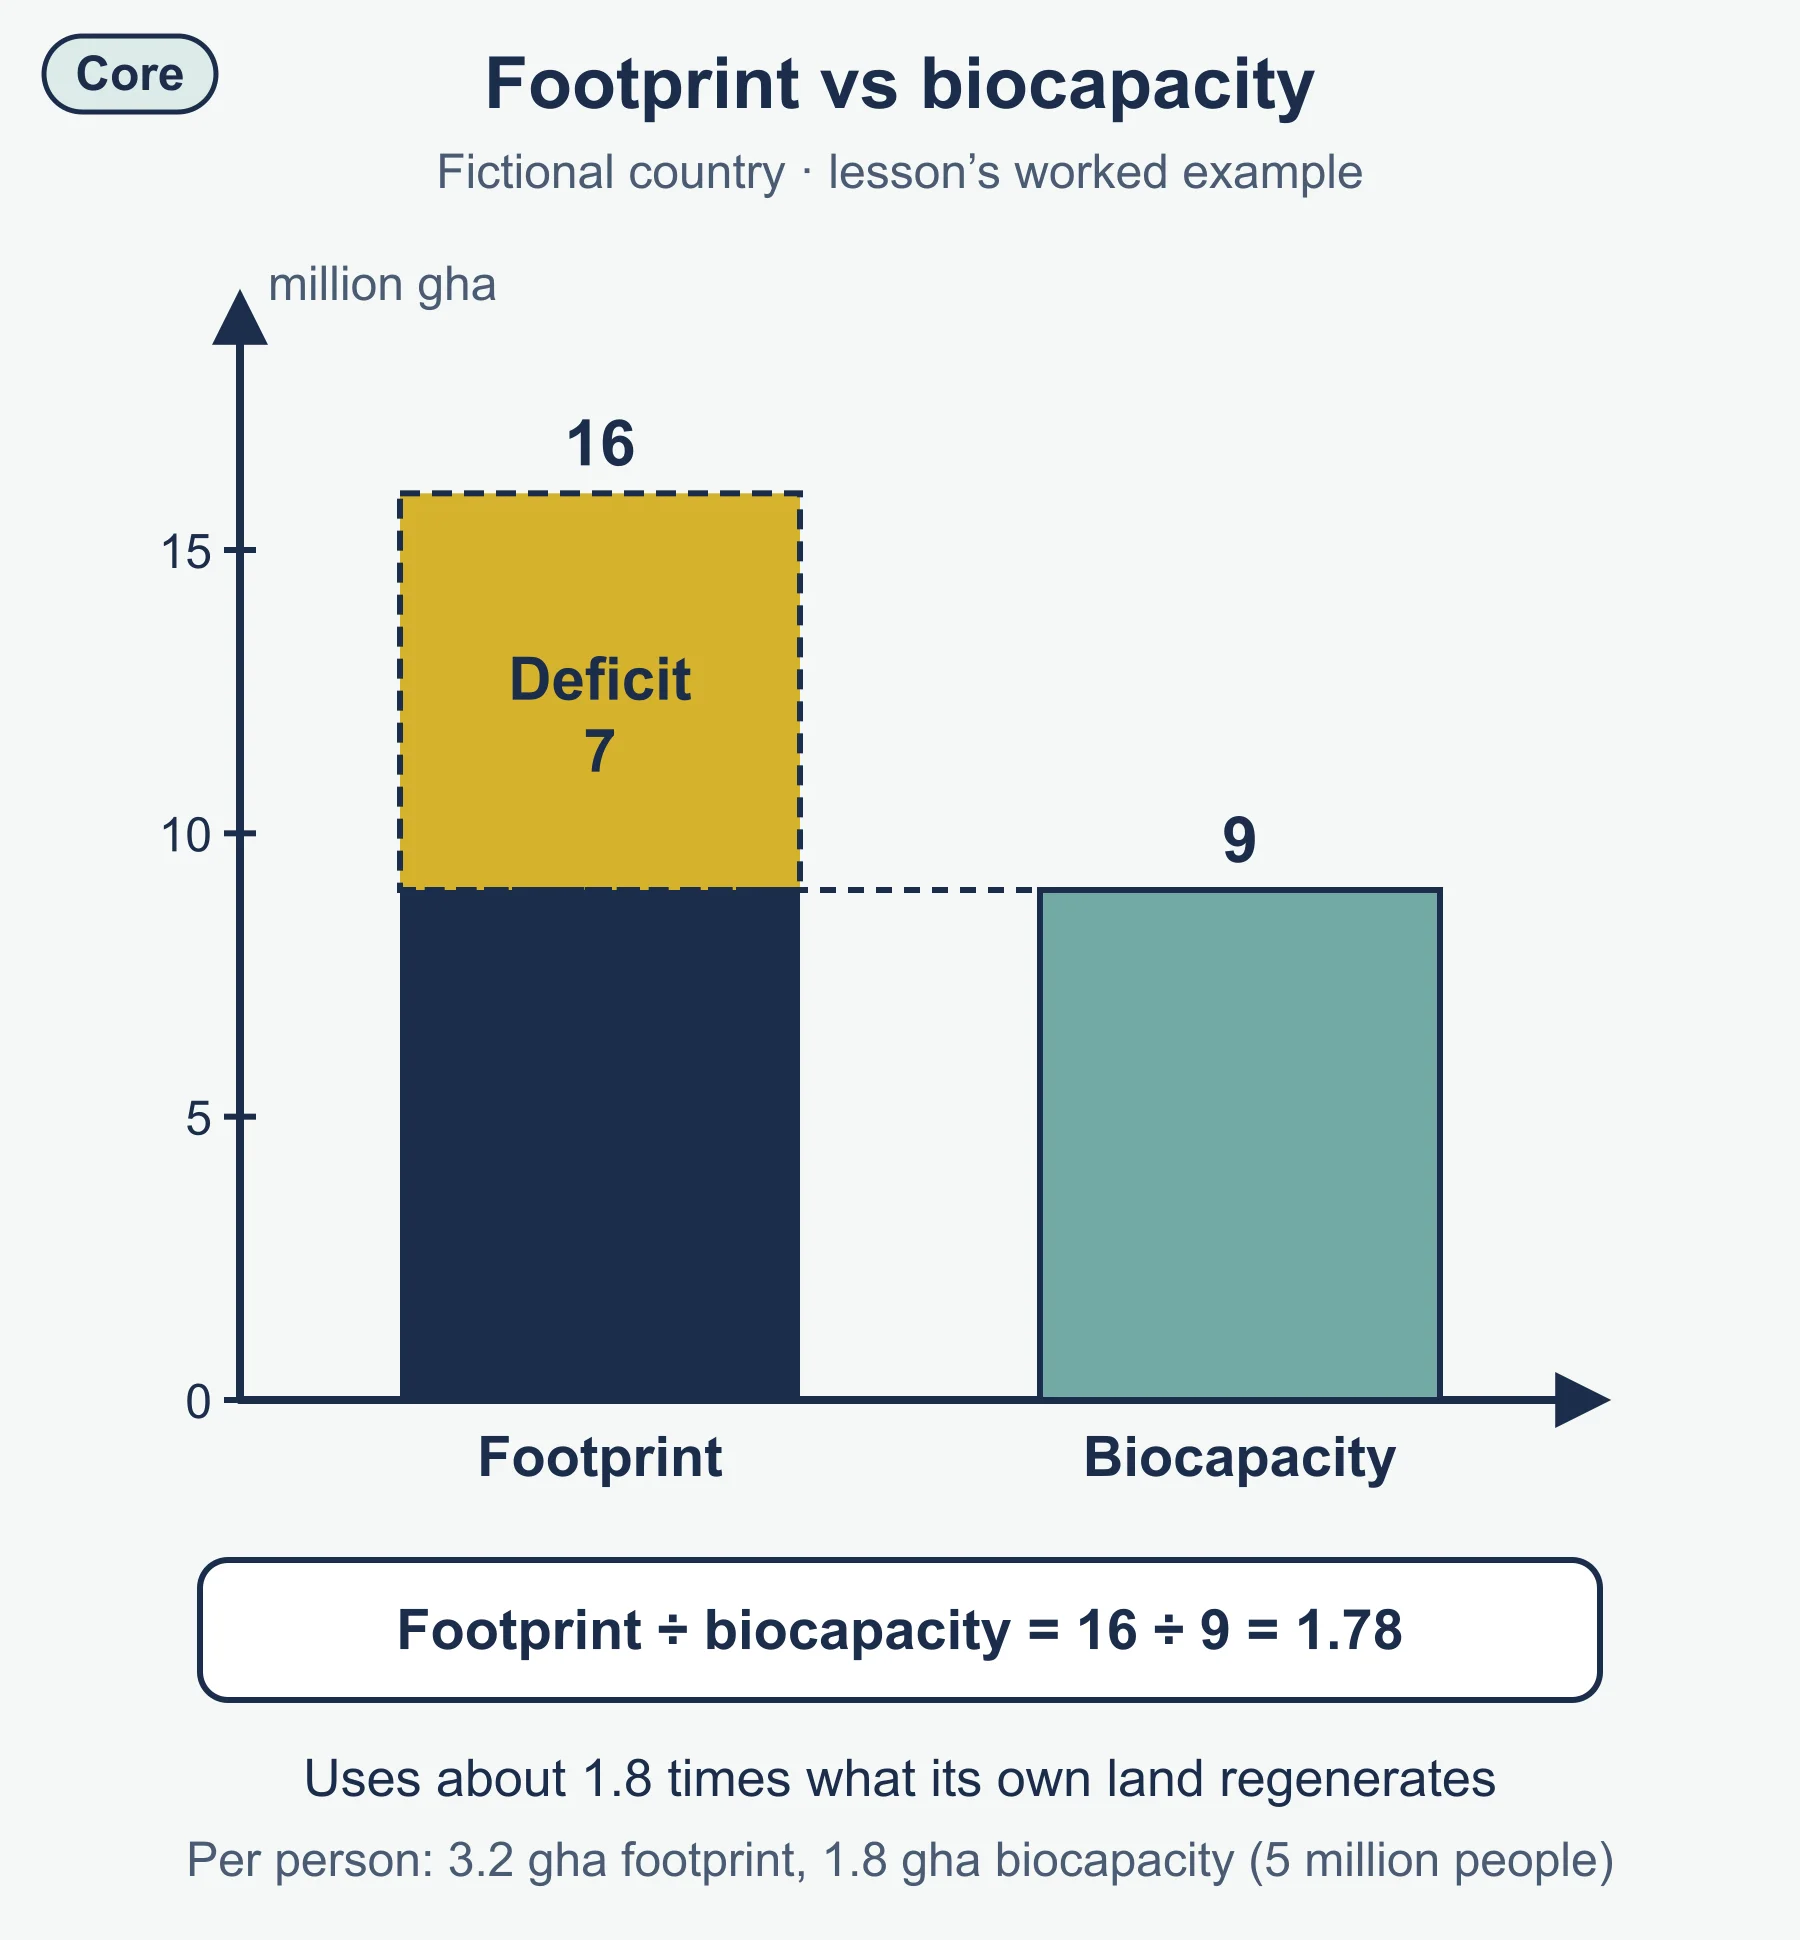
Concepts useful here include the ecological footprint, which measures the productive land and water area needed to supply a population’s consumption and absorb its waste, compared with biocapacity, the area available. When footprint exceeds biocapacity, there is an ecological deficit. Related ideas include the water footprint, carbon footprint and virtual water embedded in traded goods. Environmental Kuznets-style ideas suggest that environmental pressure may rise and then fall as economies develop, but evidence is mixed and you should evaluate rather than assume it.
10.2 Impacts of changing trends in resource consumption
Rising consumption creates opportunities and pressures. Benefits include improved nutrition, health, comfort, industrial growth and development. Pressures include:
- Environmental: land use change, deforestation, soil degradation, depletion of aquifers, pollution, biodiversity loss and greenhouse gas emissions that drive climate change.
- Economic: price volatility, dependence on imports, stranded assets as energy systems change and costs of environmental damage.
- Social and political: unequal access, energy poverty, food insecurity, displacement and resource conflict, along with the geopolitics of exporters and importers.
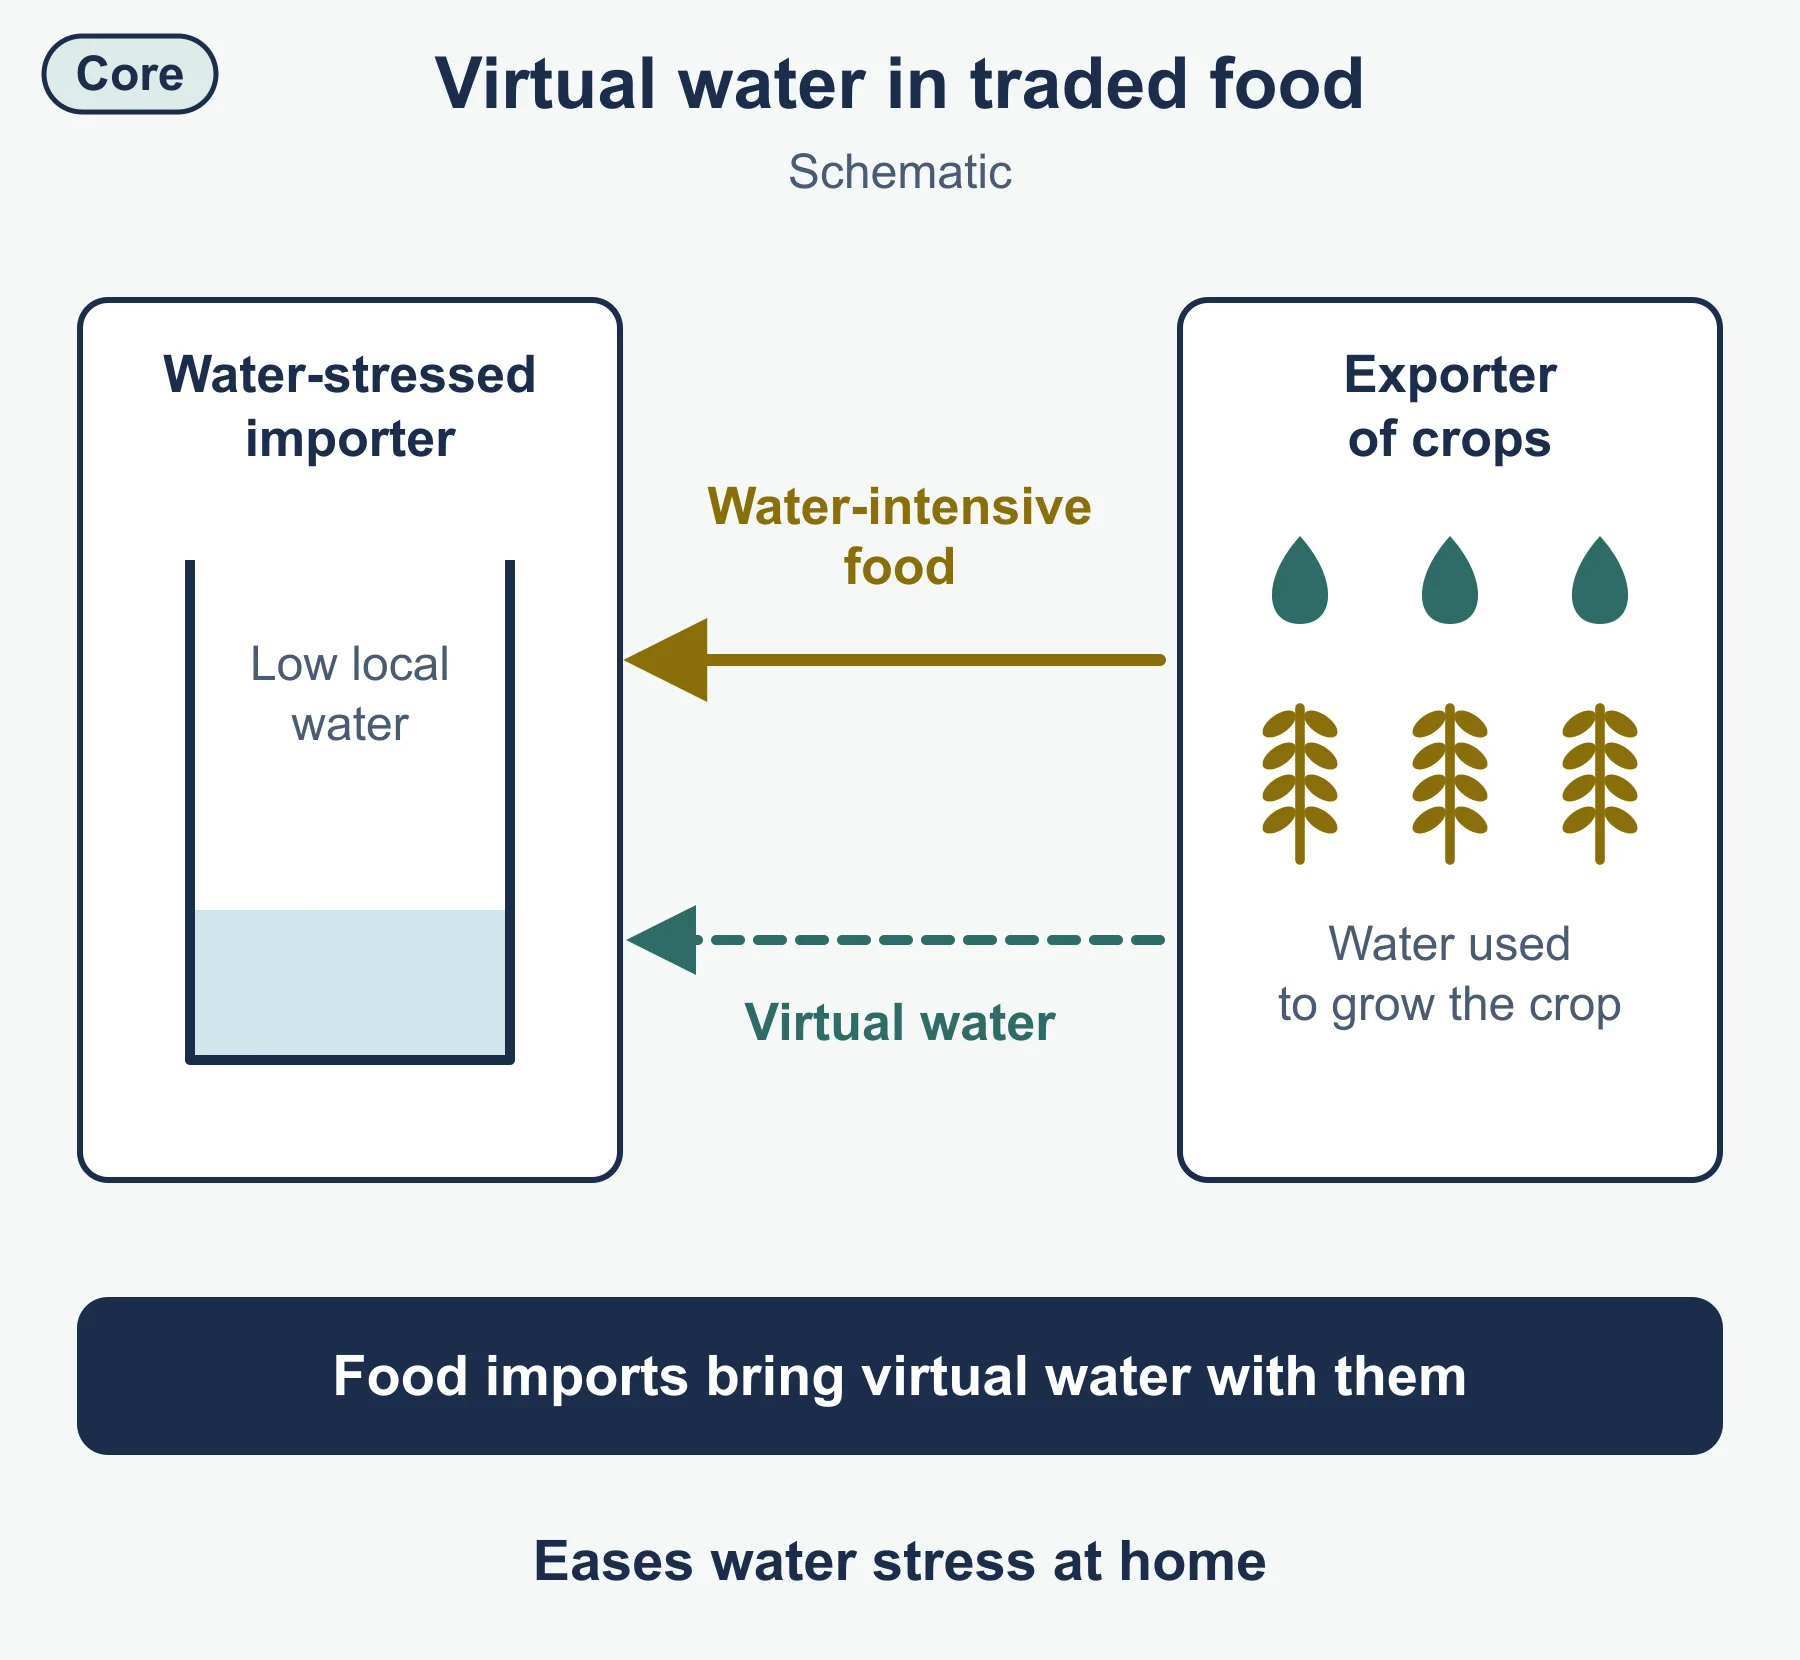
Resource security means reliable access to adequate, affordable and safe supplies. Countries have different security profiles. Some are resource-rich and export, others depend on imports, and some face shortages because of environment, infrastructure or conflict. The idea of a resource pressure on one place affecting another through trade and shared systems is important: for example a country can reduce domestic water stress by importing water-intensive food, effectively importing virtual water.
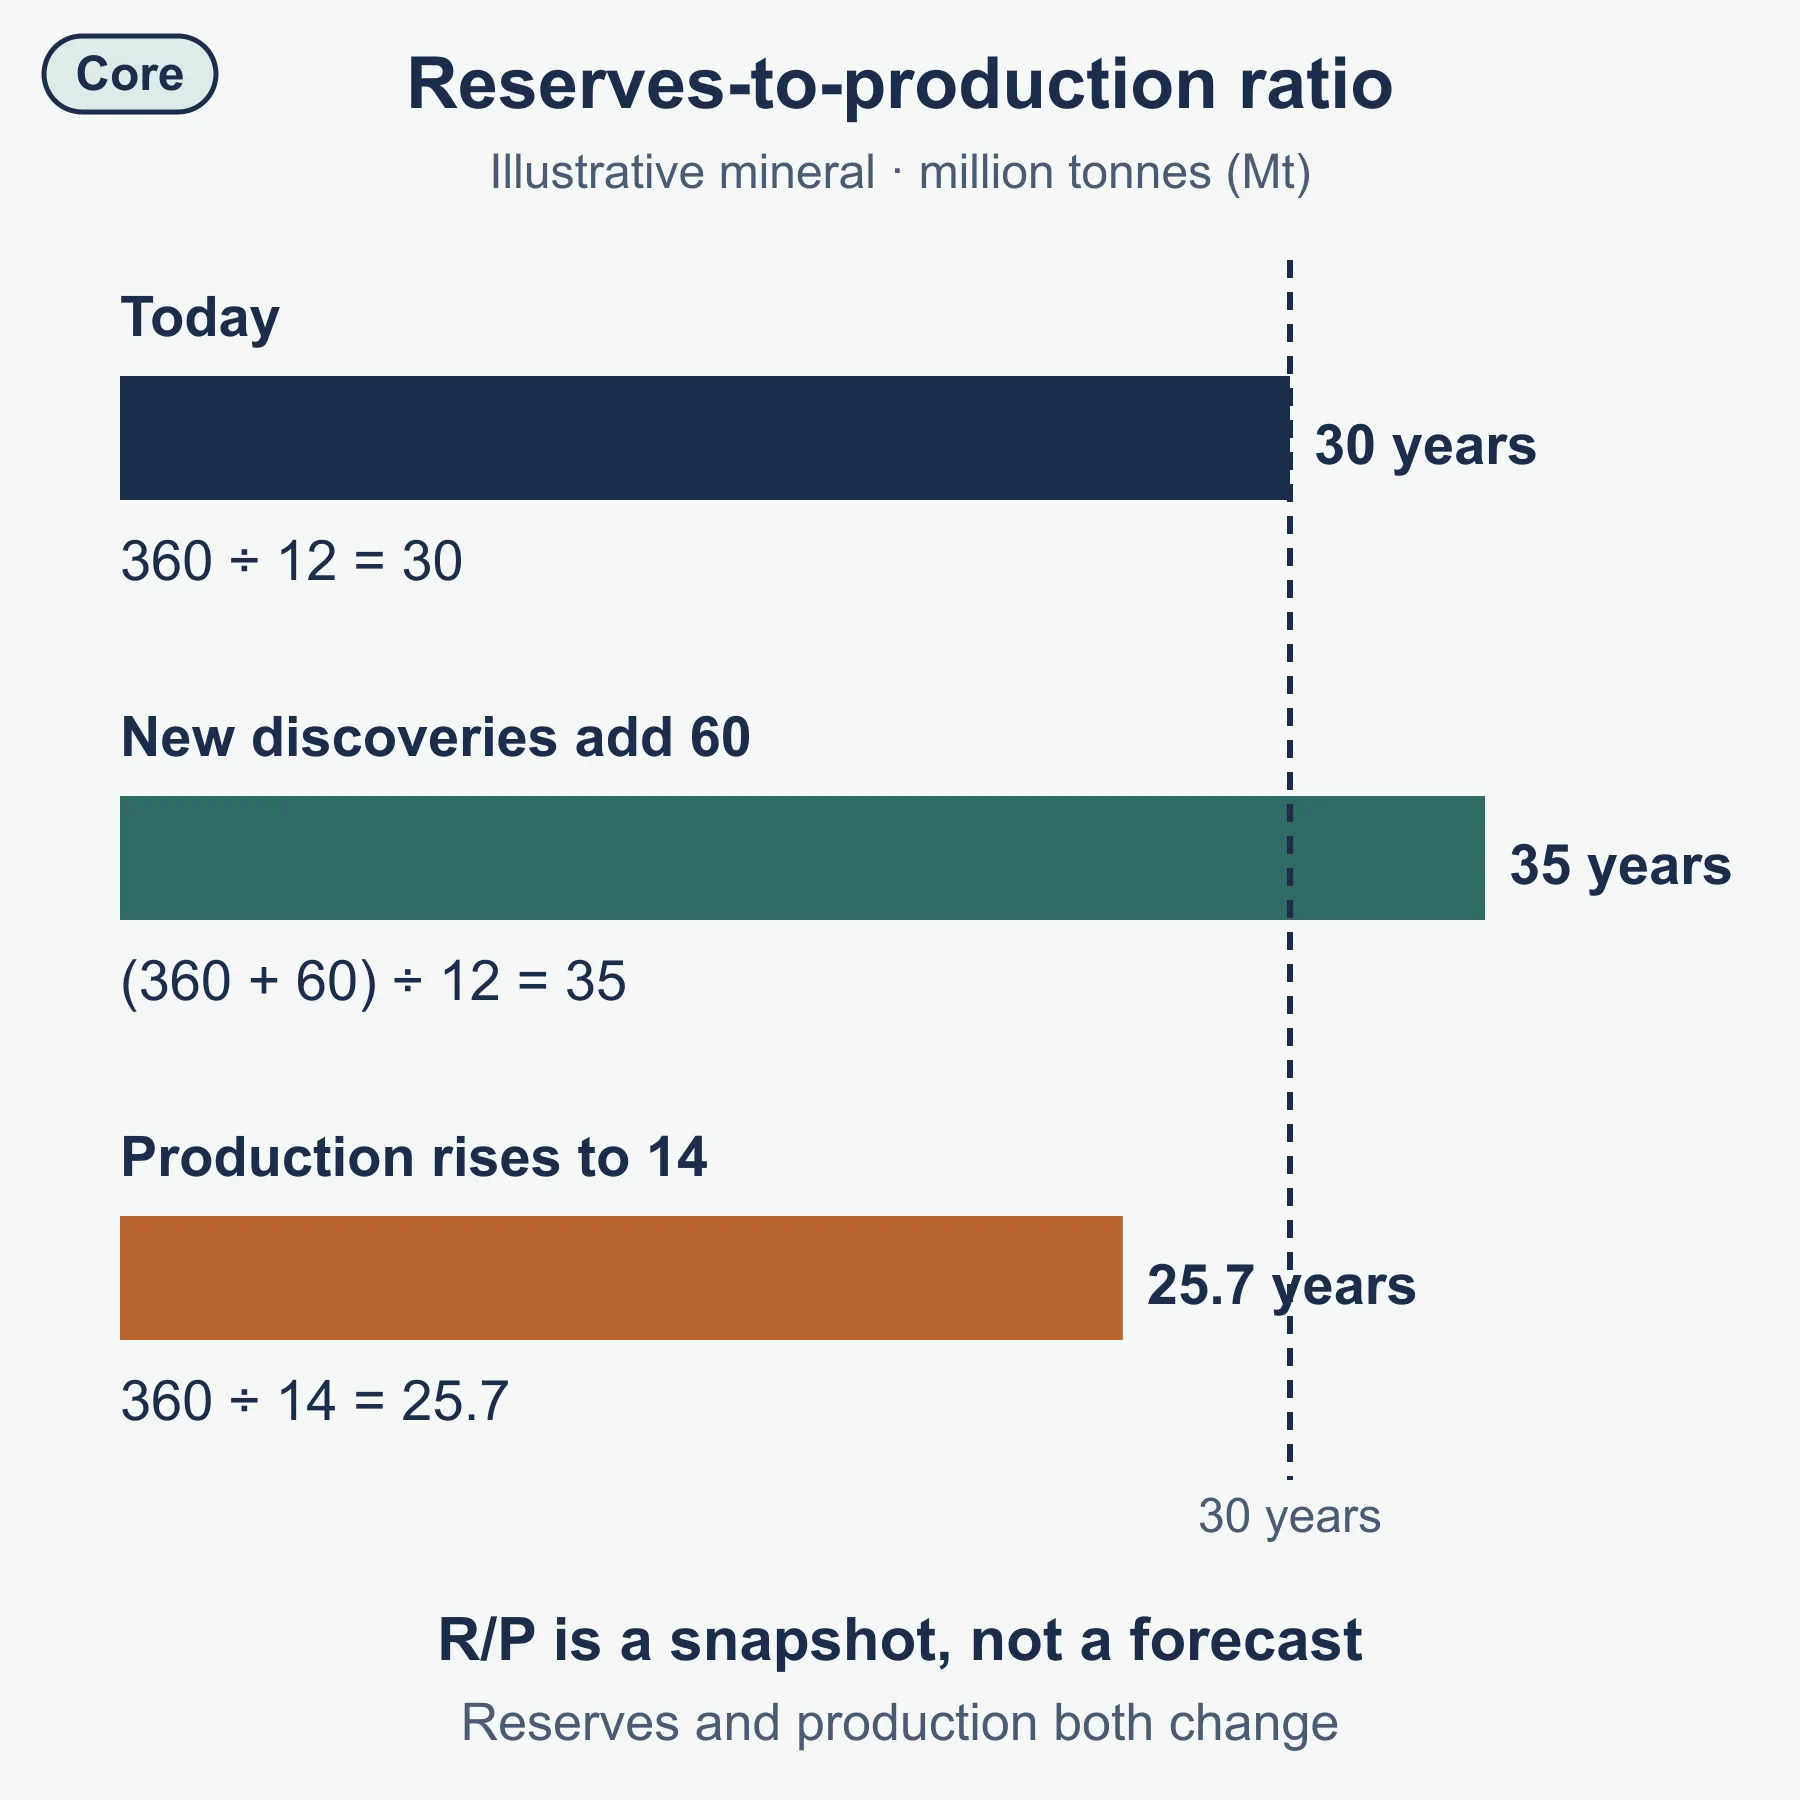
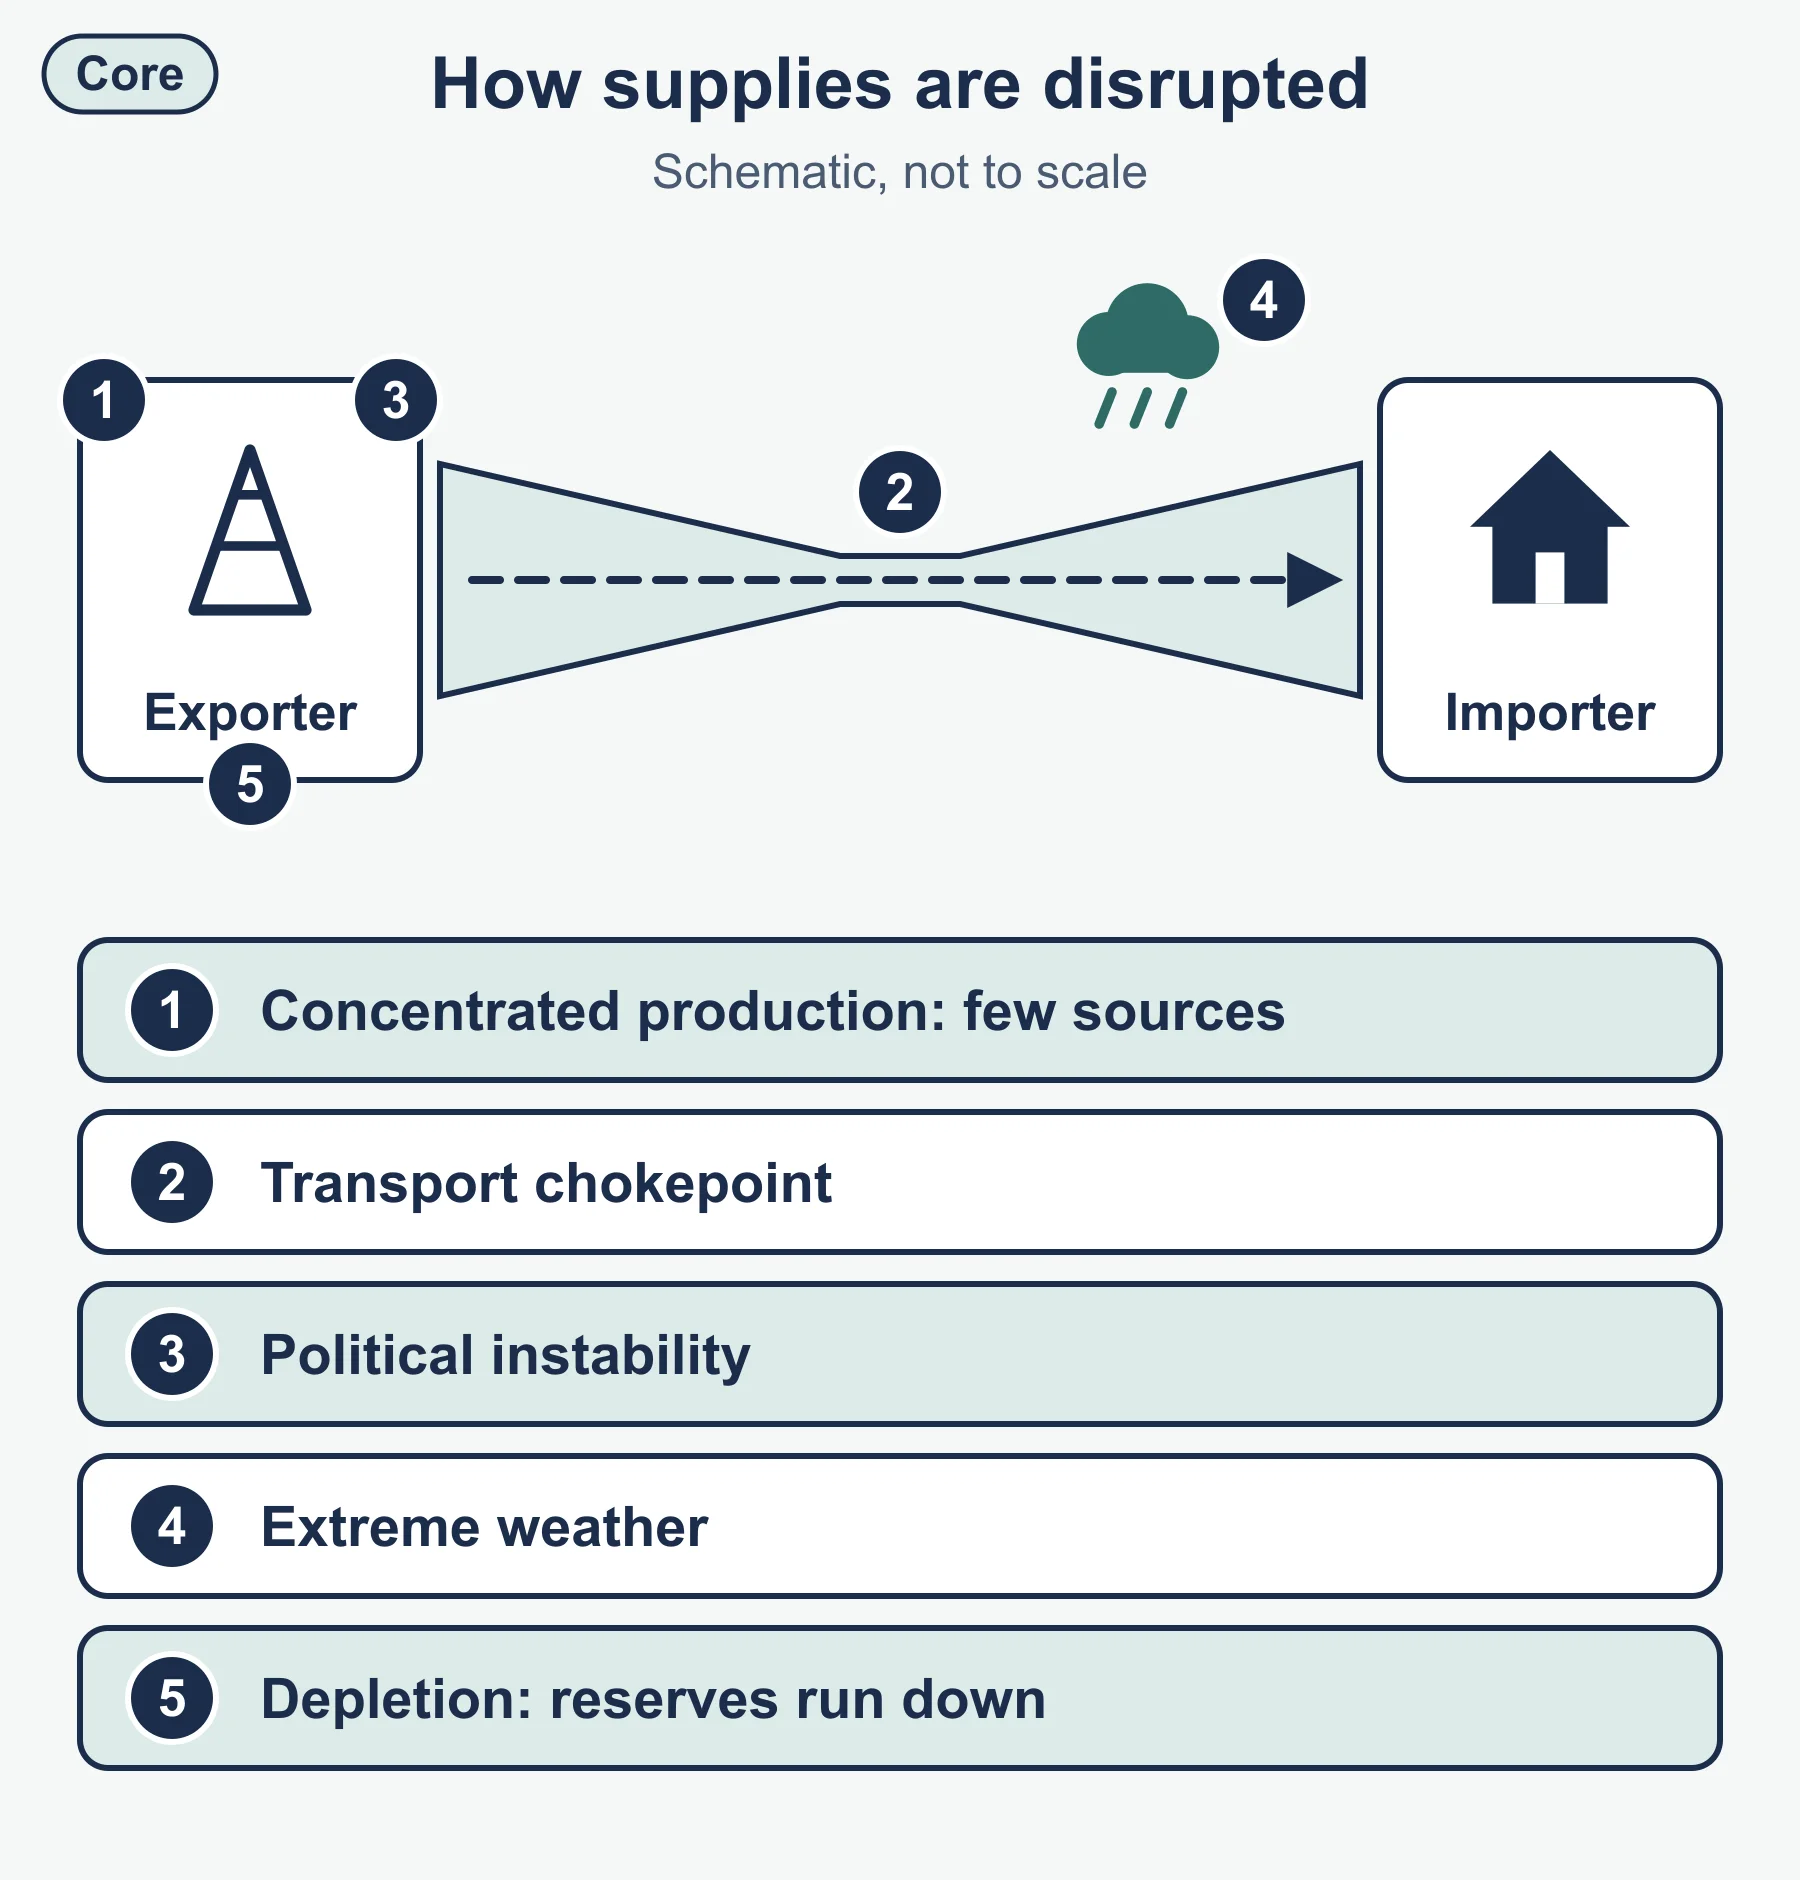
Consider how supply risks arise. Concentrated production, transport chokepoints, political instability and extreme weather can all disrupt supplies. Depletion is another issue: reserves are the portion of a resource that can be extracted economically with present technology, and they change with price and technology. The reserves-to-production ratio estimates how long reserves would last at current output, but it is a simplification because reserves and consumption change.
10.3 Resource stewardship
Stewardship means responsible management of resources so that they are available for the future. It operates at scales from individual to global and involves many stakeholders: governments, businesses, international organisations, non-governmental groups, communities and consumers.
Approaches include:
- Efficiency and conservation: insulation, efficient appliances, irrigation efficiency and reducing food waste.
- Substitution and technology: renewable energy, recycled materials and improved crop varieties.
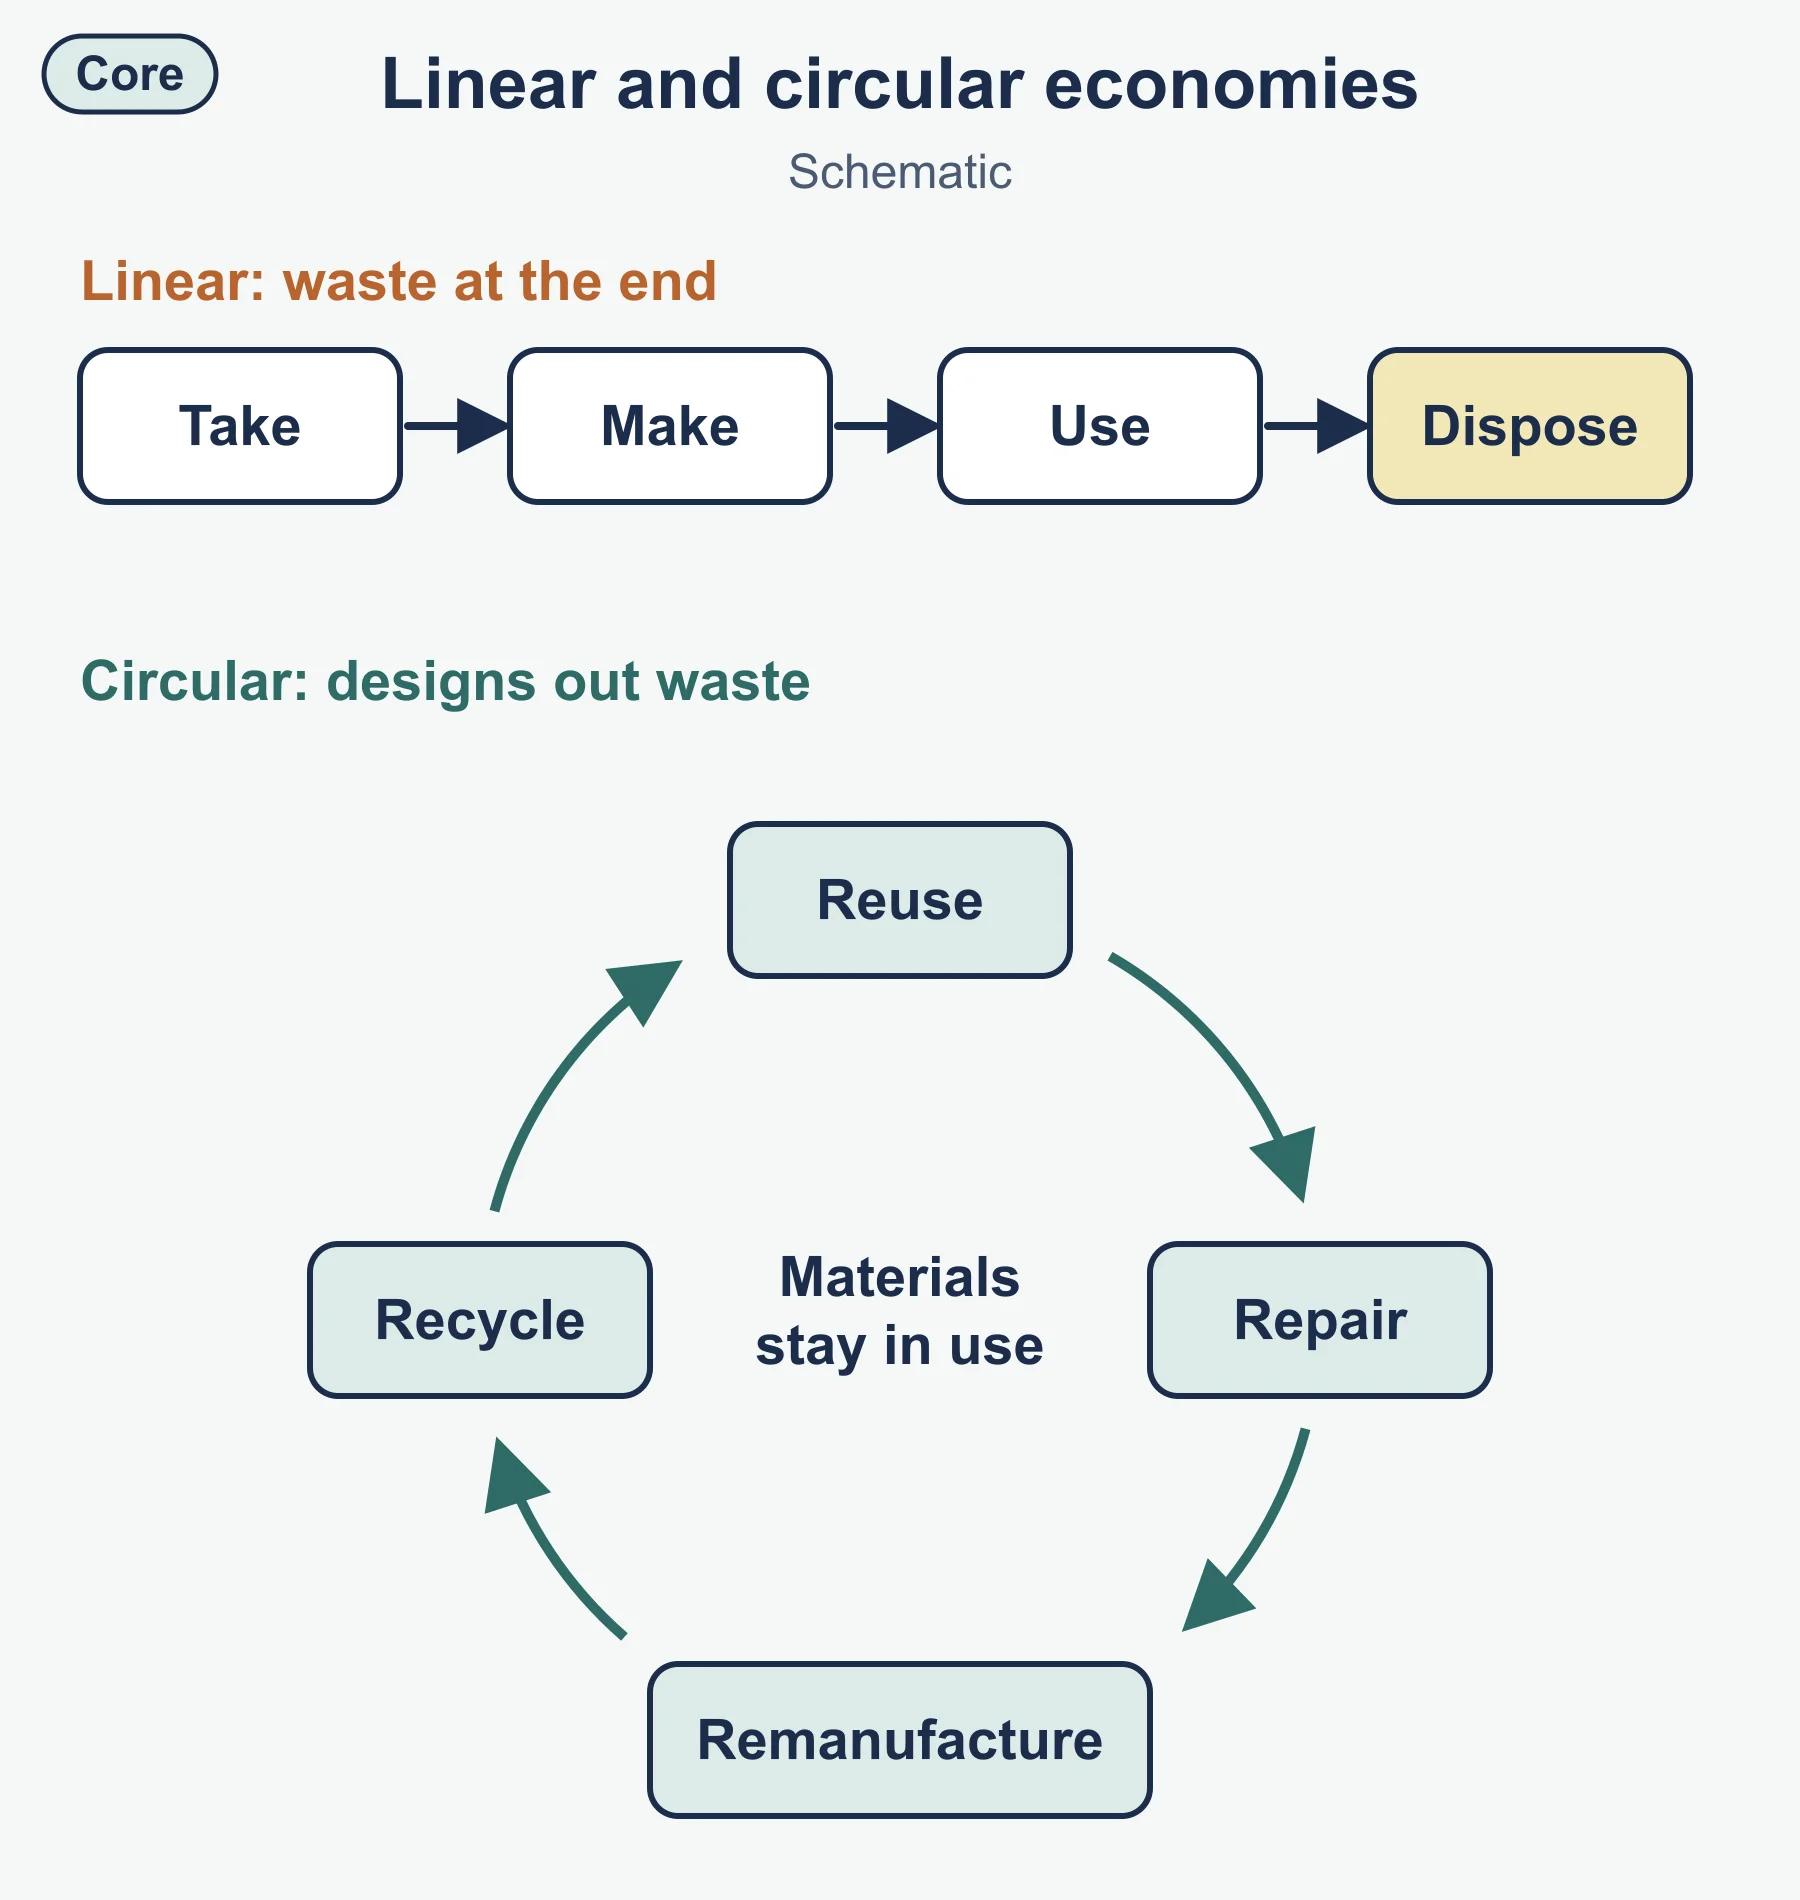
- The circular economy, which designs out waste by reusing, repairing, remanufacturing and recycling, in contrast to a linear take-make-dispose model.
- Certification and labelling schemes, which allow consumers to choose sustainably sourced products, such as forestry and fisheries certification.
- Regulation, pricing and incentives: taxes, quotas, standards, subsidies and carbon pricing.
- International agreements and cooperation on shared resources, along with local community management.
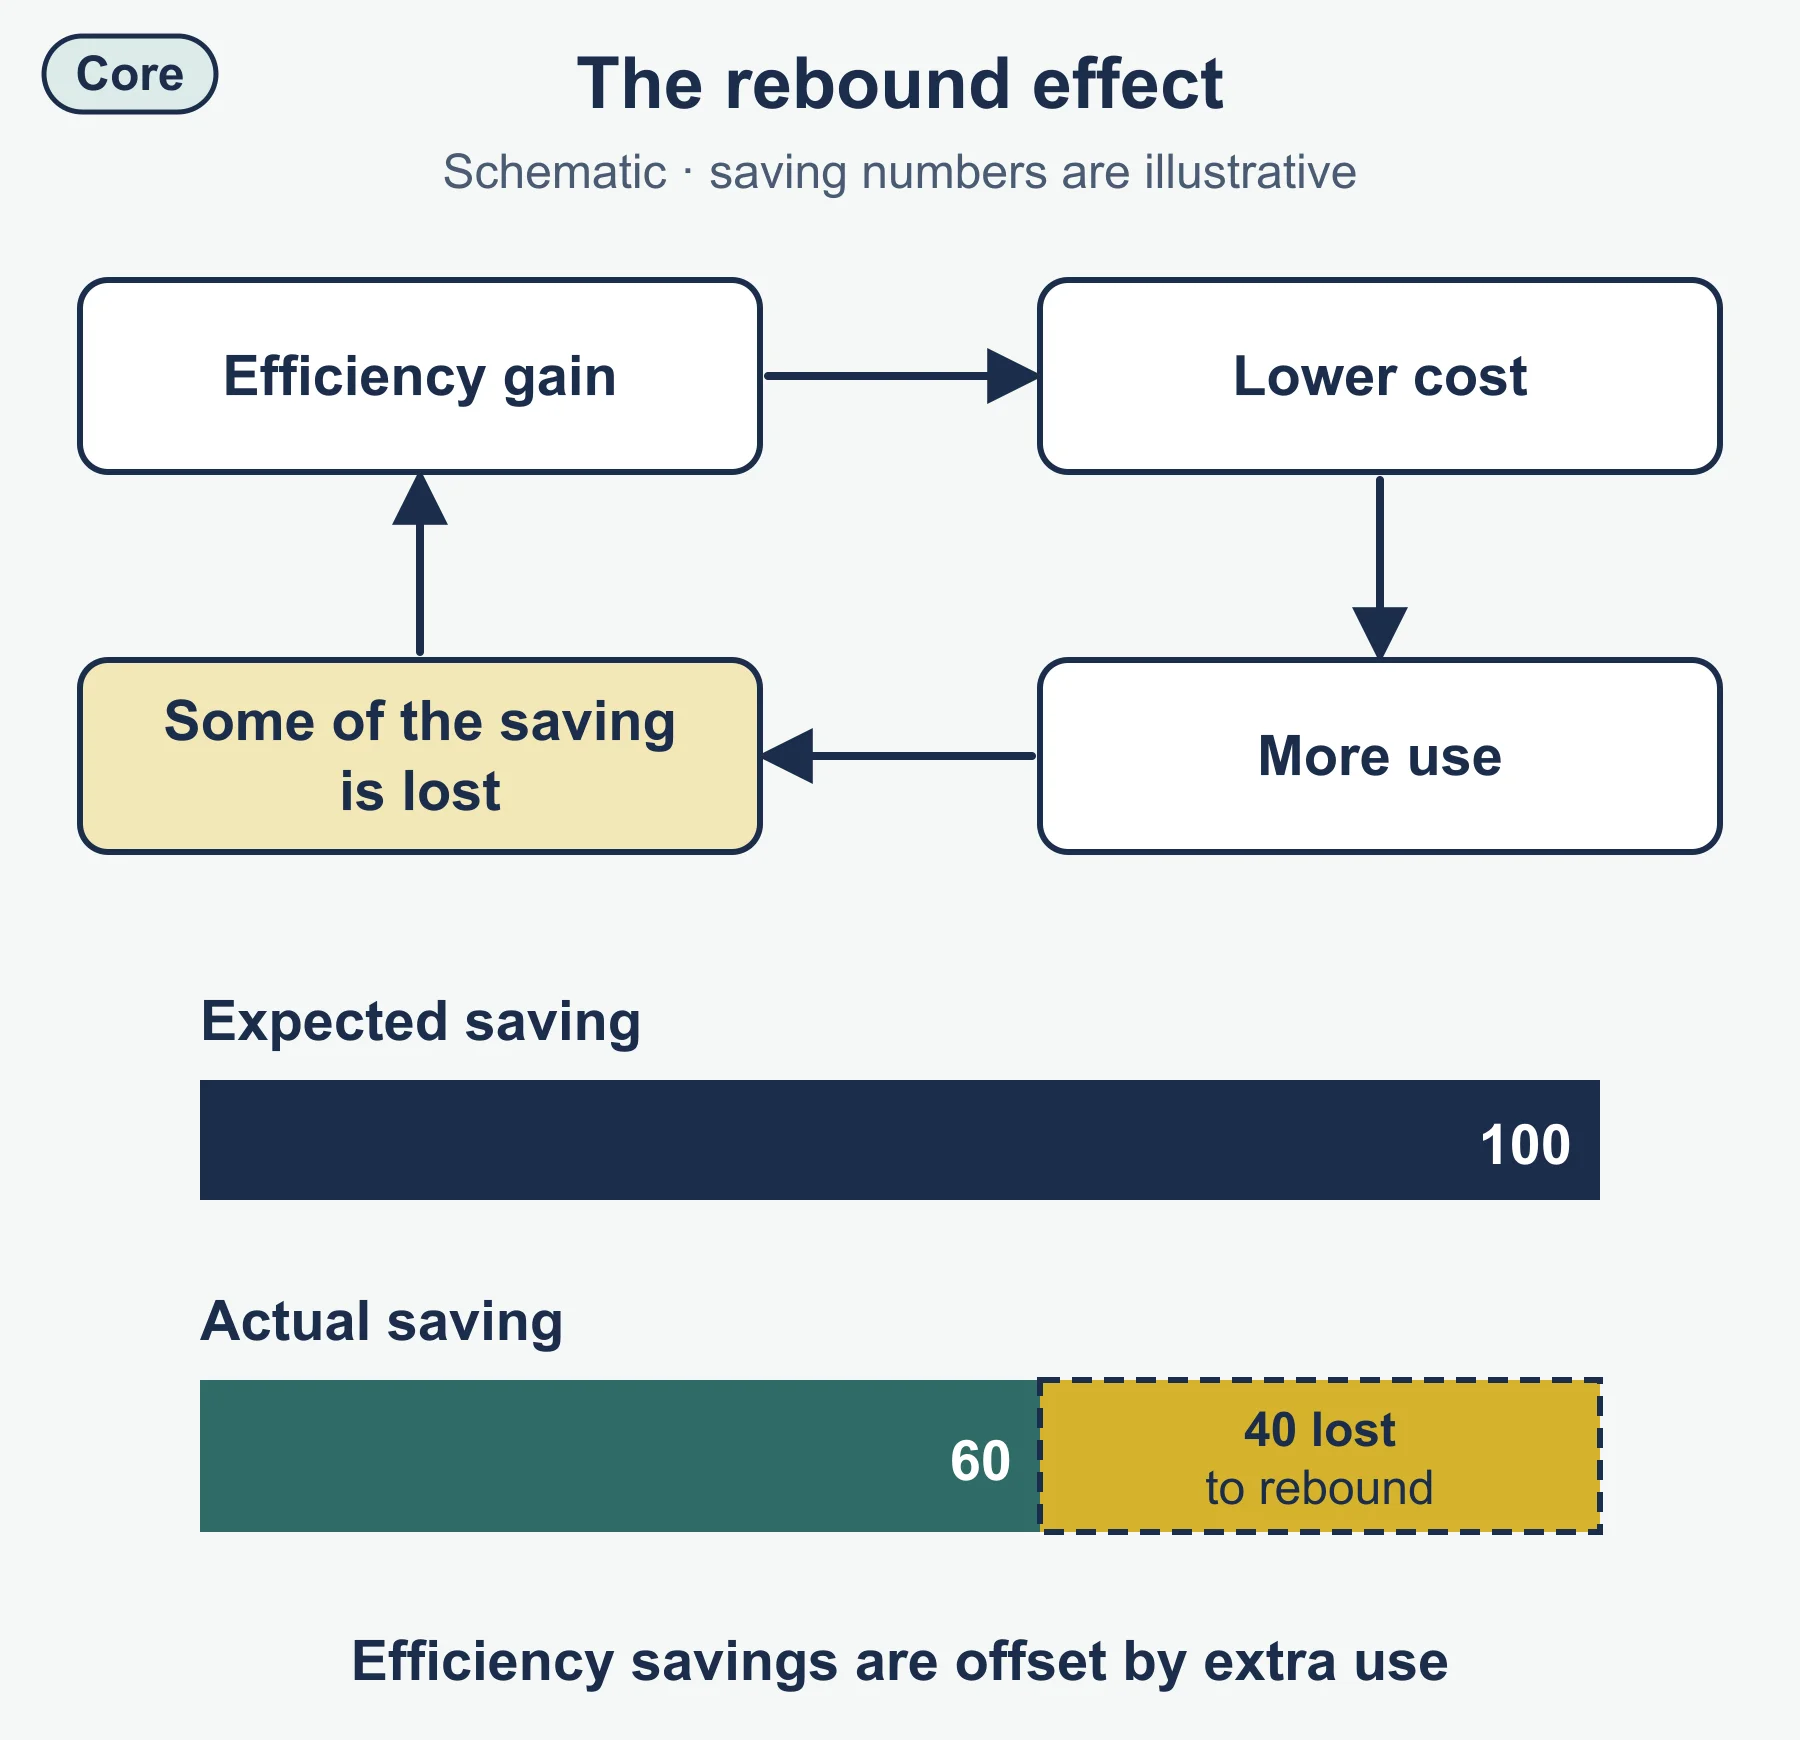
Evaluate stewardship by asking whether it is effective, affordable, fair and enforceable. Consider the rebound effect, where efficiency gains reduce cost and lead to more consumption. Consider equity: lower-income countries argue that their right to develop must be respected, while higher-income countries are responsible for most past consumption. Strong answers balance competing views and use clear criteria.
Worked examples
Example 1: ecological footprint
A fictional country has a population of 5 million. Average footprint is 3.2 global hectares (gha) per person, and biocapacity is 1.8 gha per person.
- Total footprint = 5 million x 3.2 = 16 million gha.
- Total biocapacity = 5 million x 1.8 = 9 million gha.
- Ecological deficit = 16 - 9 = 7 million gha.
- Footprint to biocapacity ratio = 16 / 9 = 1.78, so the country uses about 1.8 times what its own land can regenerate.
Such a country meets the gap by importing resources or drawing down natural capital, which is relevant to security.
Example 2: reserves-to-production ratio
An illustrative mineral has known economic reserves of 360 million tonnes and annual production of 12 million tonnes.
- R/P ratio = 360 / 12 = 30 years.
If new discoveries add 60 million tonnes of reserves, the ratio becomes 420 / 12 = 35 years. If production rises to 14 million tonnes, then 360 / 14 = 25.7 years. This shows why R/P is a snapshot and not a precise forecast.
Common mistakes
- Describing totals when the question asks about per-capita consumption, or the reverse.
- Treating reserves as the same as the total amount of a resource in the ground.
- Assuming renewable resources cannot be overused; water and forests can be depleted.
- Offering stewardship ideas without evaluation or without naming stakeholders.
- Writing a list of places without explaining a pattern.
Exam technique
Command terms drive structure: describe a trend using figures, explain causes, compare regions, and evaluate strategies using criteria. Paper 2 questions may include data stimulus, so quote values with units and note limits. In longer answers, define key terms such as footprint or security, use a located example and end with a justified conclusion that addresses the question.
Check your understanding
- Distinguish renewable from non-renewable resources. Answer: renewable resources replenish naturally within a human timescale, while non-renewable resources are finite and do not regenerate in that timescale.
- Define ecological footprint. Answer: the area of productive land and water needed to supply a population’s consumption and absorb its waste.
- Calculate the deficit if footprint is 10 million gha and biocapacity is 6 million gha. Answer: 10 - 6 = 4 million gha.
- Calculate the R/P ratio for reserves of 90 units and production of 6 units a year. Answer: 90 / 6 = 15 years.
- Give two reasons that per-capita energy use differs between countries. Answer: for example income and industrial structure.
- What is the circular economy? Answer: a system that keeps materials in use through reuse, repair and recycling, minimising waste.
- What is the rebound effect? Answer: efficiency savings are offset when lower costs lead to increased consumption.
- Why is resource stewardship contested between countries? Answer: states disagree about historic responsibility, rights to develop and who should bear costs.
Get free revision emails (optional)
Occasional emails with practice questions, worked explanations and links to free resources for the qualification and subjects you choose. No spam, and you can unsubscribe from any email. The free tools on this site never need an email.
Related resources
-
Study guides
IB DP Geography: Unit 6: Global risks and resilience – Study Guide
Geopolitical, economic and environmental risks, and local and global resilience, as studied in the Higher Level extension of IB Diploma Programme Geography.
Geography · International Baccalaureate · IB
Read guide -
Study guides
IB DP Geography: Unit 5: Human development and diversity – Study Guide
Development opportunities, changing identities and cultures, and local responses to global interactions in the Higher Level extension of IB Diploma Programme Geography.
Geography · International Baccalaureate · IB
Read guide -
Study guides
IB DP Geography: Option E: Leisure, tourism and sport – Study Guide
A study guide to the Leisure, tourism and sport option in IB DP Geography: leisure patterns, tourism and sport at different scales, and sustainable management.
Geography · International Baccalaureate · IB
Read guide
Related articles
-
teaching
A Level tuition in Dubai: Cambridge or Pearson Edexcel International A Level?
Schools in Dubai and Abu Dhabi teach either Cambridge International AS & A Level or Pearson Edexcel International A Level. How the two are structured, why it matters for tuition, and how online classes from Lahore work.
9 October 2026
-
curriculum guides
Choosing subjects at IGCSE and A Level
How subject choices at 14 and 16 affect university options later, and how to keep pathways open without overloading a timetable.
28 July 2026
Studying this with a teacher
Working through Geography IB?
This page is free and stays free. Marlbridge is not offering Geography classes at the moment, so there is no tuition to book for it. The free study resources stay open to everyone.