
Study Guides
IB DP Geography: Option E: Leisure, tourism and sport – Study Guide
A study guide to the Leisure, tourism and sport option in IB DP Geography: leisure patterns, tourism and sport at different scales, and sustainable management.
- Subject
- Geography
- Level
- IB
- Topic
- Topic 5: Option E: Leisure, tourism and sport
- Author
- Marlbridge Academic Team
- Updated
- Reviewed by
- Azam Siddique (what this means)
Aligned to International Baccalaureate IB Diploma Programme Geography (DP Geography), First assessments 2019. Official specification .
Syllabus page (what it covers and how it is assessed): IB Diploma Programme Geography.
Syllabus points this page covers
DP Geography
- 5.1 Changing leisure patterns
- 5.2 Tourism and sport at the local and national scale
- 5.3 Tourism and sport at the international scale
- 5.4 Managing tourism and sport for the future
This page covers all 4 subtopics recorded here in topic 5, Option E: Leisure, tourism and sport.
Leisure, tourism and sport is one of the teacher-selected options in the geographic themes part of IB Diploma Programme Geography. It explores how leisure time is used, how tourism and sport shape places from local to global scale, and how these activities can be managed sustainably. Check that your school teaches this option. The IB DP Geography syllabus guide shows how options relate to the core.
Where this fits in the course
Options are examined in Paper 1. Answers earn most credit when they use geographical models, such as tourism life cycles, alongside well-chosen places. Many students know a lot about holidays but write too descriptively; aim to explain causes and evaluate impacts, always for specific stakeholders.
5.1 Changing leisure patterns
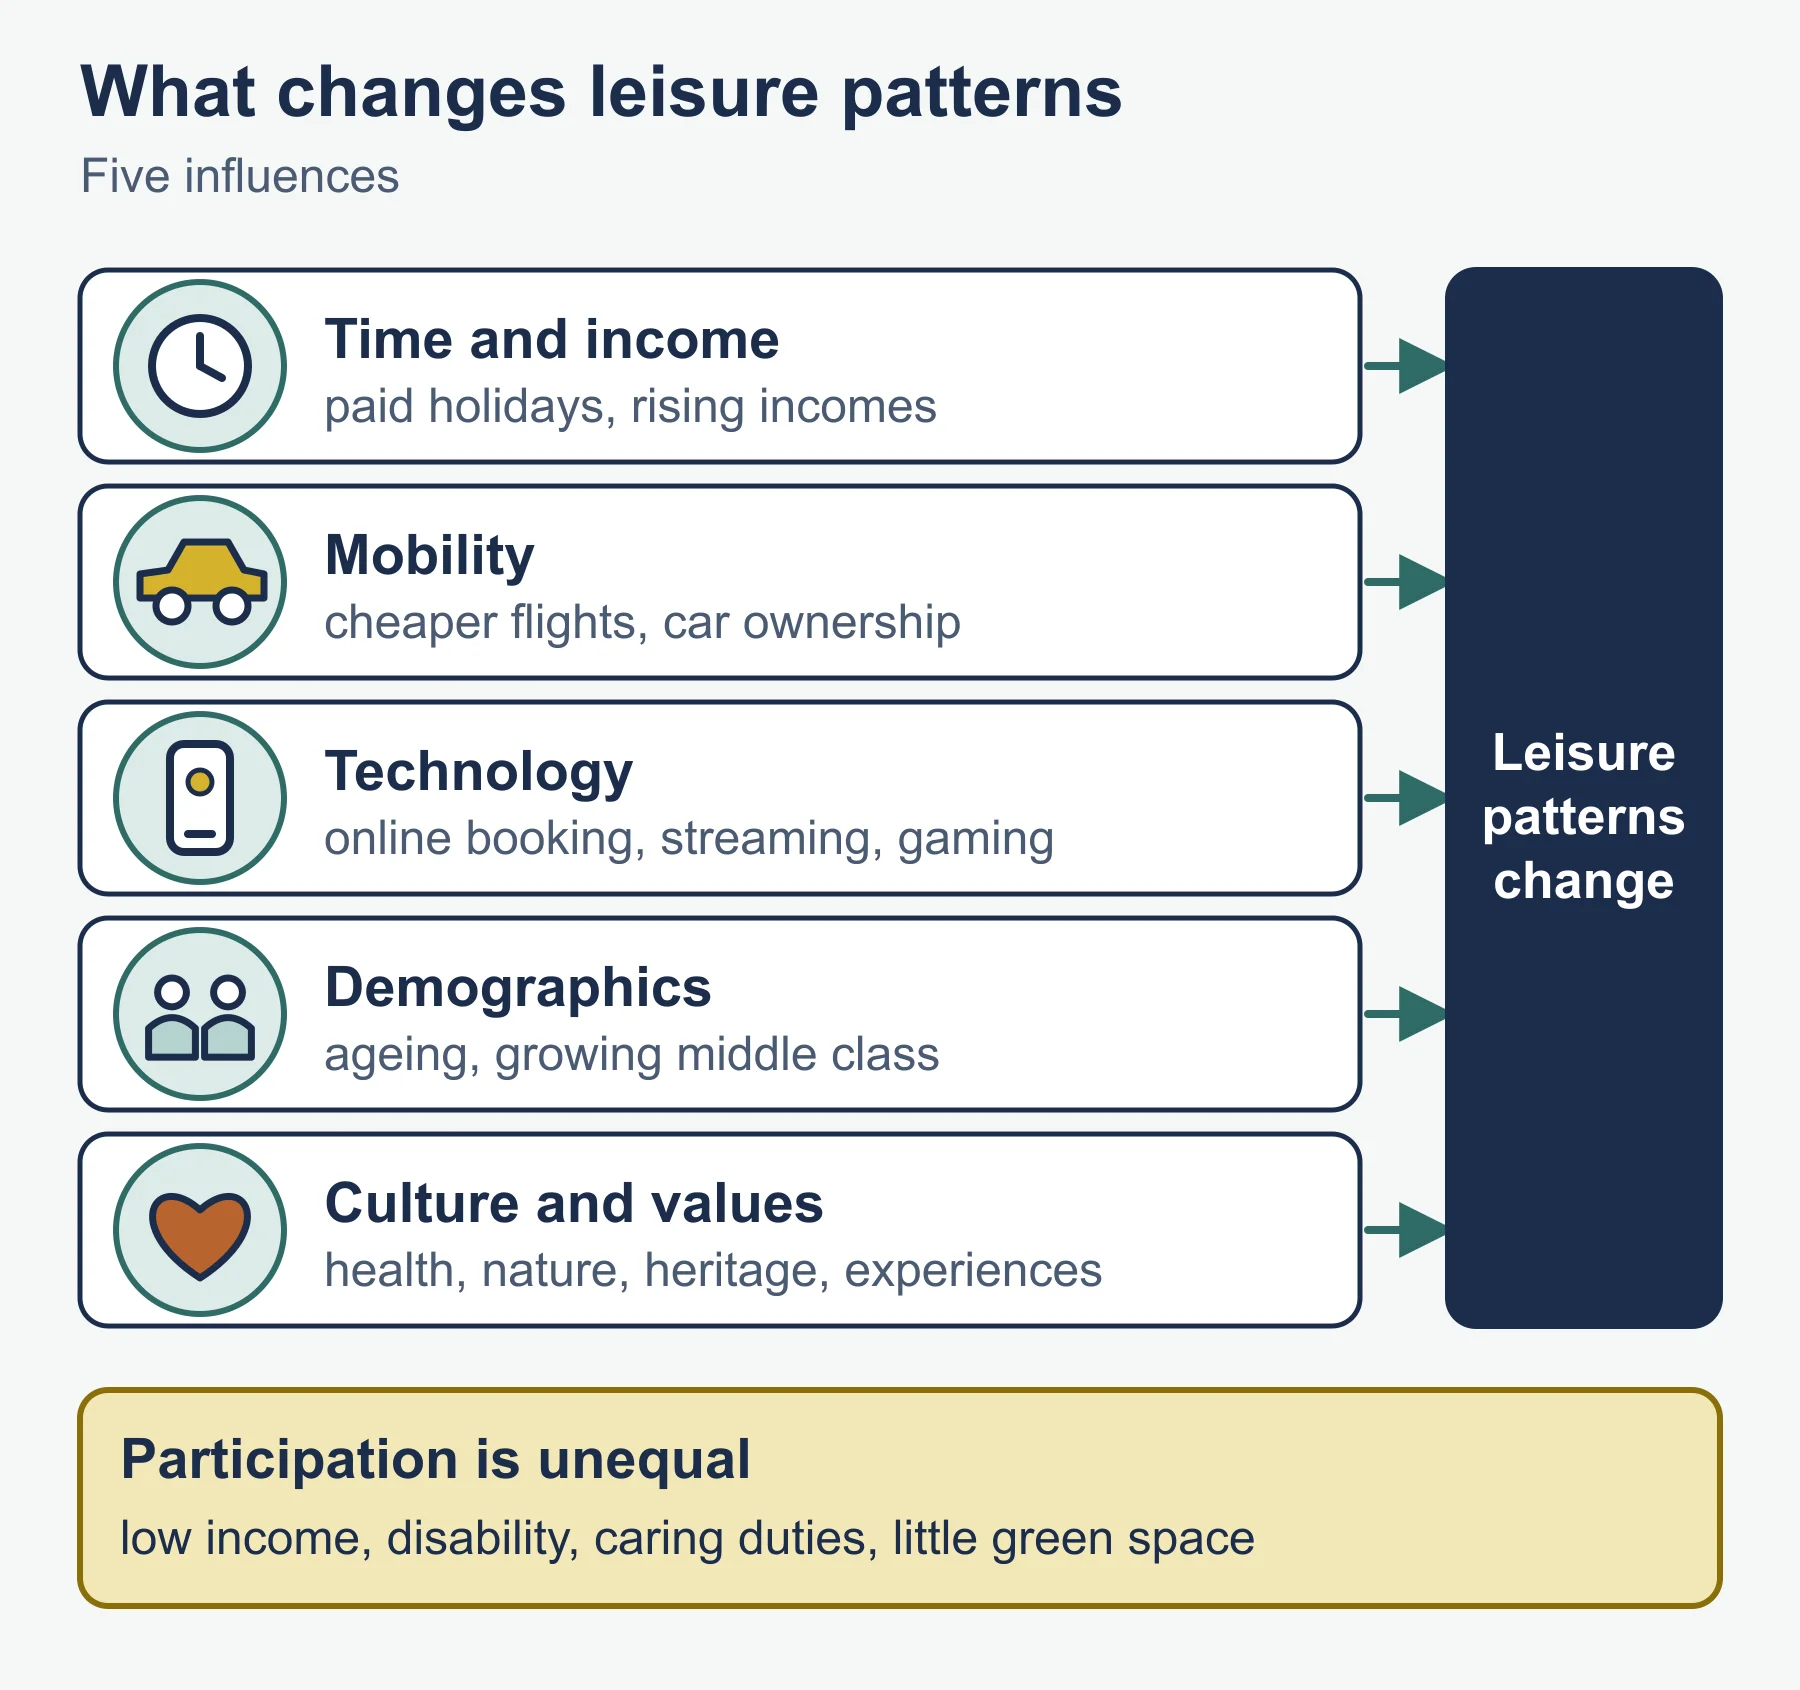
Leisure is time free from work and obligations, and recreation is what people do with it. Patterns of leisure change over time and between places. Influences include:
- Time and income: shorter working weeks, paid holidays and rising disposable income in many economies expand leisure options.
- Mobility: cheaper air travel, car ownership and better transport extend how far people travel.
- Technology: the internet, online booking, streaming and gaming change both what people do and how they plan trips.
- Demographics: ageing populations, changing household structures and a growing middle class in emerging economies change demand.
- Culture and values: health awareness, interest in nature, heritage and experiences.
Leisure participation is unequal. People with low income, disability, caring responsibilities or little access to green space may have fewer opportunities. A geographer therefore looks for patterns by age, gender, income and location, and asks why they exist. Consider also how leisure has become commercialised, with growth in theme parks, shopping as leisure, fitness industries and sporting events.
5.2 Tourism and sport at the local and national scale
Tourism covers travel and temporary stay away from home for leisure, business or other purposes. Types include domestic and international, mass and niche, and categories such as beach, cultural, heritage, adventure, ecotourism and urban tourism.
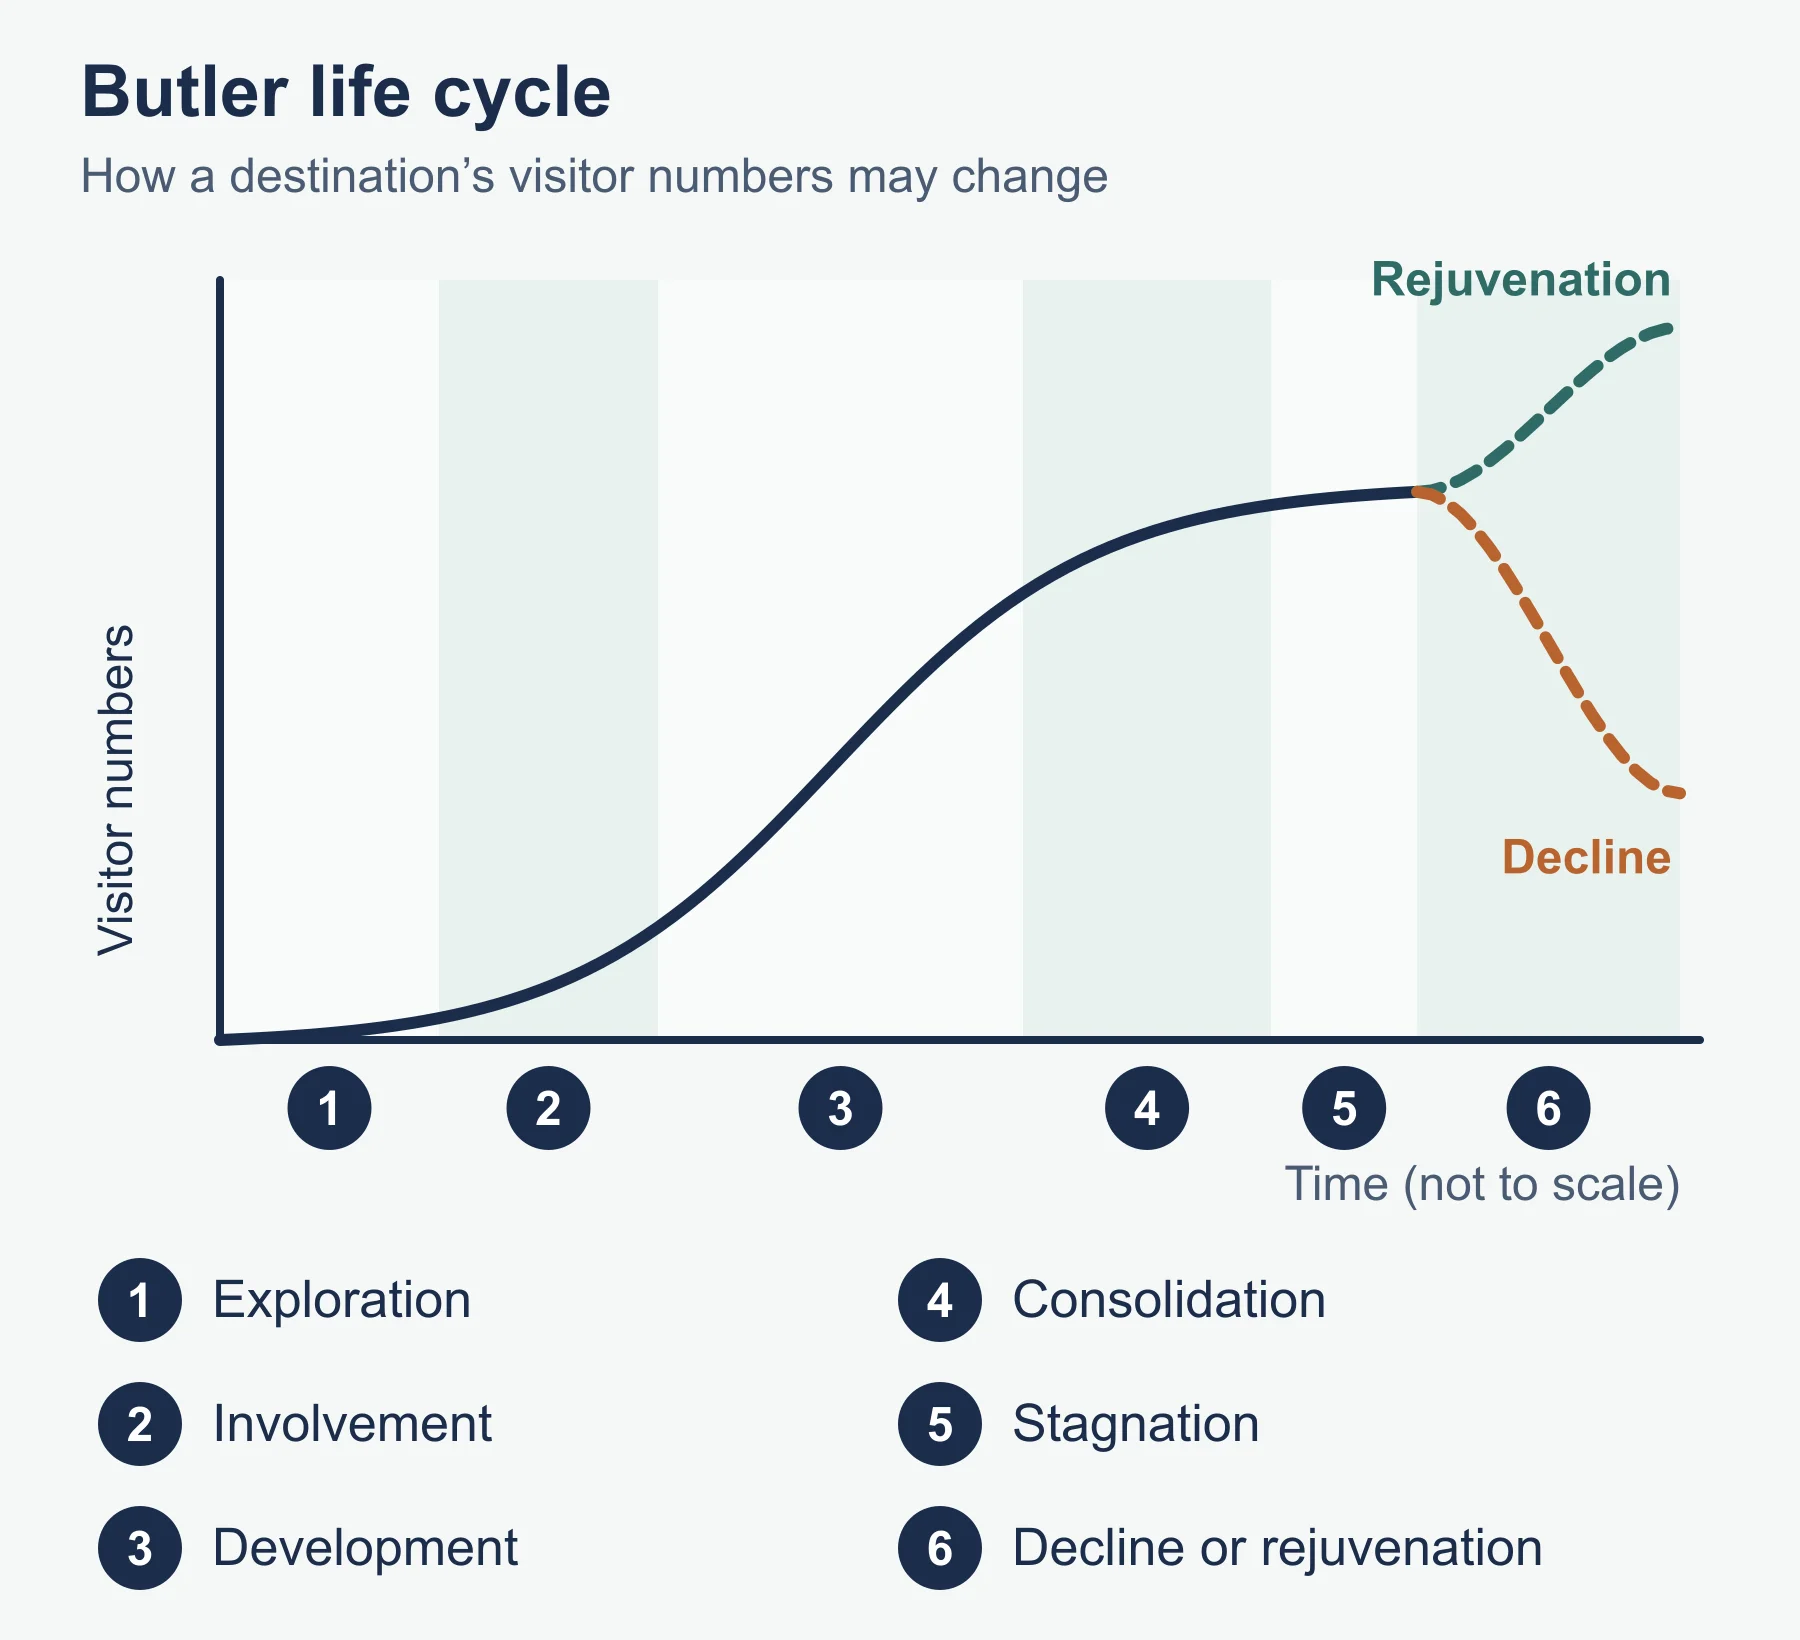
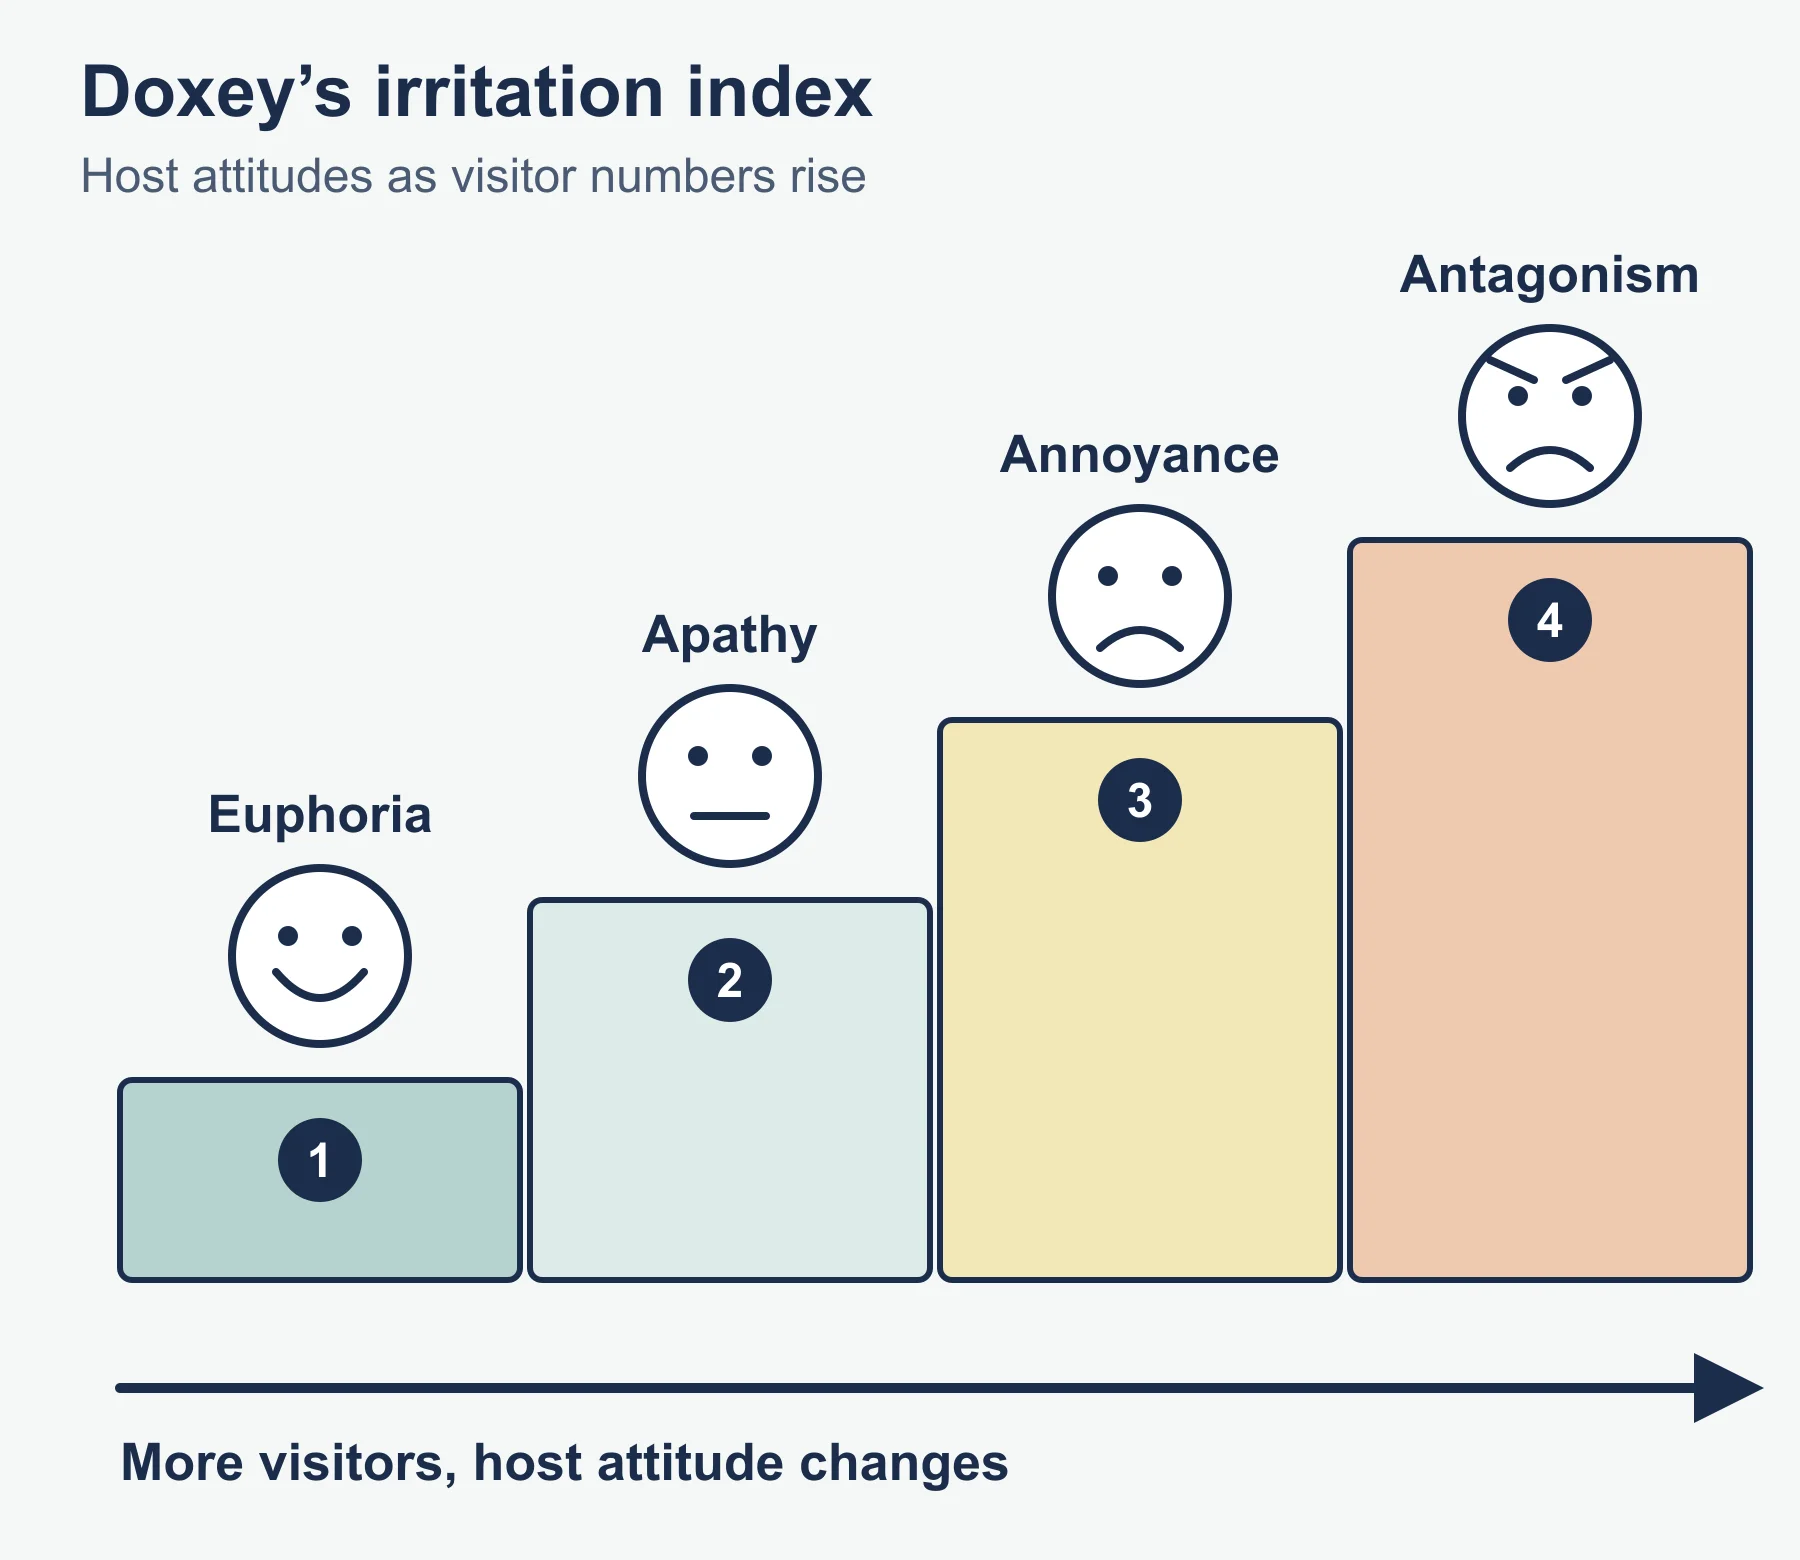
Destinations can be described using Butler’s tourism area life cycle: exploration, involvement, development, consolidation, stagnation and then decline or rejuvenation. It is a model, so evaluate it: not every destination follows the curve, and management can alter its path. Doxey’s irritation index describes changing host attitudes from euphoria through apathy and annoyance to antagonism as visitor numbers rise. Plog’s model links traveller personality types to destination popularity.
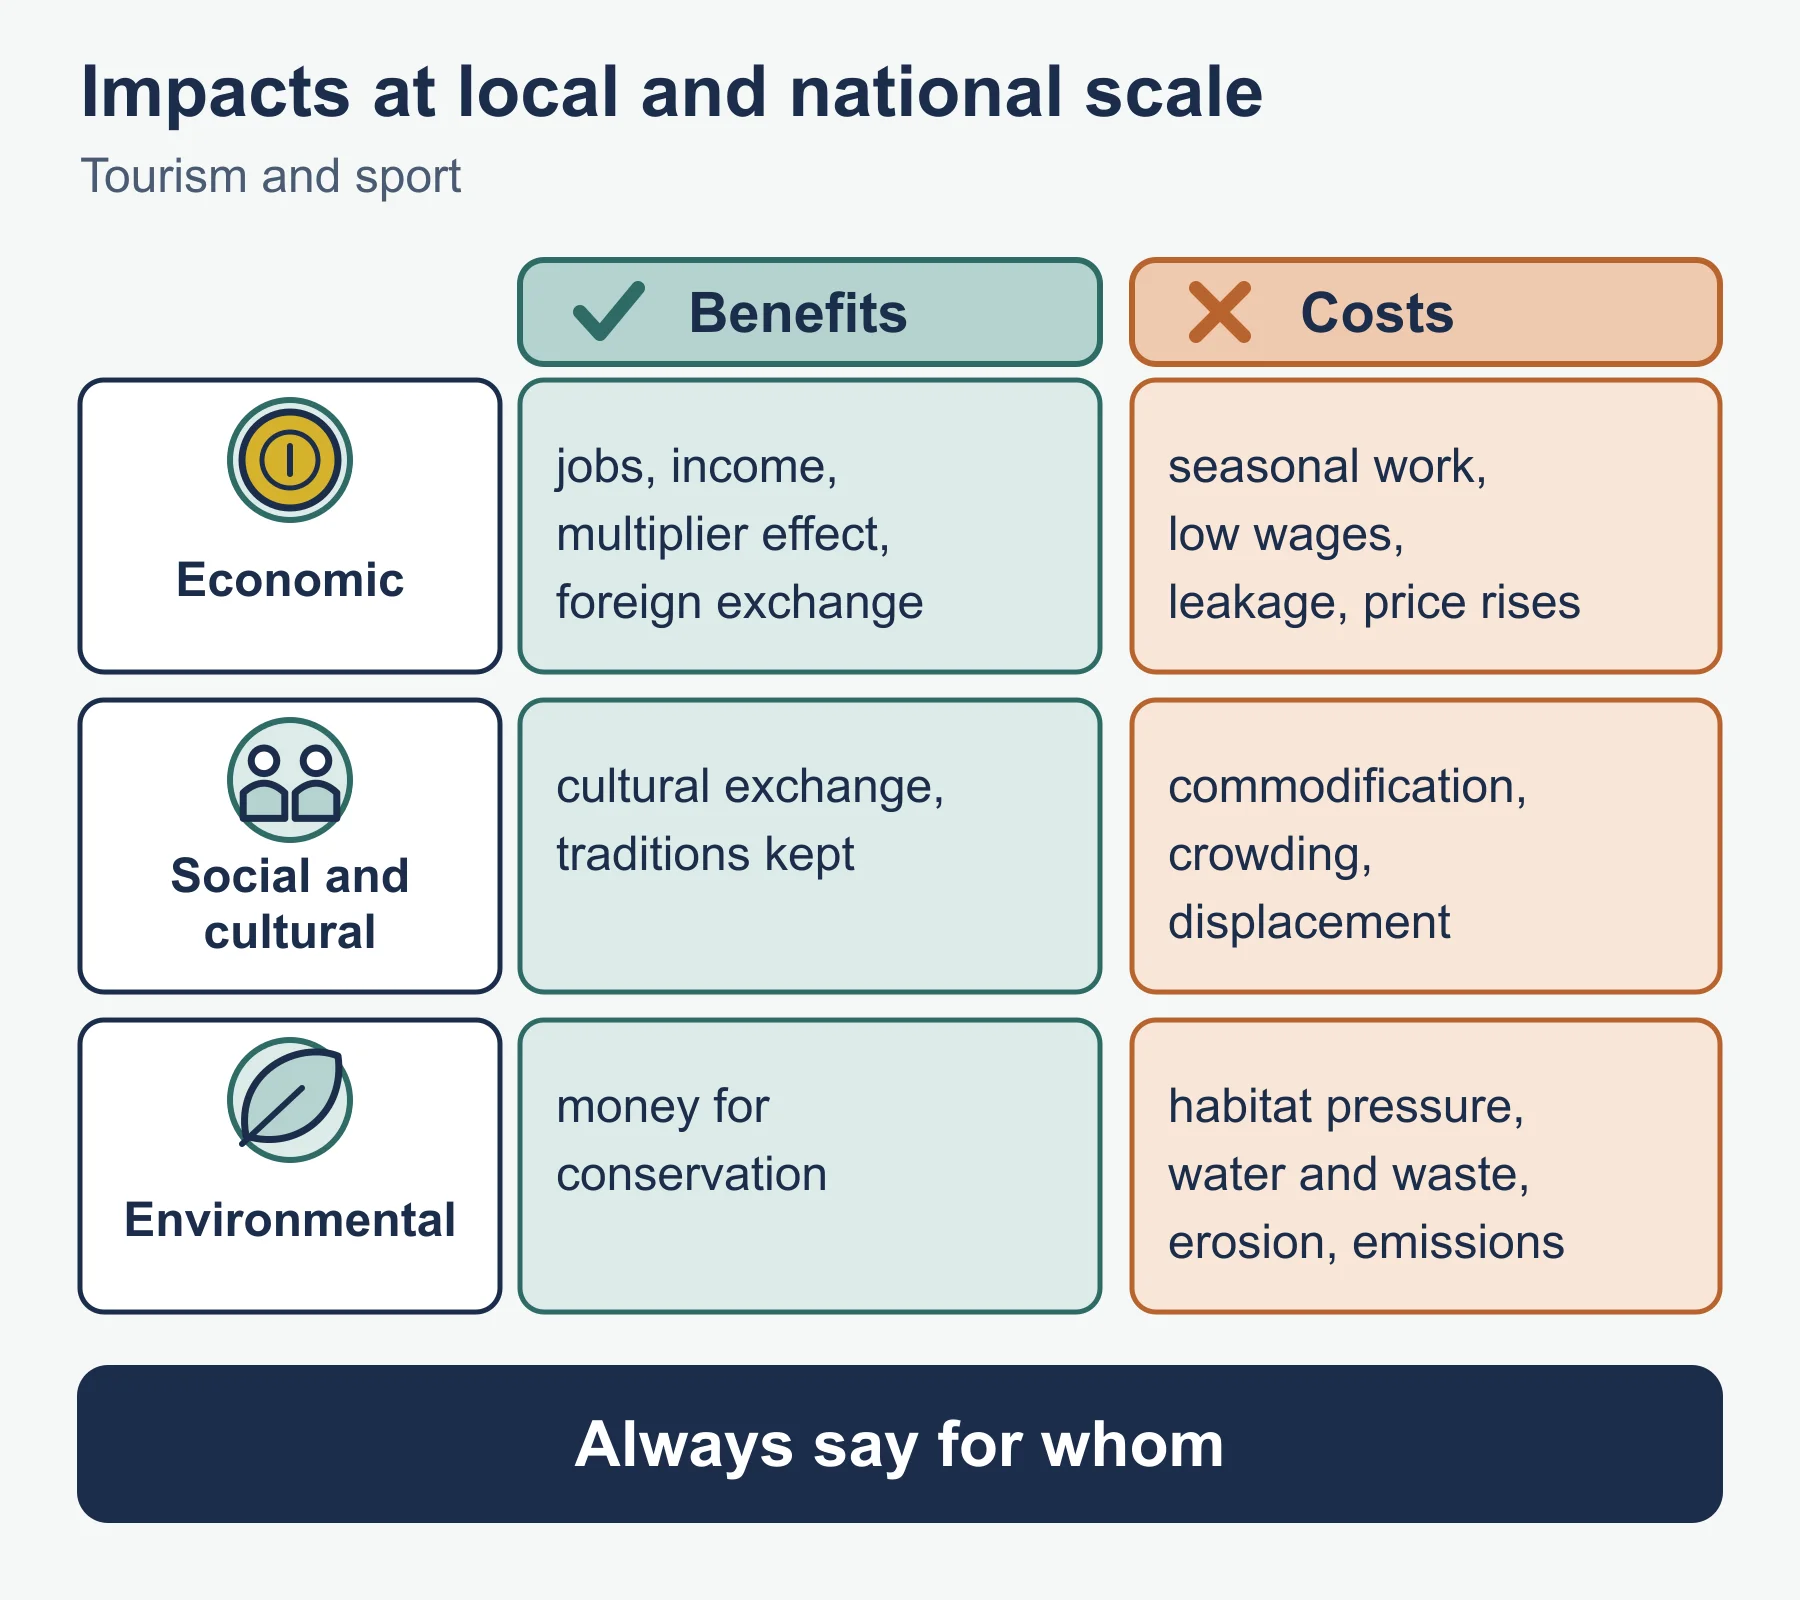
Impacts of tourism and sport at local and national scales can be sorted into:
- Economic: employment, income, multiplier effects, foreign exchange, but also seasonal work, low wages, leakage of profits and price inflation.
- Social and cultural: cultural exchange and preservation of traditions, but commodification, crowding and displacement.
- Environmental: funding for conservation, but pressure on habitats, water, waste, erosion and carbon emissions.
Sport operates at similar scales. Local clubs support health and community, while national stadiums and events promote identity and regeneration. Large sporting events can bring investment and infrastructure, though they may leave costly facilities that are underused. Evaluate legacy: who benefits, and for how long?
5.3 Tourism and sport at the international scale
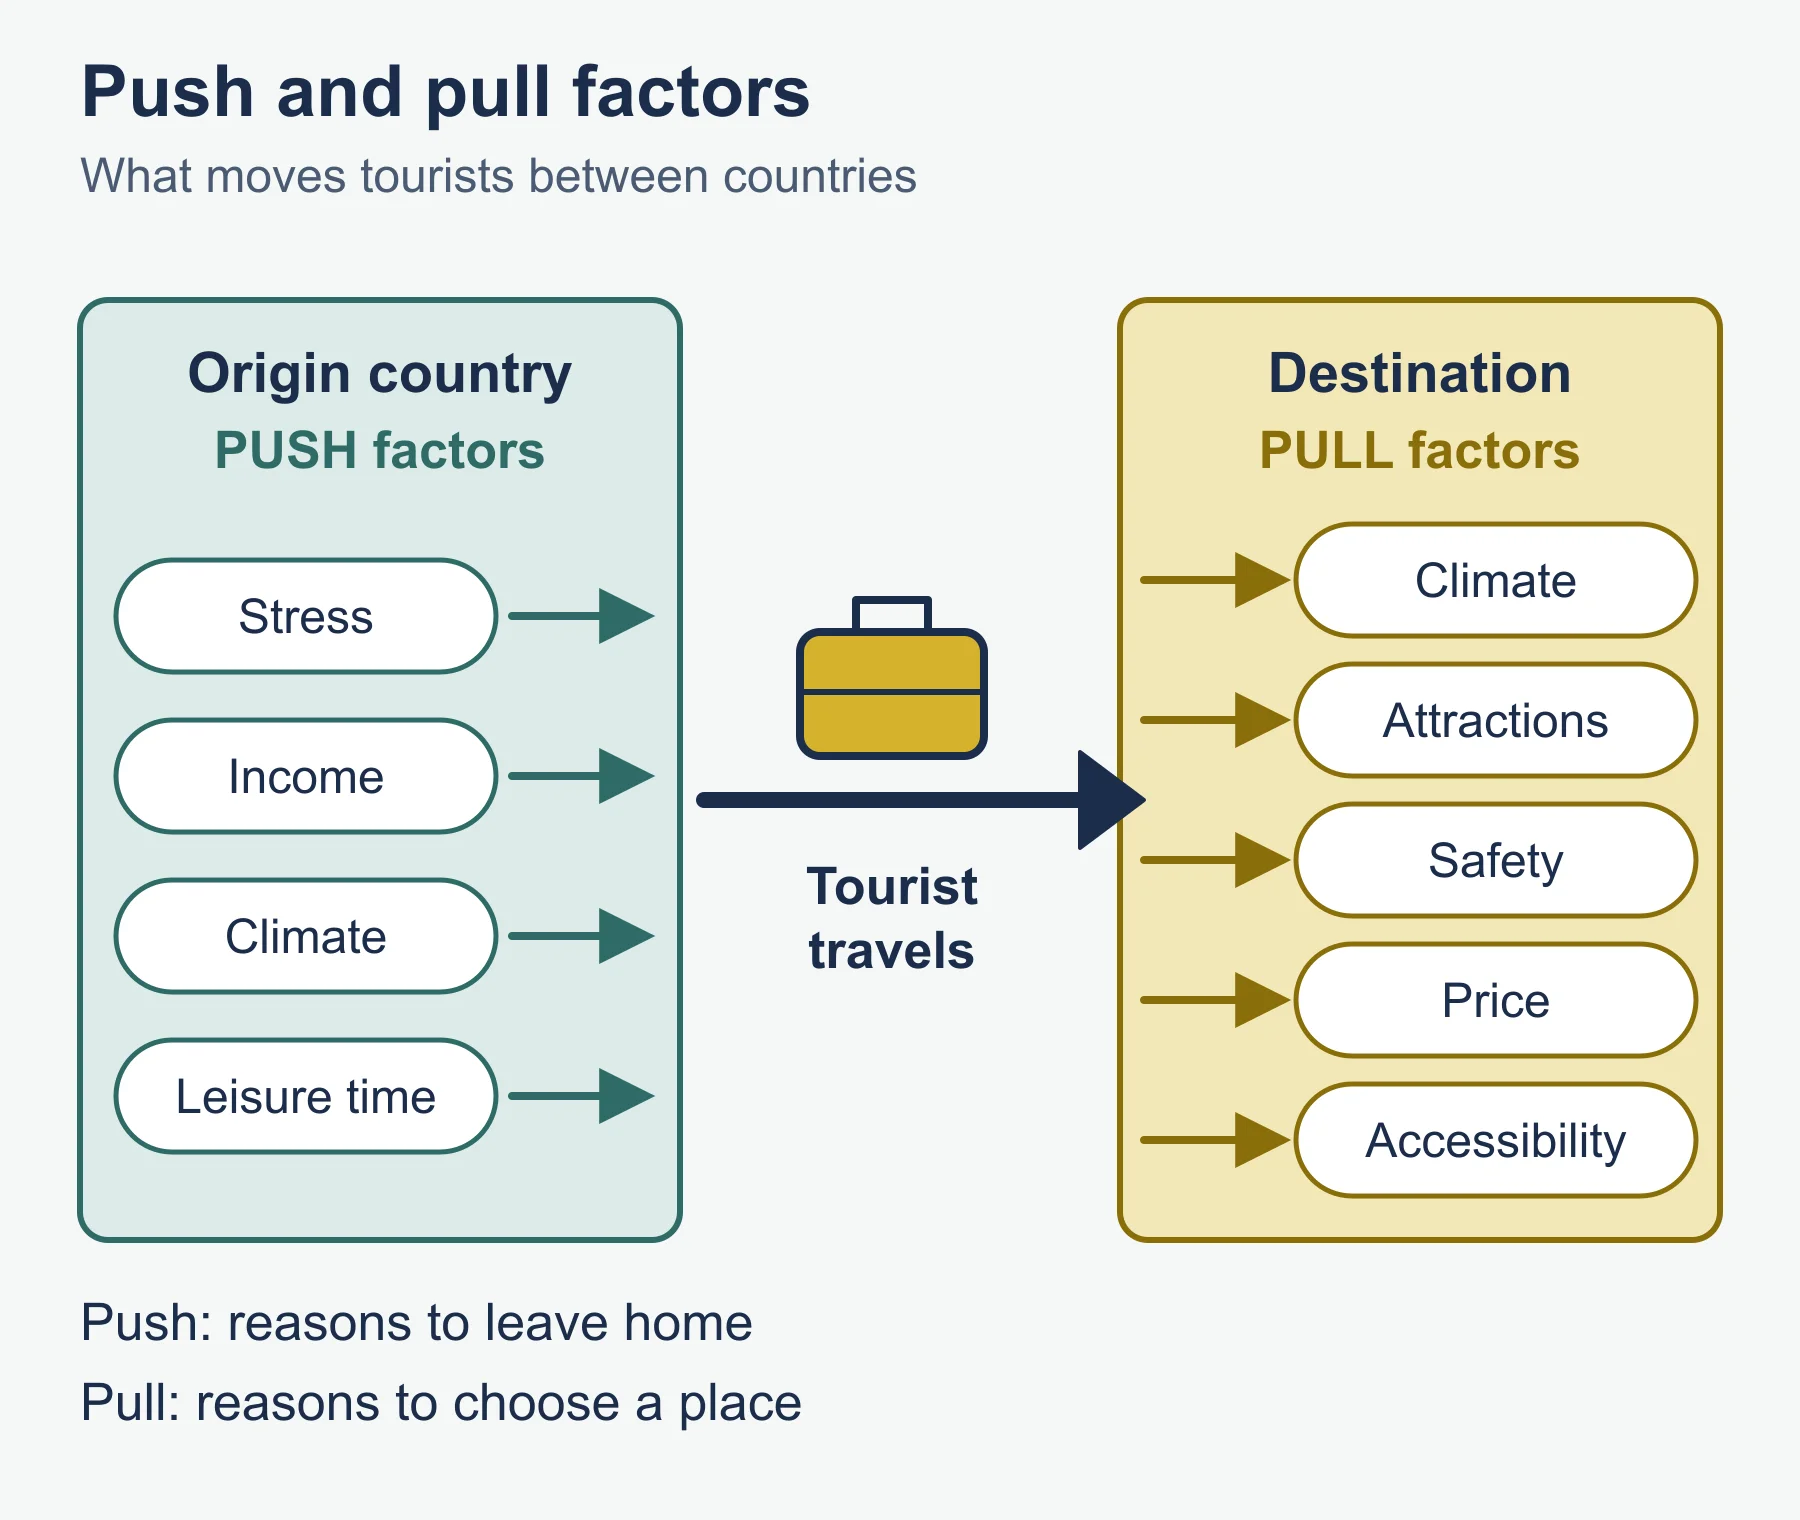
Global tourism has grown for decades, interrupted by shocks such as health crises, conflict and economic downturns. Drivers include falling real transport costs, rising incomes, visa liberalisation, digital platforms and the spread of low-cost airlines. Flows are shaped by push factors in origin countries (stress, income, climate, leisure time) and pull factors in destinations (climate, attractions, safety, price, accessibility).
Transnational corporations are important in hotels, airlines, cruise and online booking, and global sport involves federations, broadcasters, sponsors and clubs. Mega-events such as world championships and Games are bid for by cities and countries for visibility and development, but critics point to cost overruns, displacement of residents and uneven benefits. Sports migration, transfer markets and media coverage show globalisation in action.
Tourism links to inequality and development. It can be a route to income for developing economies, but leakage can mean that a large share of spending leaves the destination, particularly with all-inclusive packages owned by foreign firms. Tourism is also exposed to risk: hazards, political instability and climate change. Environmental concern includes aviation emissions and pressure on fragile places such as coral reefs and polar regions.
5.4 Managing tourism and sport for the future
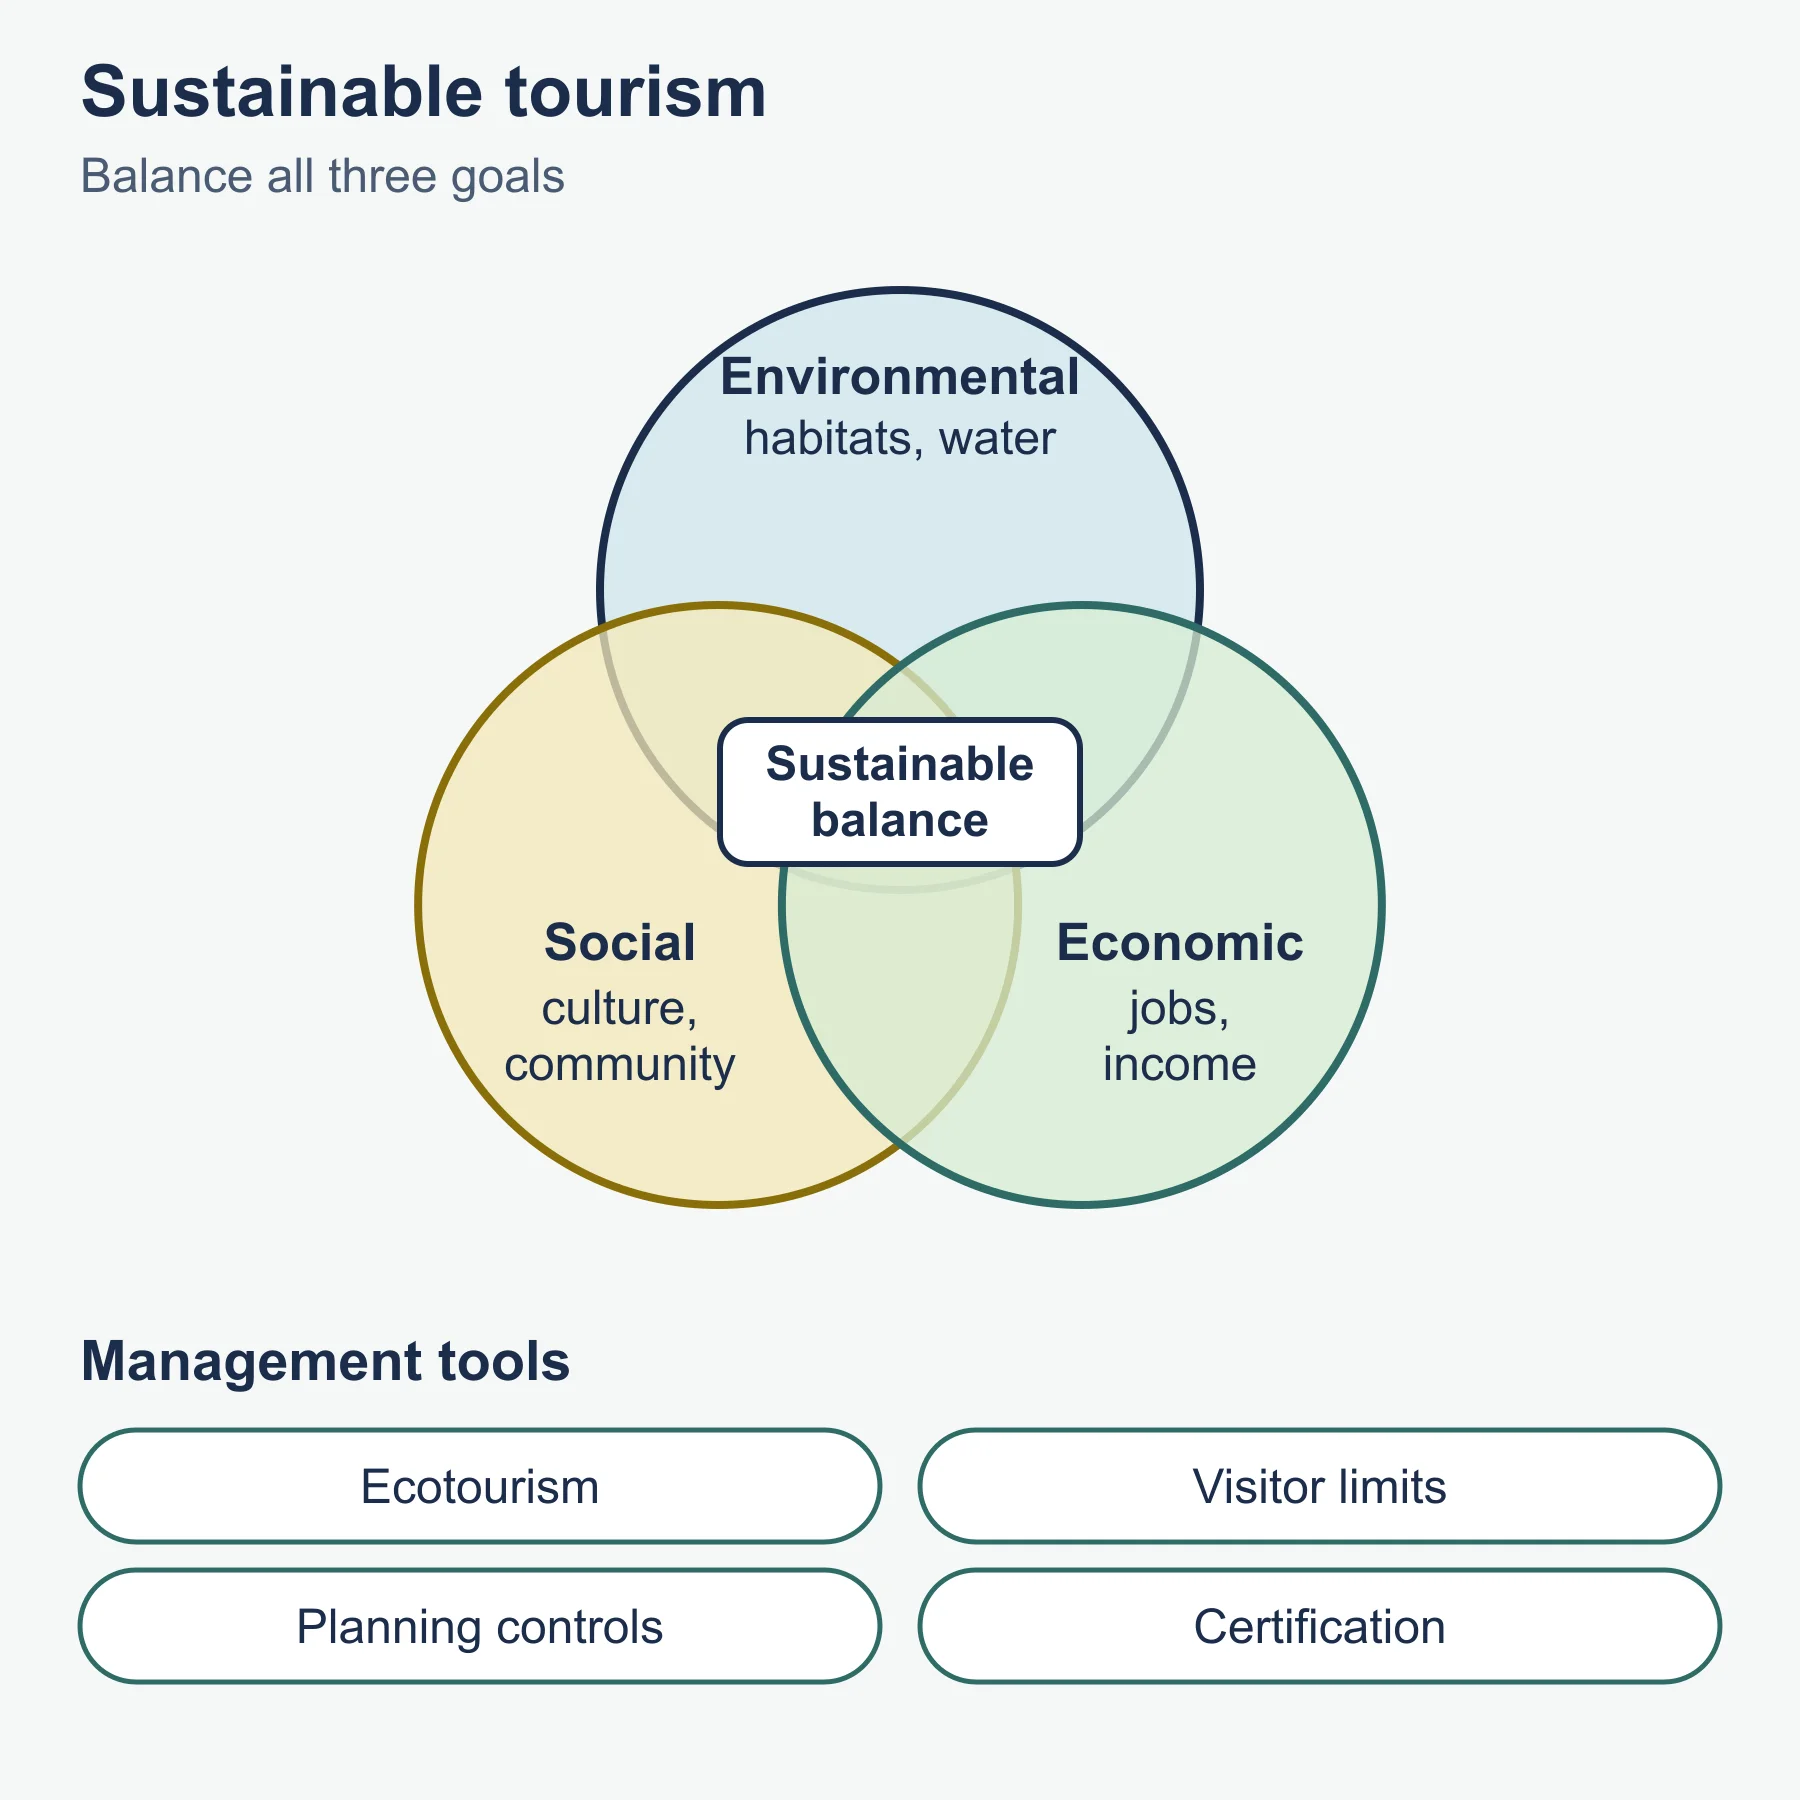
The core concept is sustainability: meeting present needs without compromising the ability of future generations. Sustainable tourism seeks balance among economic, social and environmental goals. Approaches include:
- Ecotourism and community-based tourism that keep income local and protect nature.
- Visitor management: zoning, quotas, pricing, timed entry and education.
- Planning controls on development and carrying capacity assessments.
- Certification schemes, codes of conduct and responsible operator standards.
- For sport, sustainable event design, reuse of existing venues and planned legacy.
Stakeholders include tourists, residents, businesses, governments, conservation bodies and international organisations. They disagree: businesses may want growth while residents want less crowding. Evaluate with criteria such as who benefits, long-term viability and enforcement. Think about future scenarios, including technology, changing travel habits, climate impacts on destinations such as ski resorts and beaches, and the effect of overtourism.
Worked examples
Example 1: tourist spending and leakage
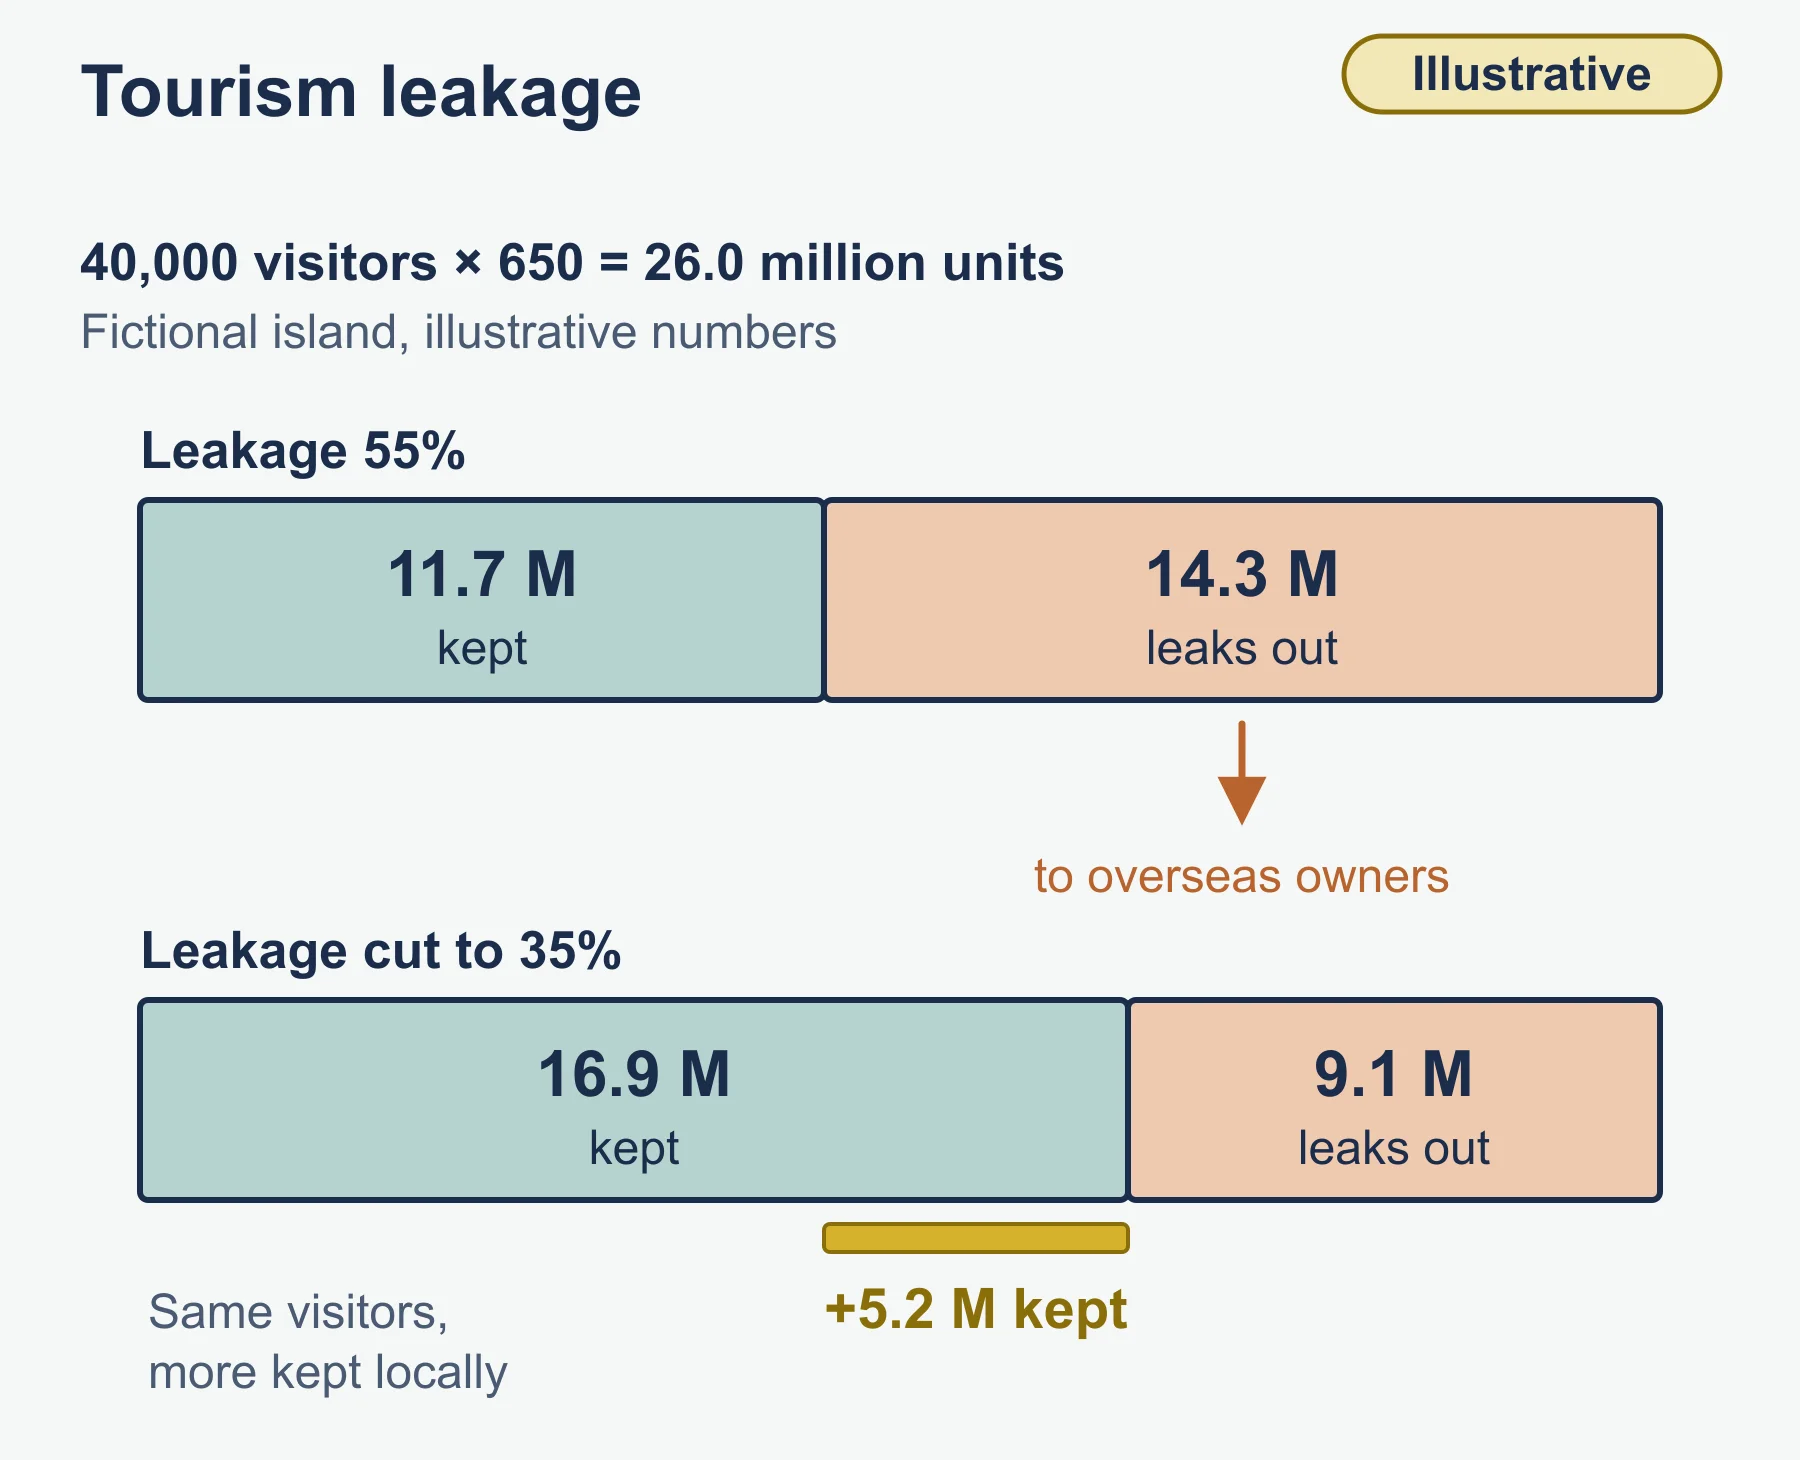
A fictional island receives 40,000 stay-over visitors in a year, each spending on average 650 currency units.
- Total spending = 40,000 x 650 = 26,000,000.
- If leakage is 55 per cent, the share retained locally is 45 per cent.
- Retained income = 26,000,000 x 0.45 = 11,700,000.
Leakage is therefore 14,300,000. If the island promotes locally owned accommodation and food supply and cuts leakage to 35 per cent, retained income rises to 26,000,000 x 0.65 = 16,900,000, an increase of 5,200,000.
Example 2: percentage change in arrivals
Arrivals at a destination rise from 1.2 million to 1.5 million.
- Increase = 0.3 million.
- Percentage change = 0.3 / 1.2 x 100 = 25 per cent.
If the destination’s accommodation capacity is fixed, a 25 per cent increase in arrivals could push it toward its carrying capacity, one indicator that Butler’s consolidation or stagnation stage may approach.
Common mistakes
- Listing impacts as positive or negative without saying for whom.
- Using Butler’s model as fact; it is a generalisation with limits.
- Writing general holiday description rather than geography.
- Ignoring leakage when judging economic benefit.
- Treating sustainability as only environmental.
Exam technique
Command terms guide your depth. Outline gives a brief account, explain gives reasons, examine requires considering an argument or concept carefully, and evaluate asks for a reasoned judgement. For longer answers, define terms, apply a model with caution, use located examples and draw a conclusion about balance of benefits and costs. Quote any figures given in a resource.
Check your understanding
- Name two factors that have increased leisure time or opportunity. Answer: for example paid holidays and cheaper transport.
- List the stages of Butler’s model. Answer: exploration, involvement, development, consolidation, stagnation, then decline or rejuvenation.
- What is leakage? Answer: the share of tourist spending that leaves the destination, for example profits sent to overseas owners.
- Arrivals rise from 800,000 to 920,000. What is the percentage rise? Answer: 120,000 / 800,000 x 100 = 15 per cent.
- Give one economic and one environmental impact of a major sporting event. Answer: for example construction jobs and increased waste or emissions.
- Distinguish push from pull factors. Answer: push factors encourage people to leave home, pull factors attract them to a destination.
- Name two visitor management tools. Answer: for example quotas and zoning.
- Why is Doxey’s index useful? Answer: it shows how host attitudes may change as tourism grows.
Get free revision emails (optional)
Occasional emails with practice questions, worked explanations and links to free resources for the qualification and subjects you choose. No spam, and you can unsubscribe from any email. The free tools on this site never need an email.
Related resources
-
Study guides
IB DP Geography: Option B: Oceans and coastal margins – Study Guide
A study guide to the Oceans and coastal margins option in IB DP Geography: ocean circulation, coastal processes, coastal management and future ocean governance.
Geography · International Baccalaureate · IB
Read guide -
Study guides
IB DP Geography: Unit 4: Power, places and networks – Study Guide
Global power, networks and flows, and the human and physical influences on global interactions, taught for the Higher Level extension of IB Diploma Programme Geography.
Geography · International Baccalaureate · IB
Read guide -
Study guides
IB DP Geography: Option G: Urban environments – Study Guide
A study guide to the Urban environments option in IB DP Geography: variety of cities, changing urban systems, stresses and sustainable urban futures.
Geography · International Baccalaureate · IB
Read guide
Related articles
-
teaching
A Level tuition in Dubai: Cambridge or Pearson Edexcel International A Level?
Schools in Dubai and Abu Dhabi teach either Cambridge International AS & A Level or Pearson Edexcel International A Level. How the two are structured, why it matters for tuition, and how online classes from Lahore work.
9 October 2026
-
curriculum guides
Choosing subjects at IGCSE and A Level
How subject choices at 14 and 16 affect university options later, and how to keep pathways open without overloading a timetable.
28 July 2026
Studying this with a teacher
Working through Geography IB?
This page is free and stays free. Marlbridge is not offering Geography classes at the moment, so there is no tuition to book for it. The free study resources stay open to everyone.