
Study Guides
IB DP Geography: Option B: Oceans and coastal margins – Study Guide
A study guide to the Oceans and coastal margins option in IB DP Geography: ocean circulation, coastal processes, coastal management and future ocean governance.
- Subject
- Geography
- Level
- IB
- Topic
- Topic 2: Option B: Oceans and coastal margins
- Author
- Marlbridge Academic Team
- Updated
- Reviewed by
- Azam Siddique (what this means)
Aligned to International Baccalaureate IB Diploma Programme Geography (DP Geography), First assessments 2019. Official specification .
Syllabus page (what it covers and how it is assessed): IB Diploma Programme Geography.
Syllabus points this page covers
DP Geography
- 2.1 Ocean-atmosphere interactions
- 2.2 Interactions between oceans and coastal places
- 2.3 Managing coastal margins
- 2.4 Ocean management futures
This page covers all 4 subtopics recorded here in topic 2, Option B: Oceans and coastal margins.
Oceans and coastal margins is one of the teacher-selected options in the geographic themes section of IB Diploma Programme Geography. It covers how oceans and the atmosphere interact, how oceans shape coastal places, how coasts are managed and how the oceans might be governed in the future. Check with your teacher that your school teaches it. The IB DP Geography syllabus guide sets out how options fit with the core, and the Global Climate core guide is useful background for the climate links in this option.
Where this fits in the course
Options are examined in Paper 1, which rewards precise use of geographical terms and well-chosen examples. Expect stimulus material such as maps, graphs of sea surface temperature or photographs of coastlines. Try to link ideas across the four strands: an ocean-atmosphere event can change coastal processes, which in turn affect management decisions.
2.1 Ocean-atmosphere interactions
The oceans store and redistribute heat. Surface currents are driven by prevailing winds and deflected by the Earth’s rotation (the Coriolis effect), forming large circular gyres. Warm currents carry heat from low latitudes towards the poles, and cold currents move the other way, which is one reason places at similar latitudes can have different climates.
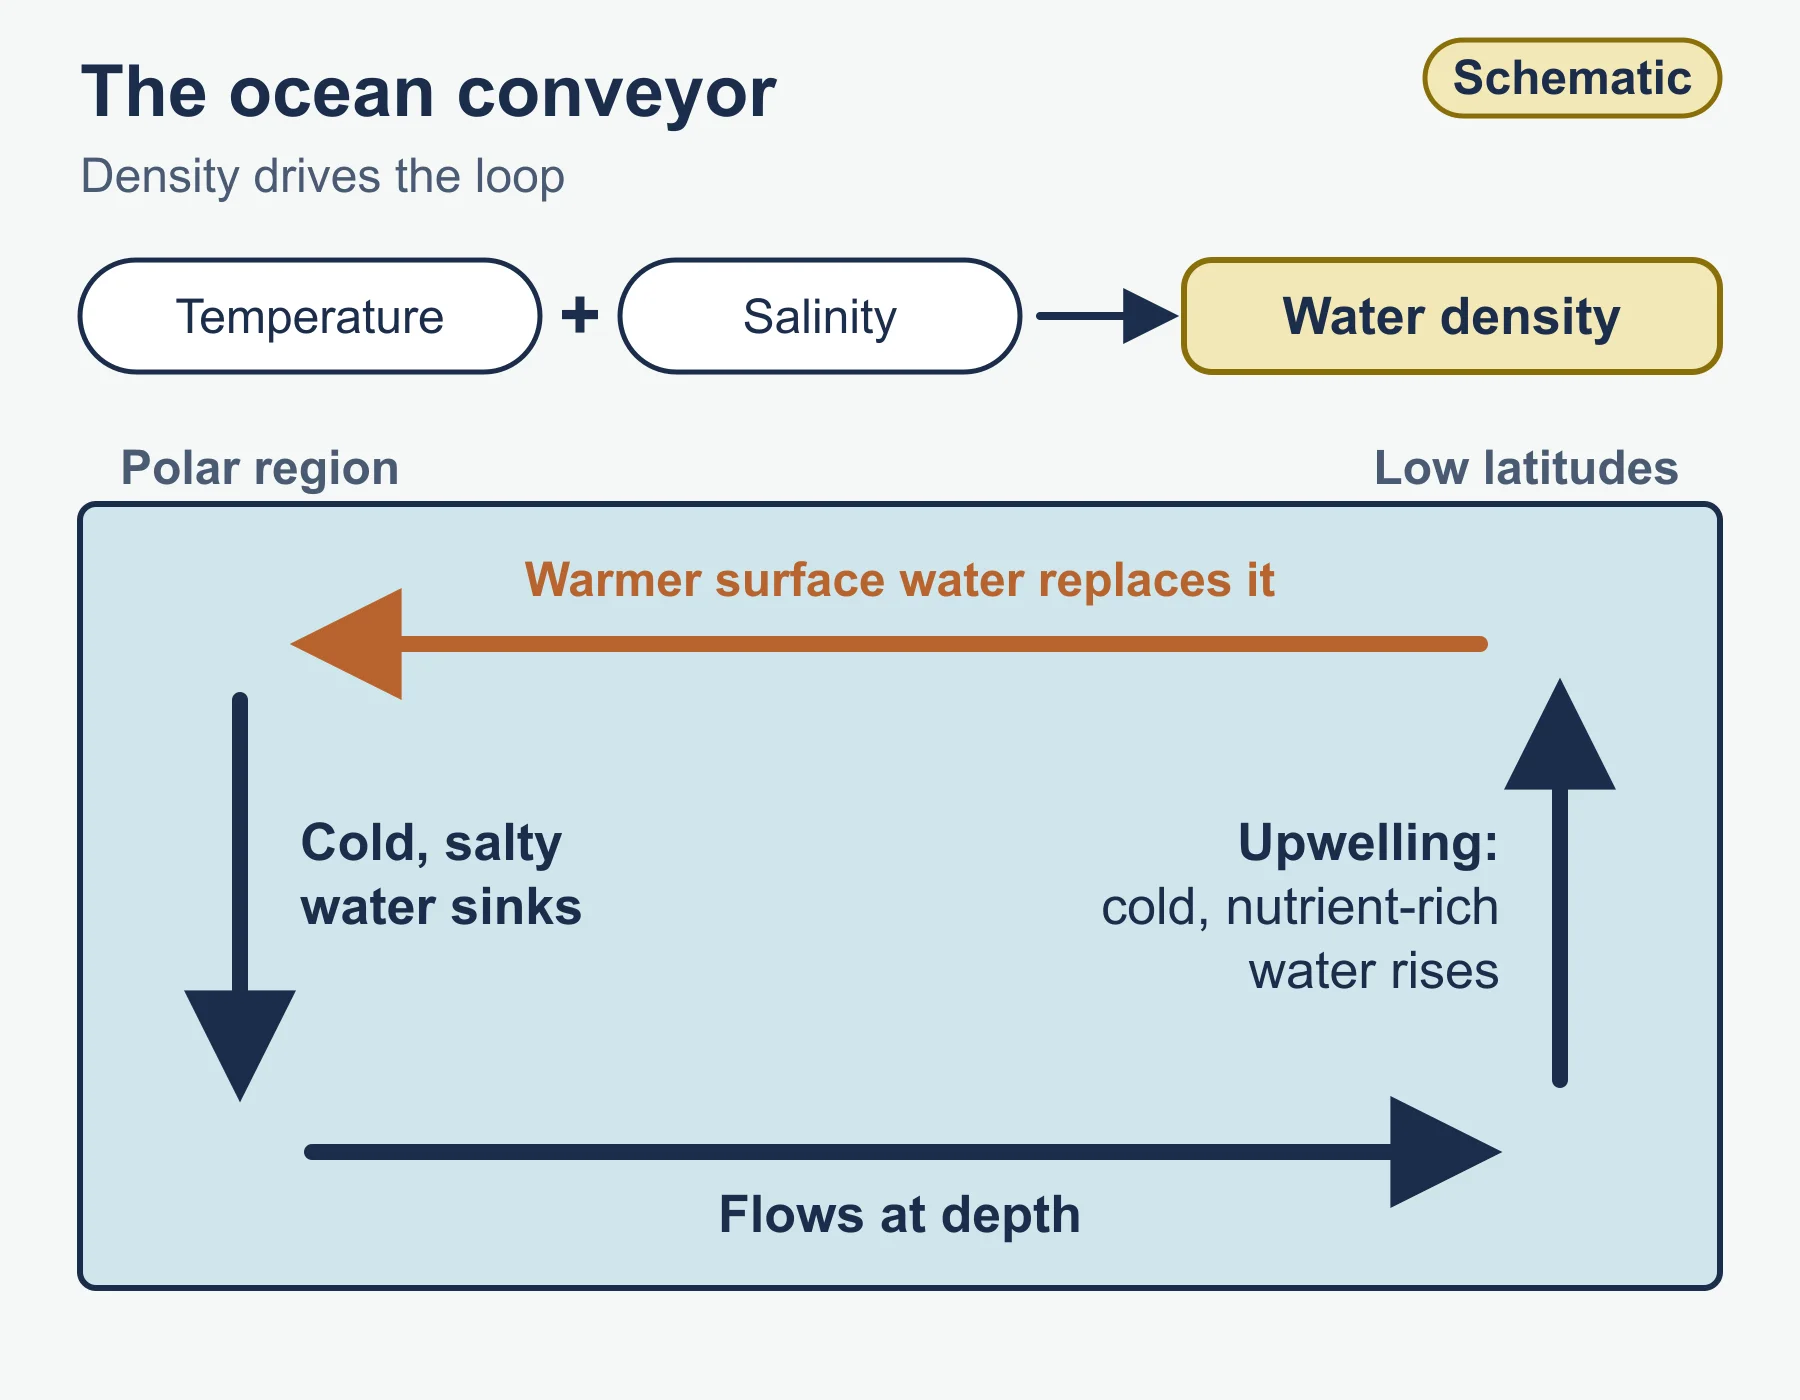
Beneath the surface, thermohaline circulation (sometimes called the global ocean conveyor) is driven by differences in water density, which depend on temperature and salinity. Cold, salty water sinks in polar regions and flows at depth, while warmer surface water moves to replace it. Upwelling brings cold, nutrient-rich water to the surface, supporting productive fisheries.
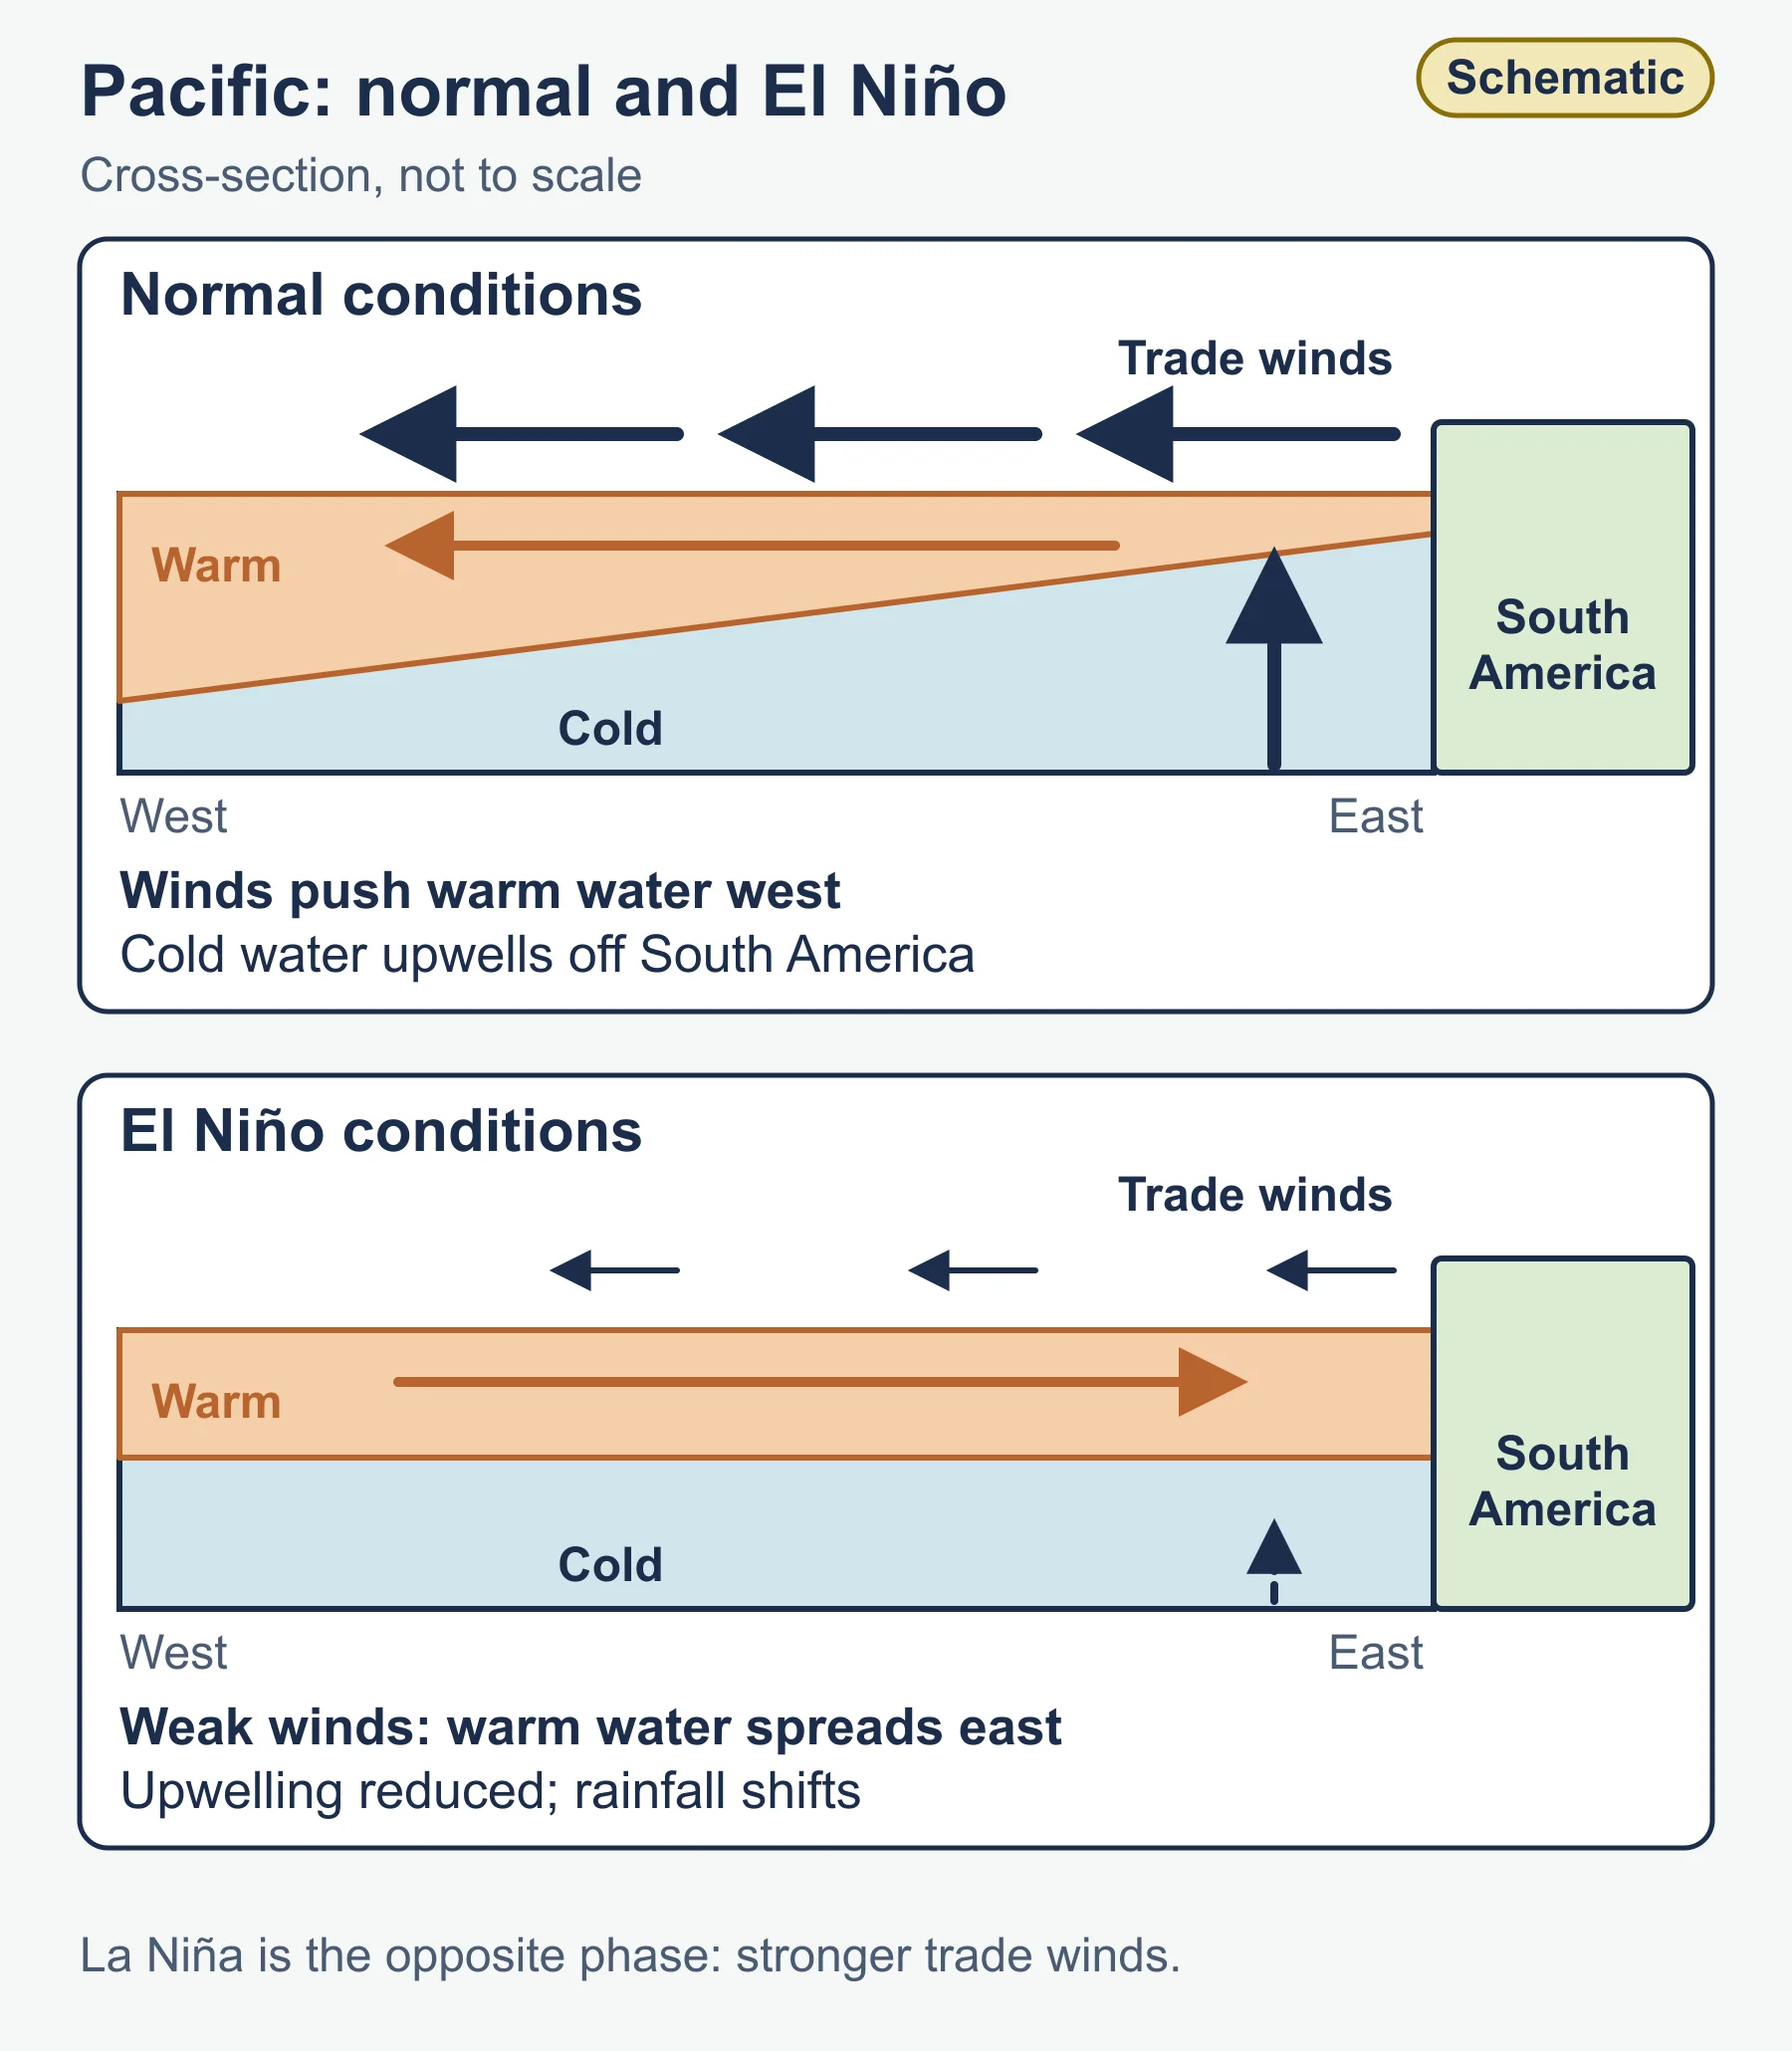
The El Nino-Southern Oscillation (ENSO) is a key example of ocean-atmosphere coupling in the Pacific. In normal conditions, trade winds push warm surface water west and cold water upwells off South America. During El Nino, the trade winds weaken, warm water spreads east, upwelling is reduced and rainfall patterns shift, bringing drought to some regions and floods to others. La Nina is the opposite phase, with stronger trade winds. Make sure you can describe the pattern, explain the cause and discuss consequences for people and ecosystems.
Oceans also absorb carbon dioxide, causing ocean acidification, and absorb most of the extra heat from global warming, which causes thermal expansion and contributes to sea level rise alongside melting land ice. Warm sea surface temperatures also fuel tropical cyclones.
2.2 Interactions between oceans and coastal places
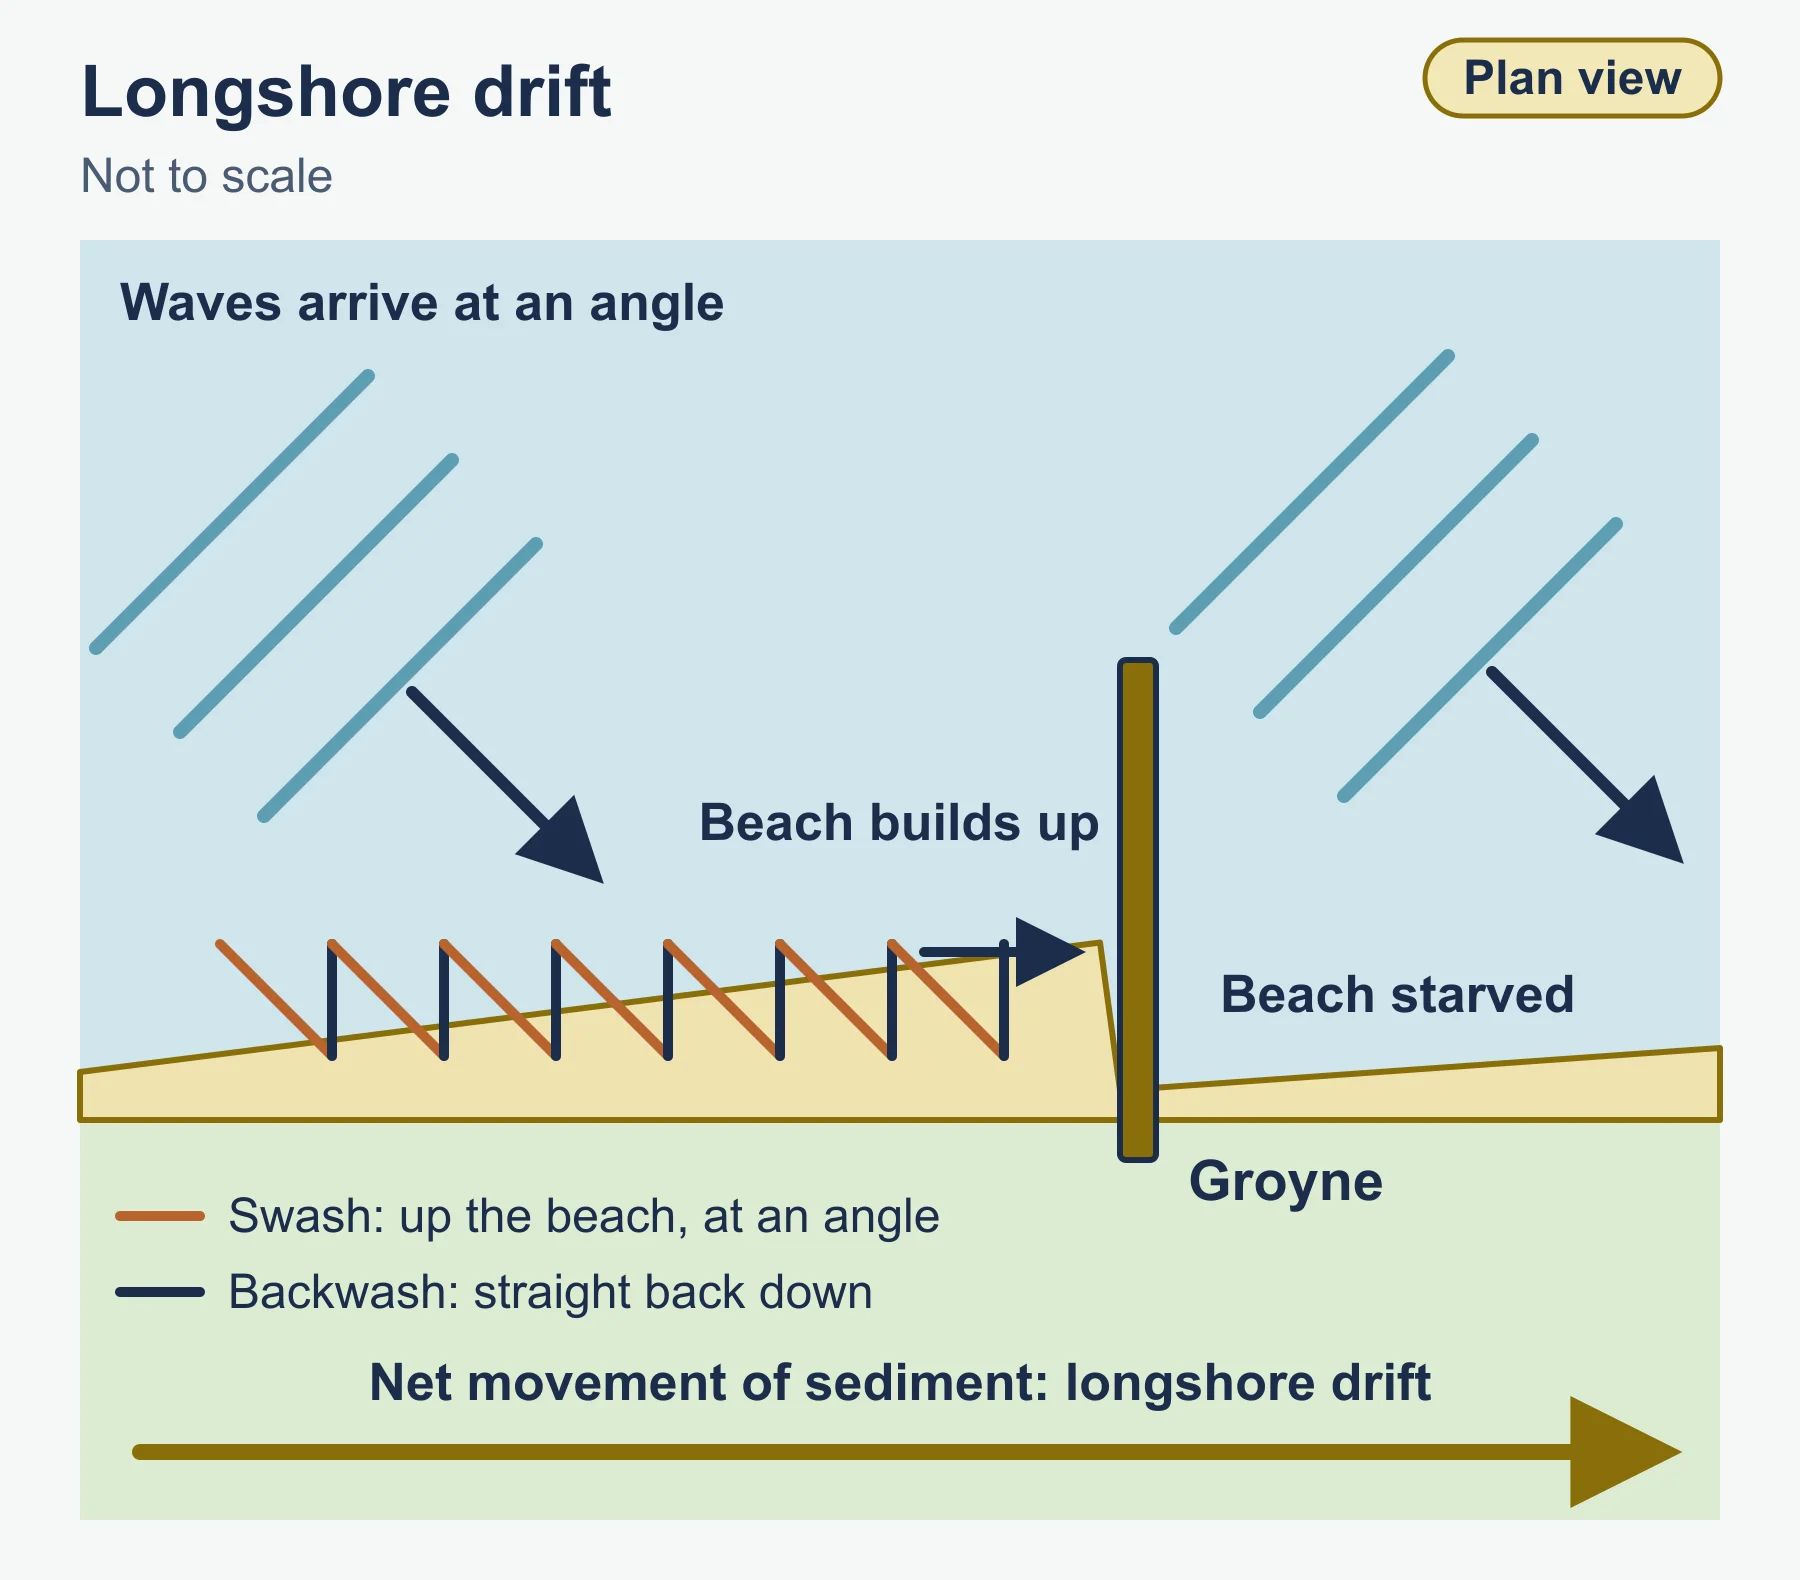
Coasts are shaped by waves, tides, currents, geology, sea level and human activity. Waves erode by hydraulic action, abrasion, attrition and corrosion. Constructive waves tend to build beaches, while destructive waves remove sediment. Longshore drift moves sediment along the coast in the direction of the prevailing wave approach.
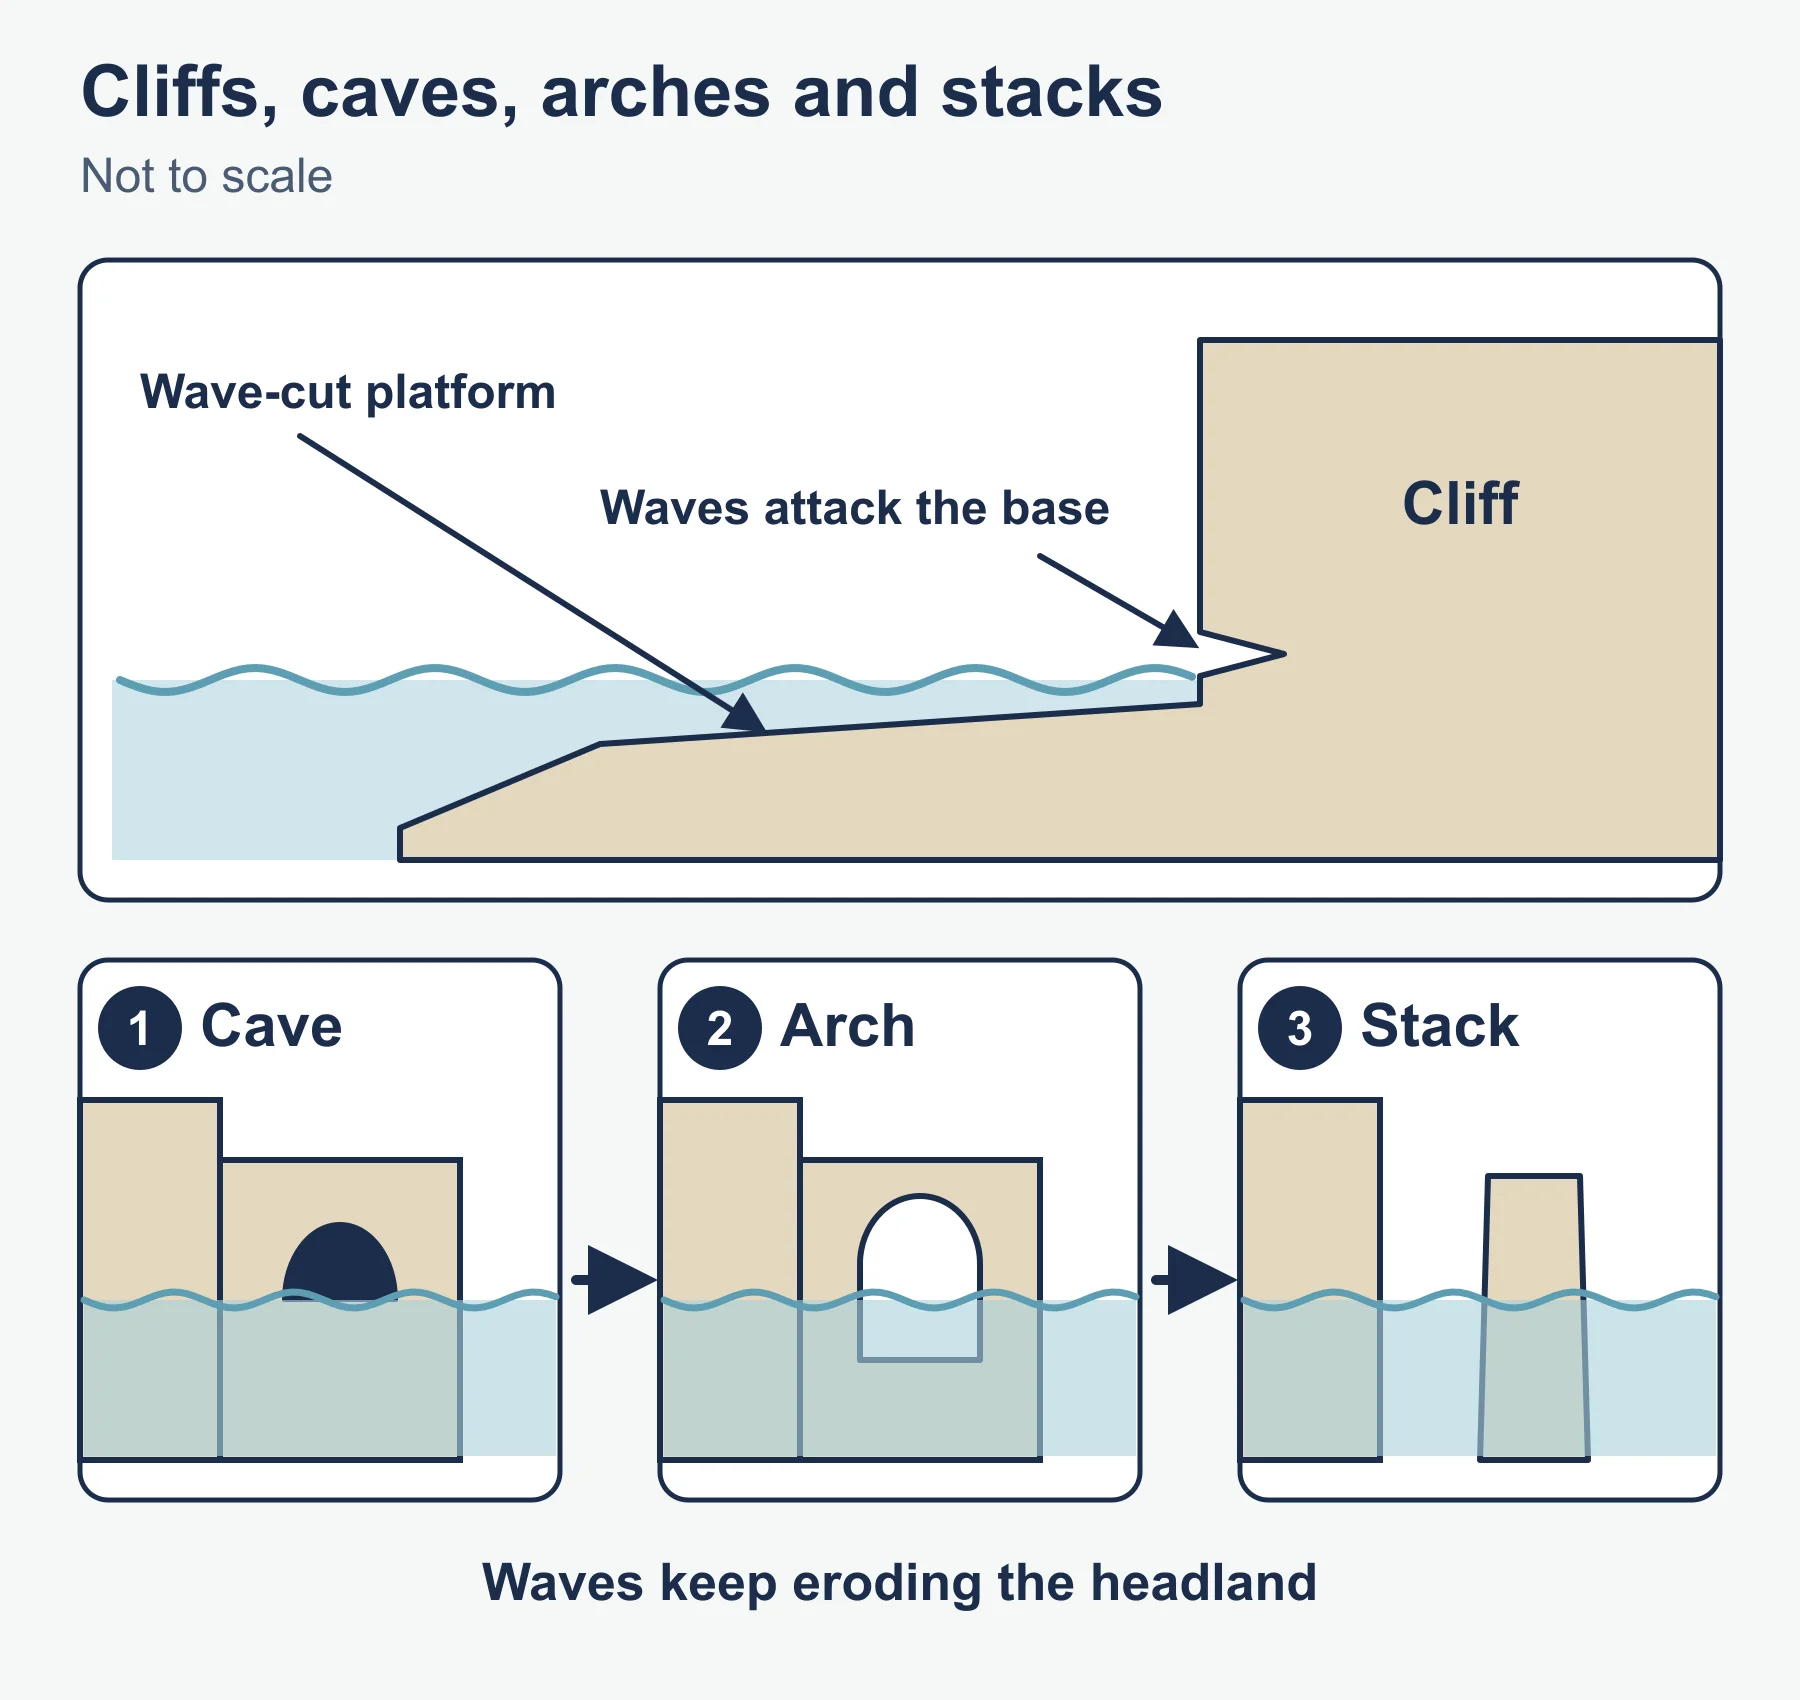
Landforms of erosion include cliffs, wave-cut platforms, caves, arches and stacks, while deposition produces beaches, spits, bars and tombolos. The concept of the sediment cell helps explain coastal systems: sediment inputs, transfers, stores and outputs within a stretch of coast, treated as a system. Interrupting sediment flow in one place, for example with a groyne or harbour wall, can starve beaches downdrift.
Sea level change matters at several scales. Eustatic changes alter the global volume of water, while isostatic changes involve land rising or sinking. Present-day relative sea level rise reflects both. Low-lying deltas, atolls and reef islands are especially exposed.
Coastal ecosystems such as coral reefs, mangroves and salt marshes provide natural protection by dissipating wave energy, support fisheries and store carbon. They are threatened by warming, acidification, pollution, coastal development and destructive fishing. Be ready to explain why a healthy reef or mangrove forest reduces coastal risk and why losing it raises vulnerability.
2.3 Managing coastal margins
Management responses include:
- Hard engineering: sea walls, rock armour, revetments, groynes and breakwaters. They protect specific assets but are expensive, can alter sediment movement and may create a false sense of security.
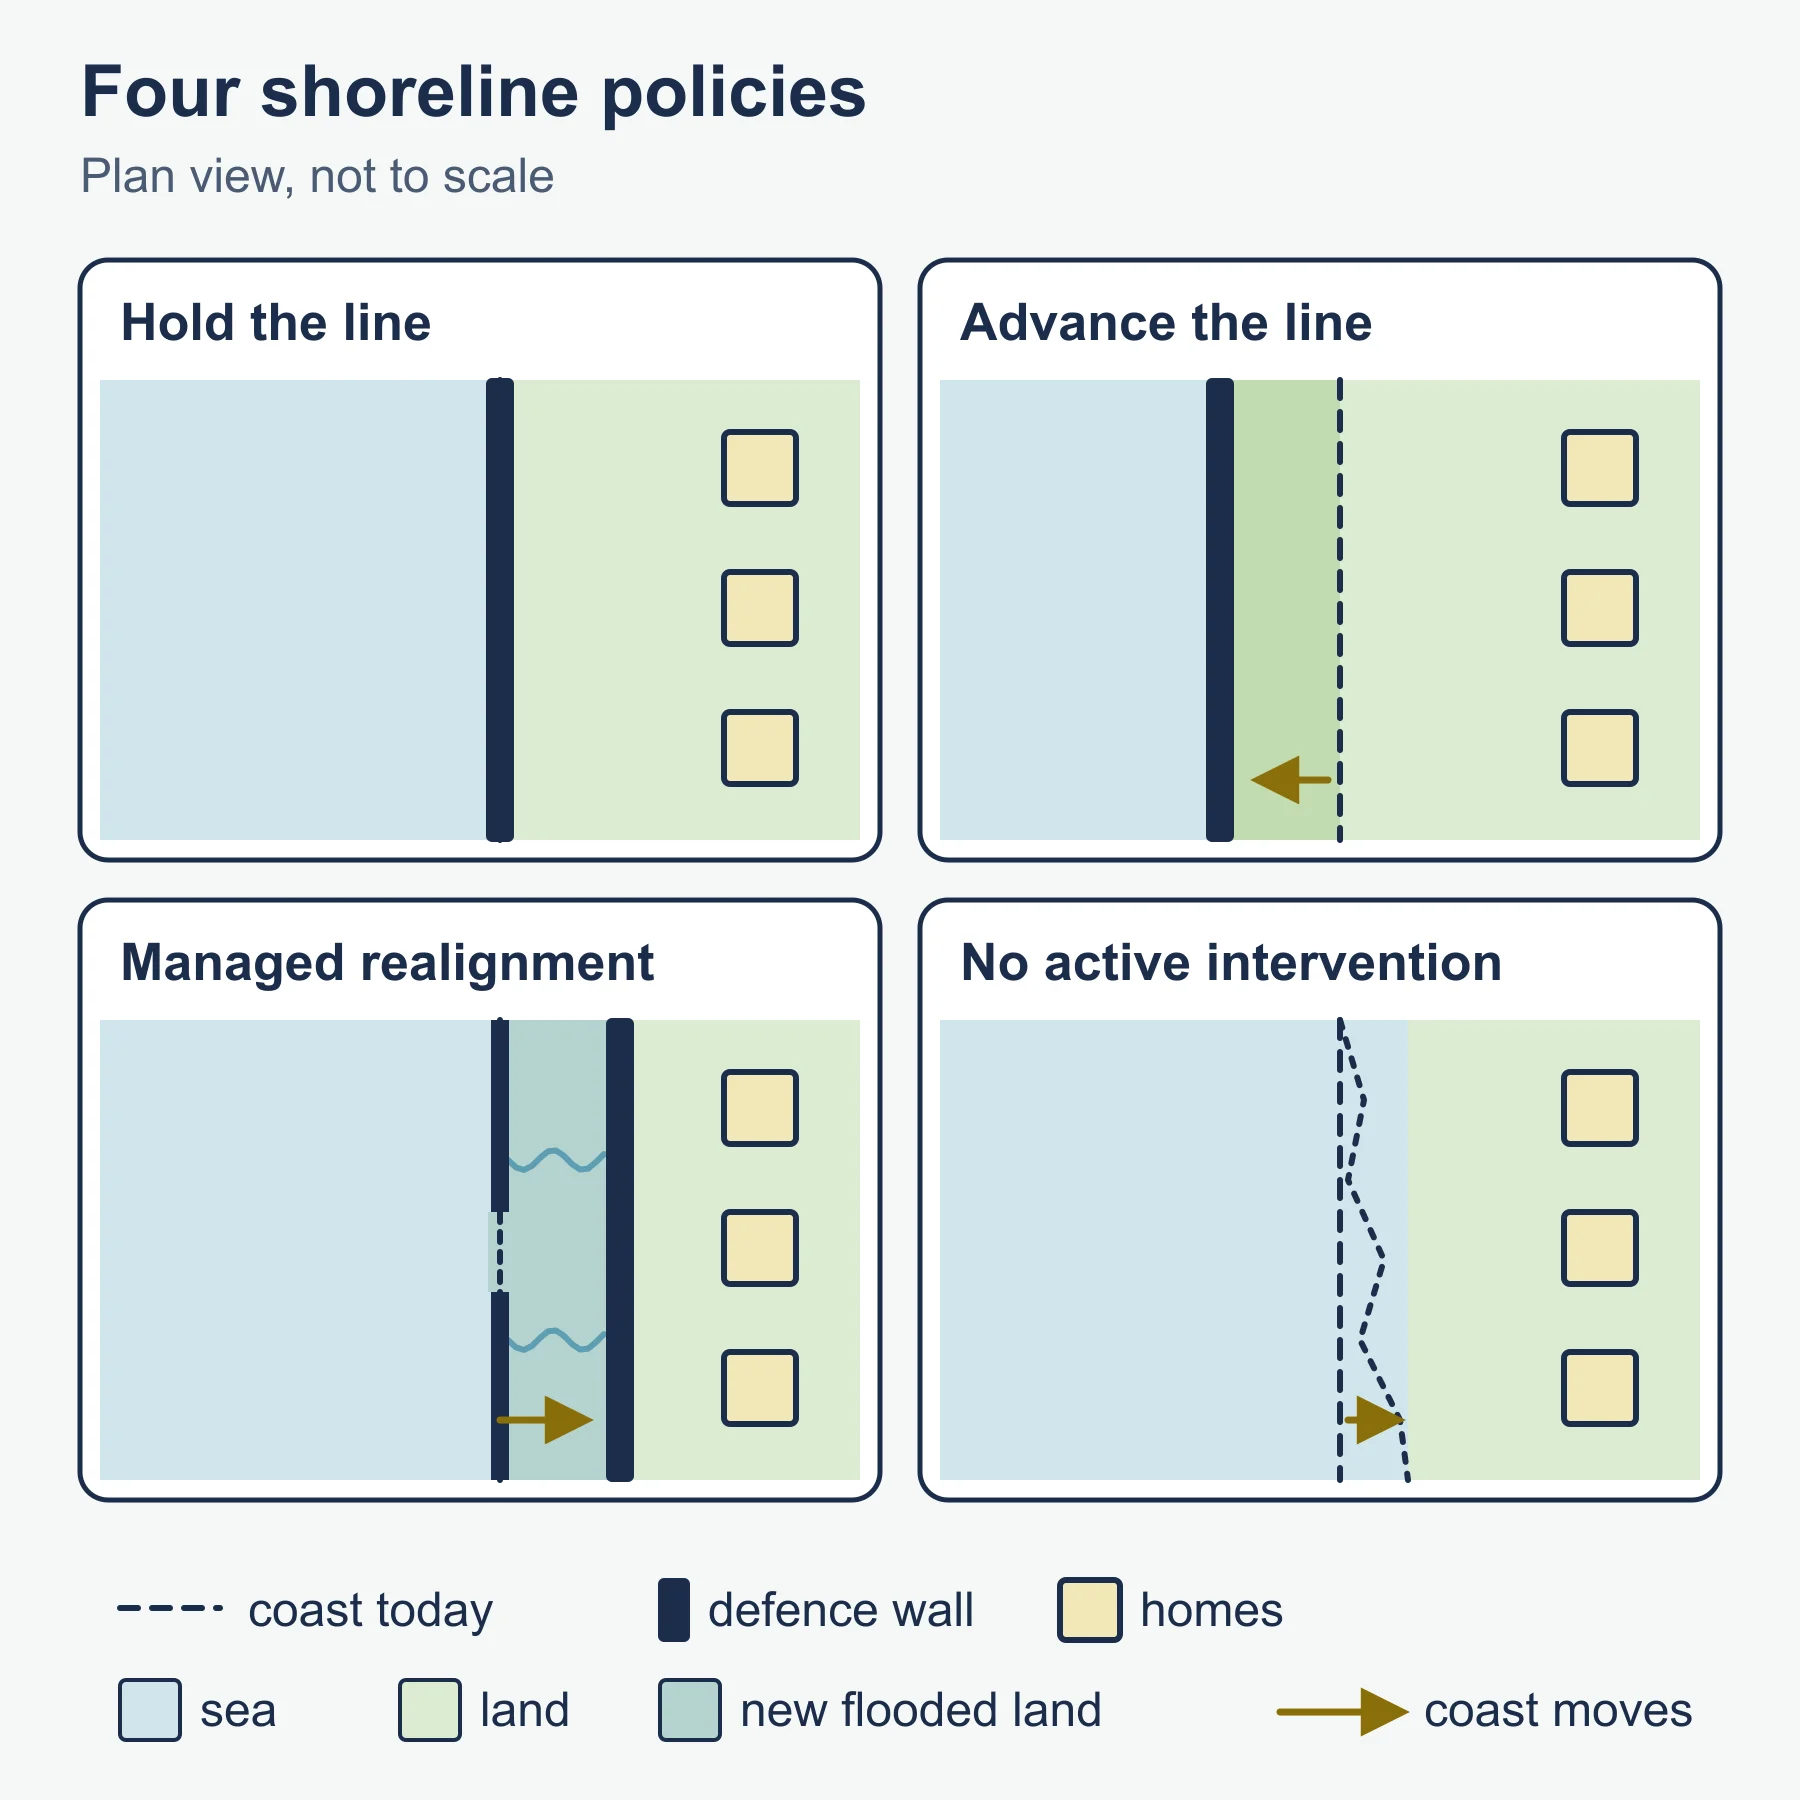
- Soft engineering: beach nourishment, dune stabilisation and managed realignment, in which defences are deliberately breached so land can flood and form natural buffers.
- Planning approaches: shoreline management plans with policy options such as hold the line, advance the line, managed realignment and no active intervention. Integrated coastal zone management brings together stakeholders and treats land and sea as one system.
Stakeholders include residents, local councils, national agencies, developers, businesses, conservation groups and insurers. Their interests conflict: a homeowner may want a wall, while a conservation group may favour a restored marsh. Cost-benefit analysis is commonly used to decide where to defend, comparing the value of assets protected against the cost of defence. It is useful but cannot easily value habitats, heritage or community ties, which is a point worth making in evaluative answers.
2.4 Ocean management futures
Looking ahead, the key themes are governance, sustainable use and uncertainty. Oceans lie largely beyond single national control, so international frameworks matter. The United Nations Convention on the Law of the Sea sets out rules including exclusive economic zones, and marine protected areas are used to conserve habitats. Pressures include overfishing, marine plastic, oil and chemical pollution, shipping, offshore energy, deep-sea mining and tourism.
Evaluate approaches by asking whether they are enforceable, fair to developing states and effective across borders. Fish quotas, certification schemes, plastic reduction agreements and ecosystem-based management all have strengths and weaknesses. Because climate change will alter currents, ecosystems and sea level, adaptive management that can change as evidence improves is often presented as more resilient than fixed plans.
Worked examples
Example 1: cliff retreat rates
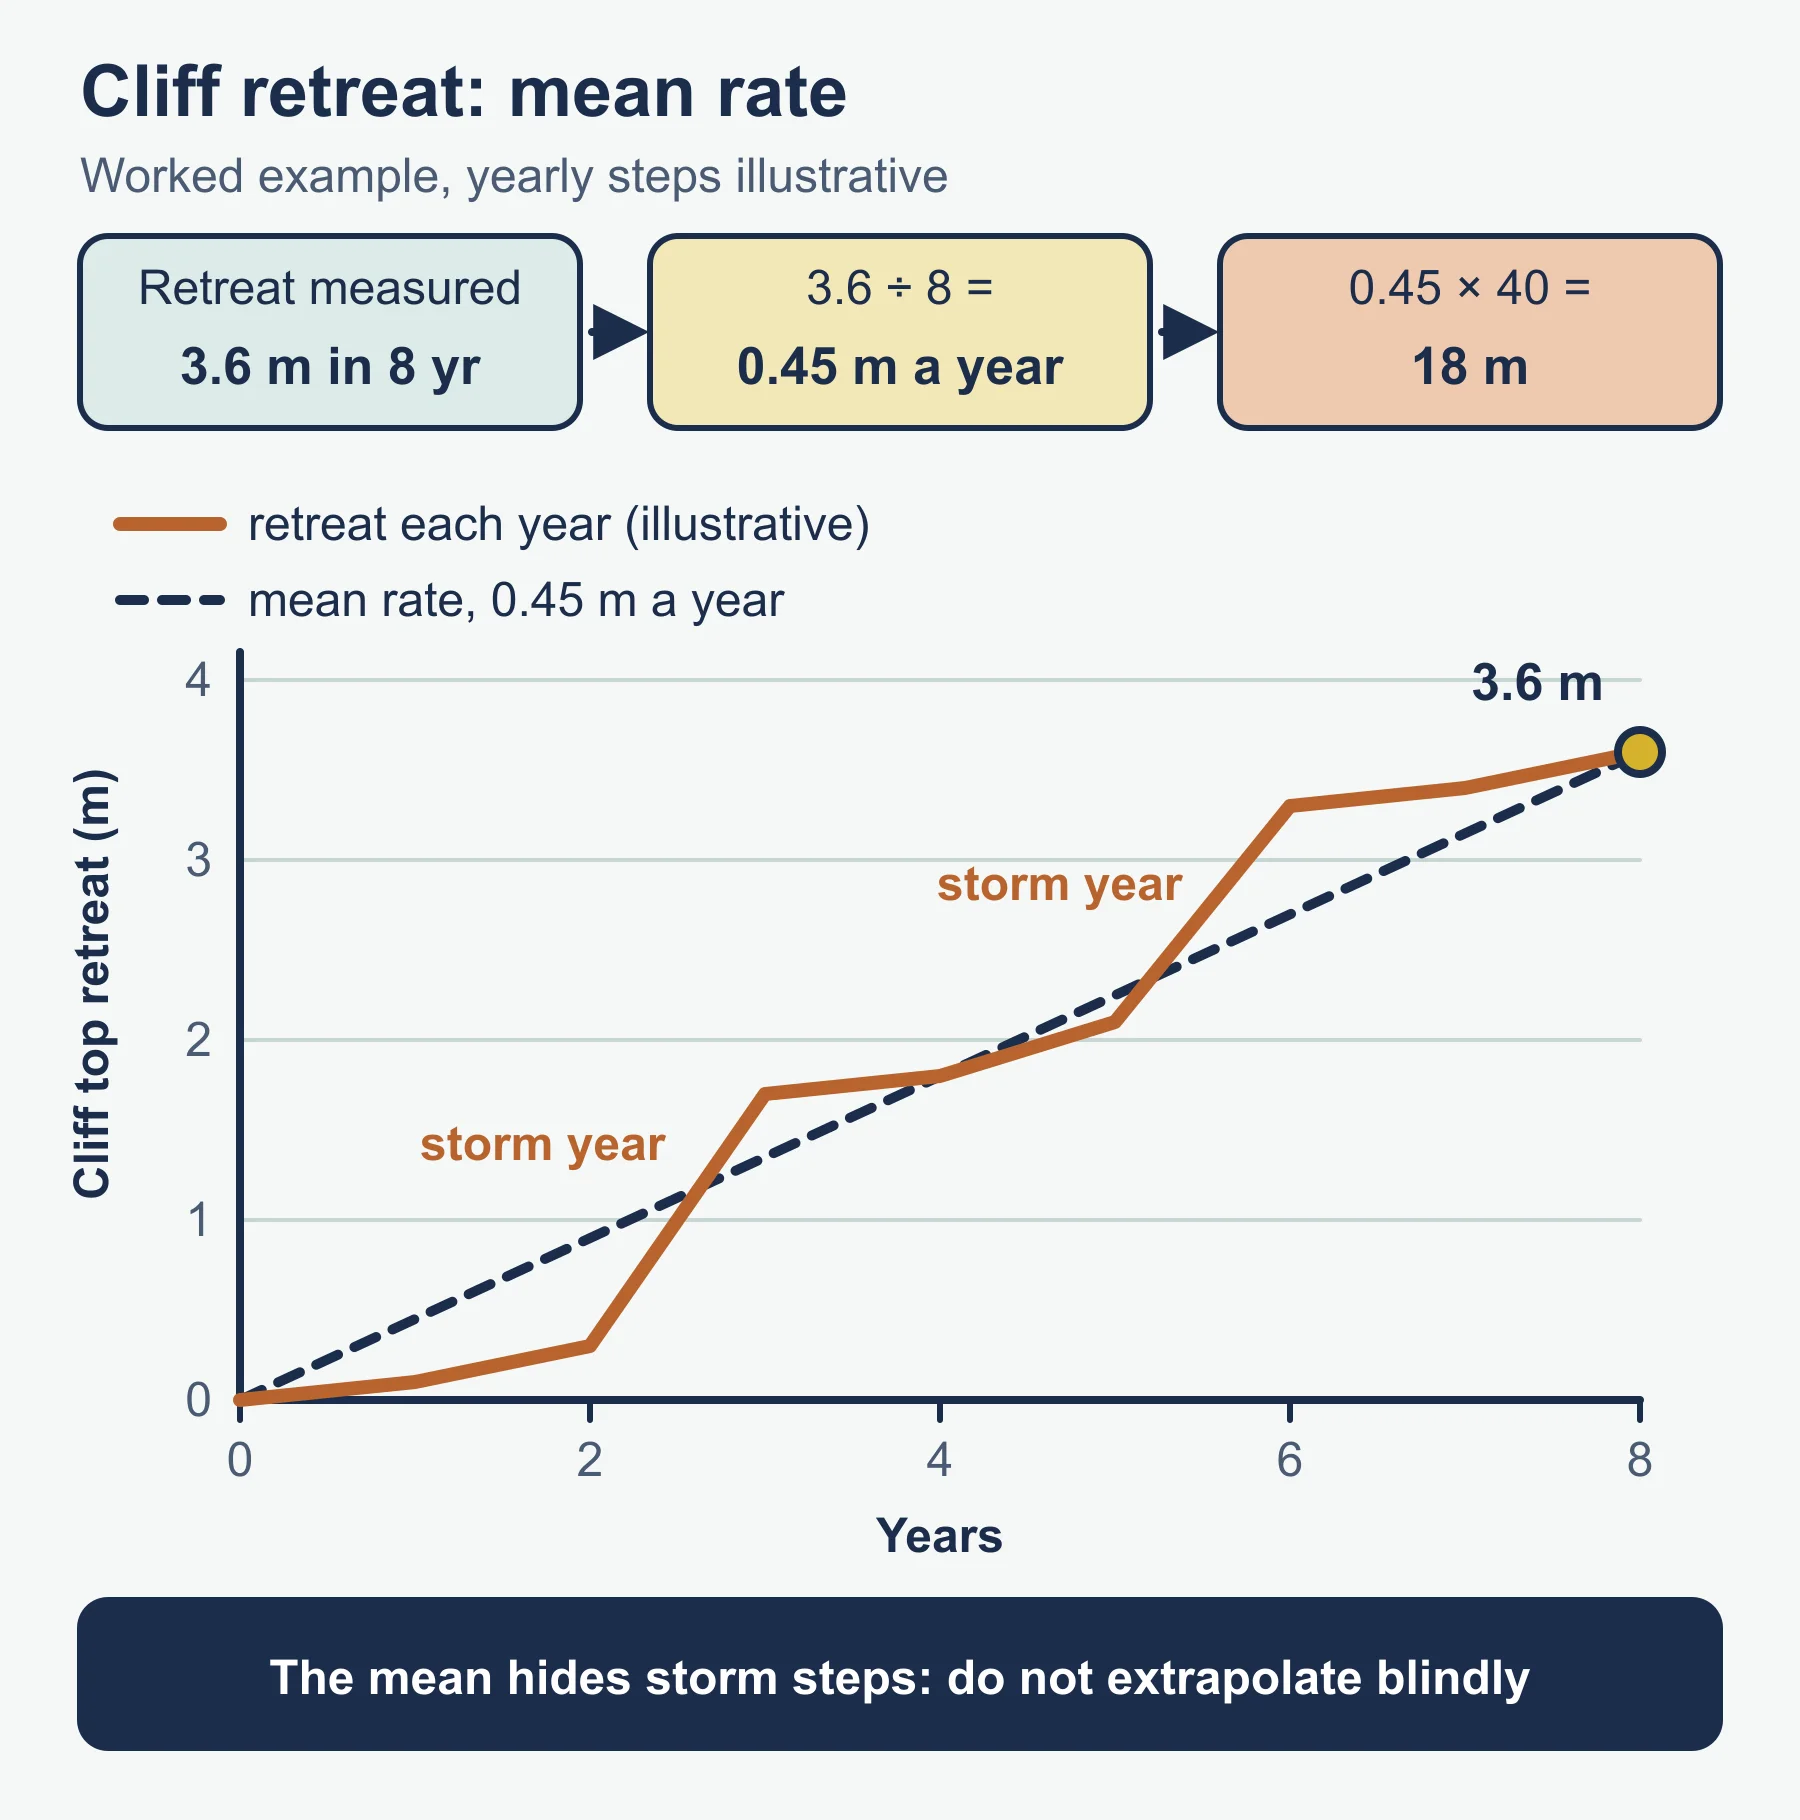
At an illustrative site, a fixed marker shows that a cliff top has retreated 3.6 m over 8 years.
- Mean rate = 3.6 / 8 = 0.45 m per year.
- If this rate continued for 40 years, retreat would be 0.45 x 40 = 18 m.
Always note that erosion is episodic: most retreat happens during storms, so a mean rate hides large year-to-year variation, and it is risky to extrapolate.
Example 2: a simple cost-benefit ratio
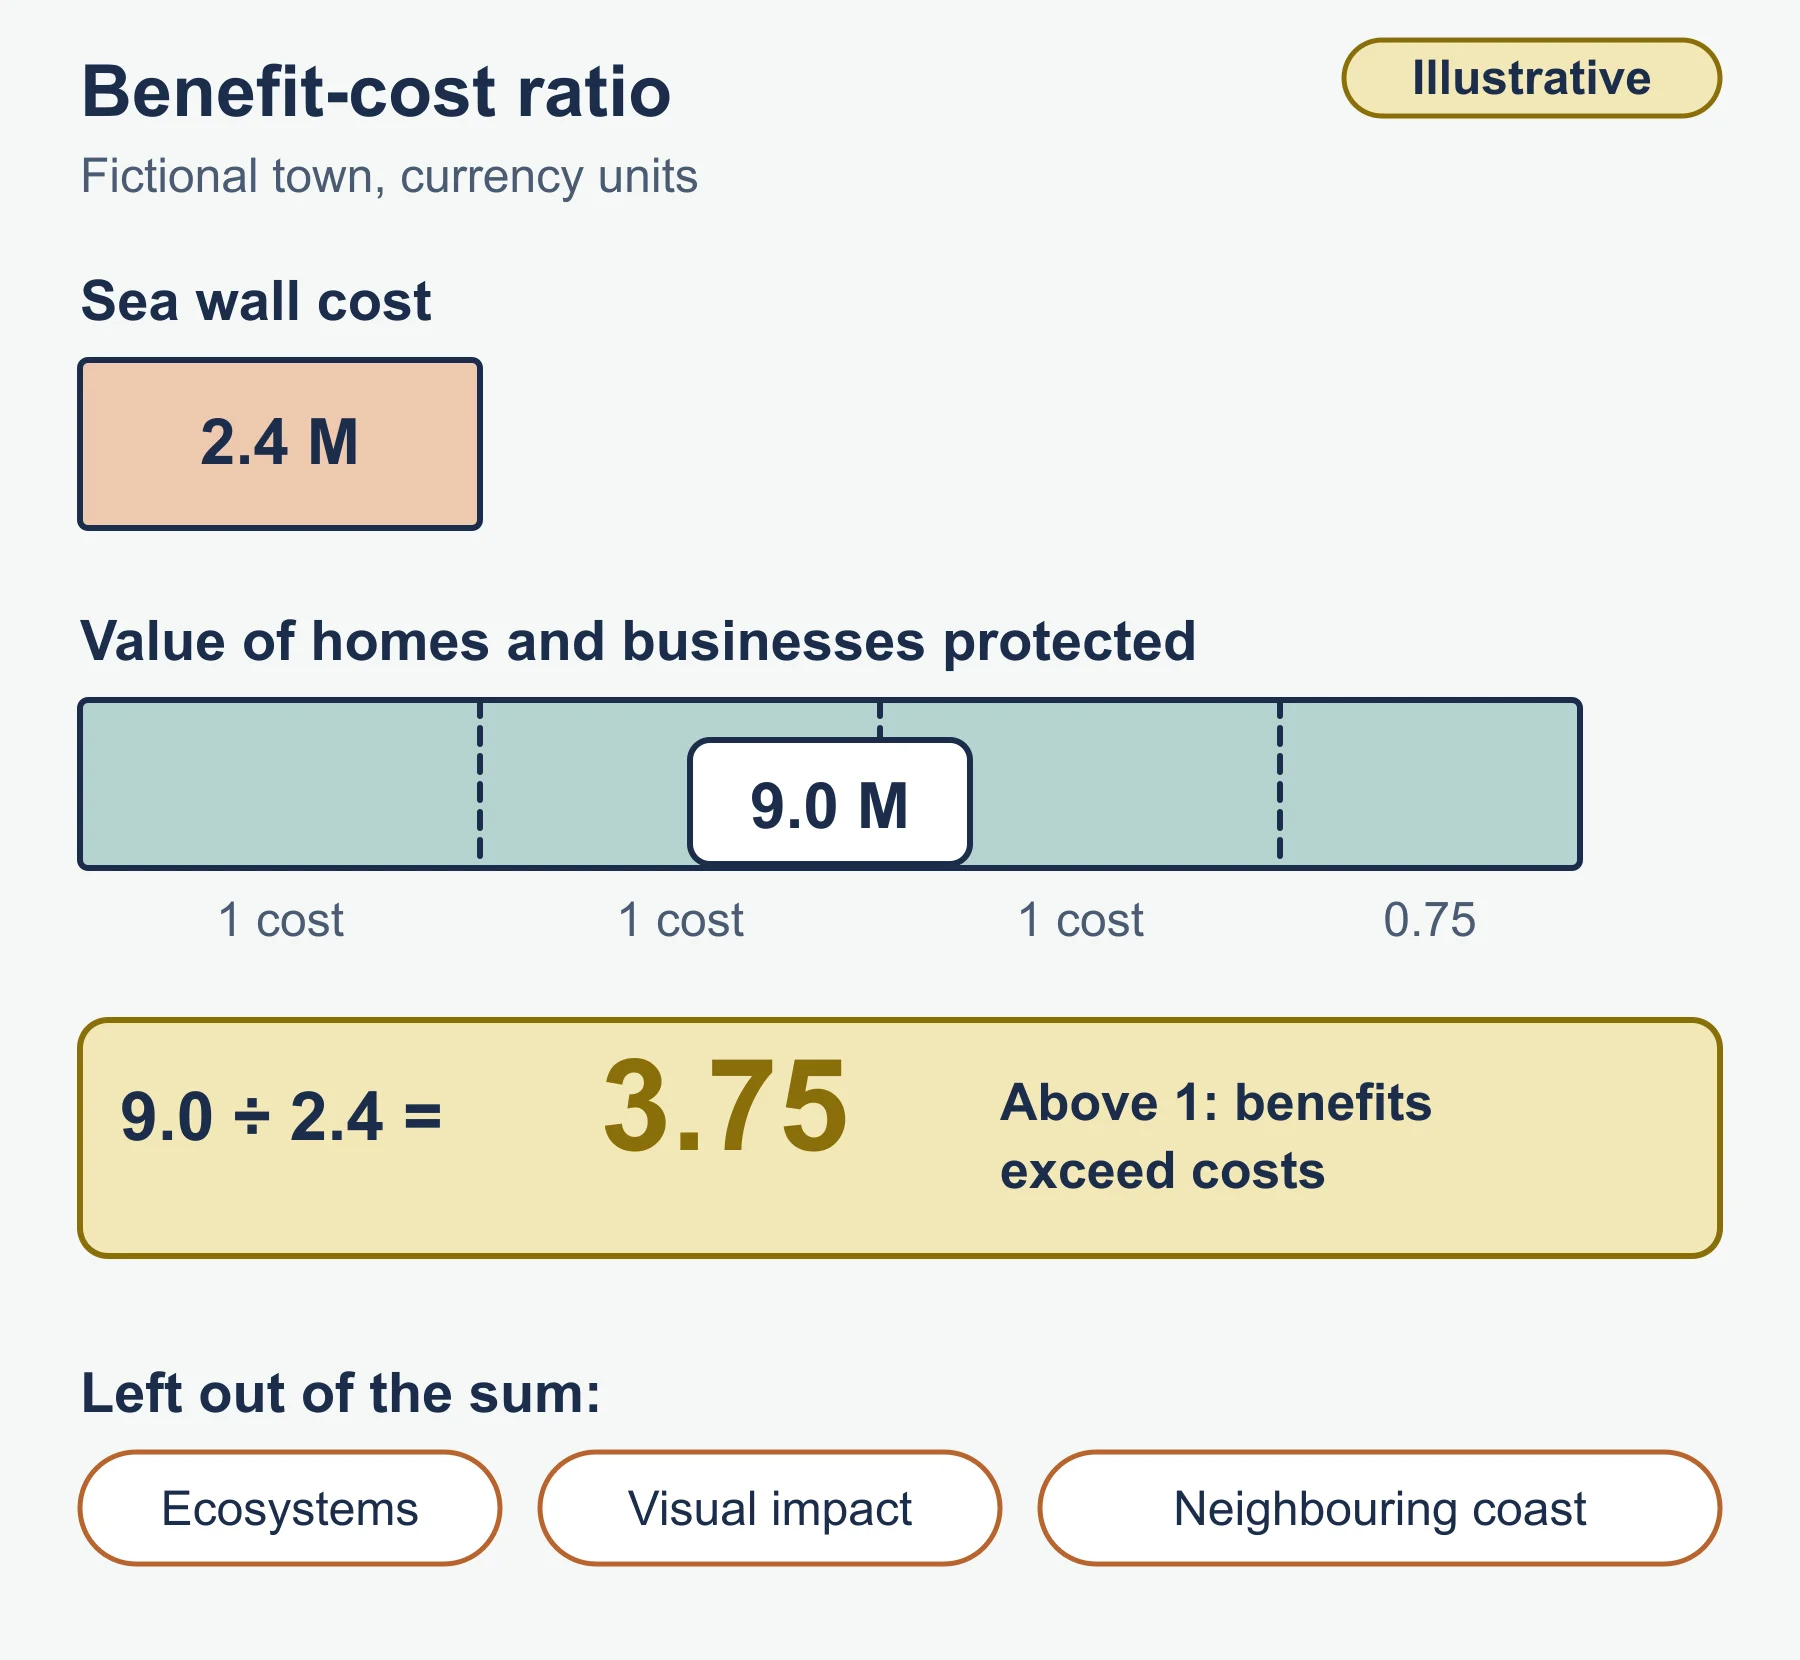
A fictional town considers a sea wall costing 2.4 million currency units. The value of homes and businesses protected over its life is estimated at 9.0 million.
- Benefit-cost ratio = 9.0 / 2.4 = 3.75.
A ratio above 1 suggests benefits exceed costs. However, the figure leaves out ecosystems, visual impact and the effect on neighbouring coast, so the decision still needs wider judgement.
Common mistakes
- Confusing El Nino with La Nina, or describing the effects without the cause.
- Treating hard engineering as always bad and soft as always good; evaluate in context.
- Describing a landform without explaining the process that formed it.
- Forgetting that coasts operate as systems, so action in one place has knock-on effects.
- Giving place detail you are not sure about. A well-explained general example is better than invented numbers.
Exam technique
IB command terms set the depth of response. Use describe for features, explain for reasons, evaluate for a judgement weighing strengths and limitations, and discuss for a balanced range of views. When a resource is provided, quote from it. In longer answers, state a clear line of argument early and support it with a located example, then end with a conclusion that answers the question set.
Check your understanding
- What two main factors drive thermohaline circulation? Answer: temperature and salinity, which determine water density.
- Outline what happens to upwelling during El Nino. Answer: trade winds weaken, warm water spreads east, and upwelling off South America is reduced.
- Name two landforms of coastal deposition. Answer: for example a spit and a tombolo.
- A cliff retreats 5.4 m in 12 years. What is the mean annual rate? Answer: 5.4 / 12 = 0.45 m per year.
- What is managed realignment? Answer: allowing the sea to flood land behind defences that are deliberately breached or removed, creating natural protection.
- Give one limitation of cost-benefit analysis for coastal decisions. Answer: it struggles to put a value on habitats, heritage or community ties.
- Why do marine protected areas matter for the future of ocean management? Answer: they conserve habitats and fish stocks and give ecosystems space to recover.
- Why is adaptive management attractive under climate change? Answer: it can be revised as evidence and conditions change.
Get free revision emails (optional)
Occasional emails with practice questions, worked explanations and links to free resources for the qualification and subjects you choose. No spam, and you can unsubscribe from any email. The free tools on this site never need an email.
Related resources
-
Study guides
IB DP Geography: Unit 4: Power, places and networks – Study Guide
Global power, networks and flows, and the human and physical influences on global interactions, taught for the Higher Level extension of IB Diploma Programme Geography.
Geography · International Baccalaureate · IB
Read guide -
Study guides
IB DP Geography: Option G: Urban environments – Study Guide
A study guide to the Urban environments option in IB DP Geography: variety of cities, changing urban systems, stresses and sustainable urban futures.
Geography · International Baccalaureate · IB
Read guide -
Revision notes
How DP Geography Is Assessed: Revision Notes
Condensed recall notes on the assessment structure at SL and HL – papers, weightings, timings and the fieldwork investigation – for IB Diploma Programme Geography.
Geography · International Baccalaureate · IB
Revise topic
Related articles
-
teaching
A Level tuition in Dubai: Cambridge or Pearson Edexcel International A Level?
Schools in Dubai and Abu Dhabi teach either Cambridge International AS & A Level or Pearson Edexcel International A Level. How the two are structured, why it matters for tuition, and how online classes from Lahore work.
9 October 2026
-
curriculum guides
Choosing subjects at IGCSE and A Level
How subject choices at 14 and 16 affect university options later, and how to keep pathways open without overloading a timetable.
28 July 2026
Studying this with a teacher
Working through Geography IB?
This page is free and stays free. Marlbridge is not offering Geography classes at the moment, so there is no tuition to book for it. The free study resources stay open to everyone.