
Study Guides
IB DP Geography: Option A: Freshwater – Study Guide
A study guide to the Freshwater option in IB DP Geography: drainage basins, flooding, water scarcity and quality, and how water might be managed in future.
- Subject
- Geography
- Level
- IB
- Topic
- Topic 1: Option A: Freshwater
- Author
- Marlbridge Academic Team
- Updated
- Reviewed by
- Azam Siddique (what this means)
Aligned to International Baccalaureate IB Diploma Programme Geography (DP Geography), First assessments 2019. Official specification .
Syllabus page (what it covers and how it is assessed): IB Diploma Programme Geography.
Syllabus points this page covers
DP Geography
- 1.1 Drainage basin hydrology and geomorphology
- 1.2 Flooding and flood mitigation
- 1.3 Water scarcity and water quality
- 1.4 Water management futures
This page covers all 4 subtopics recorded here in topic 1, Option A: Freshwater.
Freshwater is one of the seven teacher-selected options in the geographic themes part of IB Diploma Programme Geography. Your school will have chosen which options it teaches, so check this is one of yours before you invest revision time in it. This guide follows the four strands of the option: how drainage basins work as physical systems, why floods happen and how they are managed, how scarcity and pollution affect people, and what the future of water management might look like. The IB DP Geography syllabus guide explains how options sit alongside the compulsory core.
Where this fits in the course
The options are assessed in Paper 1, where you answer questions on the options you have studied. They are written to test both geographical knowledge and the ability to apply it to places, so a strong answer pairs concepts with specific examples that you can describe accurately. Because the IB expects you to work with data, maps, graphs and sources, practise reading hydrographs, rainfall tables and water stress maps as well as learning content.
Freshwater links naturally to the core units on climate and on resource consumption. When an examiner asks about water security, you can draw on ideas about vulnerability, resilience and stewardship from elsewhere in the course.
1.1 Drainage basin hydrology and geomorphology
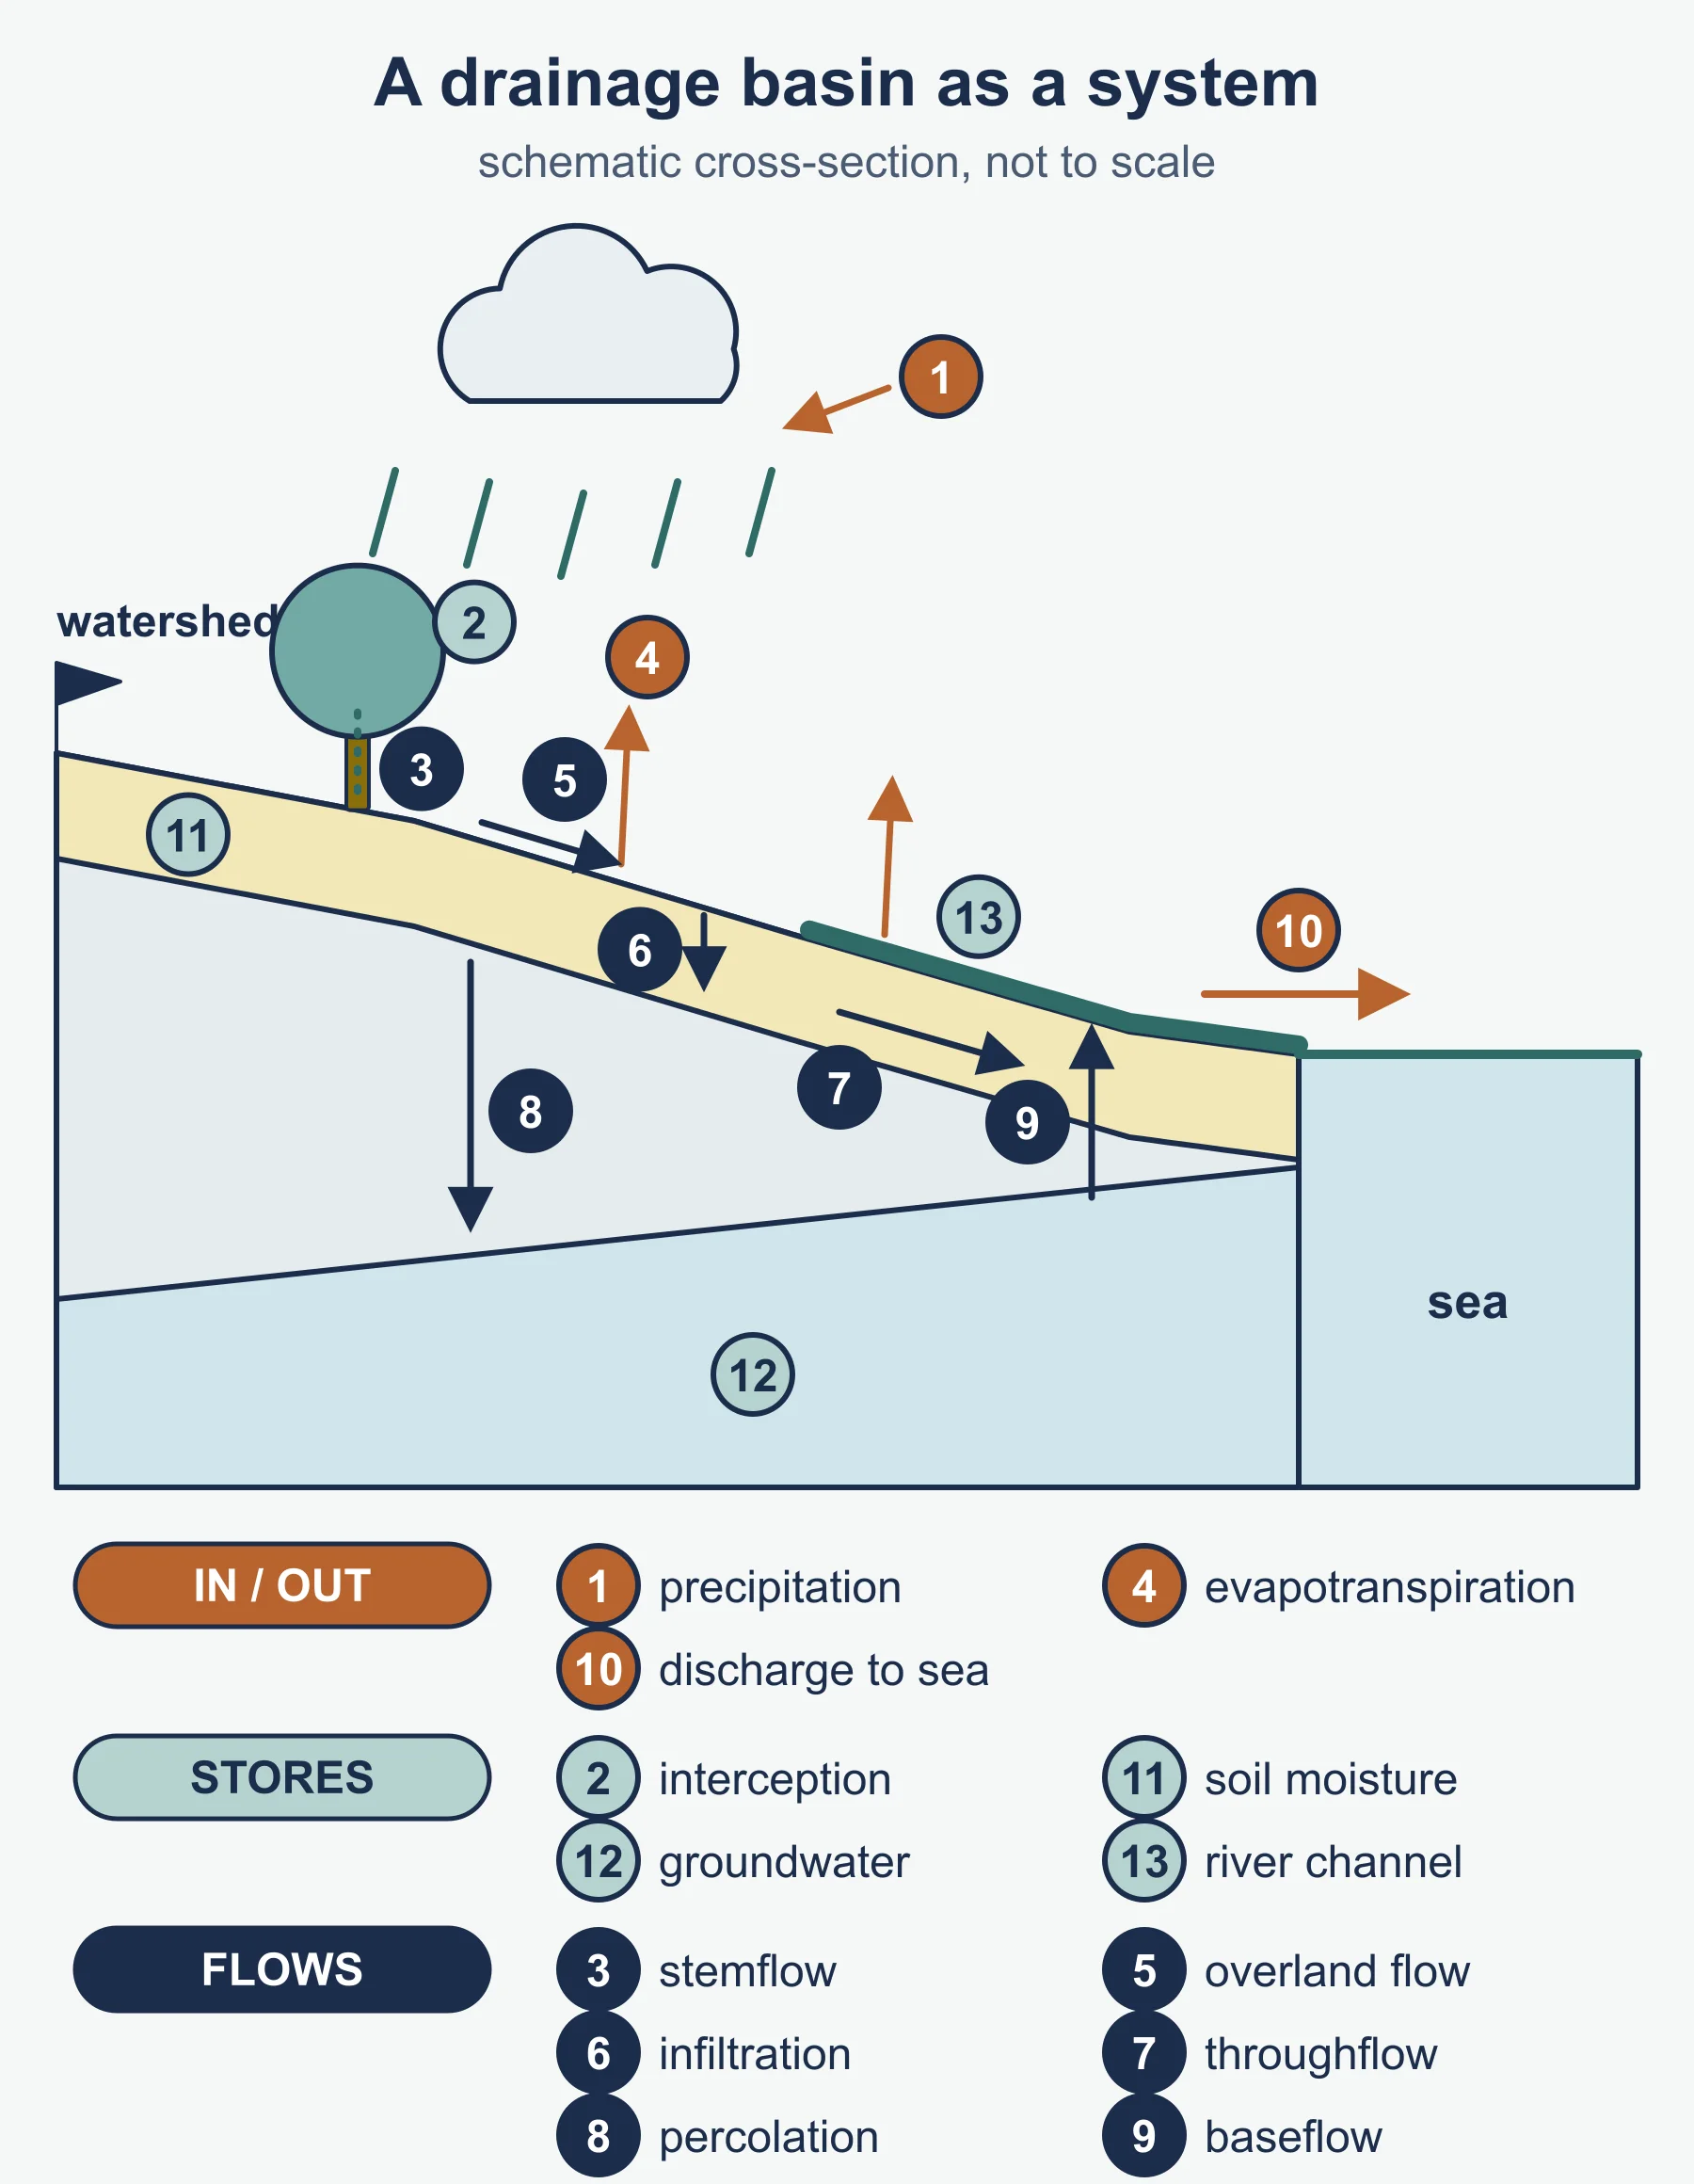
A drainage basin is the area of land drained by a river and its tributaries, bounded by a watershed. Treat it as an open system: inputs (precipitation), stores (interception, surface storage, soil moisture, groundwater, channel storage), flows or transfers (infiltration, throughflow, percolation, overland flow, baseflow, stemflow) and outputs (evaporation, transpiration, discharge to the sea).
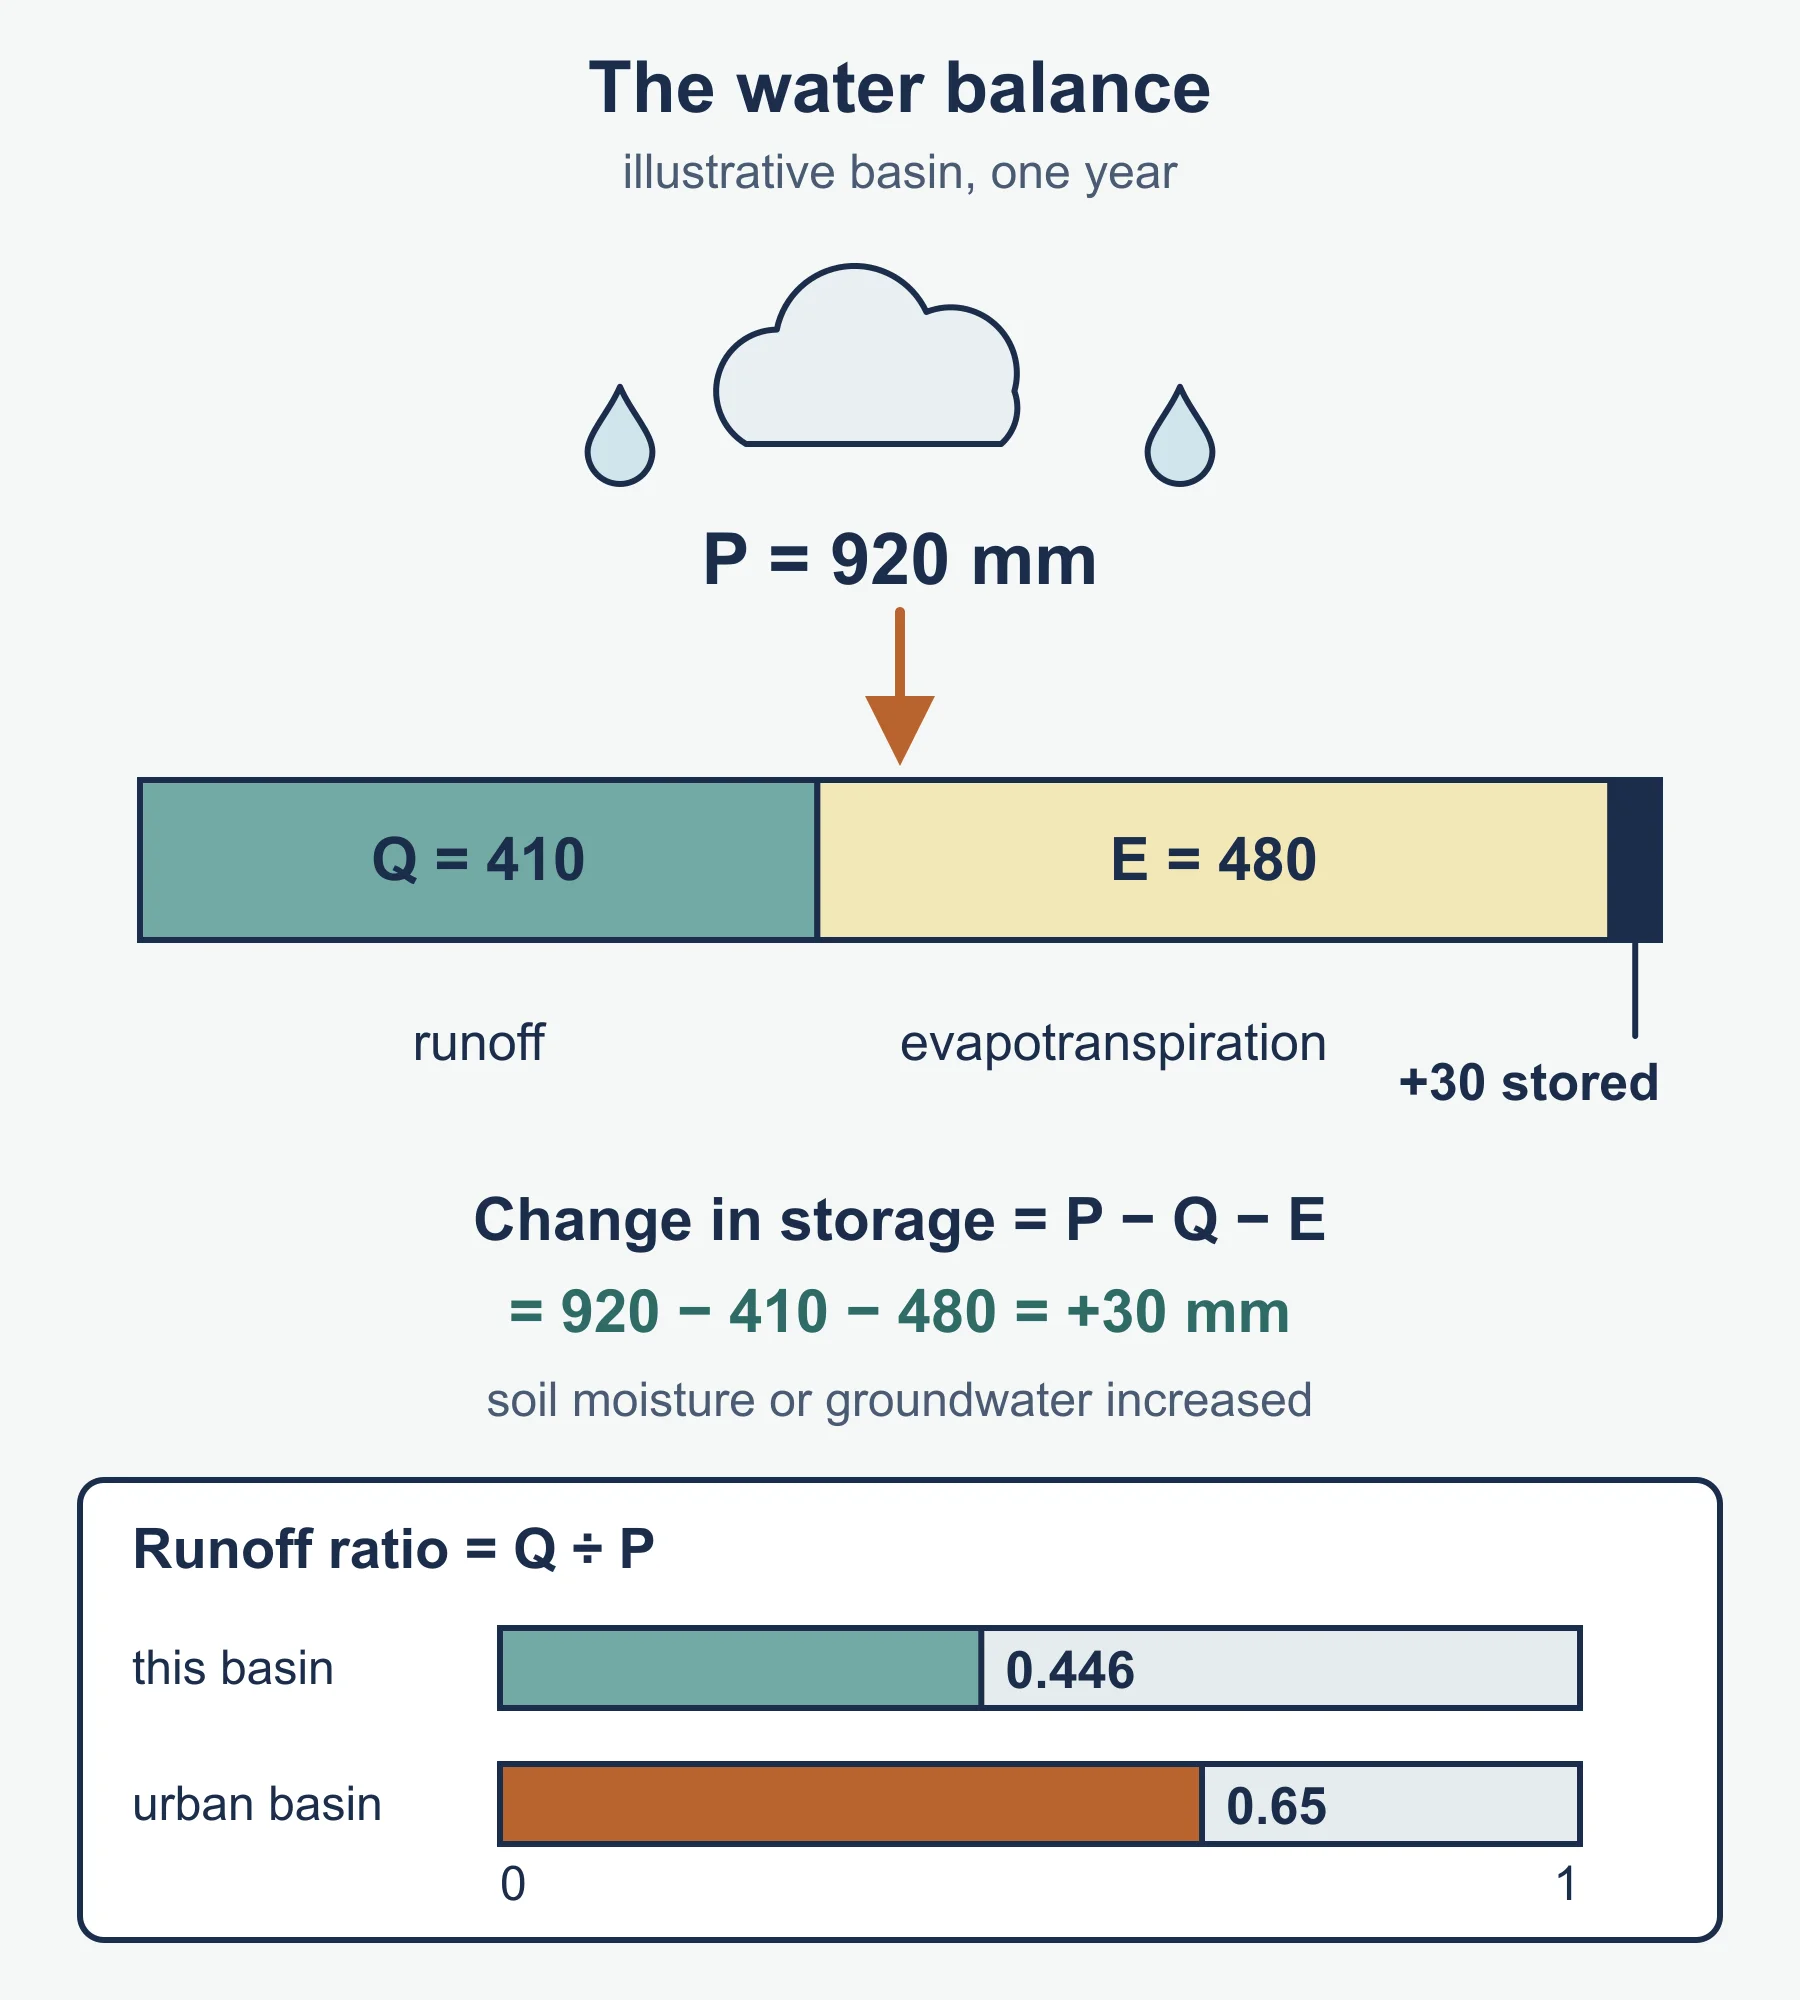
The water balance expresses this idea quantitatively:
precipitation (P) = runoff or discharge (Q) + evapotranspiration (E) +/- change in storage
Over a long period, storage change is close to zero in a stable basin, but it can be positive in a wet year (soils and aquifers fill) or negative in a drought.
Hydrographs
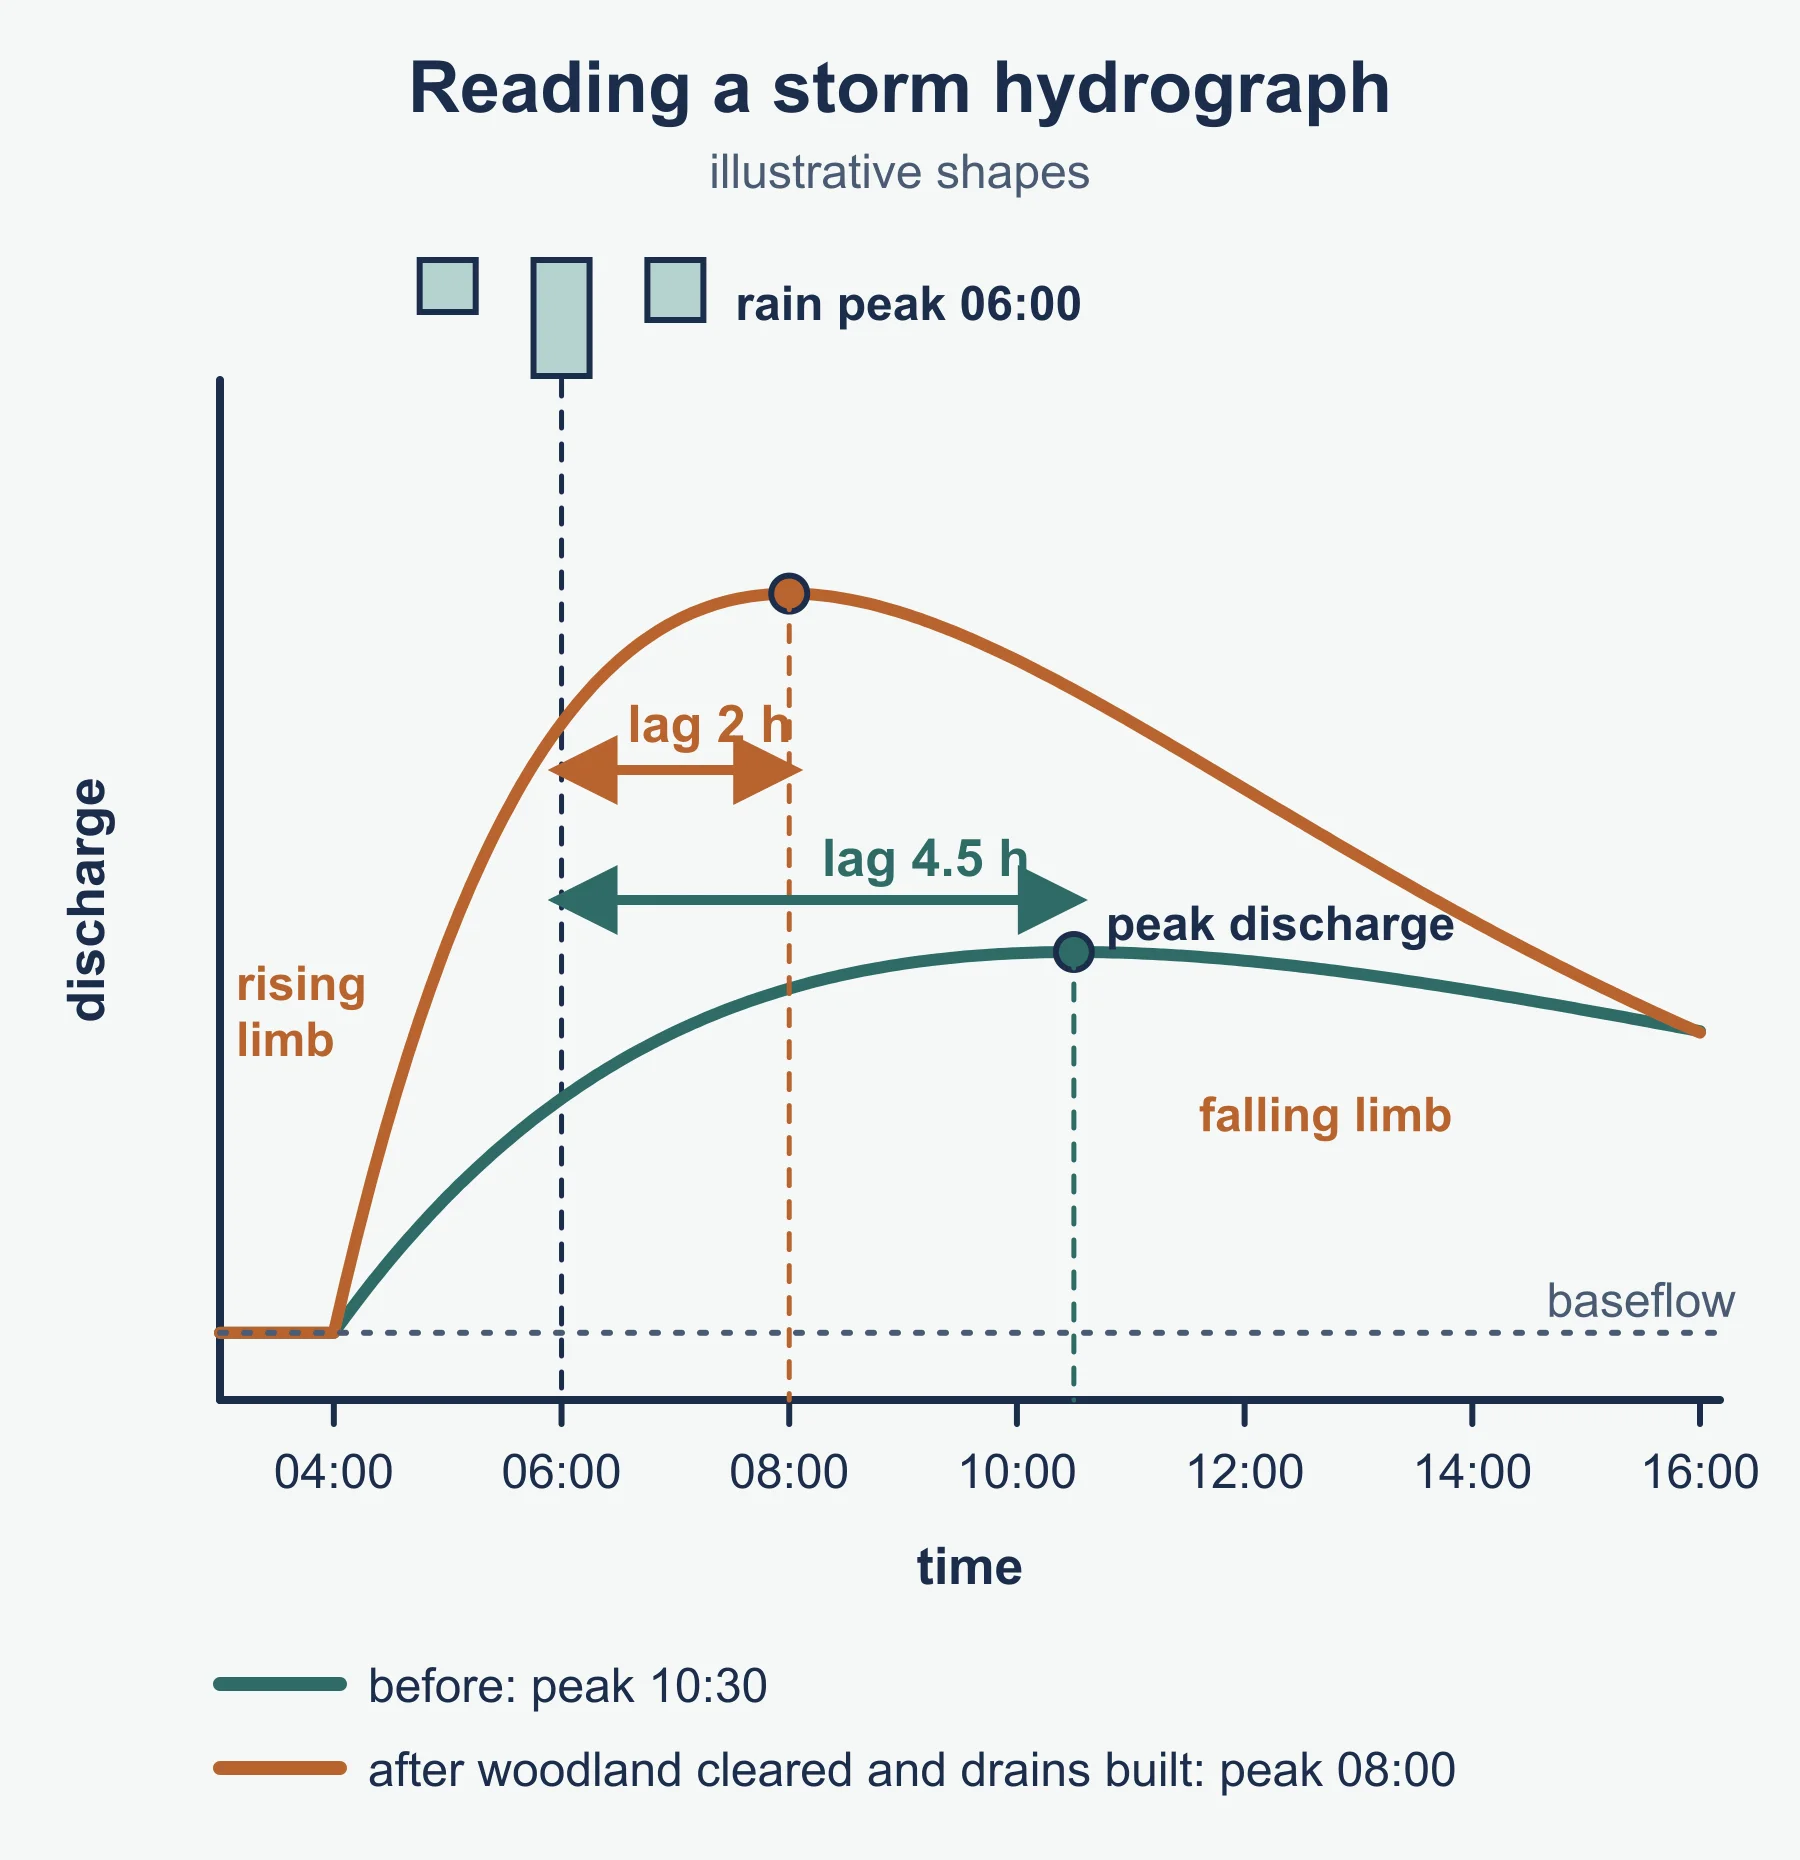
A storm hydrograph plots discharge against time after rainfall. Know the labelled parts: rising limb, peak discharge, falling limb, baseflow and lag time (the delay between peak rainfall and peak discharge). A short lag time and steep rising limb signal a flashy response. Factors that make a basin flashy include steep slopes, impermeable rock, saturated or frozen soil, urban surfaces, high drainage density, circular basin shape and sparse vegetation. Basins with permeable geology, forest cover and gentle gradients produce a lower, later peak.
River processes and landforms
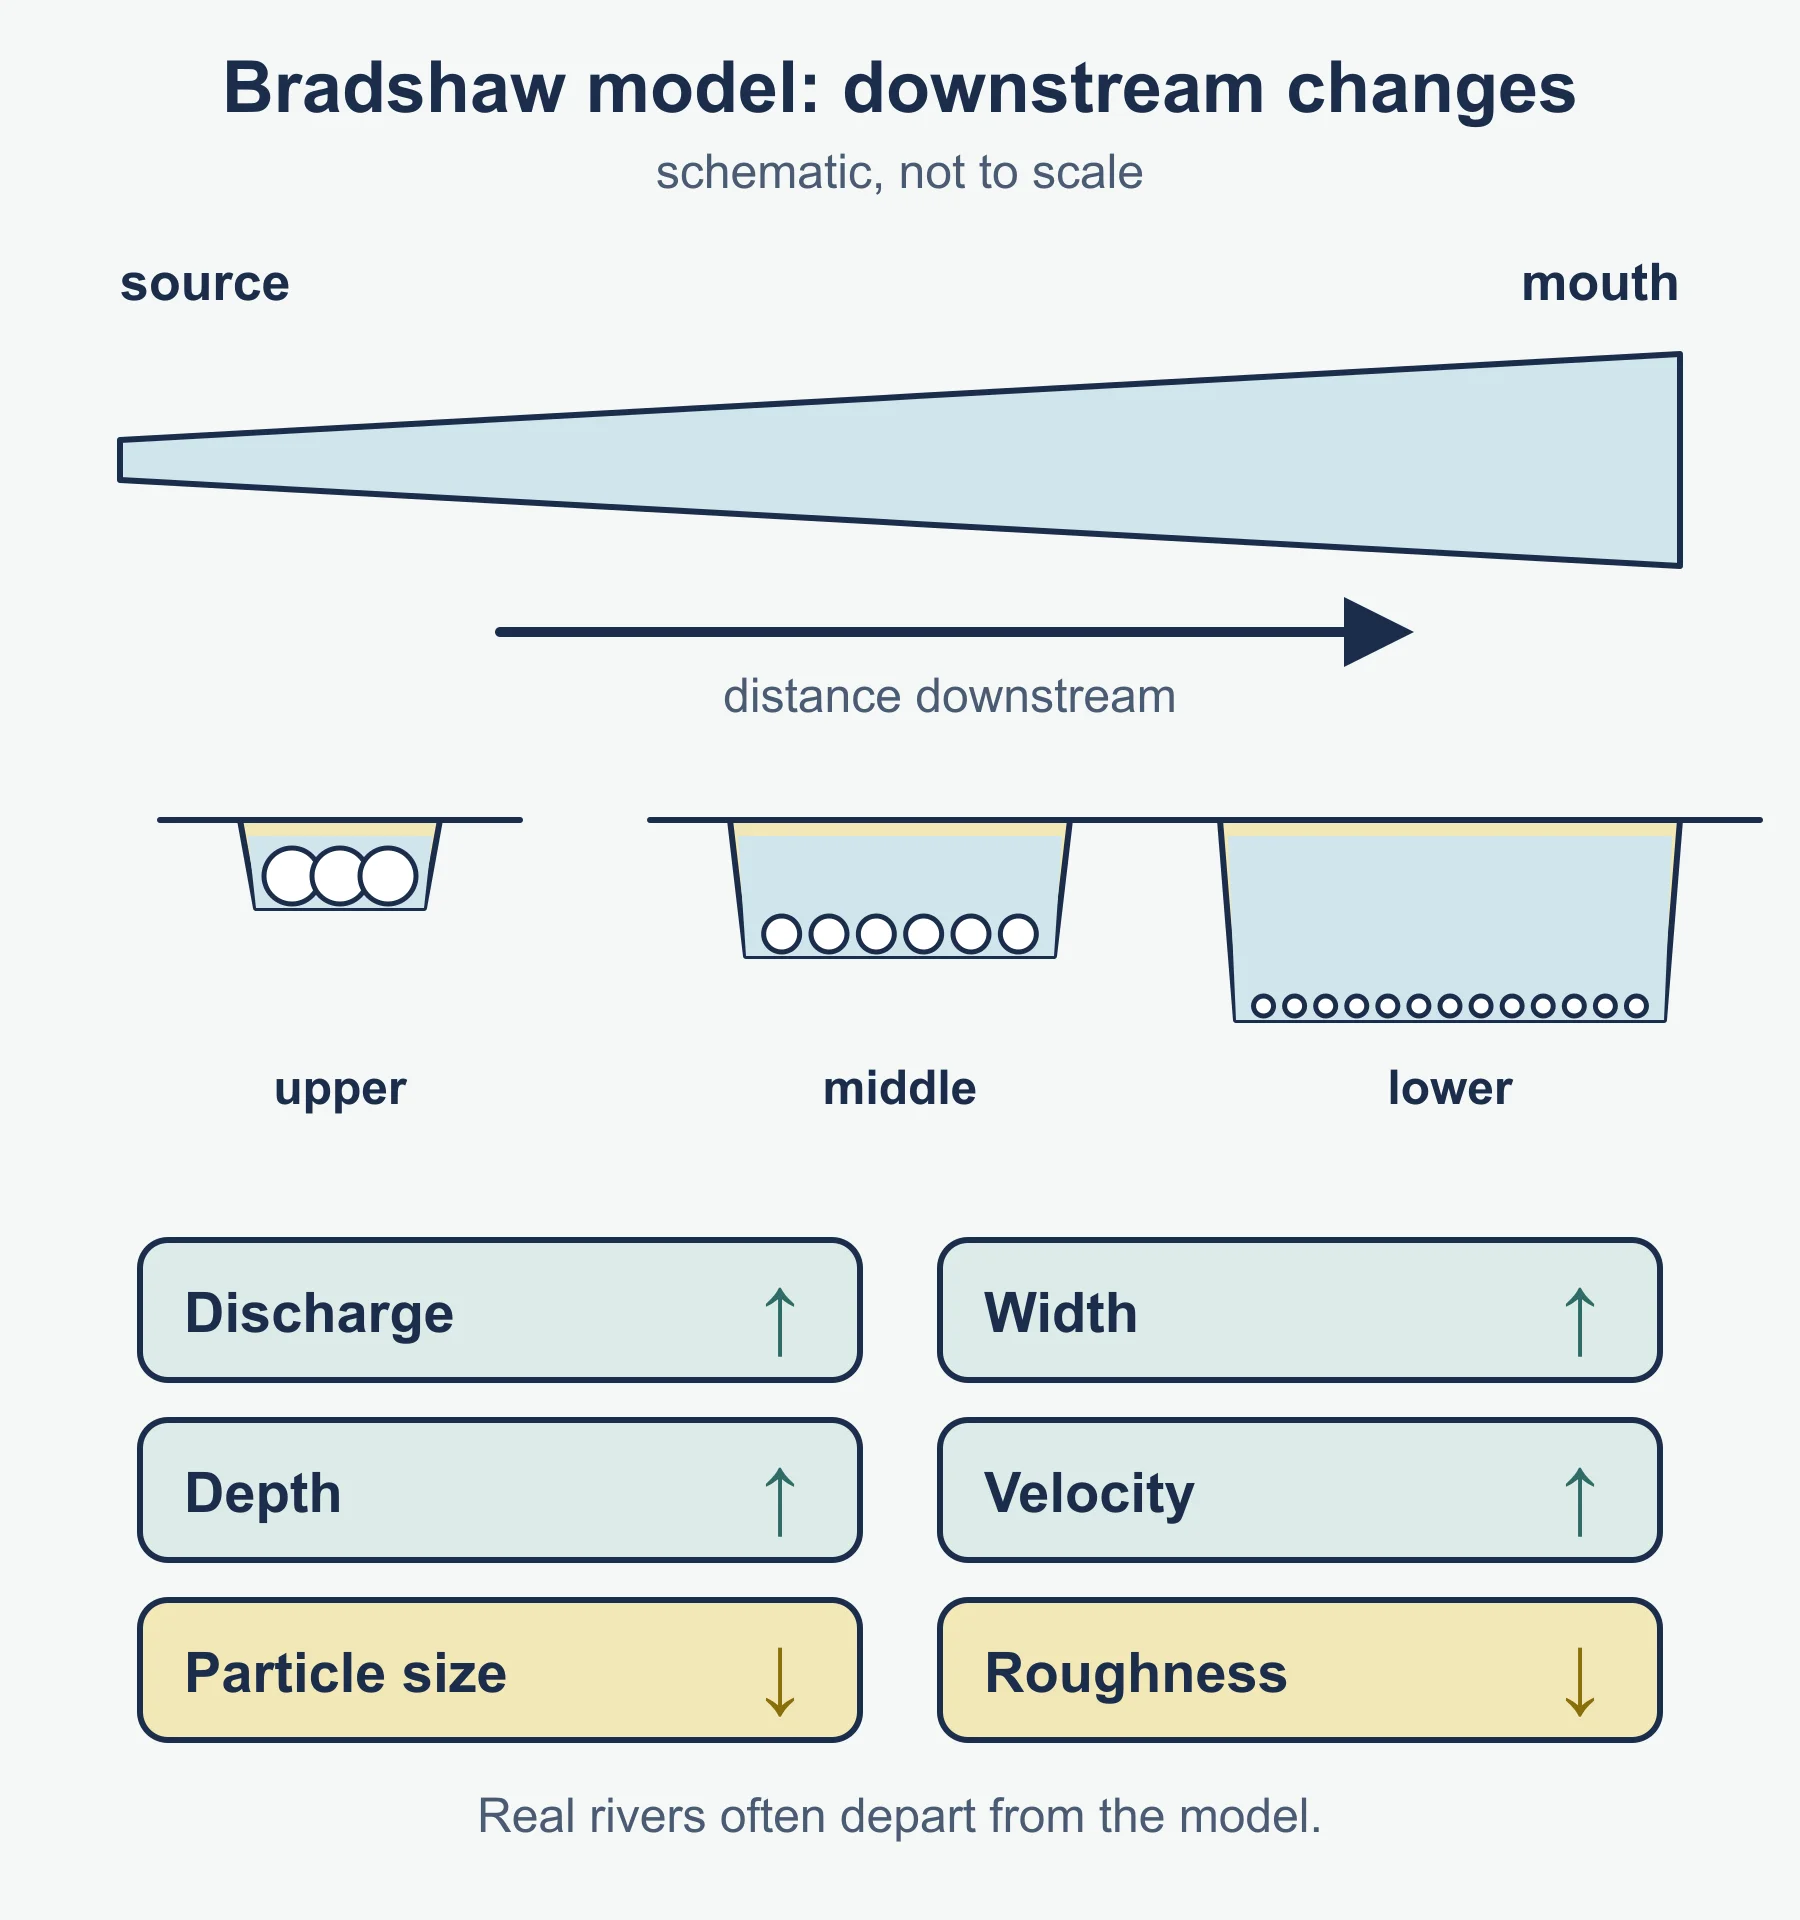
Rivers erode by hydraulic action, abrasion, attrition and solution, and transport material as solution, suspension, saltation and traction. The Hjulstrom curve shows how flow velocity relates to erosion, transport and deposition for different particle sizes: fine silts and clays are surprisingly hard to erode once settled because of cohesion, while sands erode at the lowest velocities. The Bradshaw model describes expected downstream changes: discharge, channel width, depth and velocity tend to increase, while particle size and channel roughness decrease. Real rivers often depart from the model, and you should say why, for example where a tributary or a rock outcrop interrupts the pattern.
Be ready to explain landforms such as waterfalls, meanders, oxbow lakes, levees, floodplains and deltas in terms of process, not just description.
1.2 Flooding and flood mitigation
Floods have physical causes (intense or prolonged rainfall, snowmelt, saturated ground, storm surges at estuaries) and human contributors (deforestation, urbanisation, drainage of wetlands, poorly maintained defences, building on floodplains). Impacts can be sorted into primary (immediate damage, deaths and injuries), secondary (disease, disrupted services, lost livelihoods) and long-term (insurance costs, mental health effects, migration). Floods can also bring benefits, such as soil renewal on floodplains.
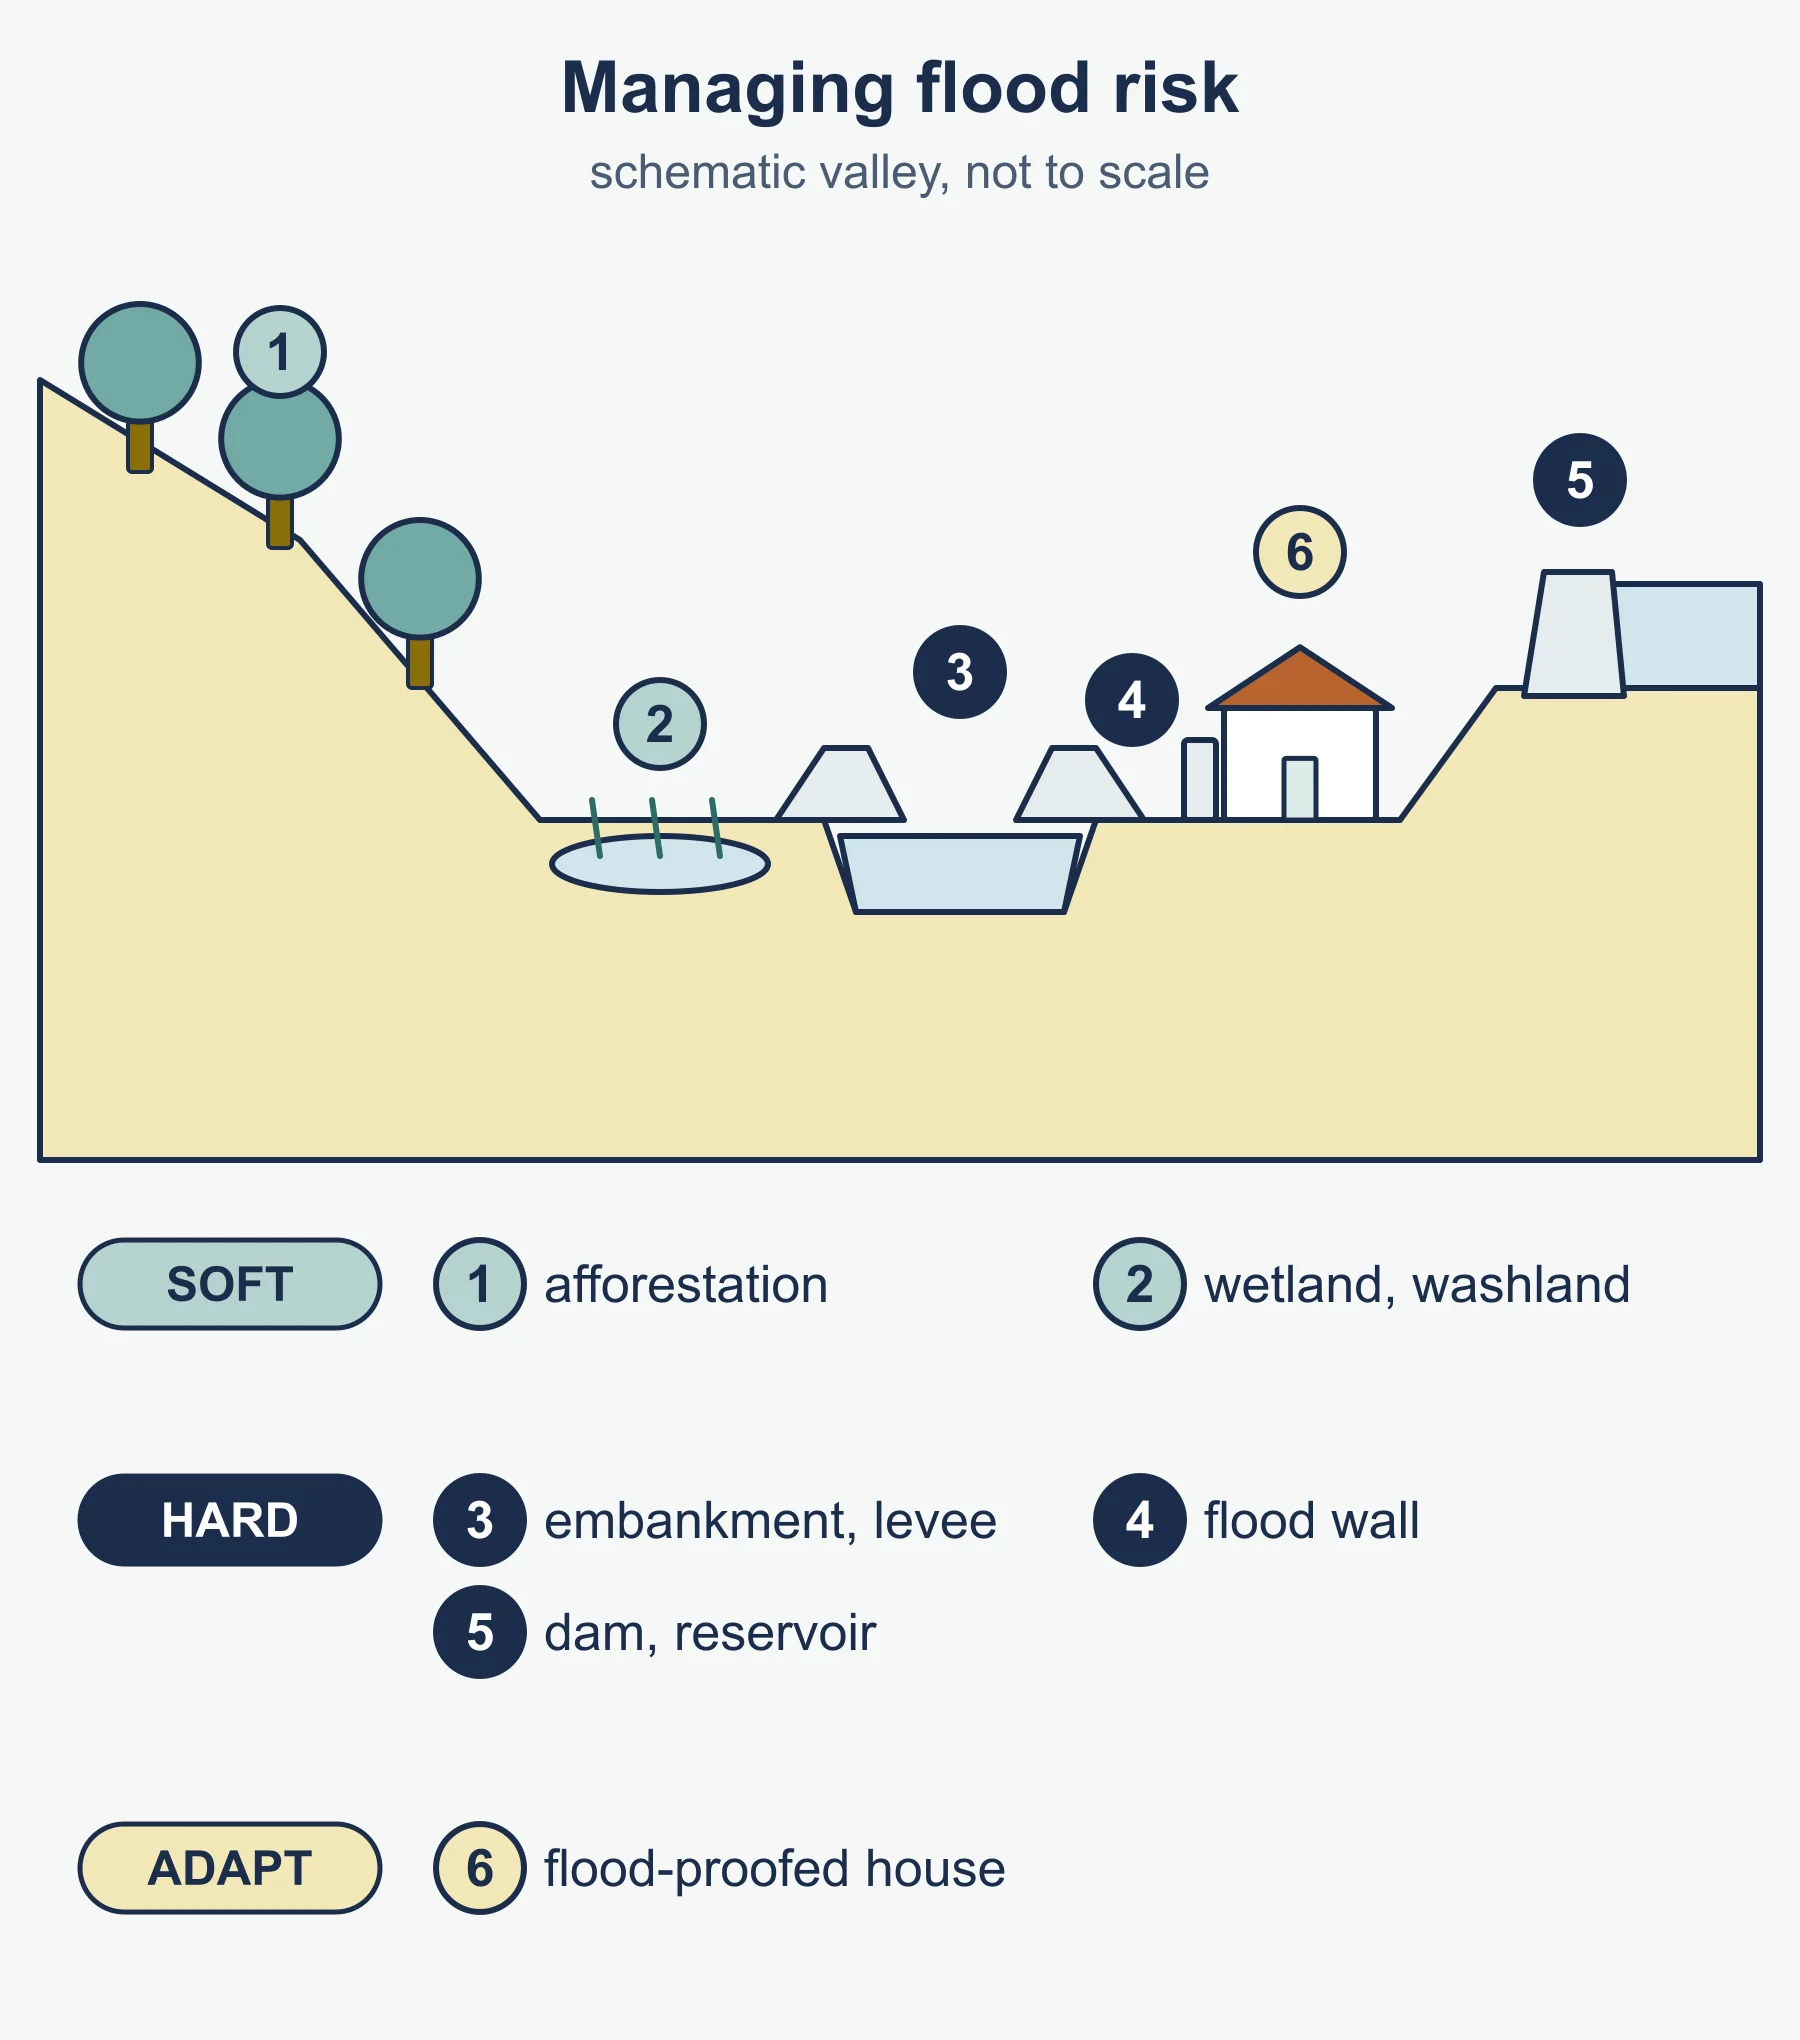
Mitigation falls into three broad types:
- Hard engineering: dams, embankments and levees, channel straightening, flood walls and storage reservoirs. These can be effective against a design flood but are costly and can displace risk downstream.
- Soft engineering: afforestation, wetland and floodplain restoration, washlands, flood warnings, land-use zoning and natural flood management that slows water in the upper catchment.
- Adaptation and preparedness: flood-proofing buildings, community plans, insurance and evacuation routes.
You should be able to compare the economic, social, environmental and political dimensions of a hard and a soft approach. Many modern strategies combine them within integrated catchment management. Use a flood event you have studied for detail, and if you cannot recall exact figures, describe the pattern of impacts and responses rather than guessing numbers.
1.3 Water scarcity and water quality
Distinguish three ideas that students often blur. Physical scarcity means there is not enough water to meet demand. Economic scarcity means water exists but people lack the infrastructure or money to use it. Water stress is a measure of pressure on available supply, often compared with demand per person. Water footprint counts the water used to produce goods and services, and virtual water is the water embedded in traded products, for example in food exports from dry regions.
Causes of scarcity include climate variability, population growth, rising per-capita demand, agricultural irrigation, industrial use, leaking infrastructure and shared transboundary rivers where upstream use affects downstream users. Consequences range from reduced food production and conflict risk to health problems when people turn to unsafe sources.
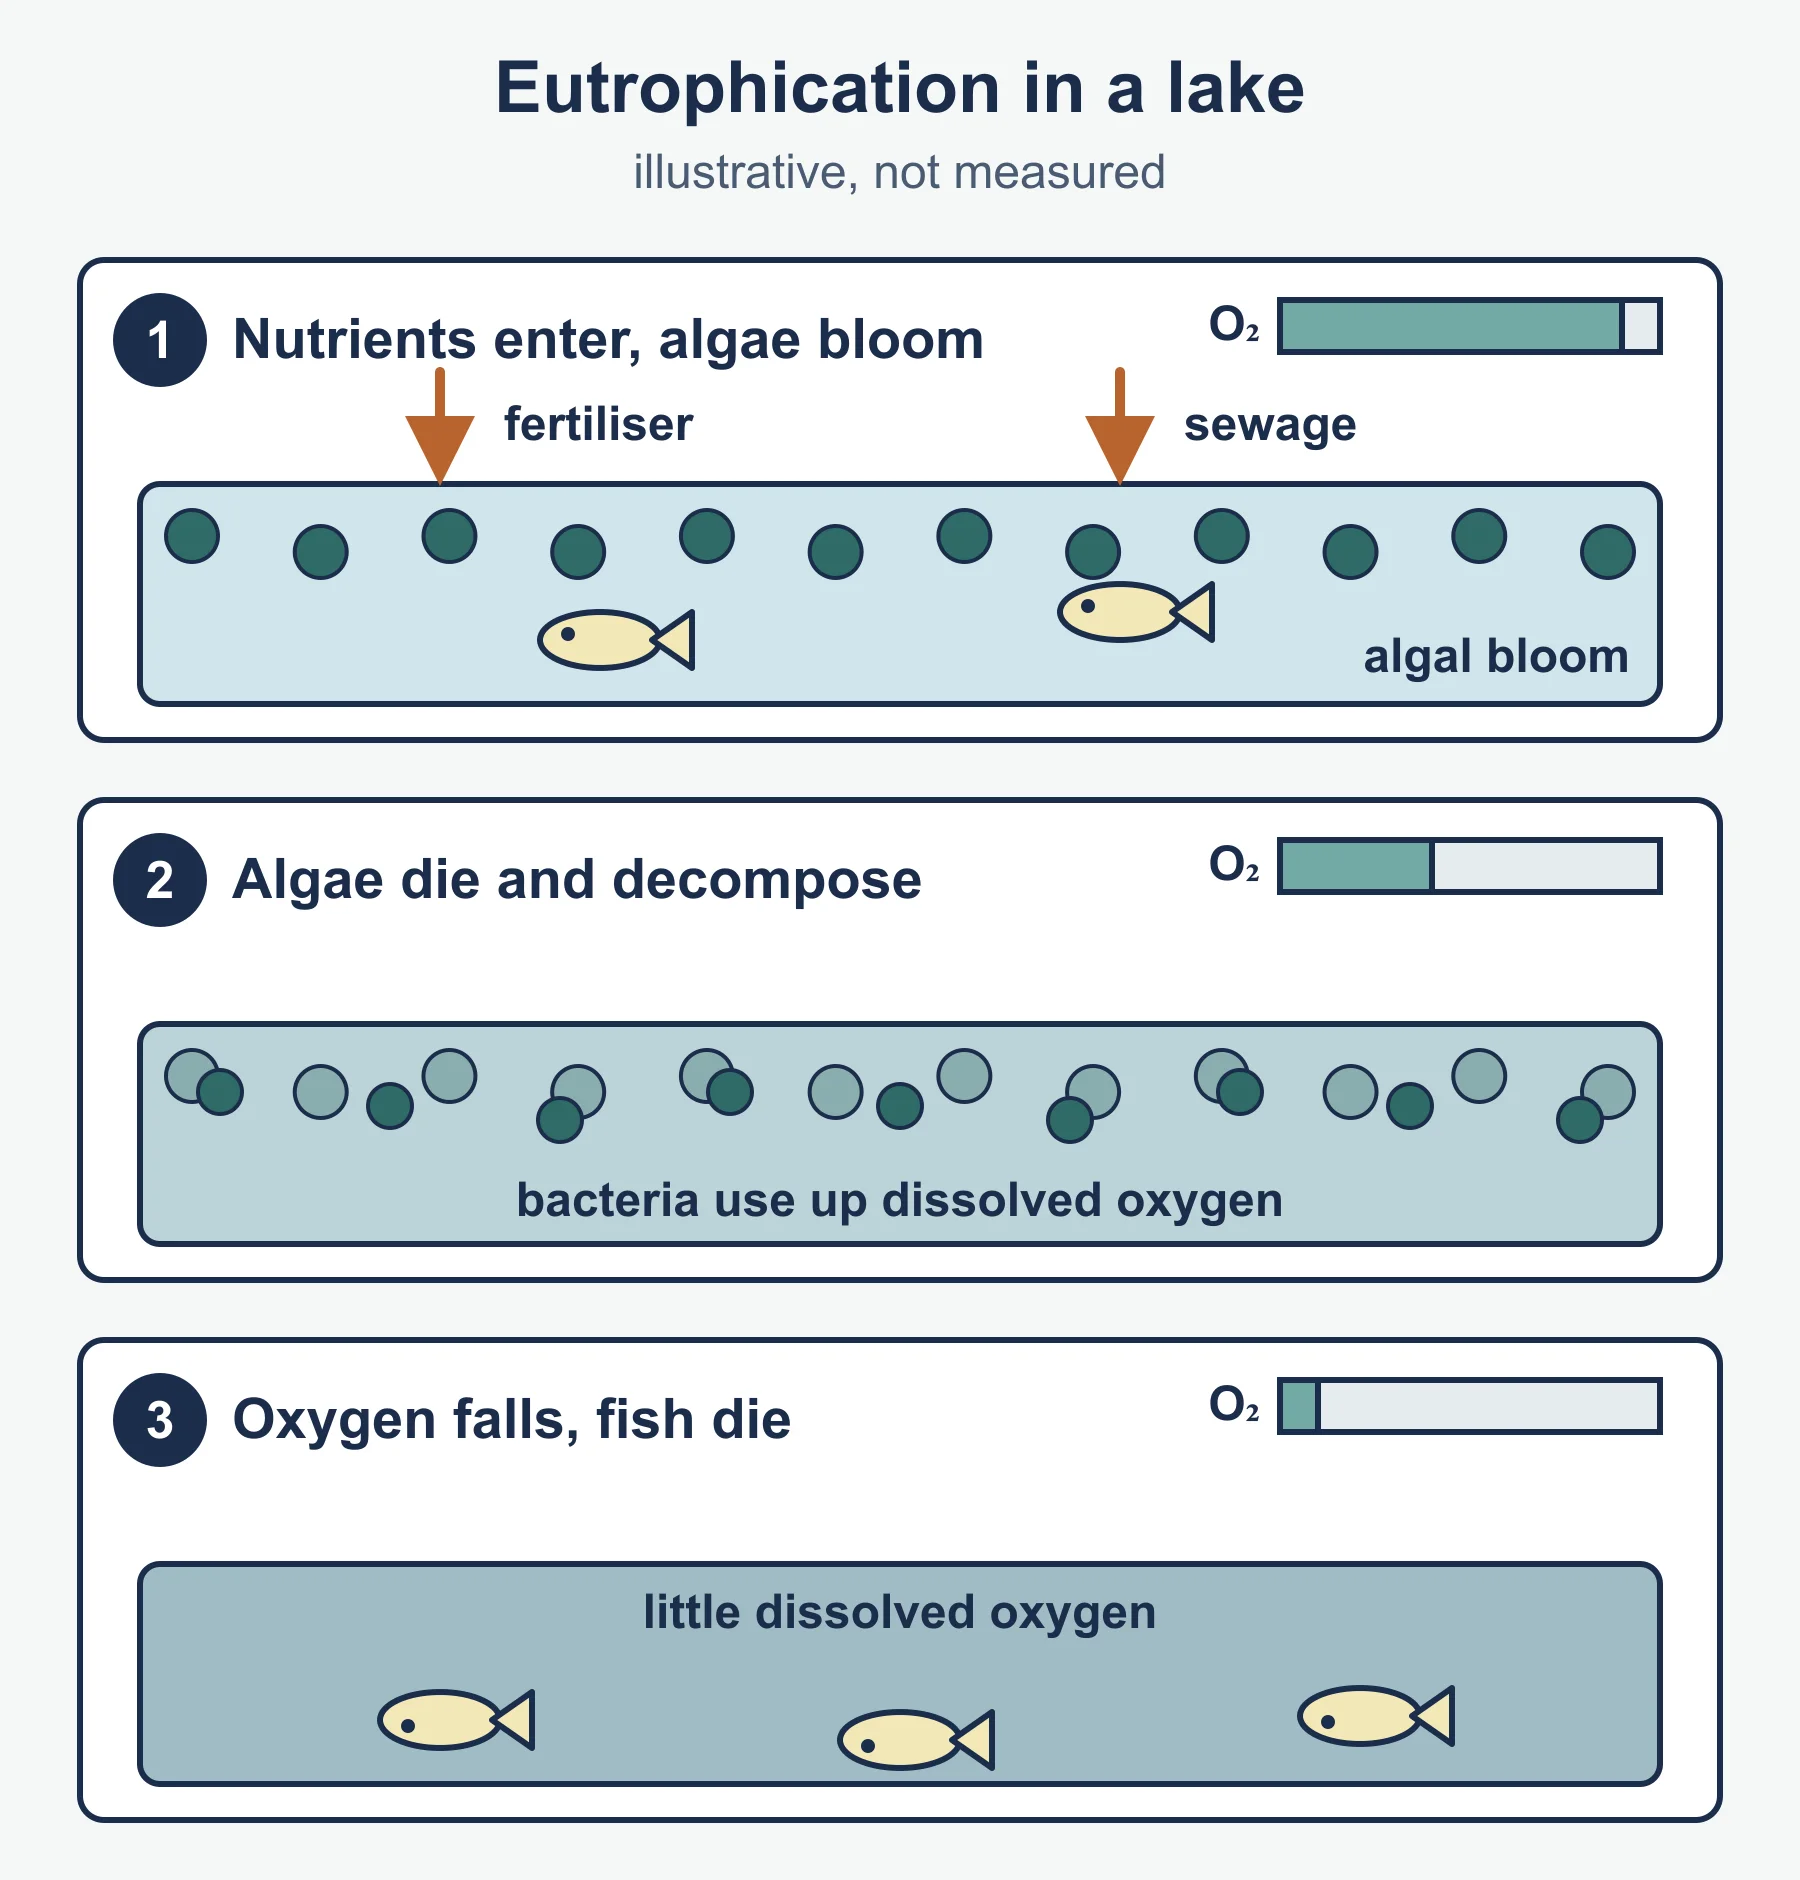
Water quality links to pollutants: sewage, agricultural fertiliser and pesticides, industrial effluent, heavy metals, plastics and saline intrusion in coastal aquifers. Eutrophication is a key process: nutrients cause algal blooms, which block light, die and decompose, using up dissolved oxygen so that fish and other organisms die. Quality can be monitored through dissolved oxygen, biological indicators and chemical tests.
1.4 Water management futures
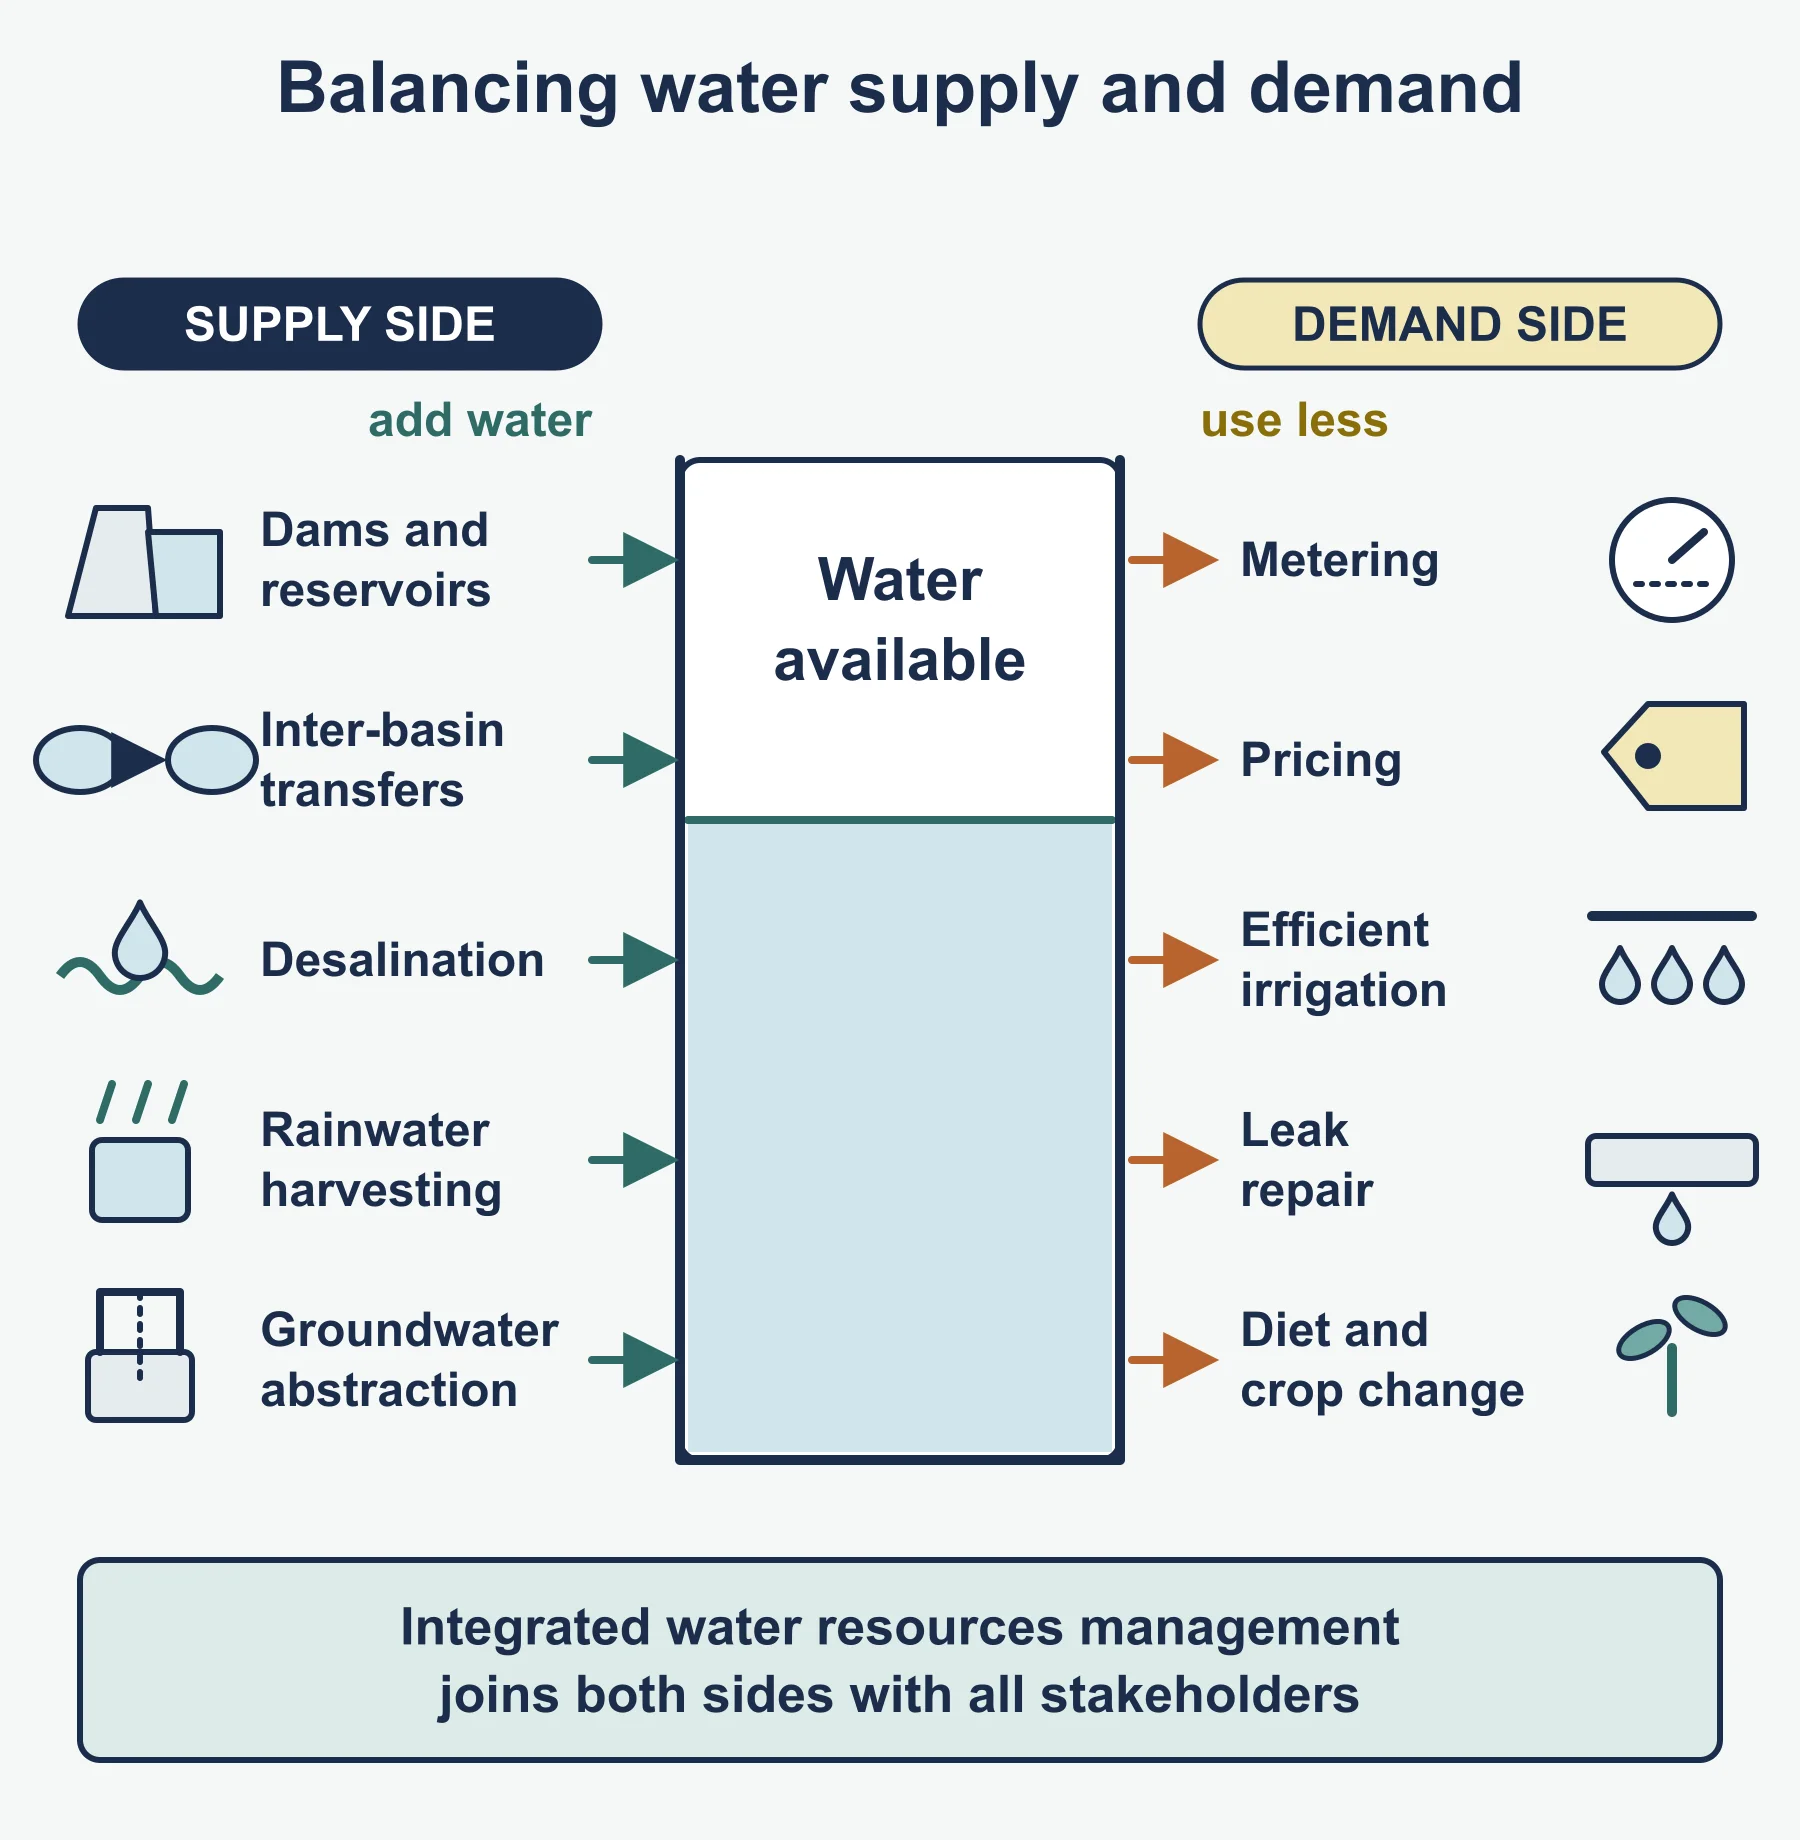
The final strand asks you to evaluate strategies for an uncertain future. Supply-side approaches include dams and reservoirs, inter-basin transfers, desalination, rainwater harvesting and groundwater abstraction. Demand-side approaches include metering, pricing, efficient irrigation, leak repair and changing diets and crops. Integrated water resources management brings these together with stakeholders such as governments, farmers, industries, communities, non-governmental organisations and international bodies.
Think about sustainability. Does a strategy meet today’s needs without compromising future supply? Does it share costs and benefits fairly? Climate change adds uncertainty through shifts in rainfall, glacier and snowpack loss and more intense extremes. Strong responses weigh trade-offs, for example a reservoir that secures supply but displaces communities and changes downstream ecology.
Worked examples
Example 1: a water balance
An illustrative basin receives 920 mm of precipitation in a year. Measured discharge is equivalent to 410 mm of runoff and evapotranspiration is estimated at 480 mm. Find the change in storage and the runoff ratio.
- Change in storage = P - Q - E = 920 - 410 - 480 = 30 mm. This is a positive change, so soil moisture or groundwater increased.
- Runoff ratio = Q / P = 410 / 920 = 0.446, or about 44.6 per cent.
If a neighbouring urbanised basin had a runoff ratio of 0.65, you could conclude that more of its rainfall leaves as quick flow, which raises flood risk.
Example 2: lag time
On a hydrograph, rainfall peaks at 06:00 and discharge peaks at 10:30. Lag time = 10:30 - 06:00 = 4 hours 30 minutes, or 4.5 hours. If after clearing woodland and building drains the peak occurs at 08:00, the lag time falls to 2 hours, showing a faster response.
Common mistakes
- Describing a hydrograph without using data; always quote values, units and times from the graph.
- Treating all floods as purely natural; examiners reward discussion of human contribution.
- Confusing water stress, scarcity and quality, which are different measurable ideas.
- Listing management strategies without evaluating who gains and who loses.
- Writing about a place in vague terms. If you cannot recall exact details, give a clearly general account rather than inventing figures.
Exam technique
IB command terms matter. Describe asks for a detailed account, explain asks for reasons or causes, compare requires similarities and differences expressed together, evaluate requires a balanced judgement of strengths and limitations, and discuss asks for a range of arguments with a conclusion. For extended responses, plan a short structure, define key terms, use a located example, and finish with a supported conclusion. Always apply the specific resource or case given in the question stem.
Check your understanding
- Define a drainage basin and name its input and two outputs. Answer: the area drained by a river and its tributaries; input is precipitation; outputs include evapotranspiration and discharge to the sea.
- A basin has P = 1,100 mm, Q = 520 mm and E = 540 mm. What is the change in storage? Answer: 1,100 - 520 - 540 = 40 mm, a store increase.
- State two features of a flashy hydrograph. Answer: short lag time and steep rising limb with high peak.
- Give two human factors that can increase flood risk. Answer: for example urbanisation and deforestation.
- Contrast hard and soft flood engineering in one sentence. Answer: hard engineering uses built structures to contain or divert water, whereas soft engineering works with natural processes or land management to reduce risk.
- What is virtual water? Answer: the water used to produce a traded good, embedded in that product.
- Outline how eutrophication reduces oxygen. Answer: nutrients trigger algal blooms; the algae die and decompose, and bacteria consume dissolved oxygen.
- Why might a water management strategy be judged unsustainable? Answer: it may deplete resources faster than they recharge, impose unfair costs or damage ecosystems, undermining future supply.
Get free revision emails (optional)
Occasional emails with practice questions, worked explanations and links to free resources for the qualification and subjects you choose. No spam, and you can unsubscribe from any email. The free tools on this site never need an email.
Related resources
-
Study guides
IB DP Geography: Option D: Geophysical hazards – Study Guide
A study guide to the Geophysical hazards option in IB DP Geography: tectonic systems, hazard risk, vulnerability and the adaptation needed for future resilience.
Geography · International Baccalaureate · IB
Read guide -
Study guides
IB DP Geography: Unit 3: Global resource consumption and security – Study Guide
A study guide to Global resource consumption and security in IB DP Geography: trends in consumption, their impacts, and resource stewardship.
Geography · International Baccalaureate · IB
Read guide -
Study guides
IB DP Geography: Unit 6: Global risks and resilience – Study Guide
Geopolitical, economic and environmental risks, and local and global resilience, as studied in the Higher Level extension of IB Diploma Programme Geography.
Geography · International Baccalaureate · IB
Read guide
Related articles
-
teaching
A Level tuition in Dubai: Cambridge or Pearson Edexcel International A Level?
Schools in Dubai and Abu Dhabi teach either Cambridge International AS & A Level or Pearson Edexcel International A Level. How the two are structured, why it matters for tuition, and how online classes from Lahore work.
9 October 2026
-
curriculum guides
Choosing subjects at IGCSE and A Level
How subject choices at 14 and 16 affect university options later, and how to keep pathways open without overloading a timetable.
28 July 2026
Studying this with a teacher
Working through Geography IB?
This page is free and stays free. Marlbridge is not offering Geography classes at the moment, so there is no tuition to book for it. The free study resources stay open to everyone.