
Study Guides
IB DP Geography: Option F: Food and health – Study Guide
A study guide to the Food and health option in IB DP Geography: measuring food and health, food systems and disease, stakeholders, and future security.
- Subject
- Geography
- Level
- IB
- Topic
- Topic 6: Option F: Food and health
- Author
- Marlbridge Academic Team
- Updated
- Reviewed by
- Azam Siddique (what this means)
Aligned to International Baccalaureate IB Diploma Programme Geography (DP Geography), First assessments 2019. Official specification .
Syllabus page (what it covers and how it is assessed): IB Diploma Programme Geography.
Syllabus points this page covers
DP Geography
- 6.1 Measuring food and health
- 6.2 Food systems and spread of diseases
- 6.3 Stakeholders in food and health
- 6.4 Future health and food security and sustainability
This page covers all 4 subtopics recorded here in topic 6, Option F: Food and health.
Food and health is one of the teacher-selected options in the geographic themes part of IB Diploma Programme Geography. It asks how food supply and health can be measured, how food systems and disease patterns connect, who the key stakeholders are and how food security and health may be sustained in future. Confirm with your teacher that your school teaches it. The IB DP Geography syllabus guide explains how options relate to the core, and the Global Climate core guide is useful for climate effects on food.
Where this fits in the course
Options are assessed in Paper 1. Questions often supply data such as maps of undernutrition or tables of health indicators, so you need to read data accurately and comment on its limitations. As elsewhere, use real examples you understand well, and if you do not recall exact statistics, describe the pattern without inventing numbers.
6.1 Measuring food and health
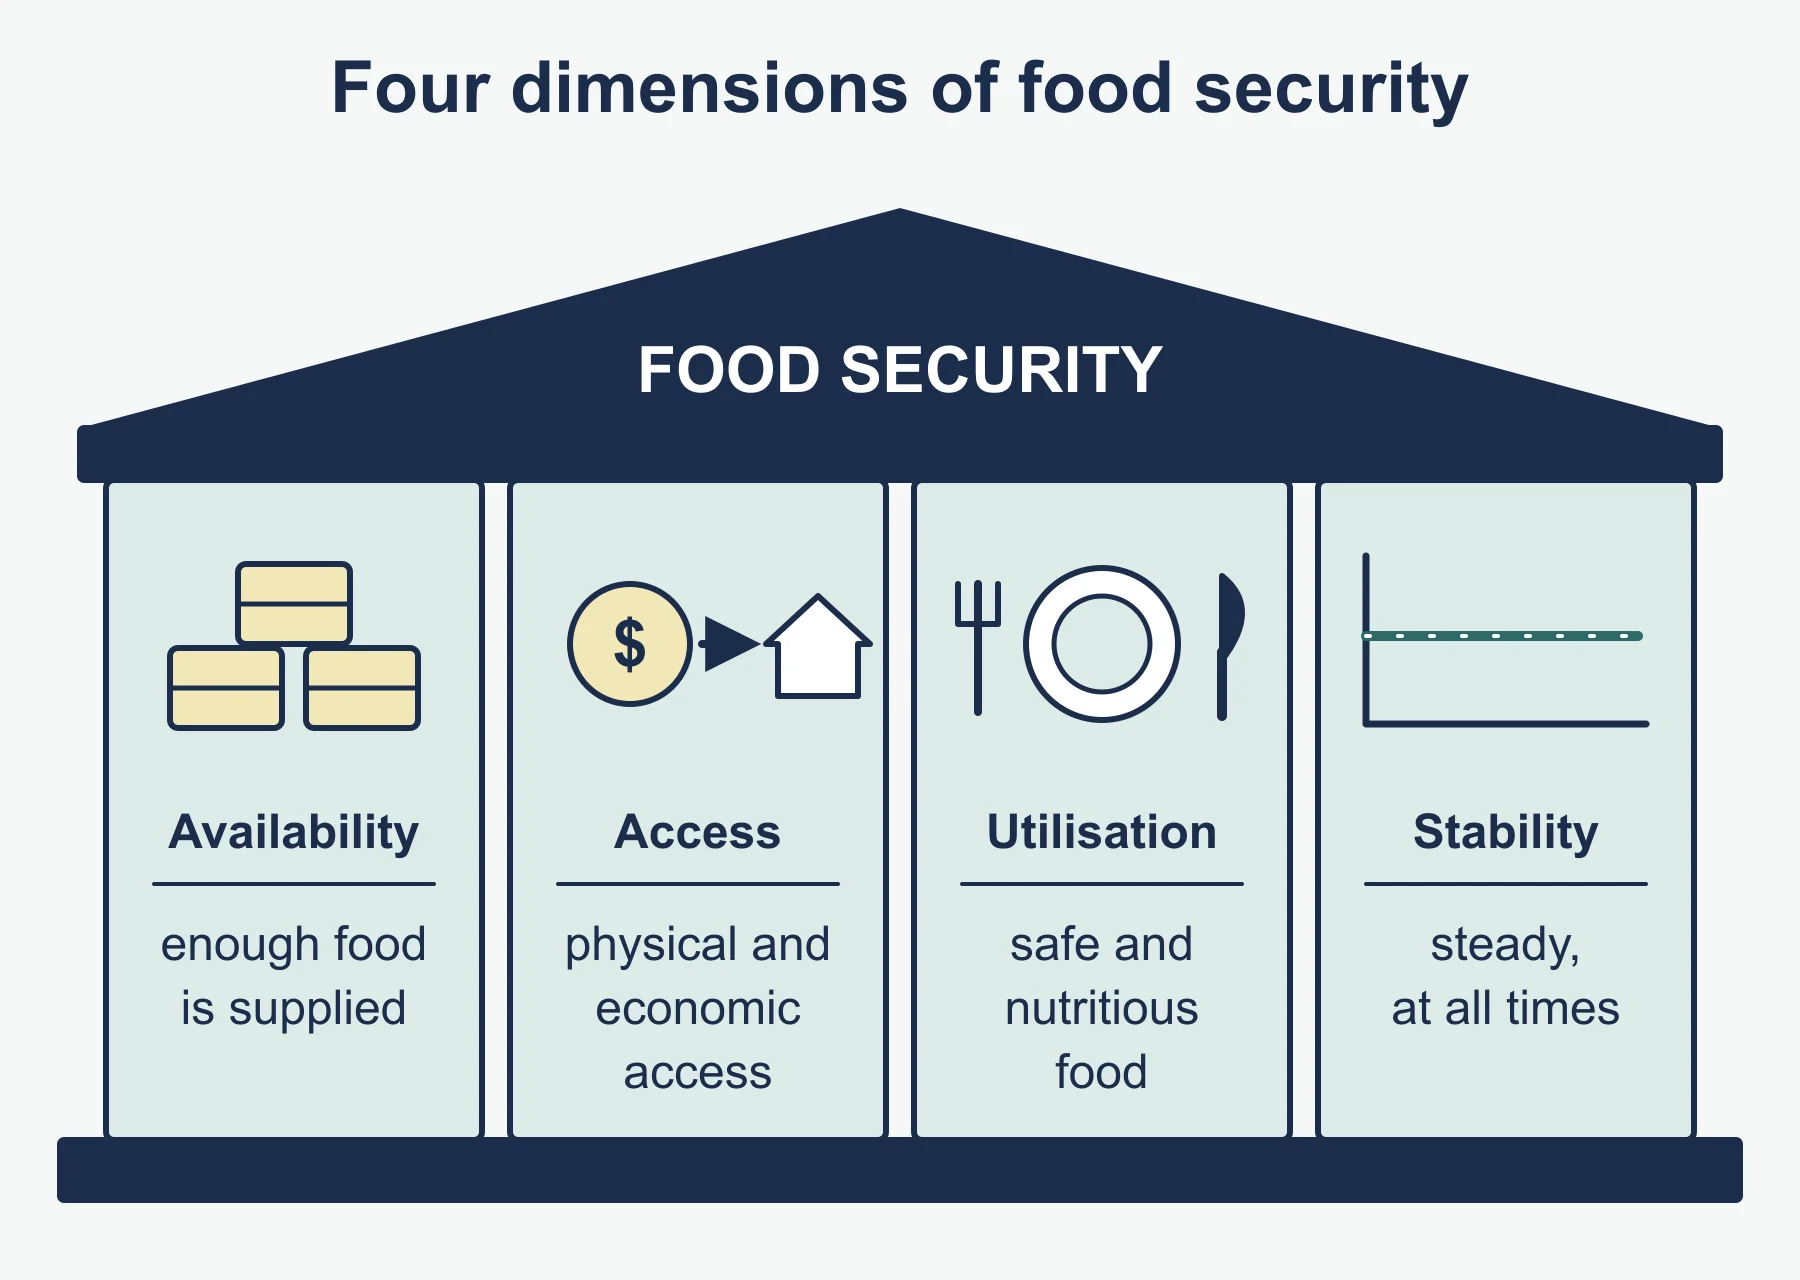
Food security exists when all people at all times have physical and economic access to enough safe and nutritious food for an active, healthy life. It has several dimensions: availability, access, utilisation and stability. Undernutrition, malnutrition (which includes both too little and too much food, or poor-quality diets) and obesity can be examined at different scales.
Common measures include:
- Calorie supply per person per day, and the prevalence of undernourishment (share of the population with insufficient dietary energy).
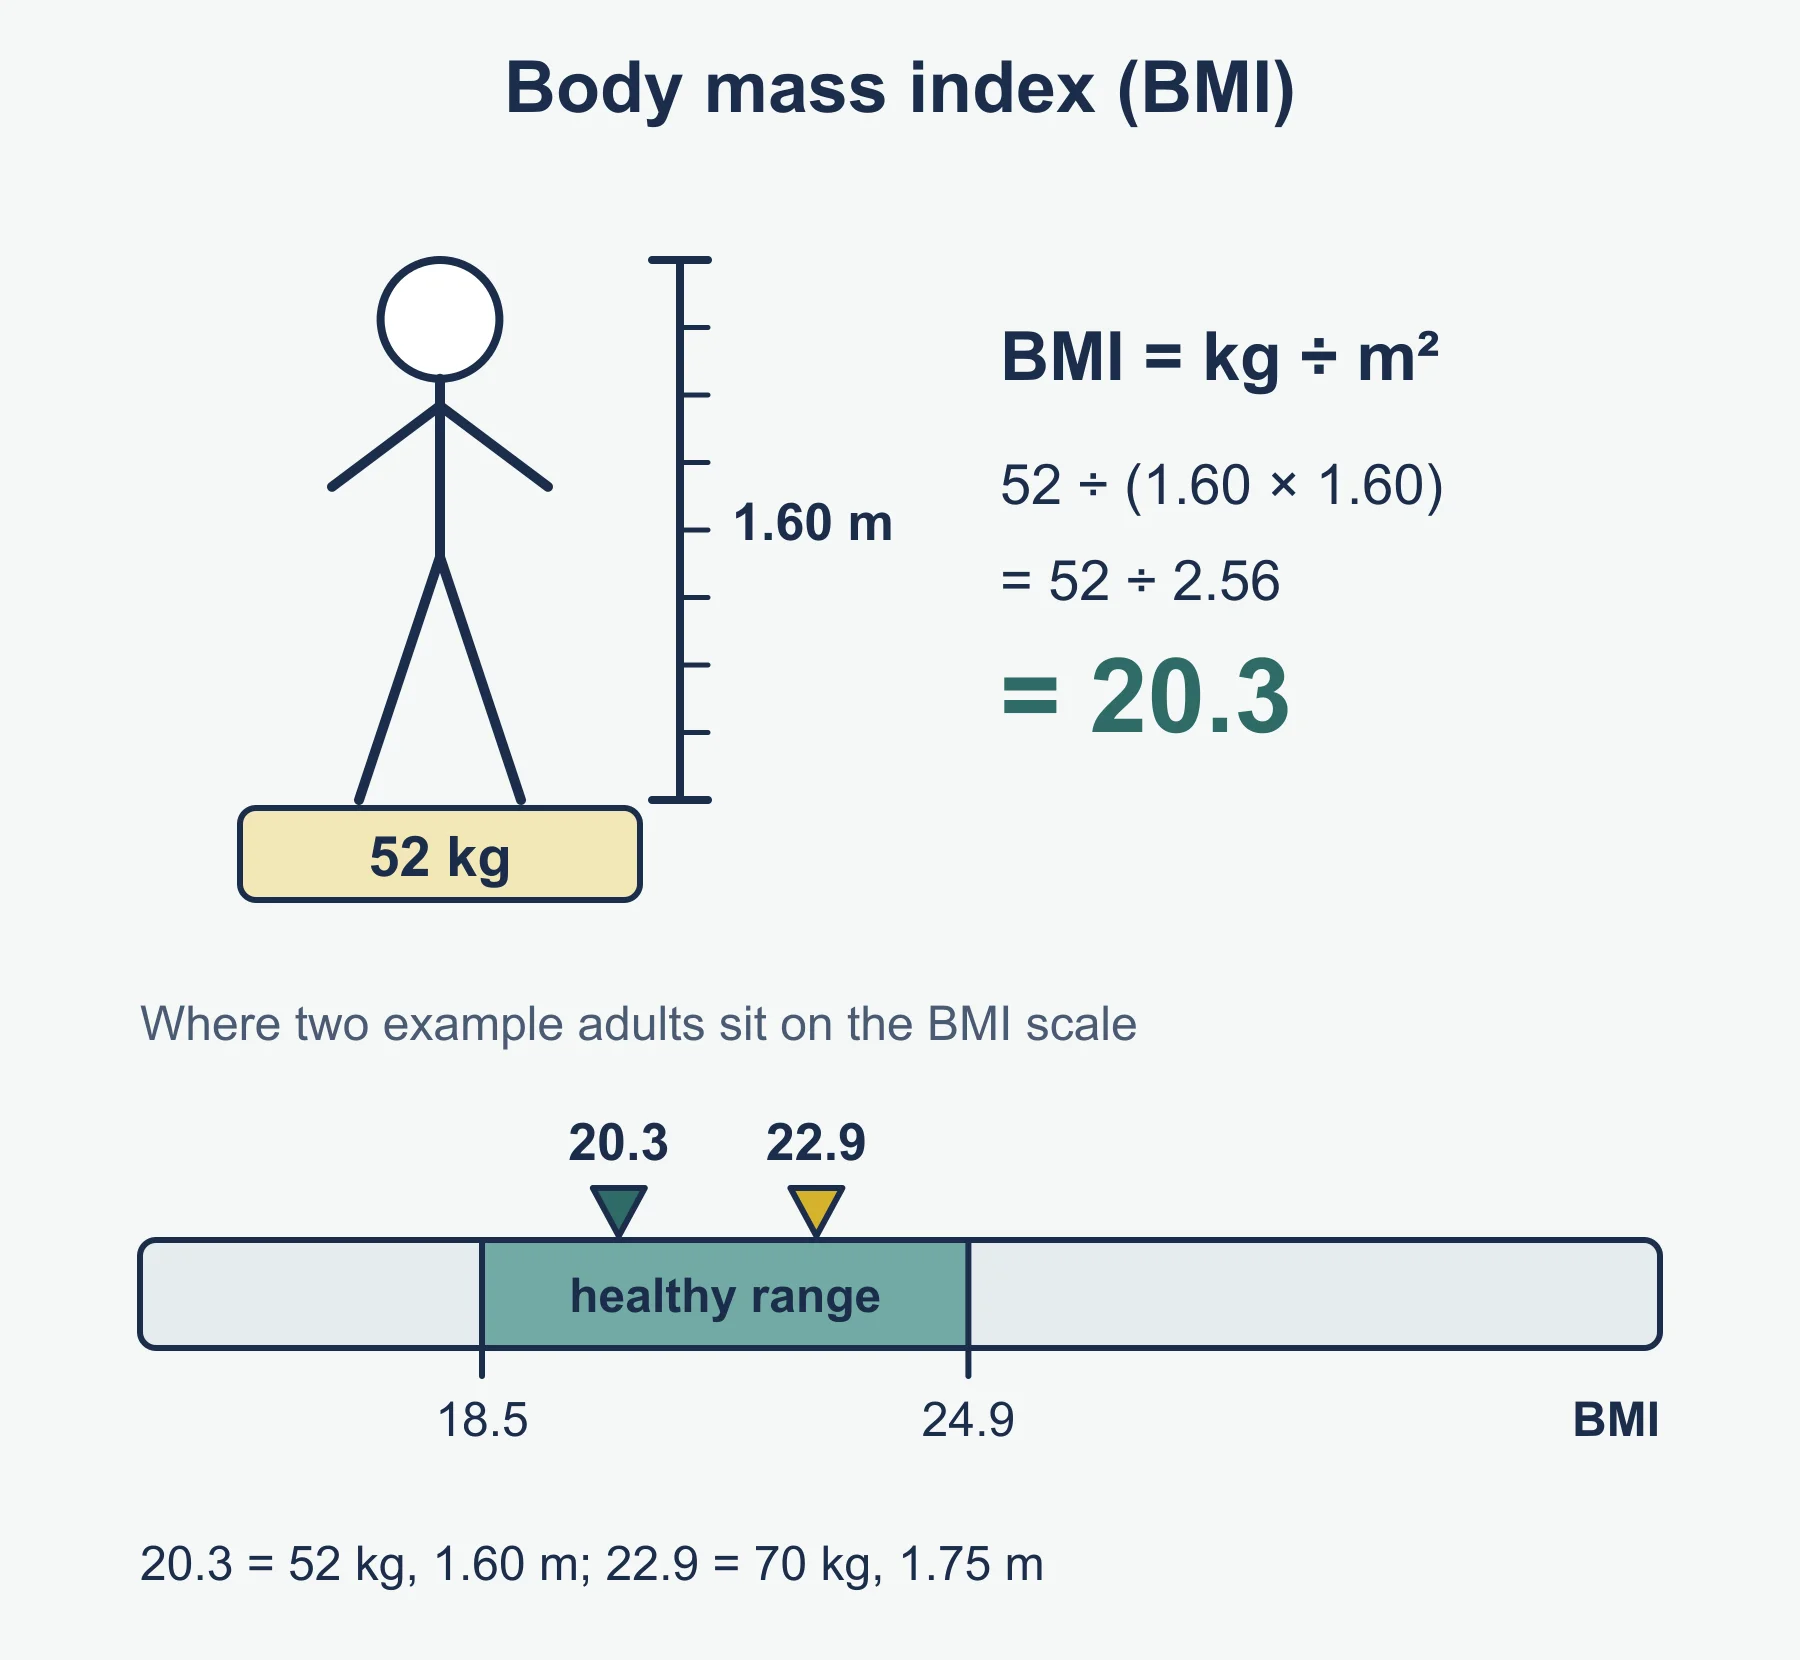
- Anthropometric indicators: stunting (low height for age), wasting (low weight for height) and body mass index (BMI = weight in kg divided by height in metres squared).
- Composite indices of hunger that combine several indicators.
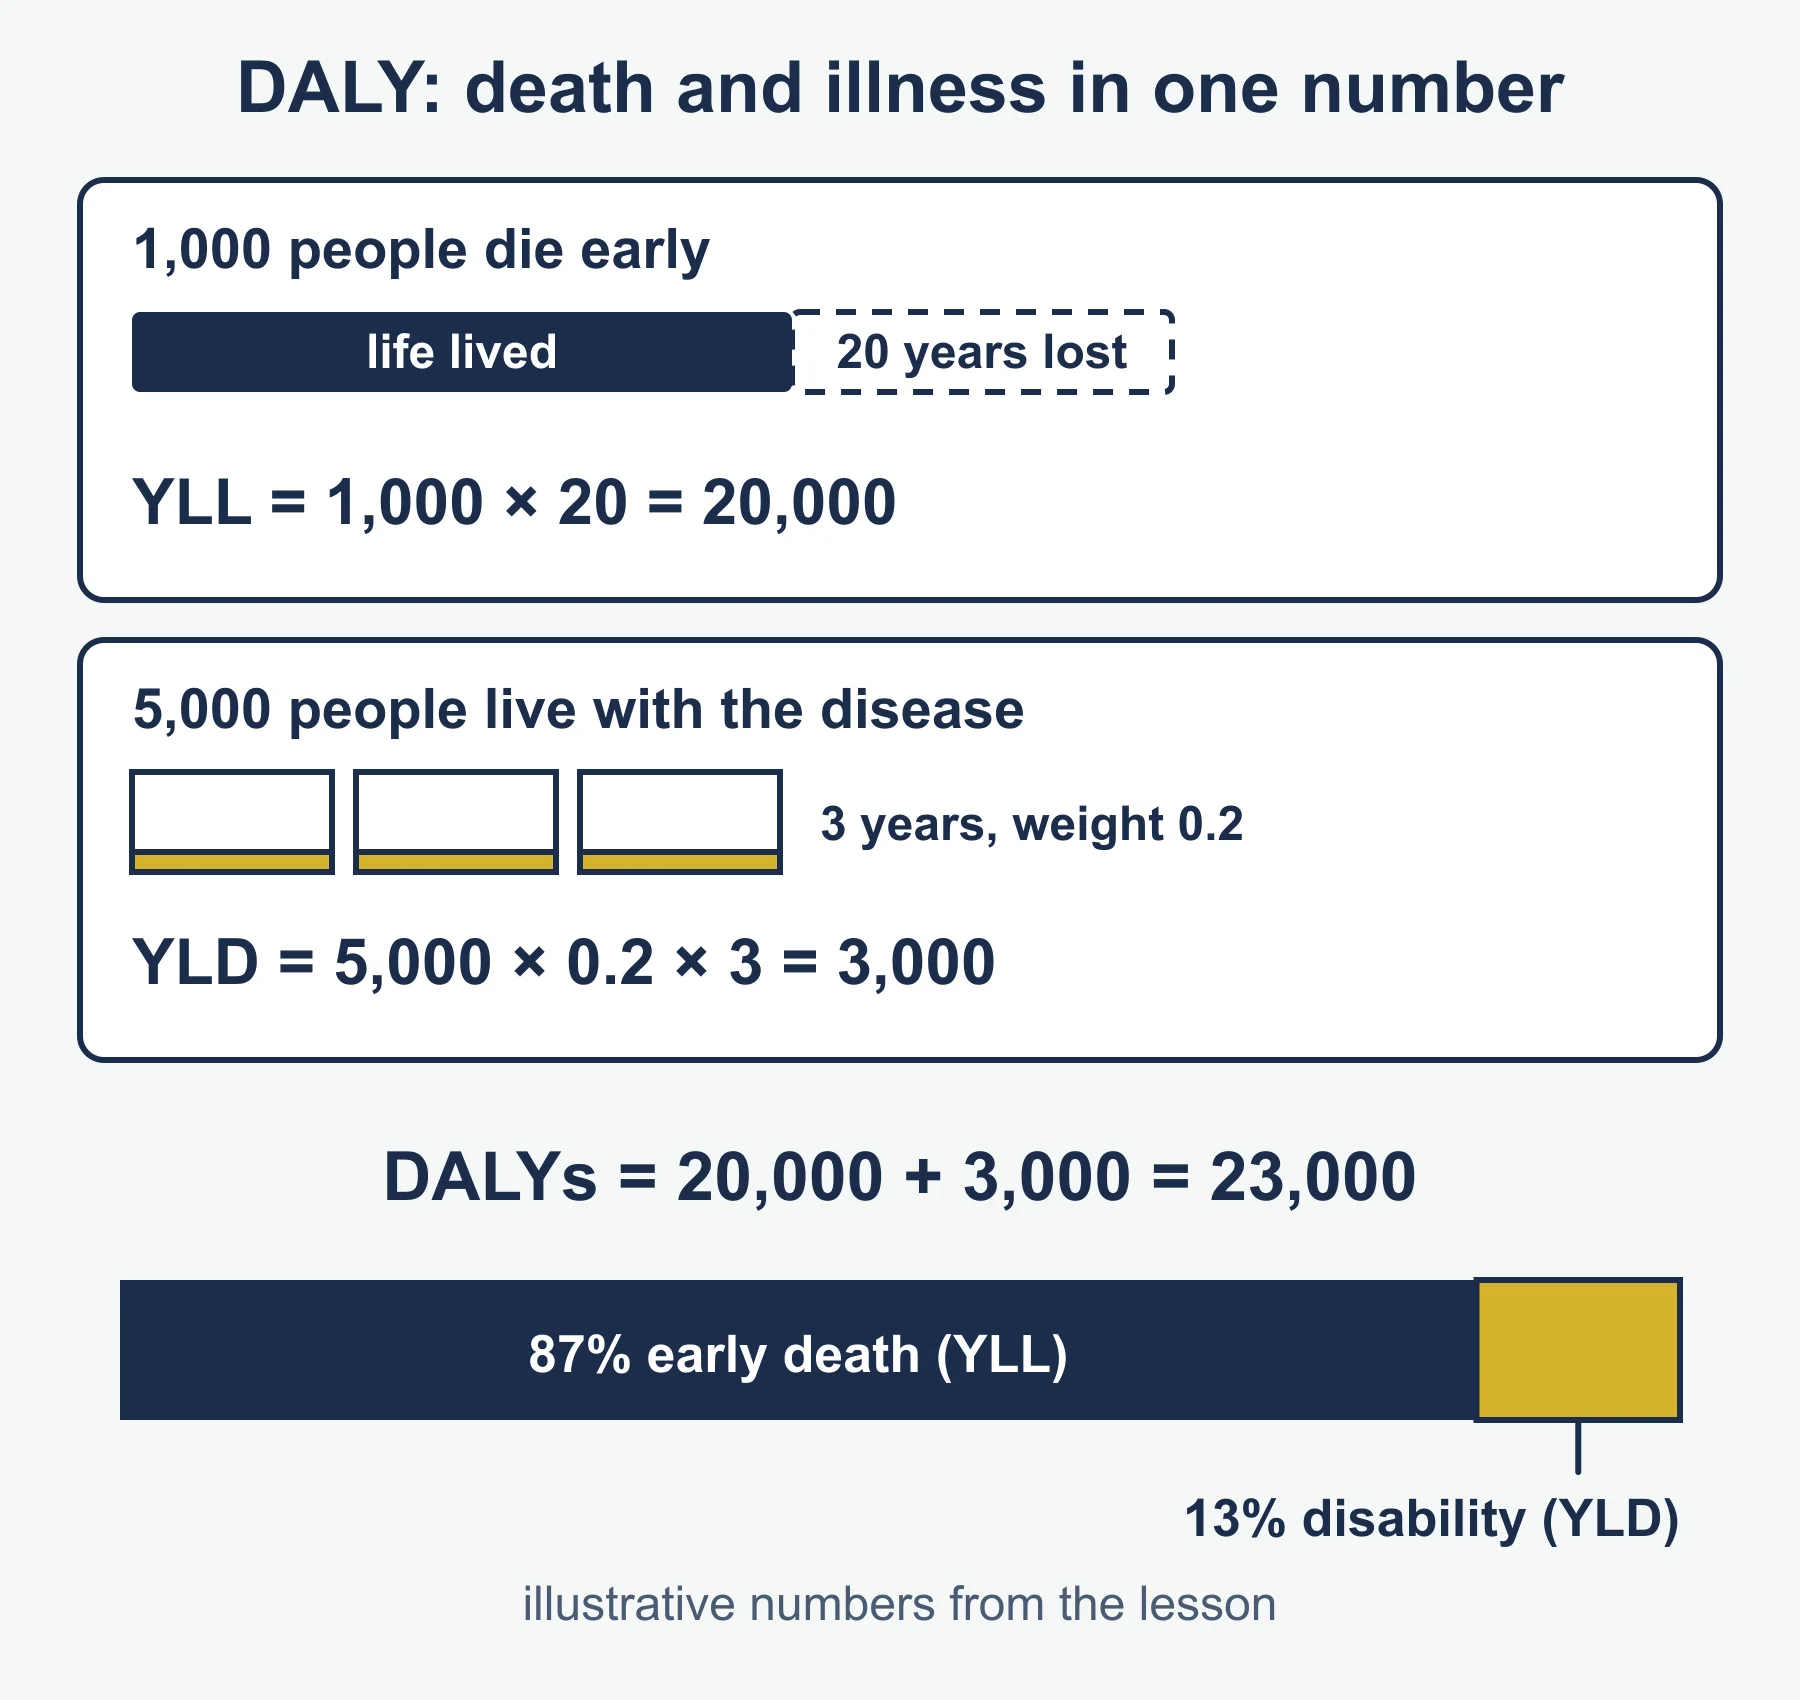
- Health measures: life expectancy, infant and under-five mortality, maternal mortality, disease incidence and prevalence, and disability-adjusted life years (DALYs), which combine years of life lost to early death with years lived with disability.
Each measure has strengths and weaknesses. National averages hide inequality between regions, income groups and genders. Data quality varies and definitions differ, so compare cautiously. Include the idea of the nutrition transition, in which diets shift towards more processed foods, fats and sugar as incomes and urbanisation rise, increasing obesity and diet-related non-communicable disease alongside, in some places, continuing undernutrition.
6.2 Food systems and spread of diseases
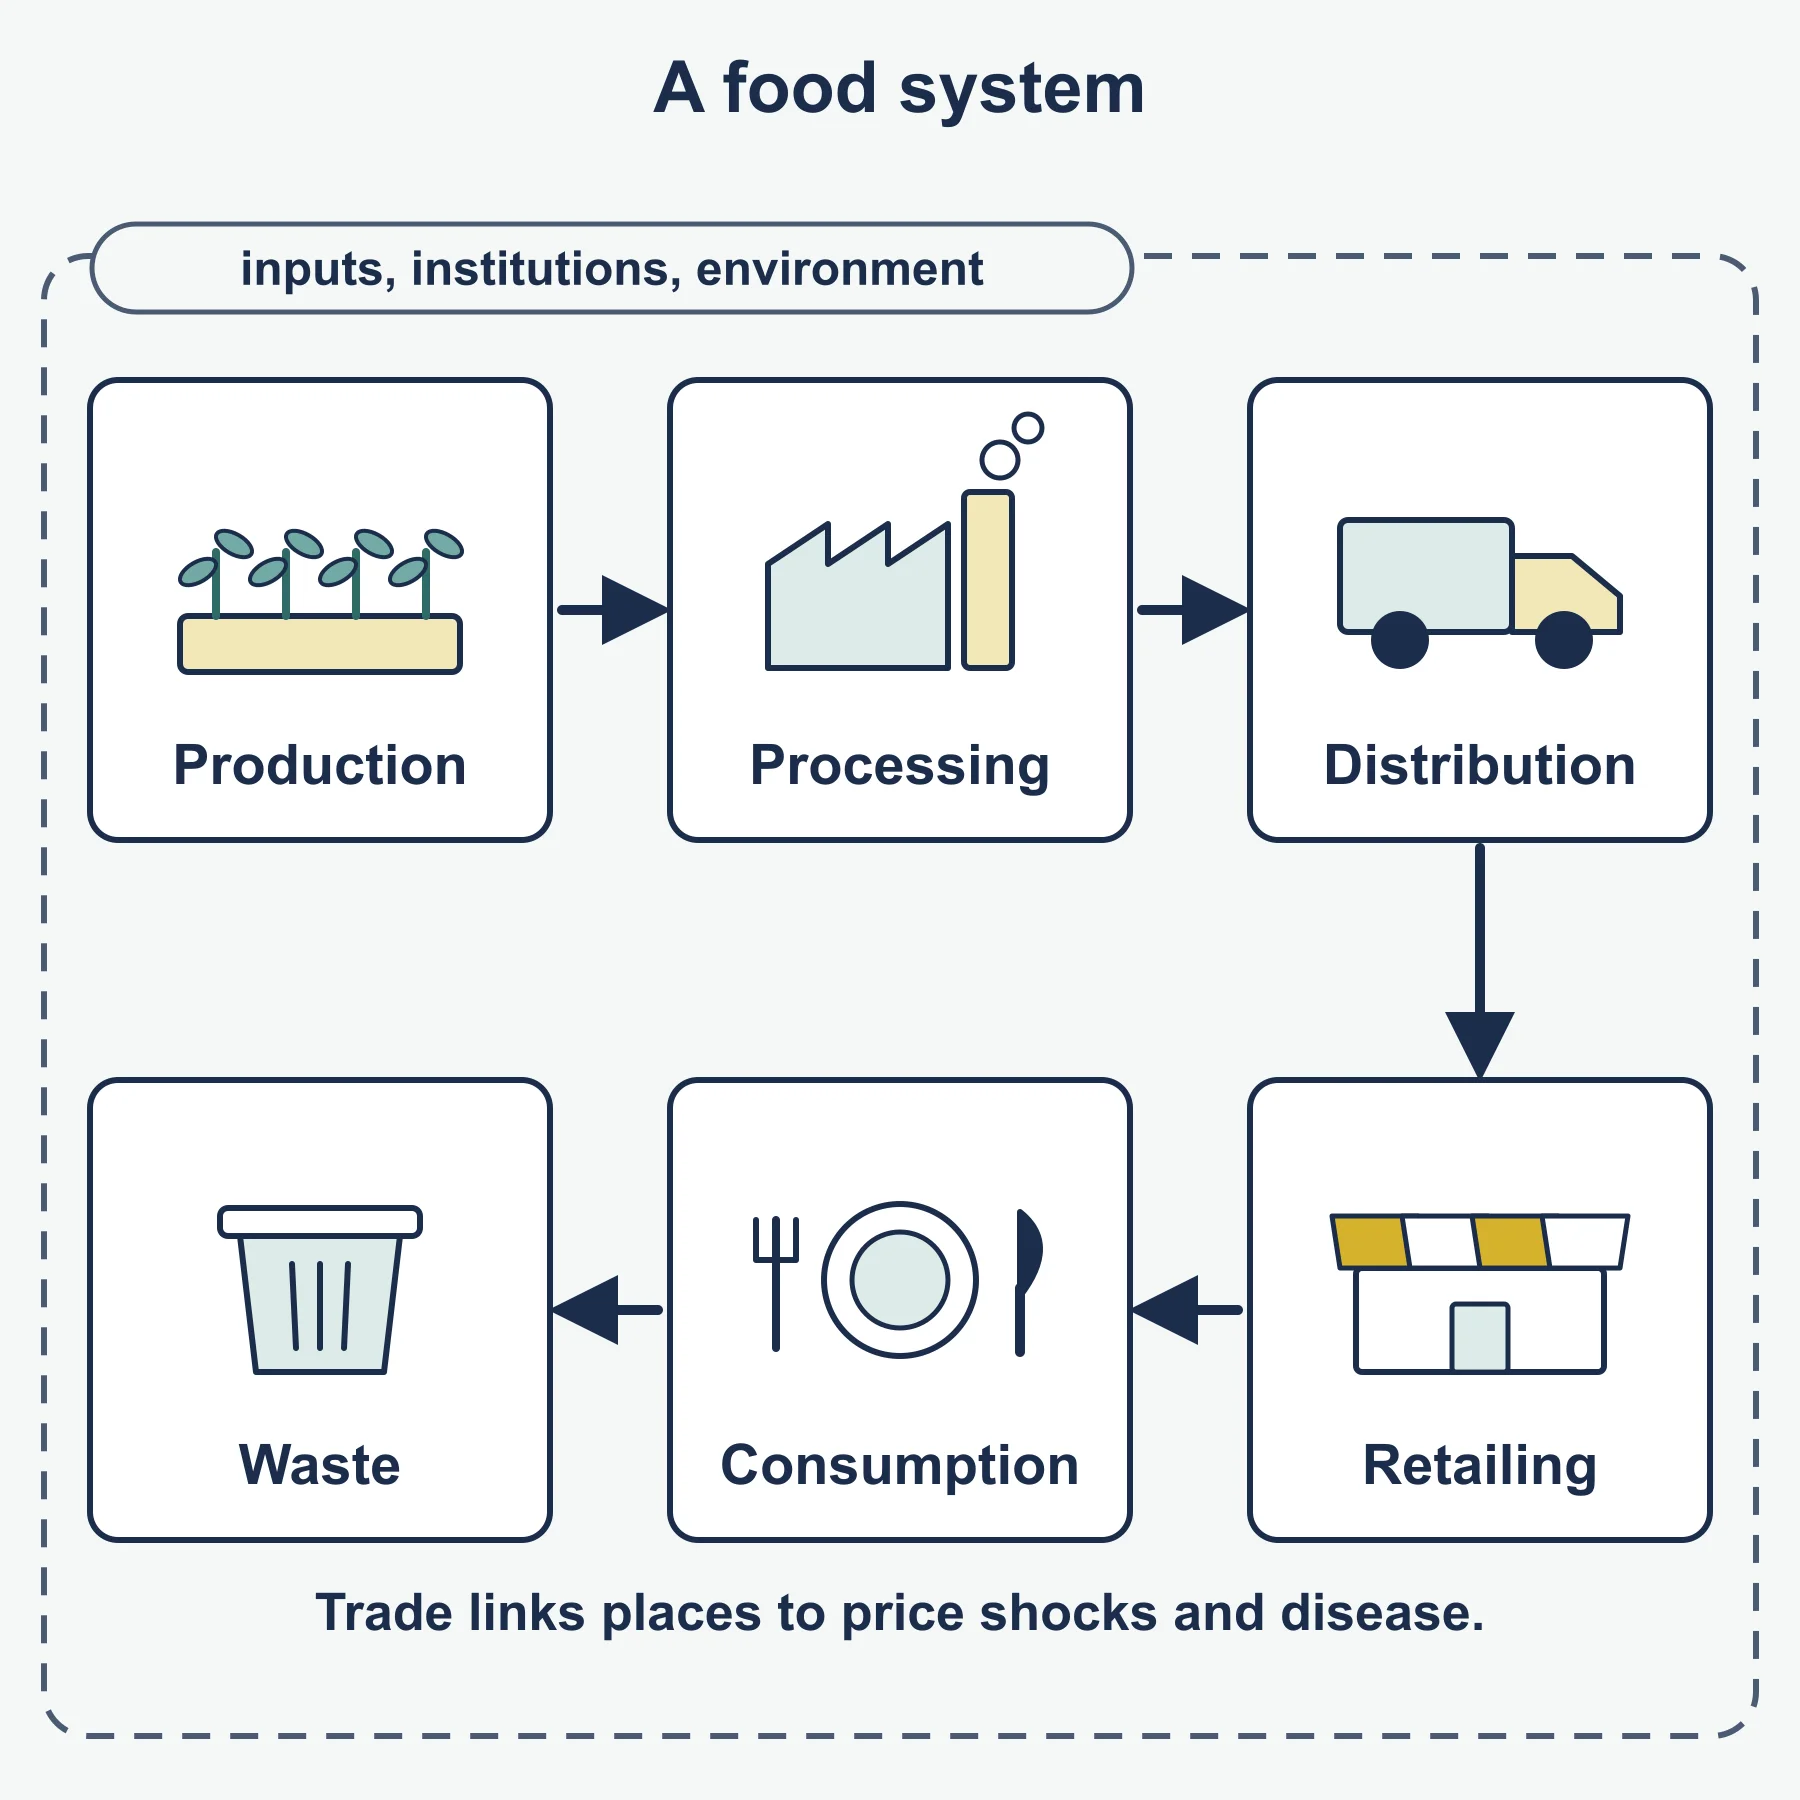
A food system includes production, processing, distribution, retailing, consumption and waste, together with the inputs, institutions and environment that surround them. Systems differ: subsistence farming, commercial agriculture, industrialised livestock production and globalised supply chains. Trade and transport allow supply across the world, but they also link places in vulnerability to price shocks and disease.
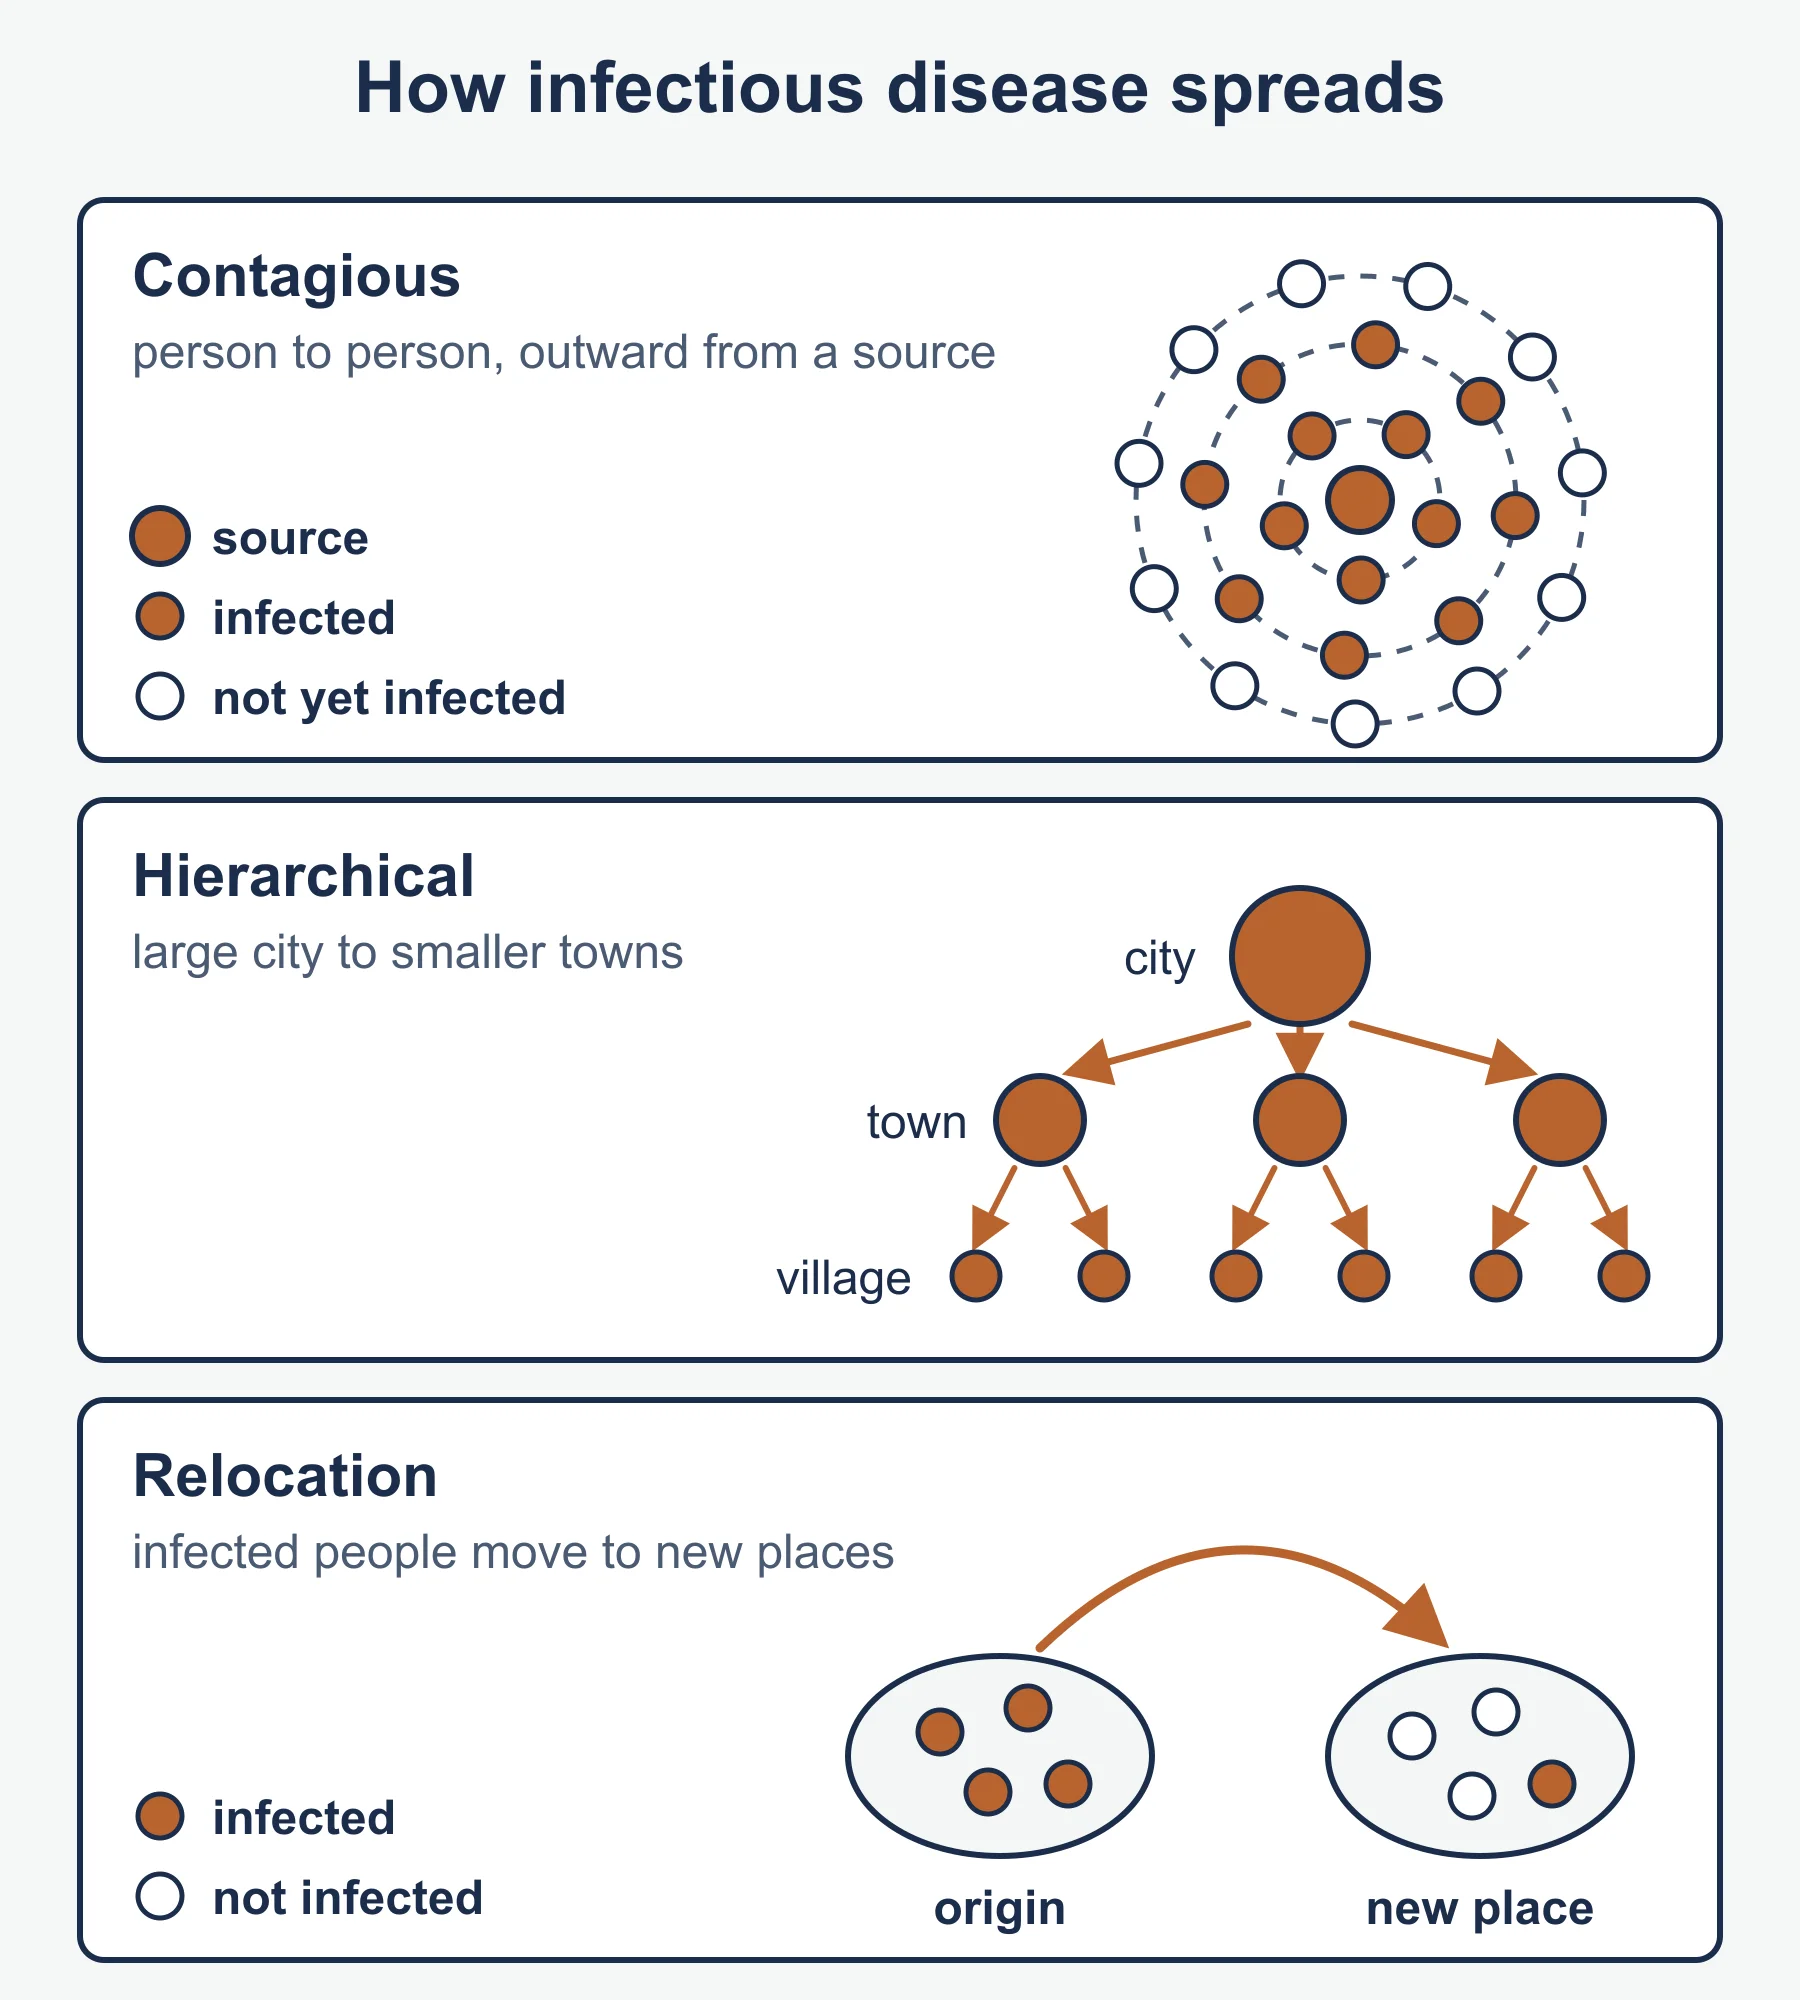
Disease can be classified as communicable (infectious) or non-communicable. Spread of infectious disease can occur by contagious diffusion (person to person through contact), hierarchical diffusion (through settlement networks, for example from large cities to smaller towns) and relocation diffusion (movement of infected people to new places). Air travel can accelerate the spread. Vector-borne diseases, such as malaria, depend on environmental conditions that support the vector, so climate and land use matter. Water-borne diseases such as cholera relate to sanitation and safe drinking water.
Links between food and disease run both ways. Poor nutrition weakens immunity, so infection becomes more severe. Livestock and wildlife contacts can produce zoonotic disease. Food contamination causes illness, and intensive farming raises concerns about antimicrobial resistance. On the other side, diet-related non-communicable diseases such as type 2 diabetes and heart disease are growing in many countries. The epidemiological transition describes how the main causes of death shift from infectious disease towards chronic disease as development proceeds, though many countries experience both at once.
6.3 Stakeholders in food and health
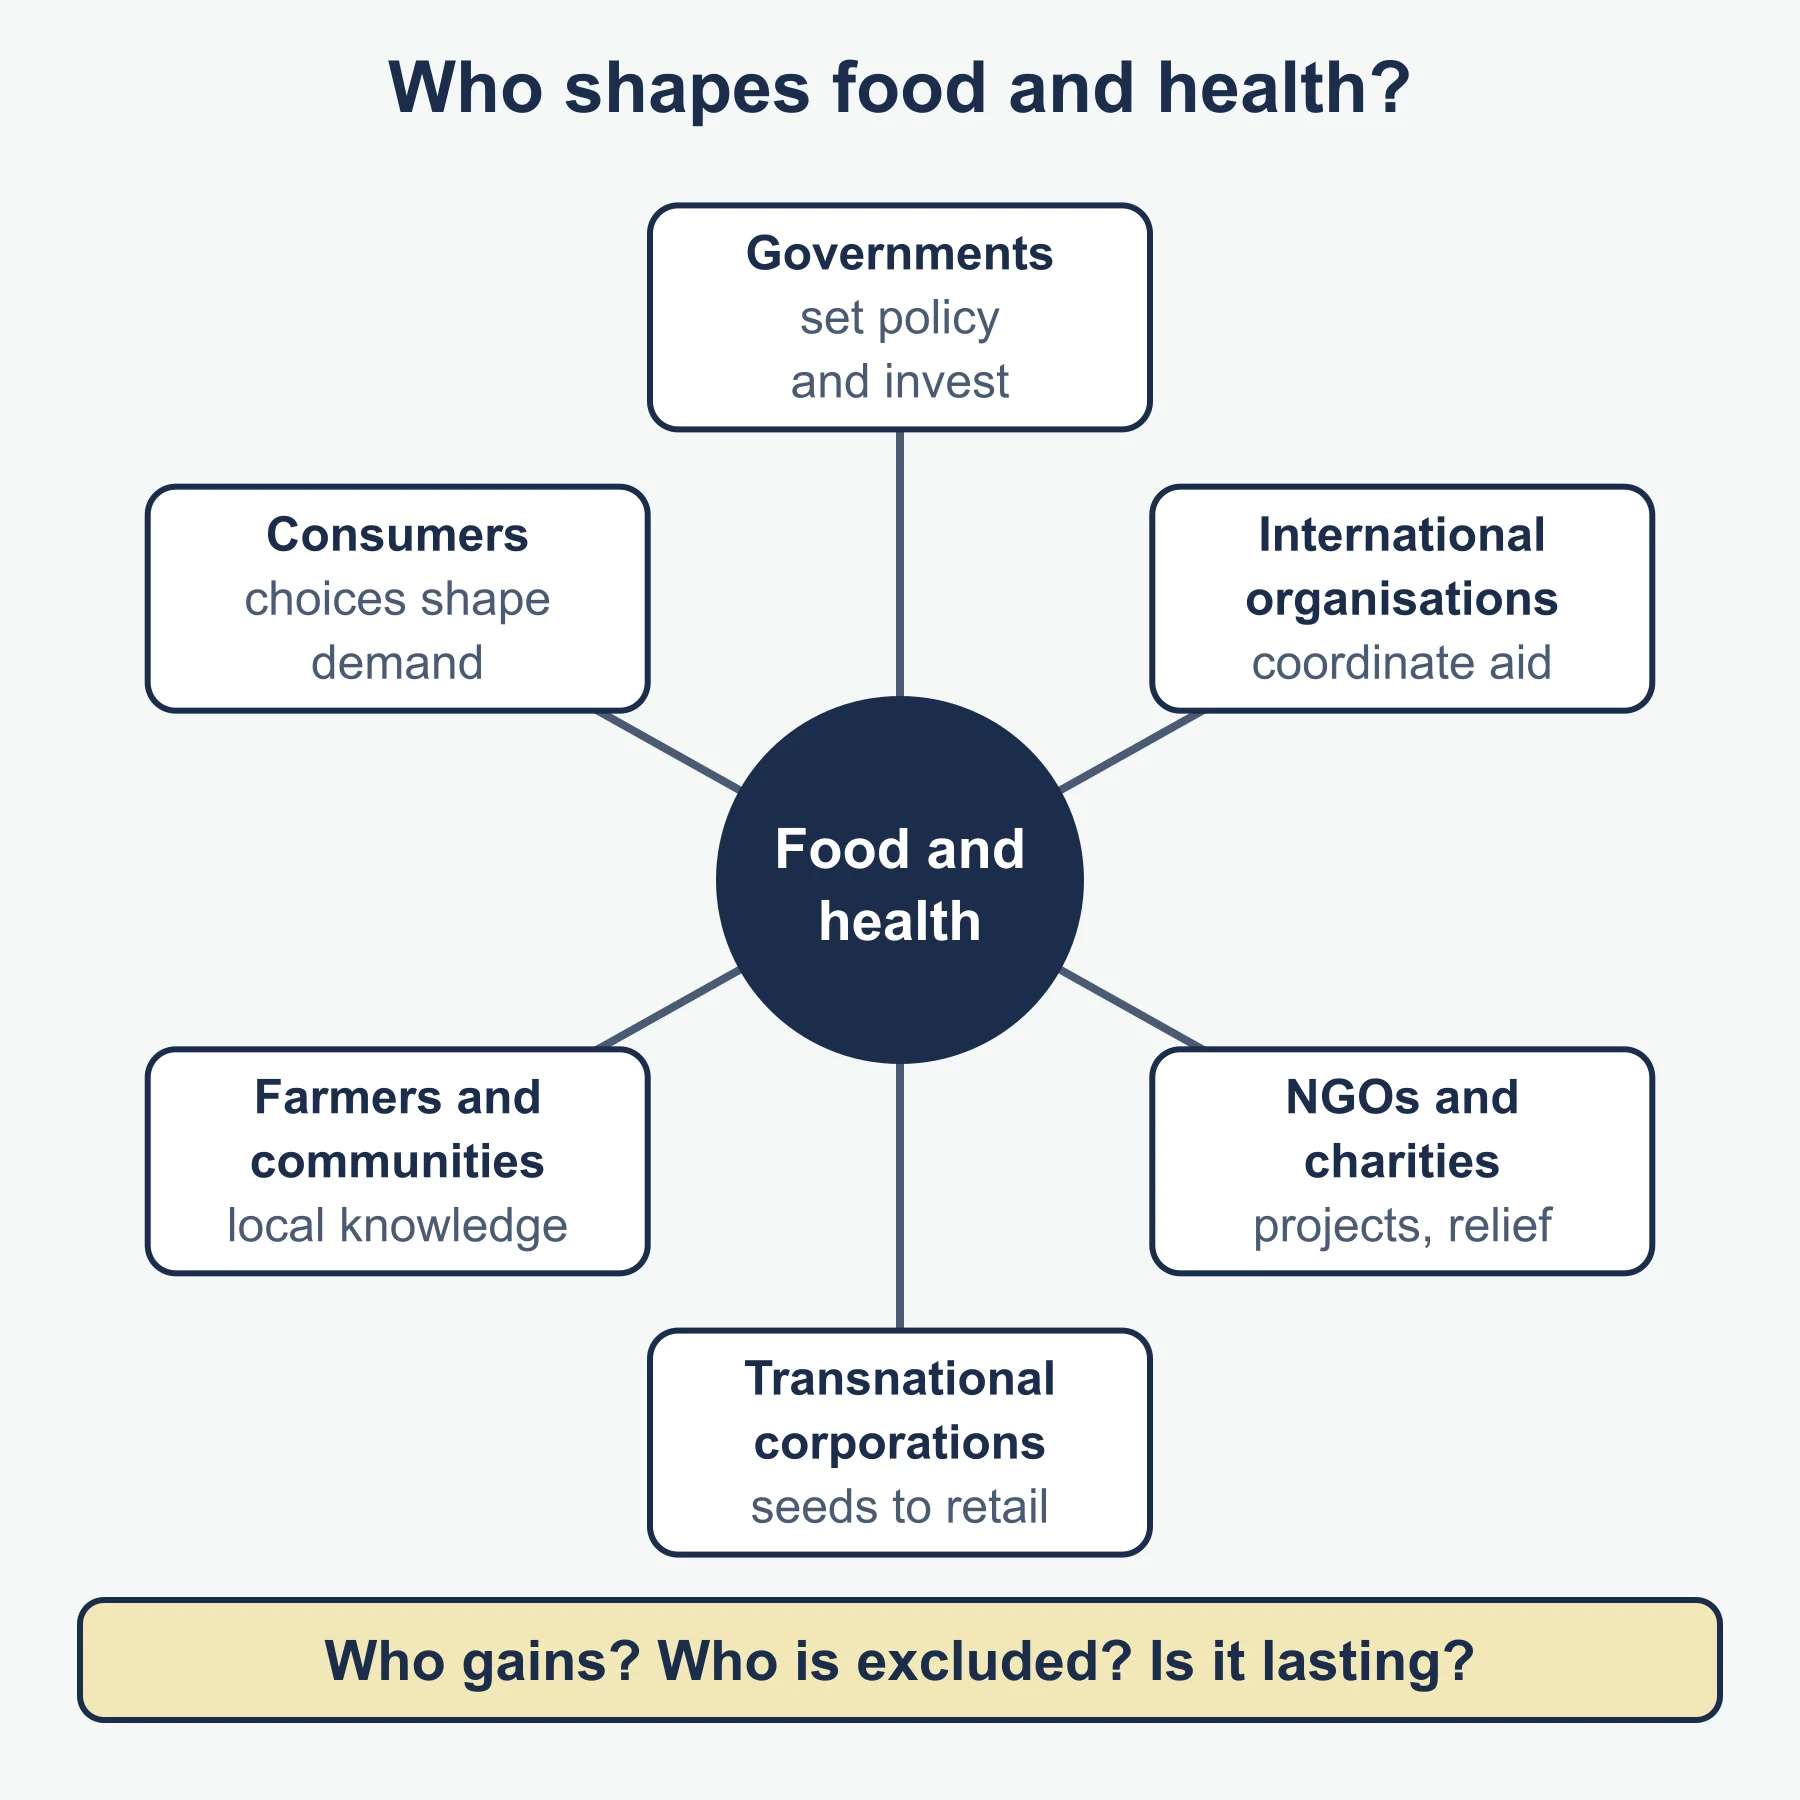
Stakeholders operate at scales from household to global. Think about:
- Governments, which set agricultural, trade, health and nutrition policy and invest in infrastructure.
- International organisations, such as agencies of the United Nations, that coordinate responses, set standards and provide emergency aid.
- Non-governmental organisations and charities, which deliver projects, advocacy and relief.
- Transnational corporations in seeds, fertiliser, food processing, retail and pharmaceuticals.
- Farmers and communities, who produce food and have local knowledge.
- Consumers, whose choices influence demand.
Strategies include agricultural innovation (the Green Revolution style of high-yield seeds, fertiliser and irrigation), genetically modified crops, improved storage and transport to cut post-harvest loss, nutrition programmes, vaccination campaigns, primary health care and clean water and sanitation. Each approach brings trade-offs. High-input agriculture can raise yields but cause pollution and cost small farmers; aid can save lives but risks dependency if not linked to local capacity. Evaluate by asking who gains, who is excluded and whether the approach is lasting.
6.4 Future health and food security and sustainability
Looking ahead, pressures include population growth, rising demand for animal products, climate change affecting yields and water, soil degradation, biofuel competition for land and conflicts and price volatility. Health challenges include emerging and re-emerging disease, antimicrobial resistance, ageing, and the burden of non-communicable disease.
Sustainable options include sustainable intensification, agroecology, reducing food waste, changing diets, protecting soils and water, improving crop resilience and strengthening local and regional food systems. The idea of resilience applies: can systems absorb shocks such as drought or a pandemic? Think also about governance: international agreements, trade rules and investment priorities will shape outcomes. Strong answers consider uncertainty and recognise that solutions differ by context.
Worked examples
Example 1: BMI and prevalence
An adult weighs 52 kg and is 1.60 m tall.
- BMI = 52 / (1.60 x 1.60) = 52 / 2.56 = 20.3 (rounded to one decimal place).
A commonly used adult range for a healthy BMI is 18.5 to 24.9, so this value falls within it. Now consider a fictional country of 120 million people in which 14.4 million are undernourished.
- Prevalence = 14.4 / 120 x 100 = 12 per cent.
Example 2: a simple DALY calculation
For an illustrative disease in a region in one year, 1,000 people die early, each losing on average 20 years of life. In addition, 5,000 people live with the disease for 3 years each with a disability weight of 0.2.
- Years of life lost (YLL) = 1,000 x 20 = 20,000.
- Years lived with disability (YLD) = 5,000 x 0.2 x 3 = 3,000.
- DALYs = 20,000 + 3,000 = 23,000.
This shows how DALYs combine early death and illness in one measure, and that most of the burden in this case comes from premature mortality.
Common mistakes
- Treating hunger and malnutrition as identical.
- Using national averages as if everyone in a country is the same.
- Describing disease spread without naming the diffusion type.
- Assuming one technology, such as GM crops, is simply good or bad.
- Neglecting both ends of malnutrition: undernutrition and obesity.
Exam technique
Use command terms carefully. Describe a pattern from a map by quoting values and noting anomalies, explain by giving causes, and evaluate by weighing strategies against criteria such as effectiveness, cost, equity and sustainability. For data questions, mention limits such as quality and averaging. Where a place is required, give a located example in general but accurate terms.
Check your understanding
- State the four dimensions of food security. Answer: availability, access, utilisation and stability.
- Calculate the BMI of a person with mass 70 kg and height 1.75 m. Answer: 70 / 3.0625 = 22.9.
- Distinguish contagious from hierarchical diffusion. Answer: contagious spreads by contact outward from a source; hierarchical spreads down a ranked network such as city to town.
- What does a DALY combine? Answer: years of life lost to early death and years lived with disability.
- What is the nutrition transition? Answer: a shift to more processed, fat- and sugar-rich diets as incomes and urbanisation rise.
- Give one benefit and one drawback of high-yield farming inputs. Answer: higher yields; pollution or costs for small farmers.
- Name two stakeholders in global health. Answer: for example UN agencies and non-governmental organisations.
- Why can national average data mislead? Answer: it hides inequality between groups and regions.
Get free revision emails (optional)
Occasional emails with practice questions, worked explanations and links to free resources for the qualification and subjects you choose. No spam, and you can unsubscribe from any email. The free tools on this site never need an email.
Related resources
-
Study guides
IB DP Geography: Option A: Freshwater – Study Guide
A study guide to the Freshwater option in IB DP Geography: drainage basins, flooding, water scarcity and quality, and how water might be managed in future.
Geography · International Baccalaureate · IB
Read guide -
Study guides
IB DP Geography: Option D: Geophysical hazards – Study Guide
A study guide to the Geophysical hazards option in IB DP Geography: tectonic systems, hazard risk, vulnerability and the adaptation needed for future resilience.
Geography · International Baccalaureate · IB
Read guide -
Study guides
IB DP Geography: Unit 3: Global resource consumption and security – Study Guide
A study guide to Global resource consumption and security in IB DP Geography: trends in consumption, their impacts, and resource stewardship.
Geography · International Baccalaureate · IB
Read guide
Related articles
-
teaching
A Level tuition in Dubai: Cambridge or Pearson Edexcel International A Level?
Schools in Dubai and Abu Dhabi teach either Cambridge International AS & A Level or Pearson Edexcel International A Level. How the two are structured, why it matters for tuition, and how online classes from Lahore work.
9 October 2026
-
curriculum guides
Choosing subjects at IGCSE and A Level
How subject choices at 14 and 16 affect university options later, and how to keep pathways open without overloading a timetable.
28 July 2026
Studying this with a teacher
Working through Geography IB?
This page is free and stays free. Marlbridge is not offering Geography classes at the moment, so there is no tuition to book for it. The free study resources stay open to everyone.