
Study Guides
O Level Business: Analysis of accounts (Cambridge 7115)
Study guide to profitability, liquidity, the five ratios and how users of accounts make decisions, for Cambridge O Level Business Studies 7115 section 5.5.
- Subject
- Business
- Level
- O LEVELS
- Topic
- Financial information and decisions
- Author
- Marlbridge Academic Team
- Updated
- Reviewed by
- Salman Ahmad (what this means)
Aligned to Cambridge O Level Business (7115), For examination in 2026. Official specification .
Syllabus page (what it covers and how it is assessed): Cambridge O Level Business.
Syllabus points this page covers
7115
- 5.5 Analysis of accounts
Found an error? Report a correction.
Need help with this topic? Request a free trial class for O Level Business (7115).
This study guide covers section 5.5, Analysis of accounts, of the Cambridge O Level Business Studies 7115 syllabus for examination in 2026. It teaches profitability, liquidity, five named ratios and the way different users of accounts make decisions. The syllabus lists no tiers or extension material for this section. Paper 1 and Paper 2 are each 1 hour 30 minutes, worth 80 marks and 50% of the grade, and both draw on content from the whole syllabus, so ratios can appear in either.
Use it with the revision notes and the practice questions. The wider topic practice page is Financial information and decisions practice. Course links: Cambridge O Level Business hub, printable checklist and the free diagnostics. For paper technique see exam preparation.
What section 5.5 asks you to do
| Syllabus point | What you must be able to do |
|---|---|
| 5.5.1 Profitability | Explain the concept and why it matters |
| 5.5.2 Liquidity | Explain the concept and why it matters |
| 5.5.3 Interpreting performance | Calculate and analyse gross profit margin, profit margin, return on capital employed (ROCE), current ratio and acid test ratio |
| 5.5.4 Why and how accounts are used | Describe the needs of different users of accounts and ratio analysis, and how they might use results to decide, for example whether to lend to or invest in the business |
The syllabus does not print formulas for the ratios. The forms below are the standard forms used in textbooks, and they are the ones this page uses.
Profitability (5.5.1)
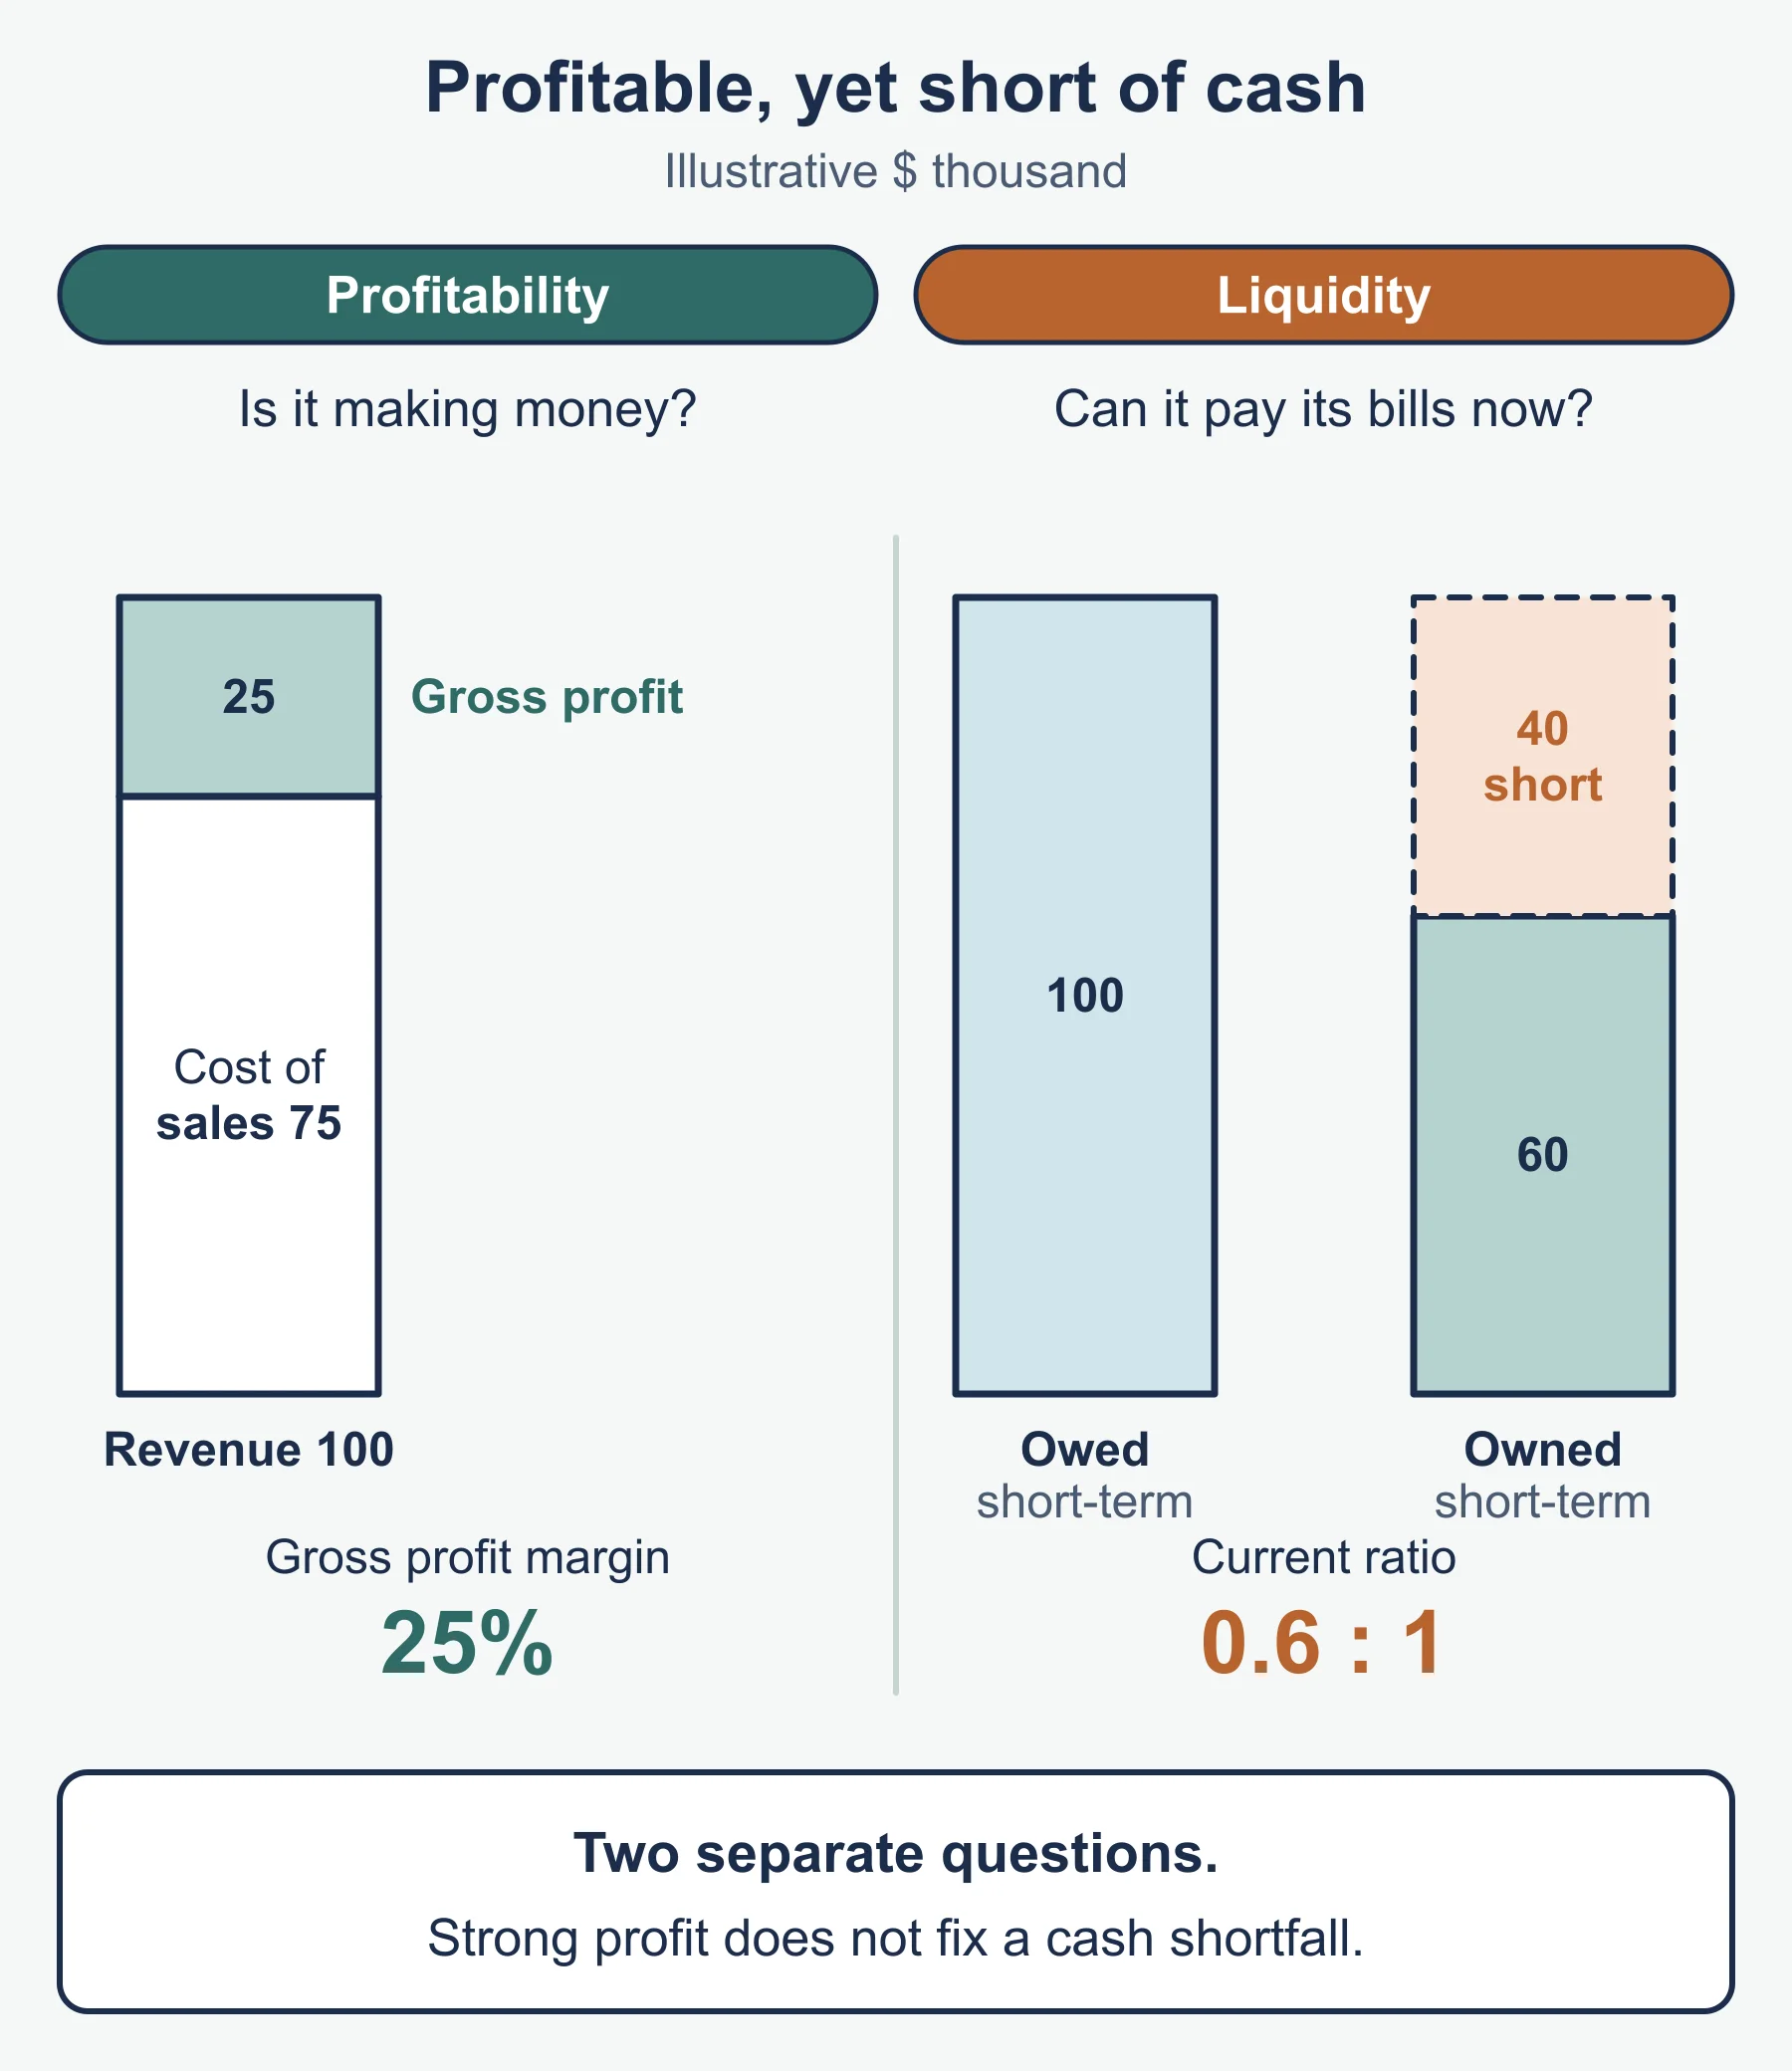
Profitability is how well a business earns profit compared with the revenue it makes or the money invested in it. A profit figure alone does not tell you this. A profit of 50 000 is excellent for a business with 200 000 of revenue and weak for one with 20 million.
Profitability matters because:
- owners and shareholders want a return for taking the risk of running or funding the business
- retained profit is a source of finance for growth without borrowing
- lenders look for profit to be confident that interest can be paid
- falling profitability is an early warning that costs are rising or prices are too low
Profitability is judged with ratios that compare profit to something else: revenue (the two margins) or capital employed (ROCE).
Liquidity (5.5.2)
Liquidity is the ability of a business to pay its short-term debts when they fall due. It depends on having enough cash, or assets that can quickly be turned into cash, compared with the bills due soon.
Liquidity matters because a business that cannot pay wages, suppliers or the electricity bill on time can be forced to stop trading, even if it is profitable on paper. Profit and cash are different things (see section 5.3). A business can sell on credit, record profit, and still have an empty bank account while customers delay payment.
Liquidity is judged with the current ratio and the acid test ratio. Both compare current assets with current liabilities. These come from the statement of financial position (section 5.4): current assets are items such as inventories, receivables and cash, and current liabilities are debts due within a year.
The five ratios (5.5.3)
Formulas
| Ratio | Standard form | Shown as |
|---|---|---|
| Gross profit margin | (gross profit ÷ revenue) × 100 | % |
| Profit margin | (profit ÷ revenue) × 100 | % |
| Return on capital employed | (profit ÷ capital employed) × 100 | % |
| Current ratio | current assets ÷ current liabilities | a ratio, such as 1.5 : 1 |
| Acid test ratio | (current assets − inventories) ÷ current liabilities | a ratio, such as 0.8 : 1 |
Supporting definitions:
- Gross profit = revenue − cost of sales.
- Profit in the profit margin and ROCE is the profit figure taken from the income statement. If a question gives a single “profit” figure, use that figure; if it gives several profit figures, state which one you use.
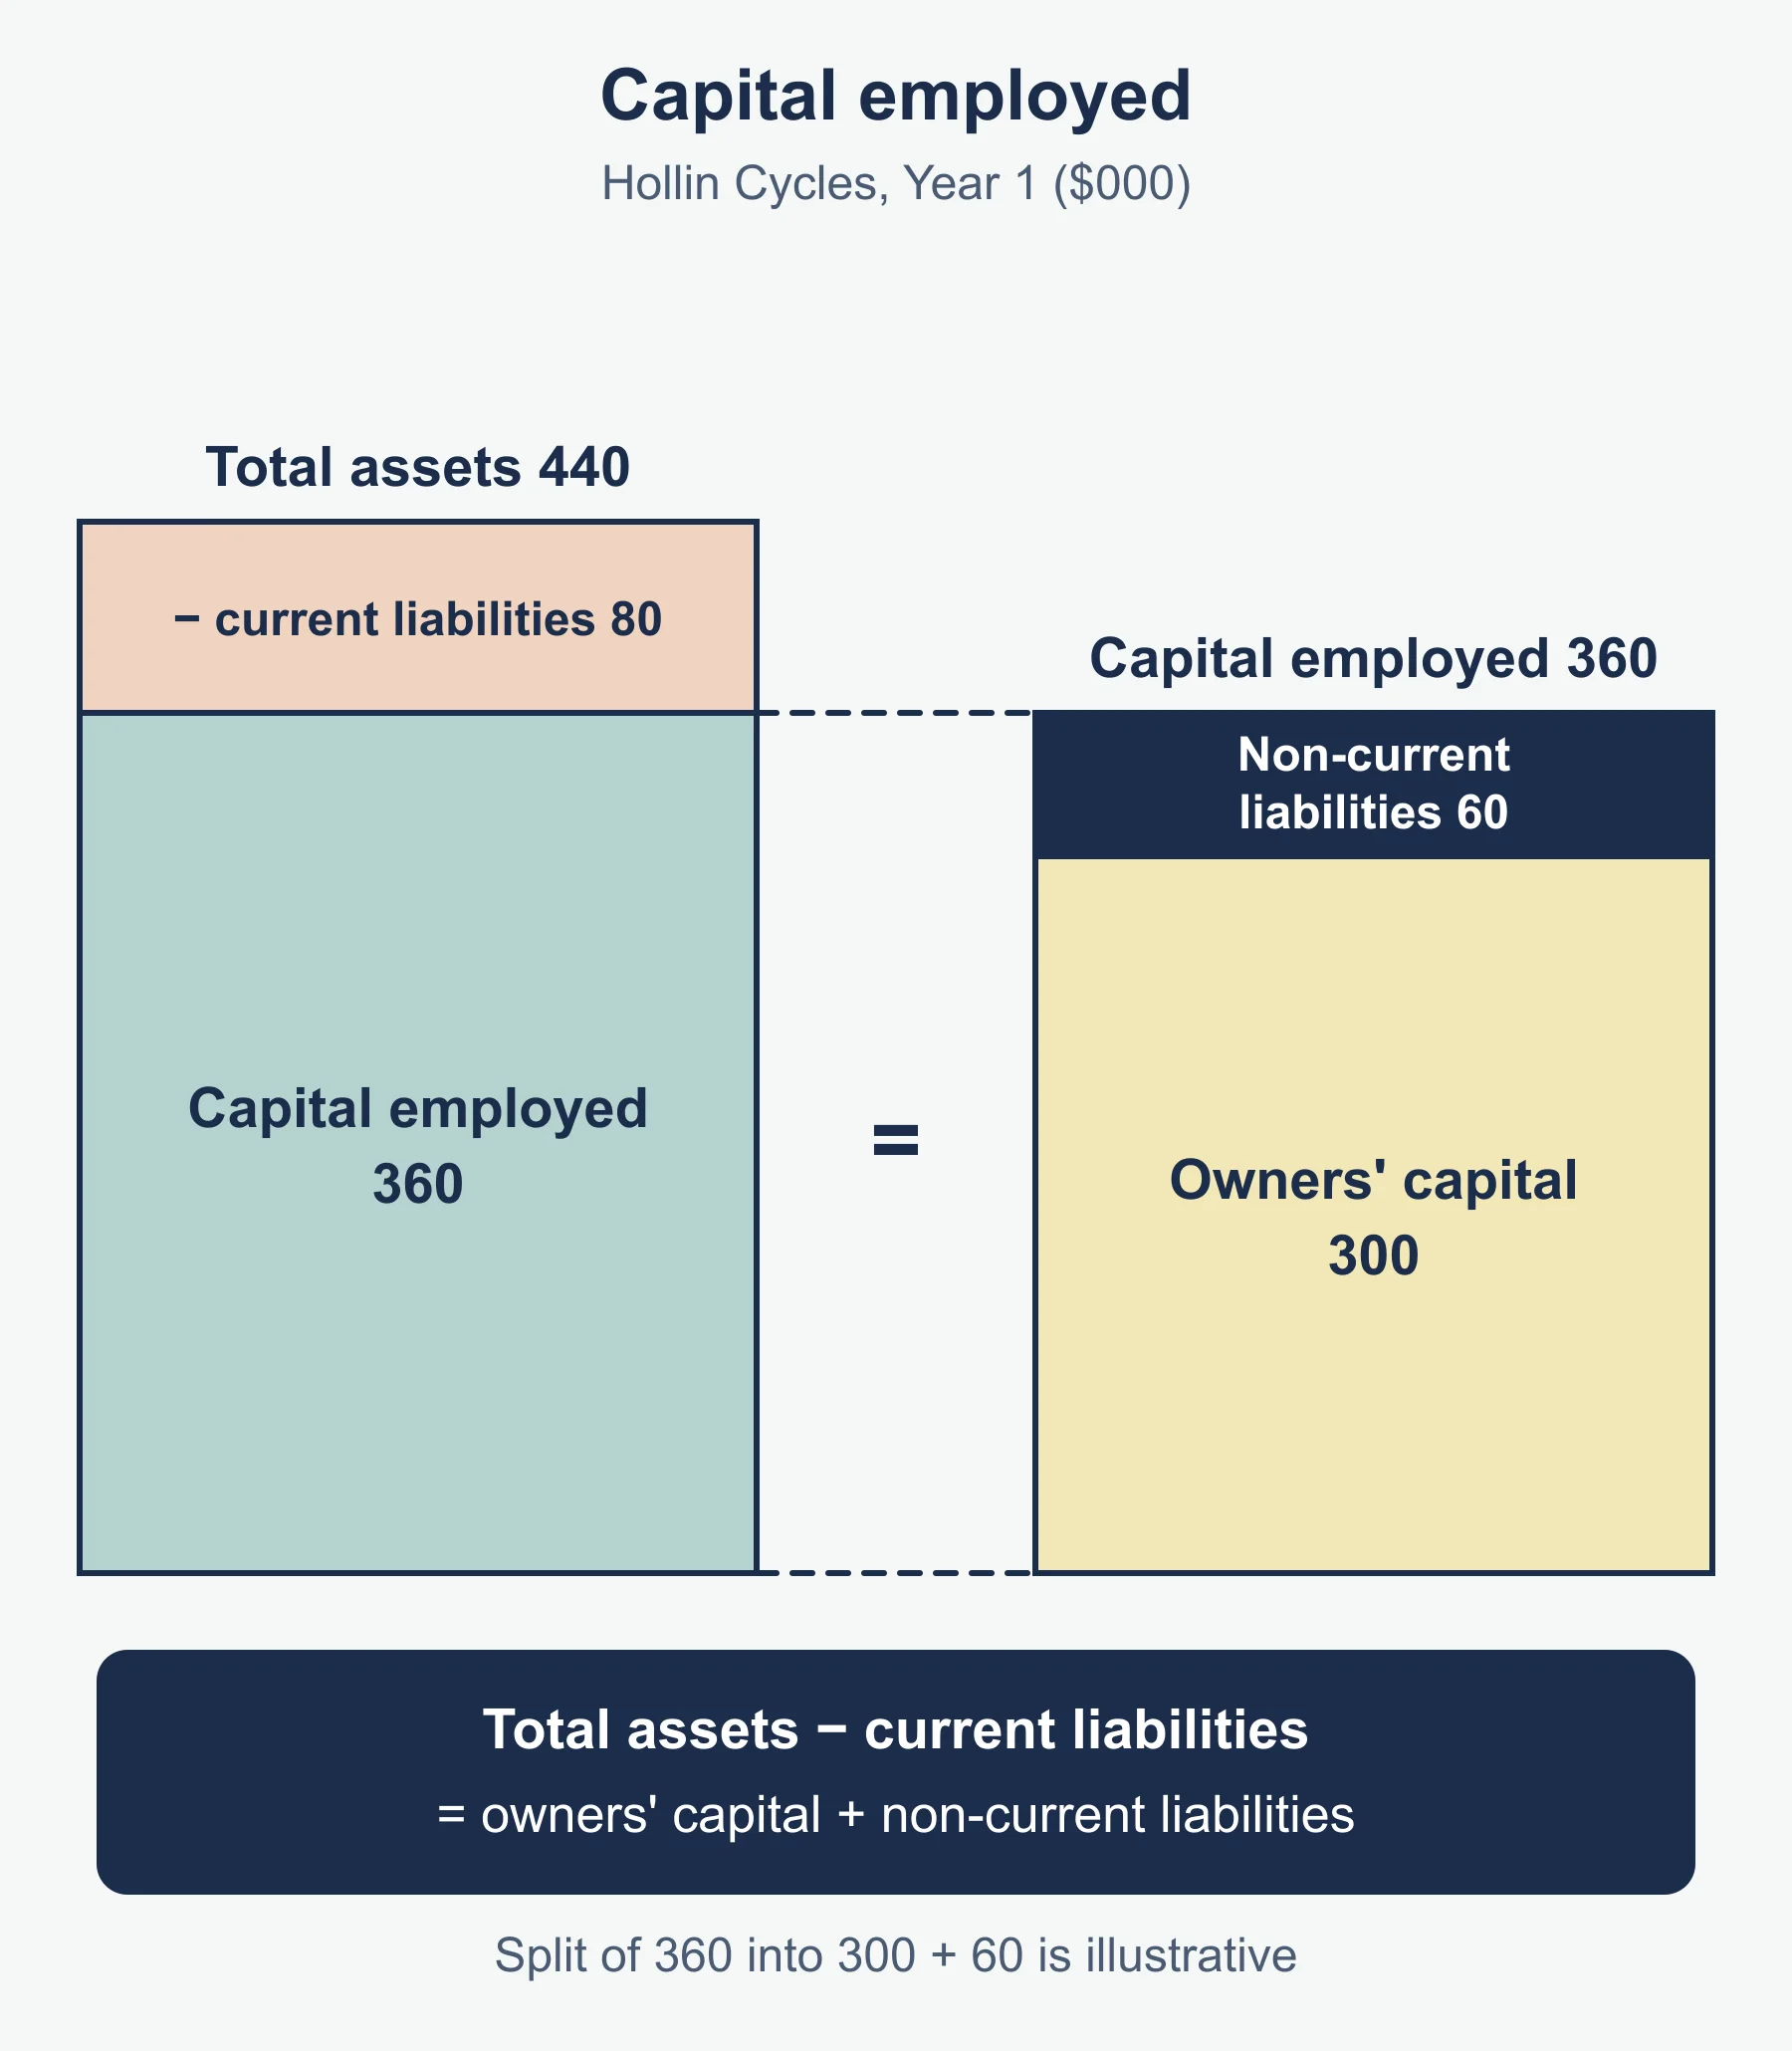
- Capital employed is the long-term finance in the business. The standard form is total assets − current liabilities, which equals owners’ capital plus non-current liabilities.
- Acid test removes inventories because they are the current asset that is slowest and least certain to be turned into cash.
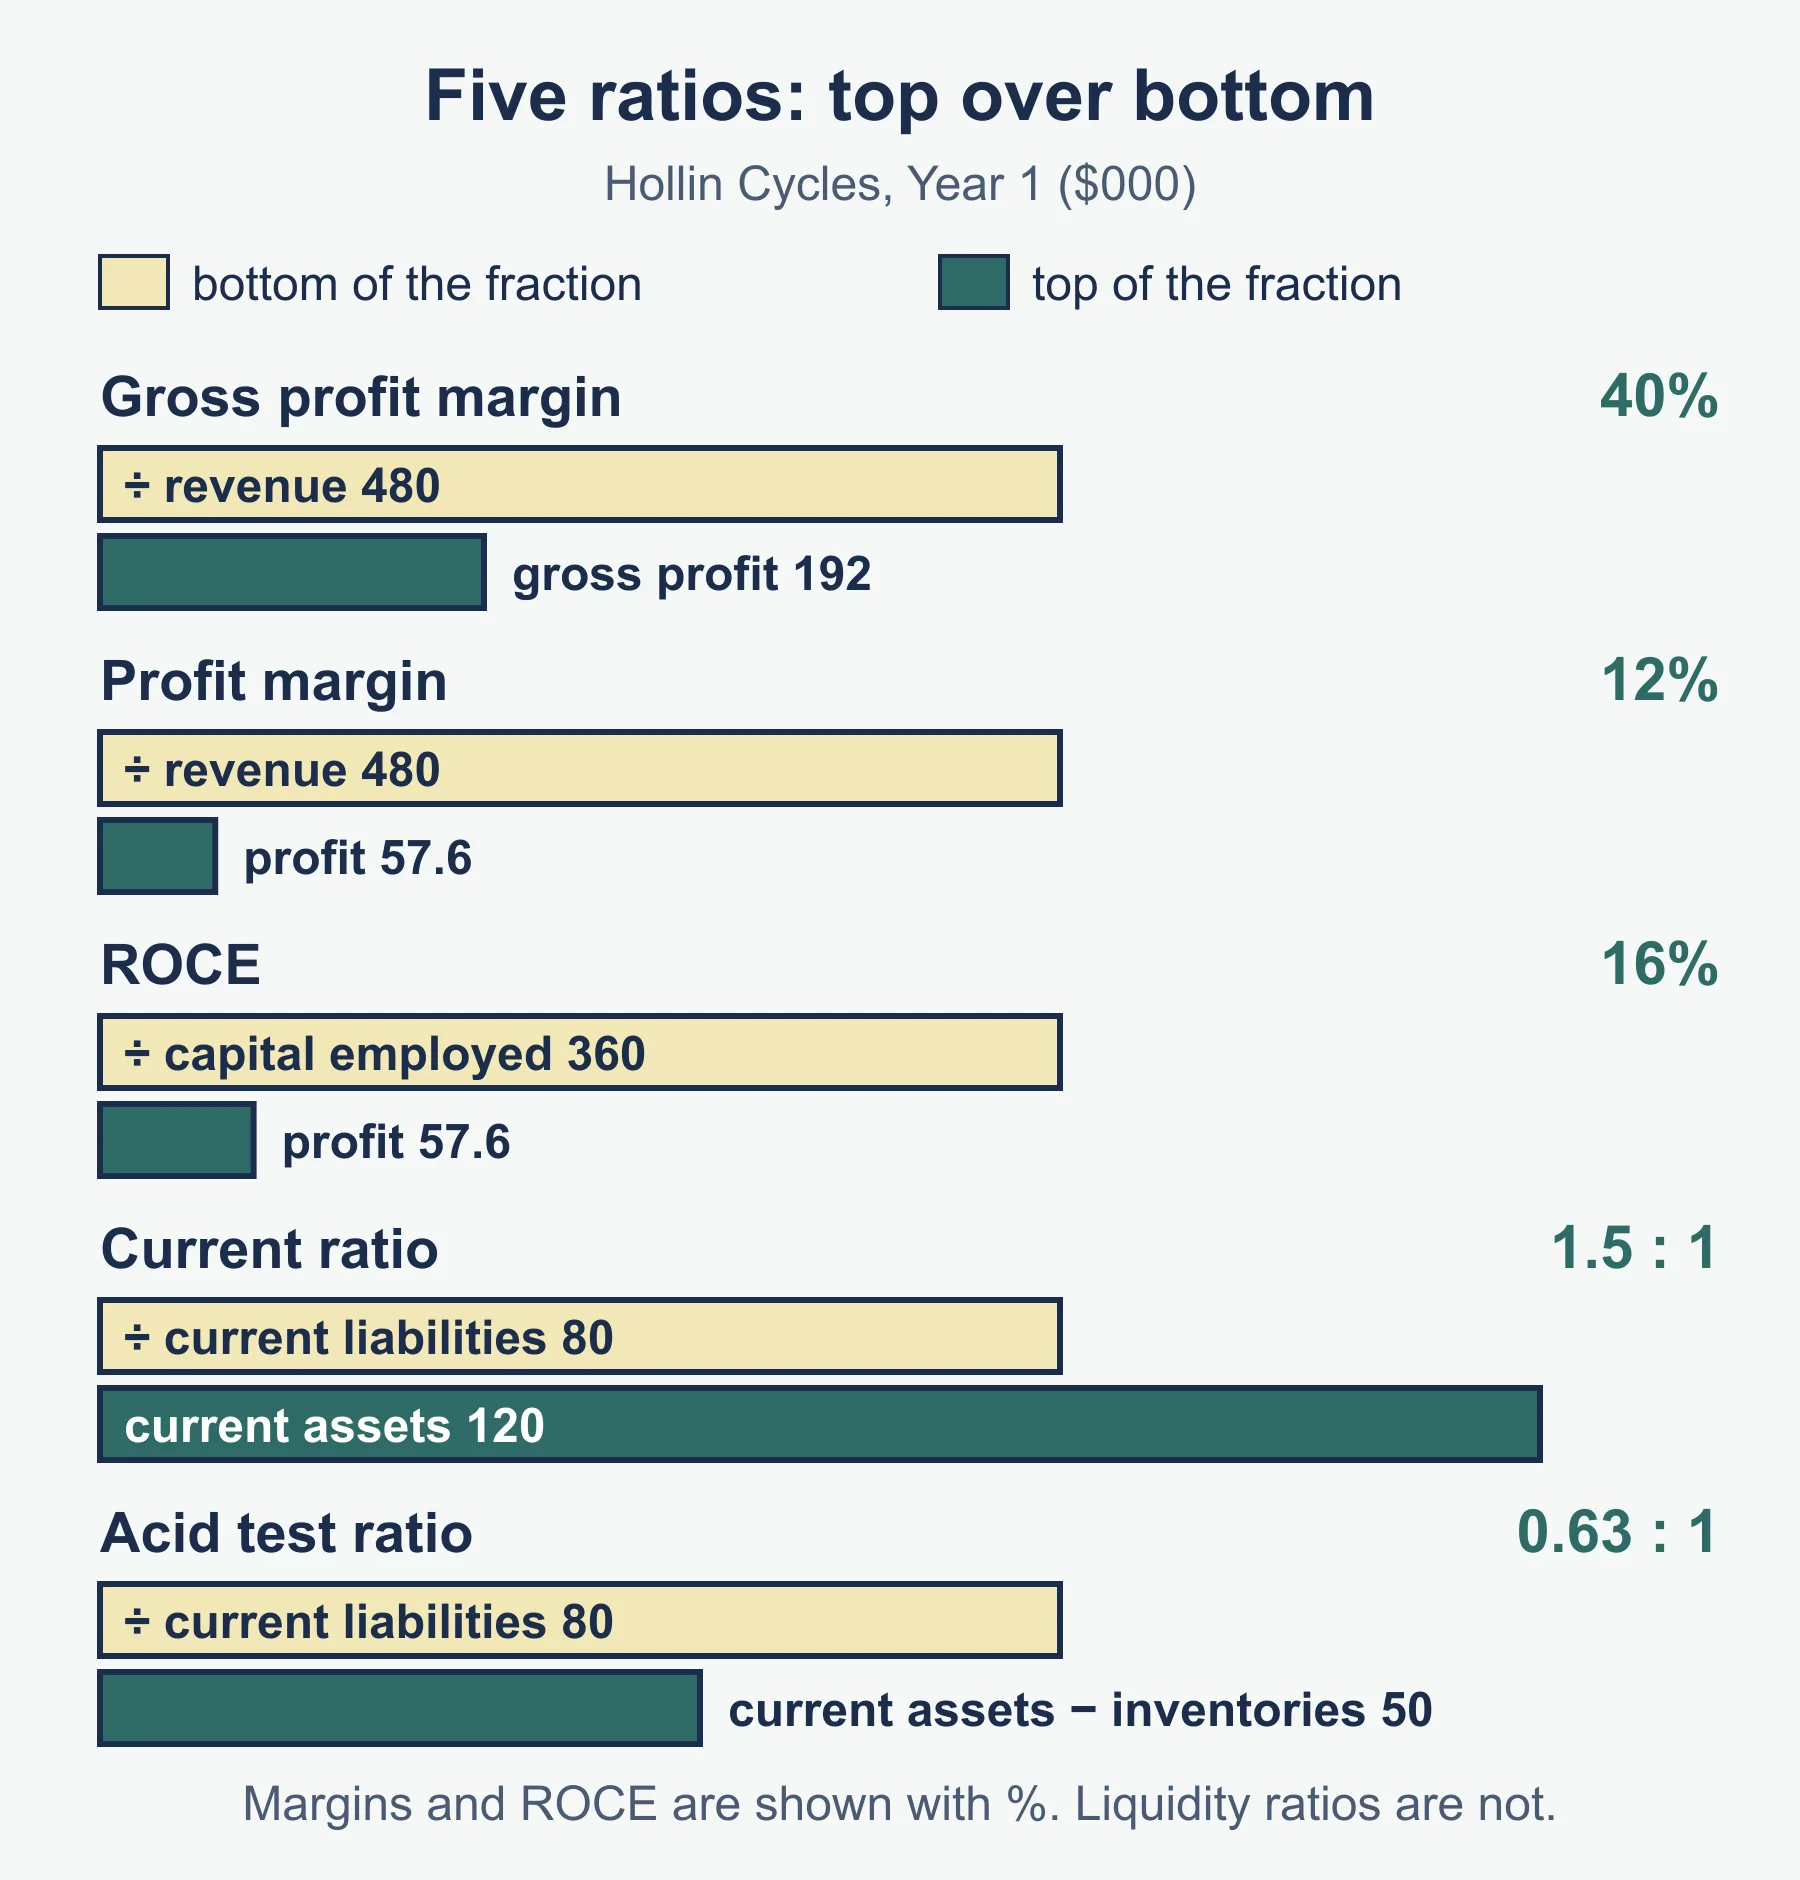
Worked example: Hollin Cycles
Hollin Cycles sells bicycles and repairs. Its figures for two years:
| Item (in $000) | Year 1 | Year 2 |
|---|---|---|
| Revenue | 480 | 540 |
| Cost of sales | 288 | 351 |
| Profit | 57.6 | 43.2 |
| Capital employed | 360 | 432 |
| Inventories | 70 | 105 |
| Receivables | 30 | 36 |
| Cash | 20 | 9 |
| Current liabilities | 80 | 125 |
Step 1, gross profit. Year 1: 480 − 288 = 192. Year 2: 540 − 351 = 189.
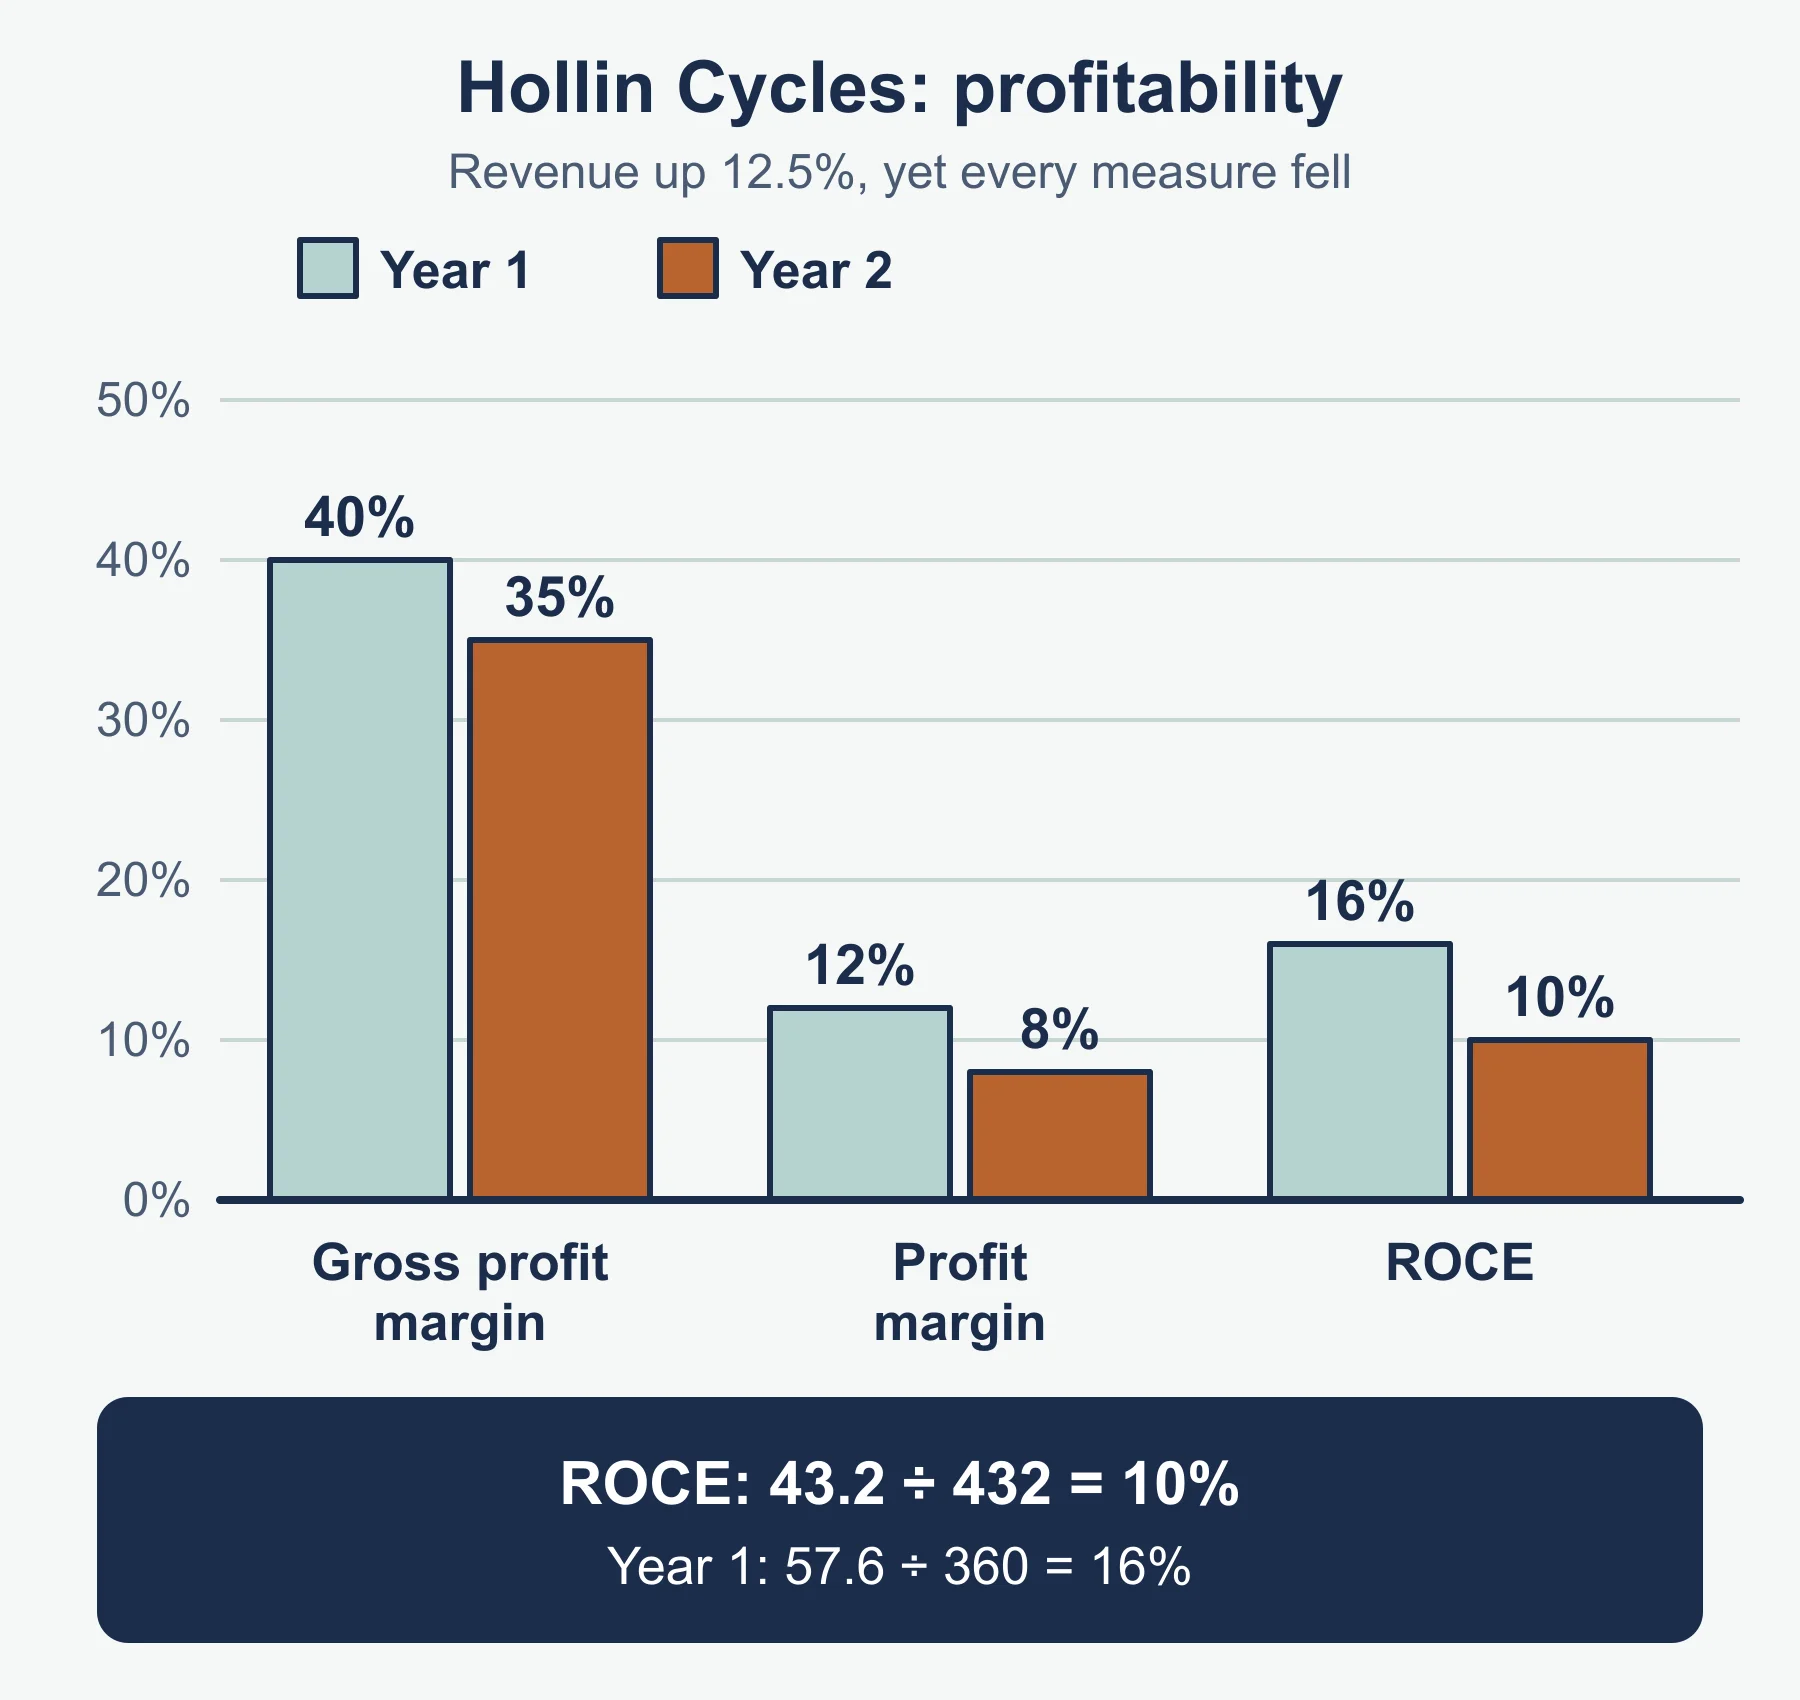
Step 2, gross profit margin. Year 1: 192 ÷ 480 × 100 = 40%. Year 2: 189 ÷ 540 × 100 = 35%.
Step 3, profit margin. Year 1: 57.6 ÷ 480 × 100 = 12%. Year 2: 43.2 ÷ 540 × 100 = 8%.
Step 4, ROCE. Year 1: 57.6 ÷ 360 × 100 = 16%. Year 2: 43.2 ÷ 432 × 100 = 10%.
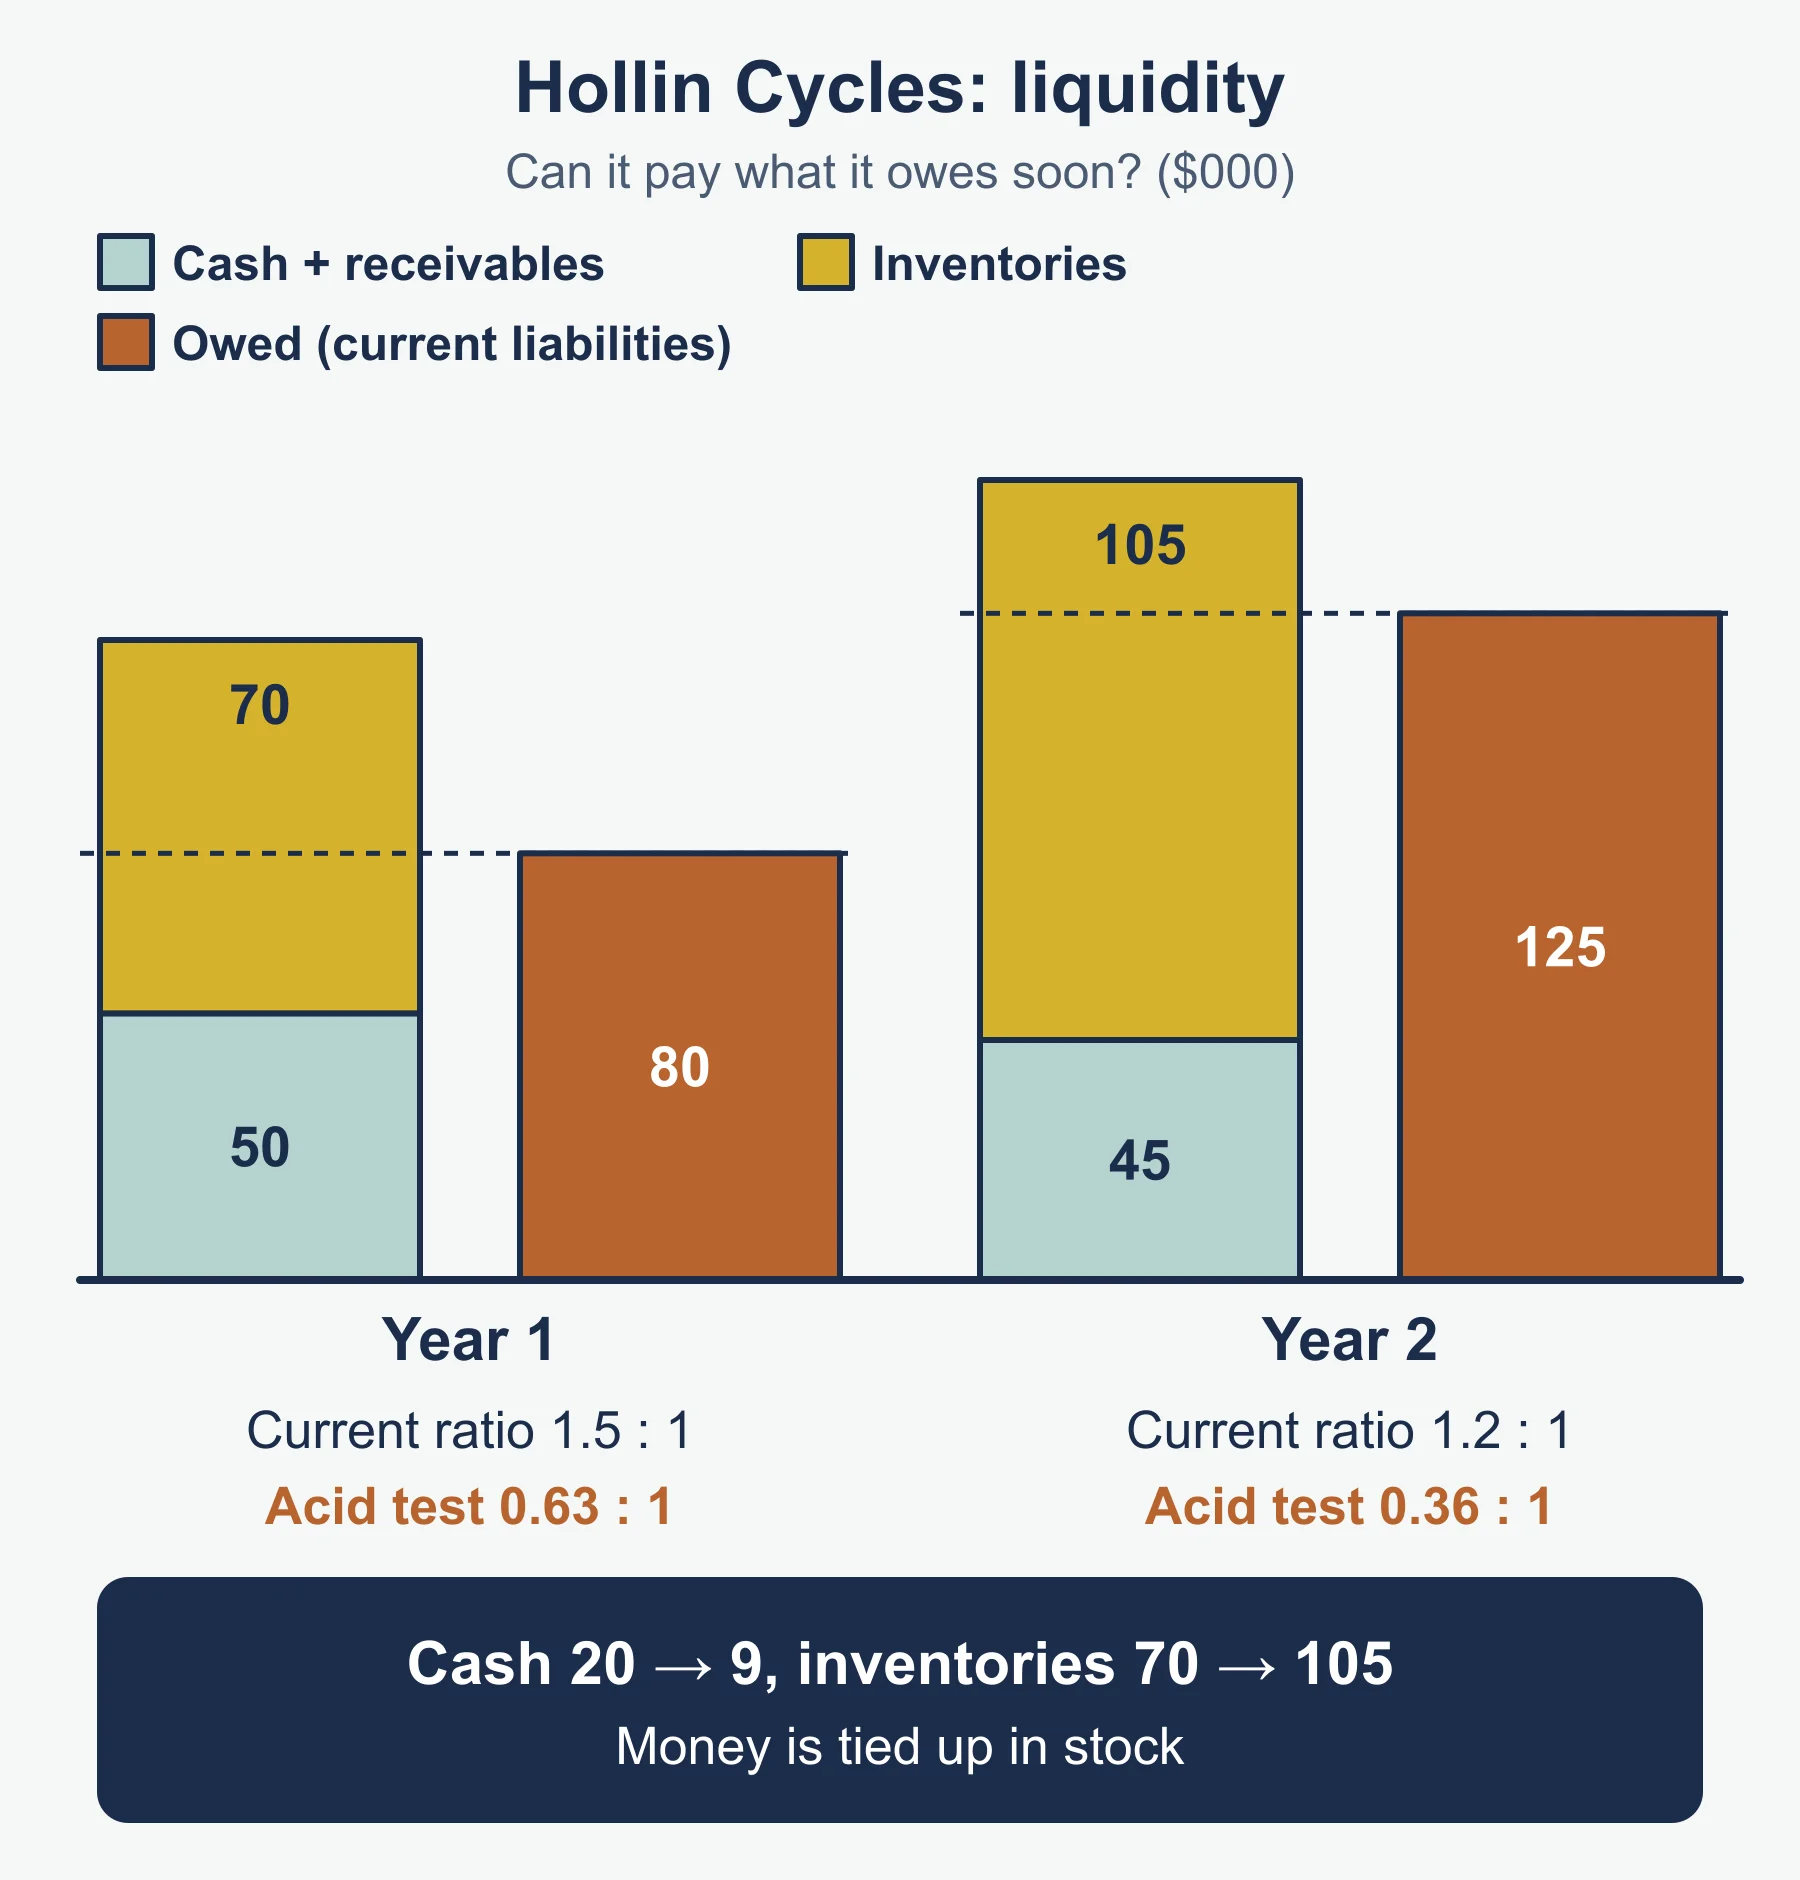
Step 5, current assets. Year 1: 70 + 30 + 20 = 120. Year 2: 105 + 36 + 9 = 150.
Step 6, current ratio. Year 1: 120 ÷ 80 = 1.5. Year 2: 150 ÷ 125 = 1.2.
Step 7, acid test ratio. Year 1: (120 − 70) ÷ 80 = 0.625, which rounds to 0.63. Year 2: (150 − 105) ÷ 125 = 0.36.
Step 8, analyse. Revenue grew by 12.5%, but every profitability measure fell. Gross profit margin fell by five percentage points, so the cost of the bicycles and parts sold rose faster than prices, or discounts were given to win sales. Profit margin fell by four percentage points, so overheads did not shrink either. ROCE fell from 16% to 10%, because capital employed grew by 72 while profit fell: the business put in more money and earned less from it. Liquidity also weakened. Current ratio fell from 1.5 to 1.2, and the acid test ratio fell to 0.36, which means that without selling inventories the business has only about 36 cents of liquid assets for each dollar owed in the short term. Cash fell from 20 to 9 while inventories rose from 70 to 105, so money has been tied up in stock.
Step 9, a decision. A bank asked for a new loan would see falling returns and weak liquidity, and would probably ask for more information or security before lending.
Interpreting each ratio
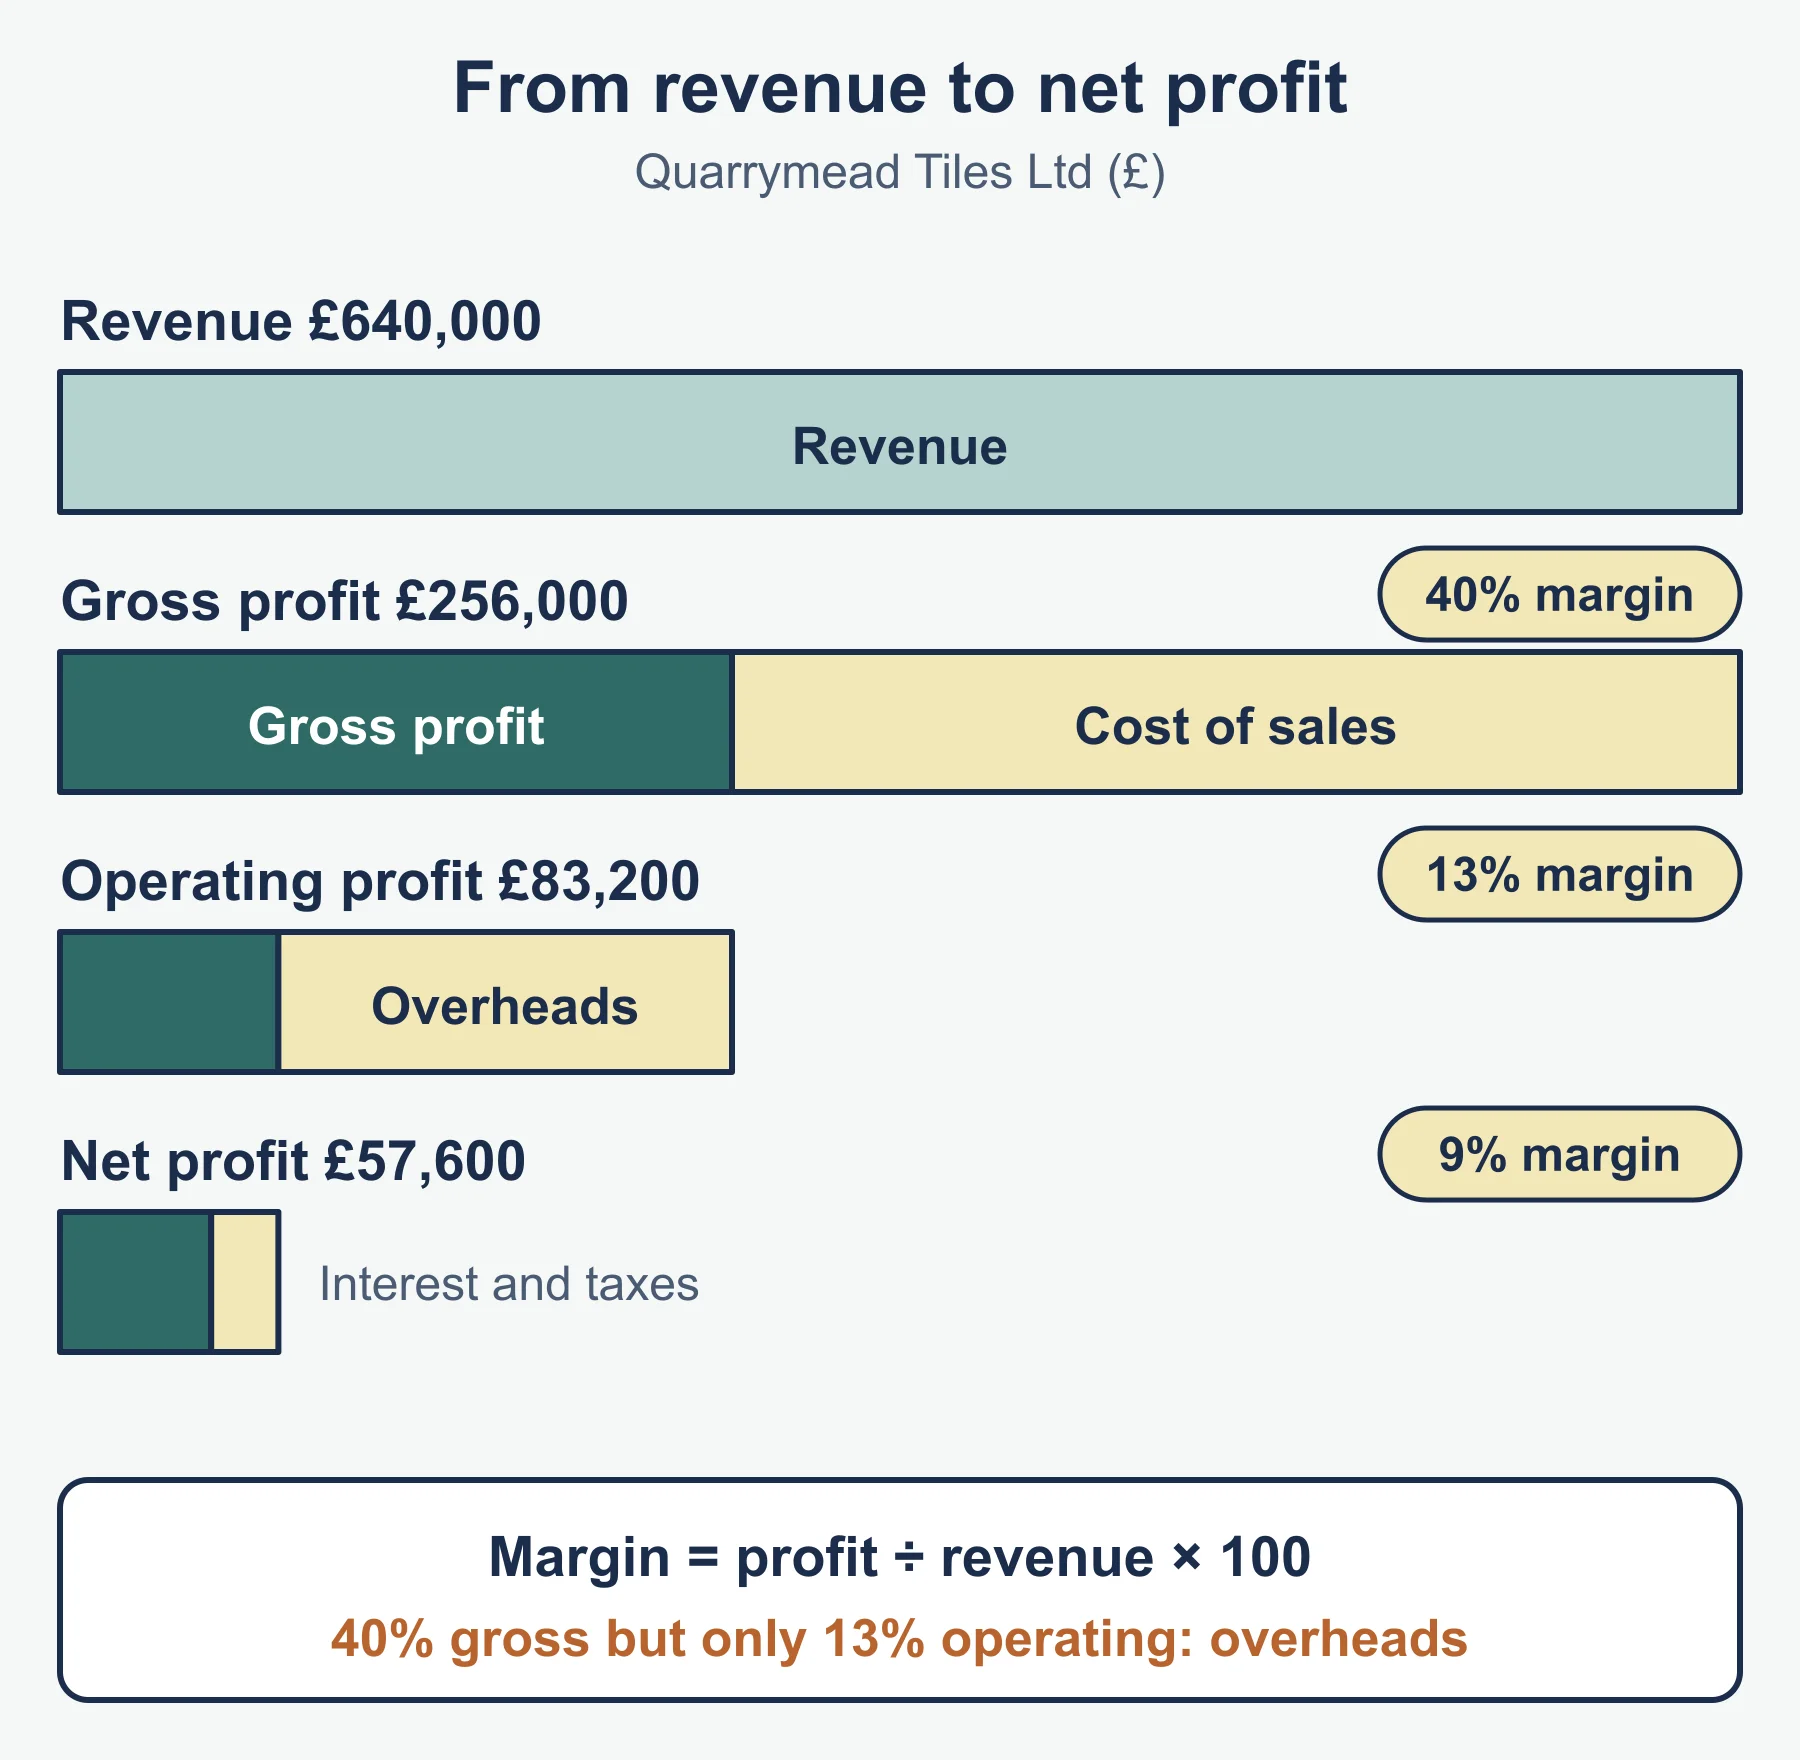
Gross profit margin shows how much of each dollar of revenue is left after the direct cost of the goods or services sold. A fall points to cheaper pricing, dearer suppliers or wastage. A rise can come from higher prices or cheaper purchasing.
Profit margin shows how much is left after all costs. If gross profit margin is steady but profit margin falls, the cause is in overheads such as rent, wages or marketing, not in the cost of sales.
ROCE shows the return on the money invested in the business. Higher is better. It is useful for comparing with earlier years, with similar businesses, and with what the money could earn elsewhere, such as in a savings account.
Current ratio shows whether current assets cover current liabilities. A result below 1 means that current liabilities are larger than current assets. A result far above what is usual for the industry can mean cash or inventories are sitting idle. There is no single “correct” figure that applies to every business.
Acid test ratio is the stricter test. A business with high inventories may have a comfortable current ratio but a weak acid test ratio. A supermarket and a furniture maker will not have the same typical figures.
Comparing and judging
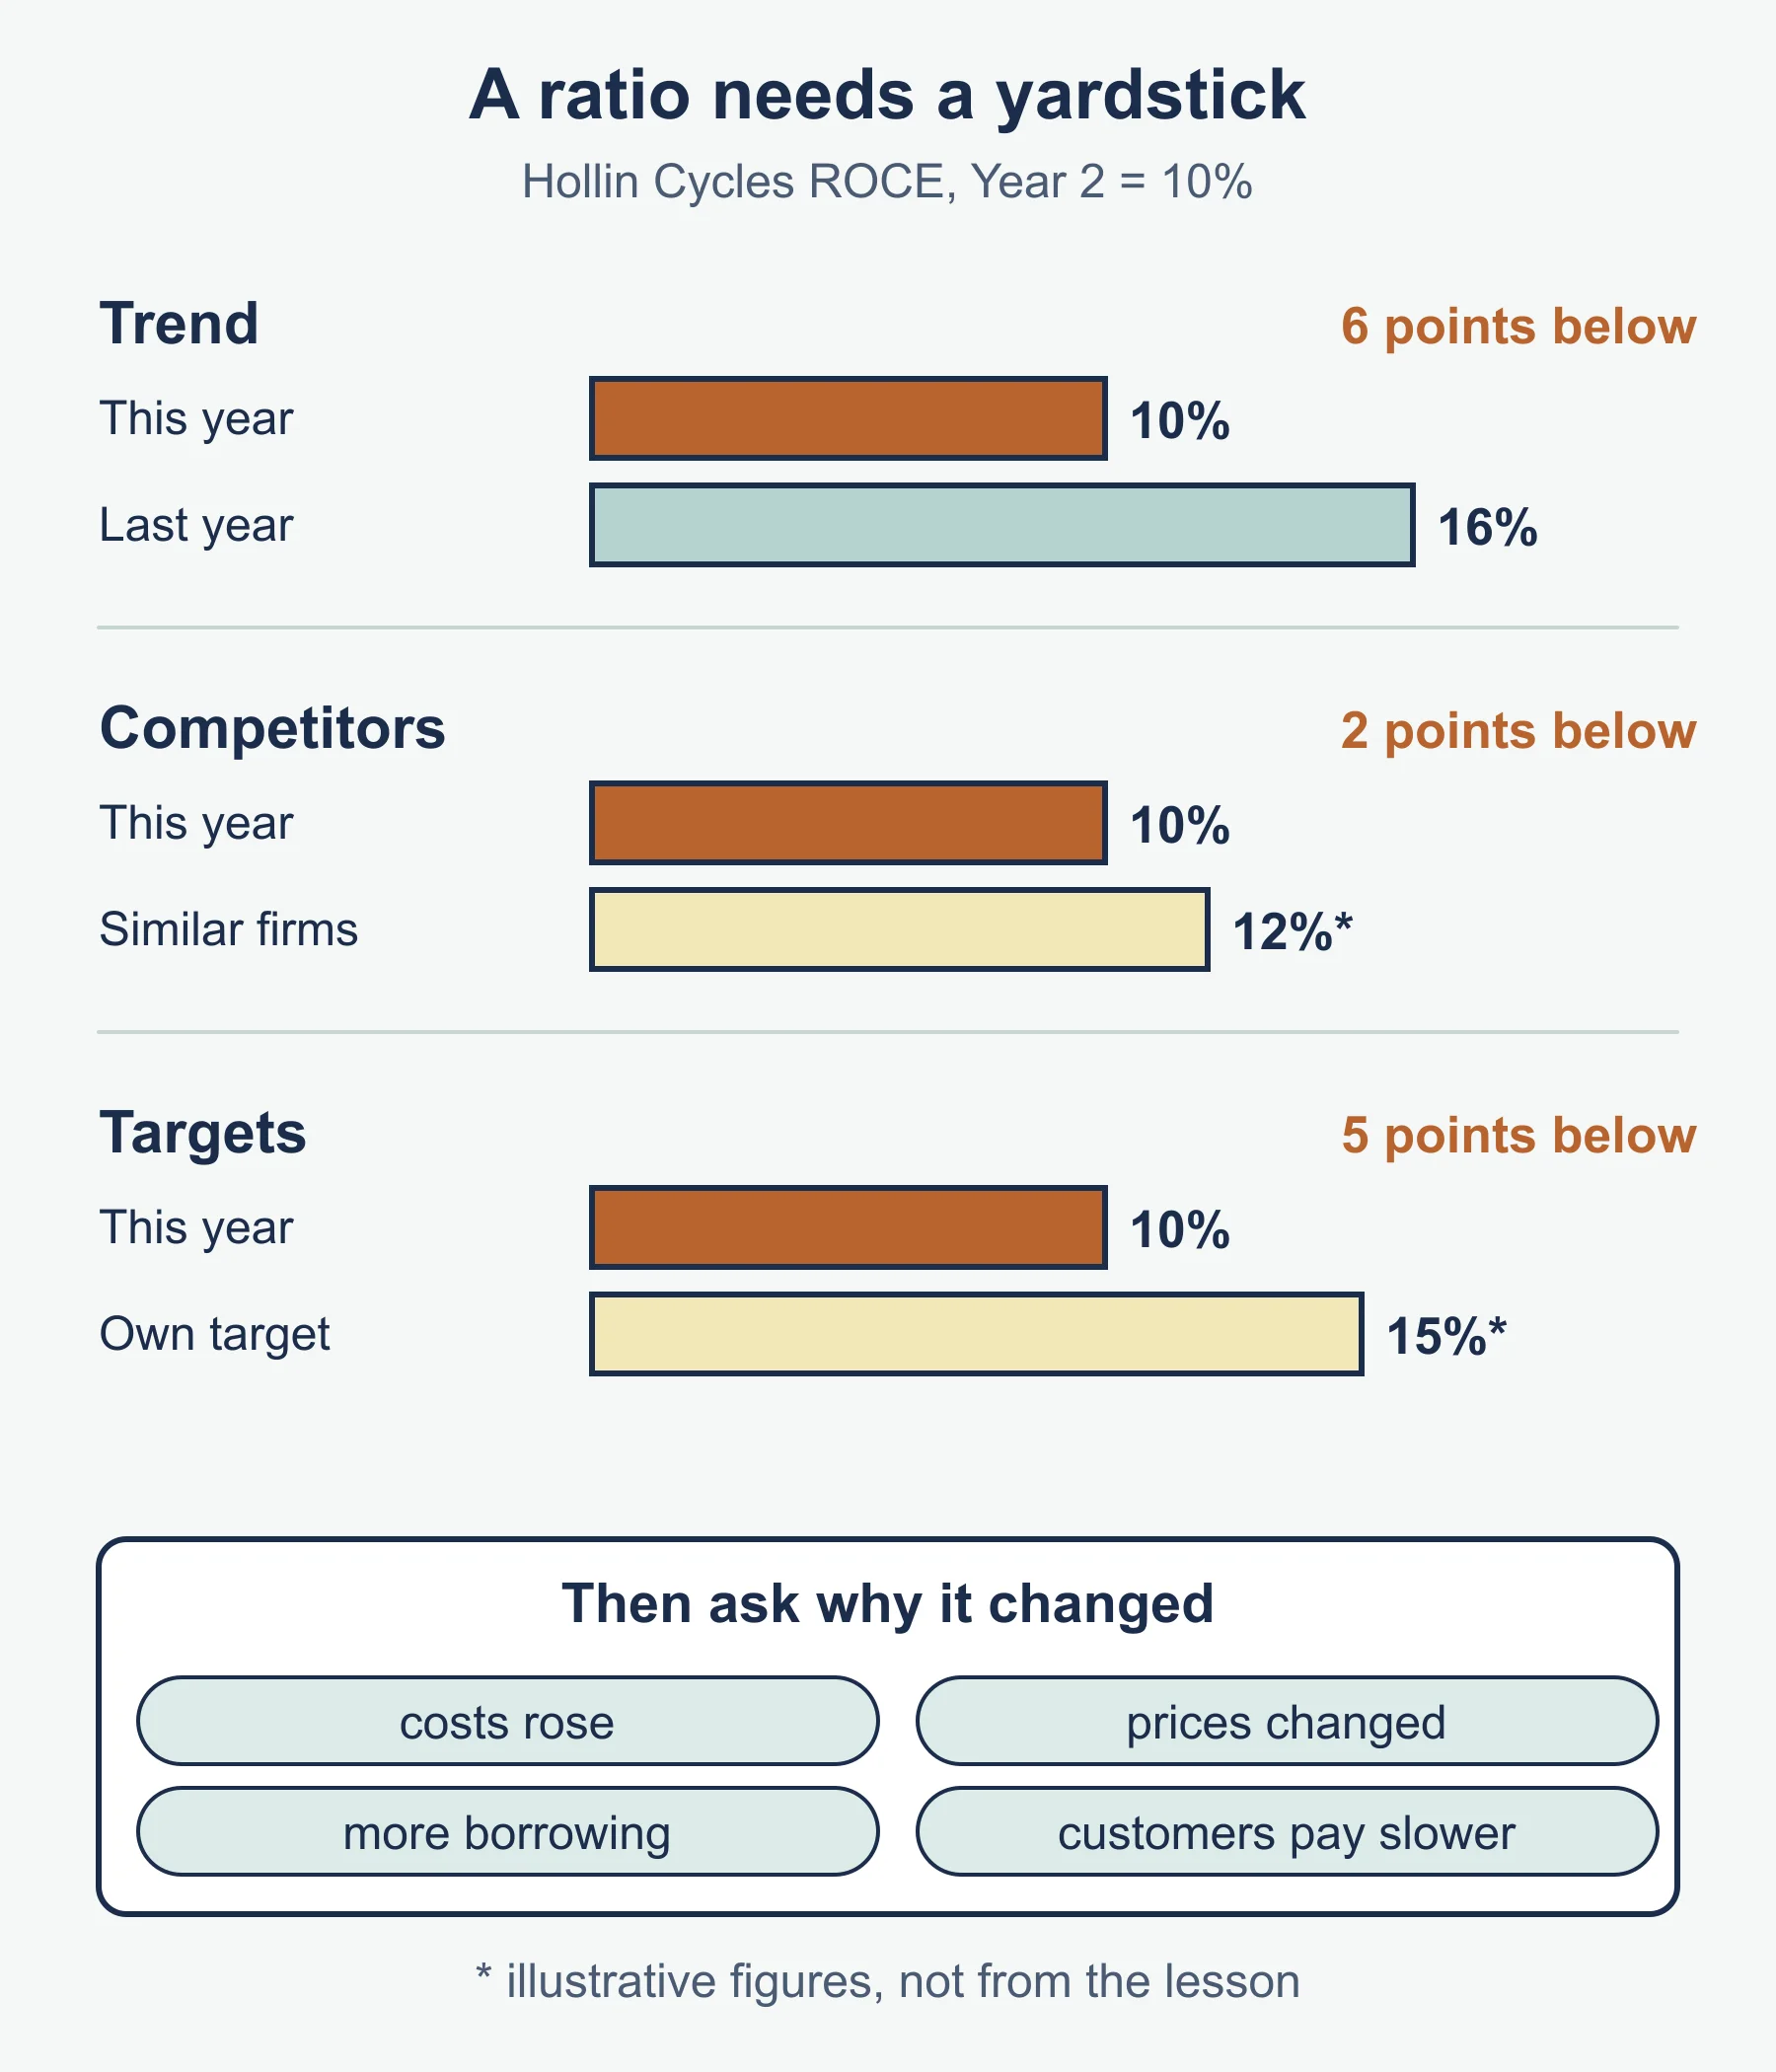
A ratio on its own says little. Make a judgement by comparing with:
- the same business in earlier years (trend)
- similar businesses (competitors)
- the business’s own targets
Then ask why the figure changed, using the other information in the case. Look at rising costs, a change in prices, extra borrowing, a new loan, slower payment by customers or large purchases of inventories. Link the cause to the business in the question.
Why and how accounts are used (5.5.4)
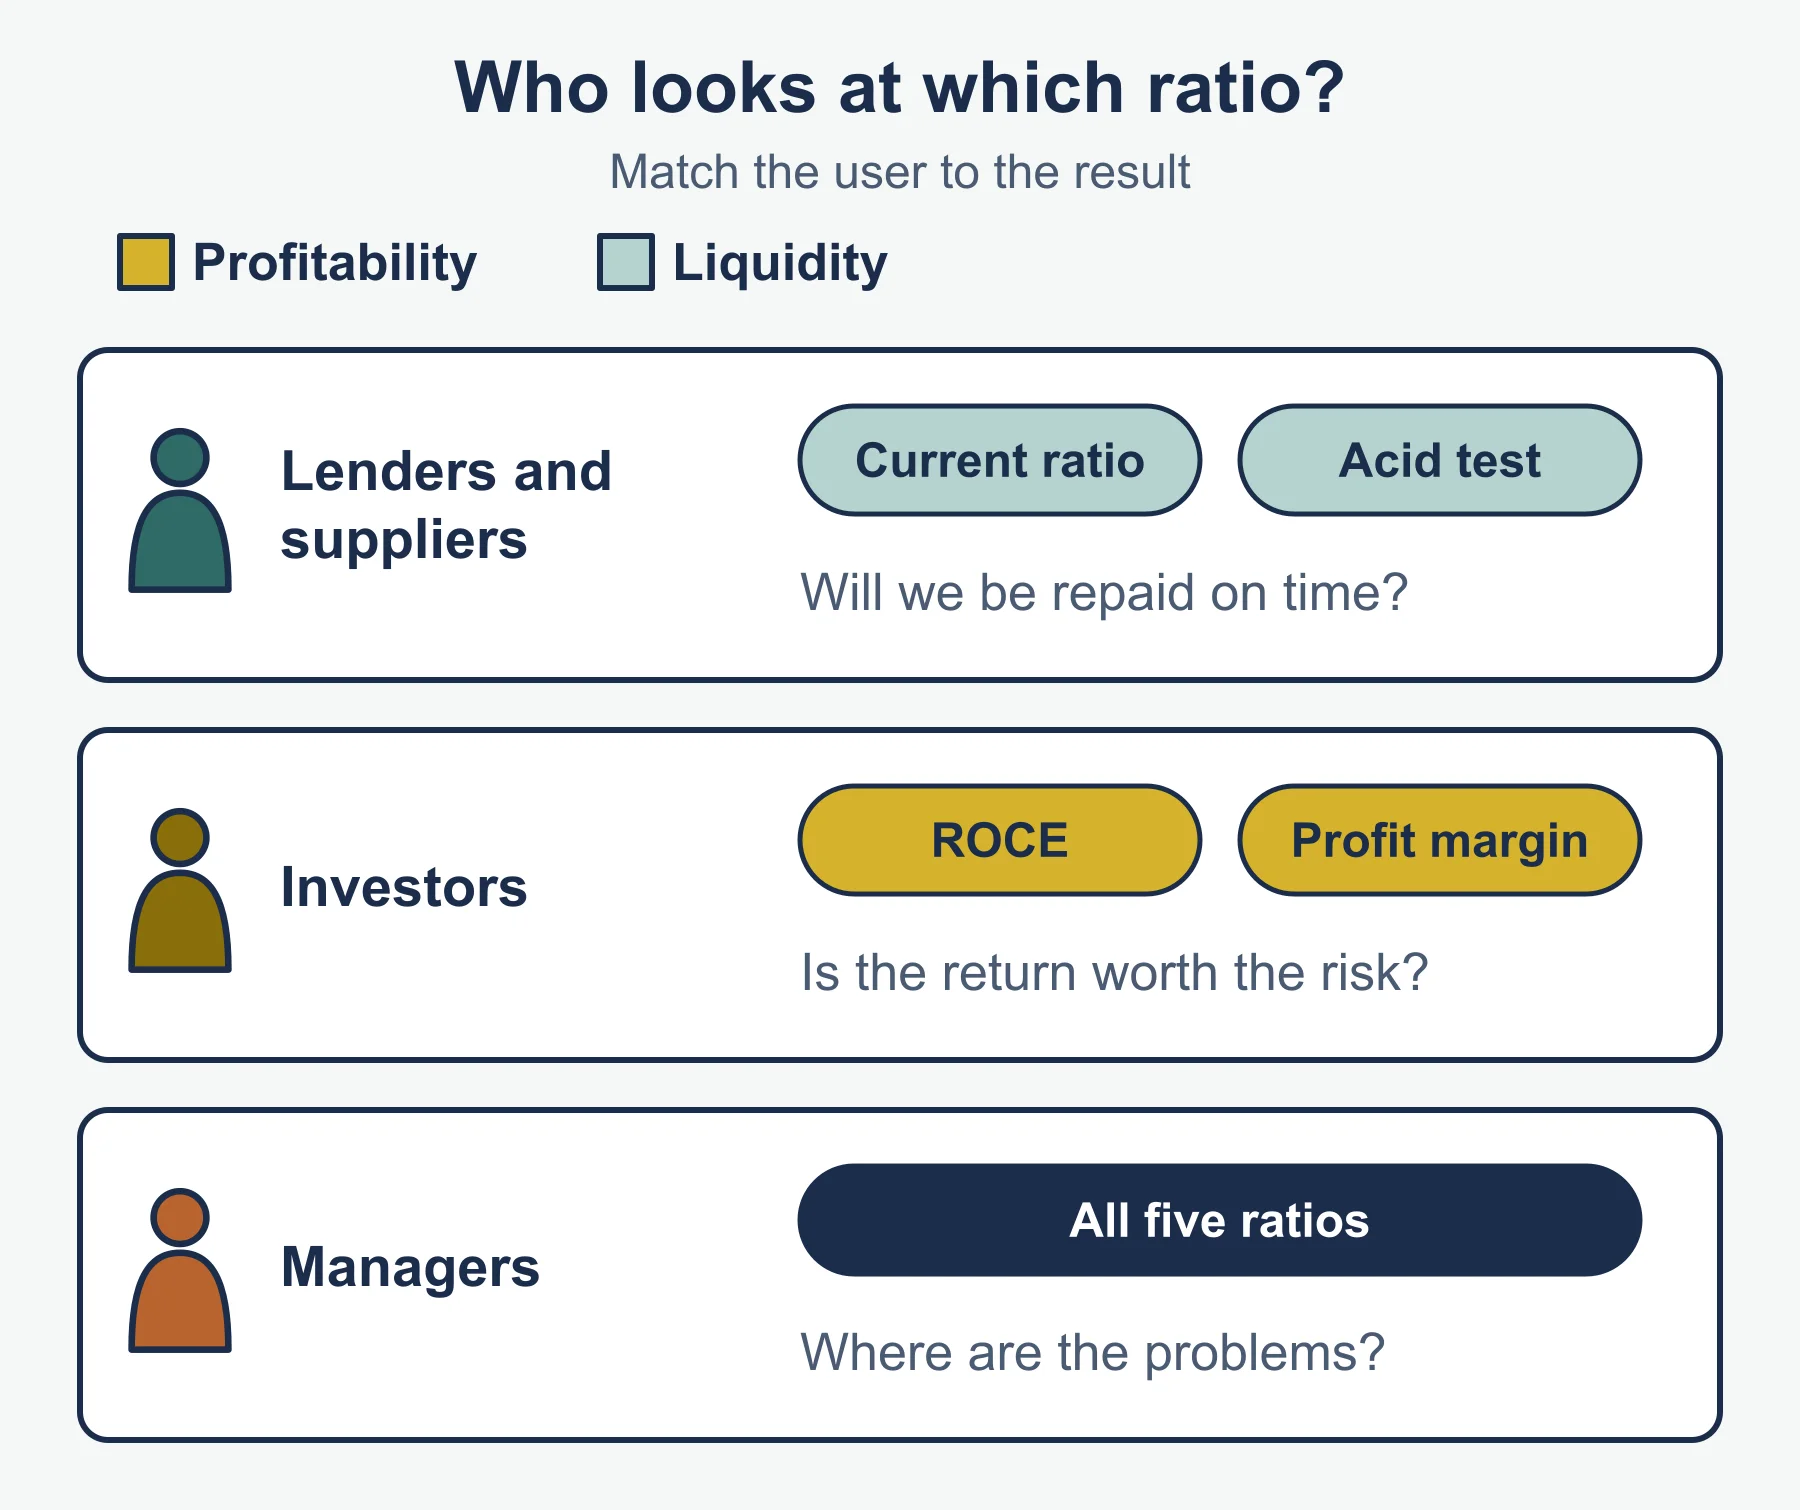
Different users want different things from the same set of accounts and ratios.
| User | What they want to know | Example decision |
|---|---|---|
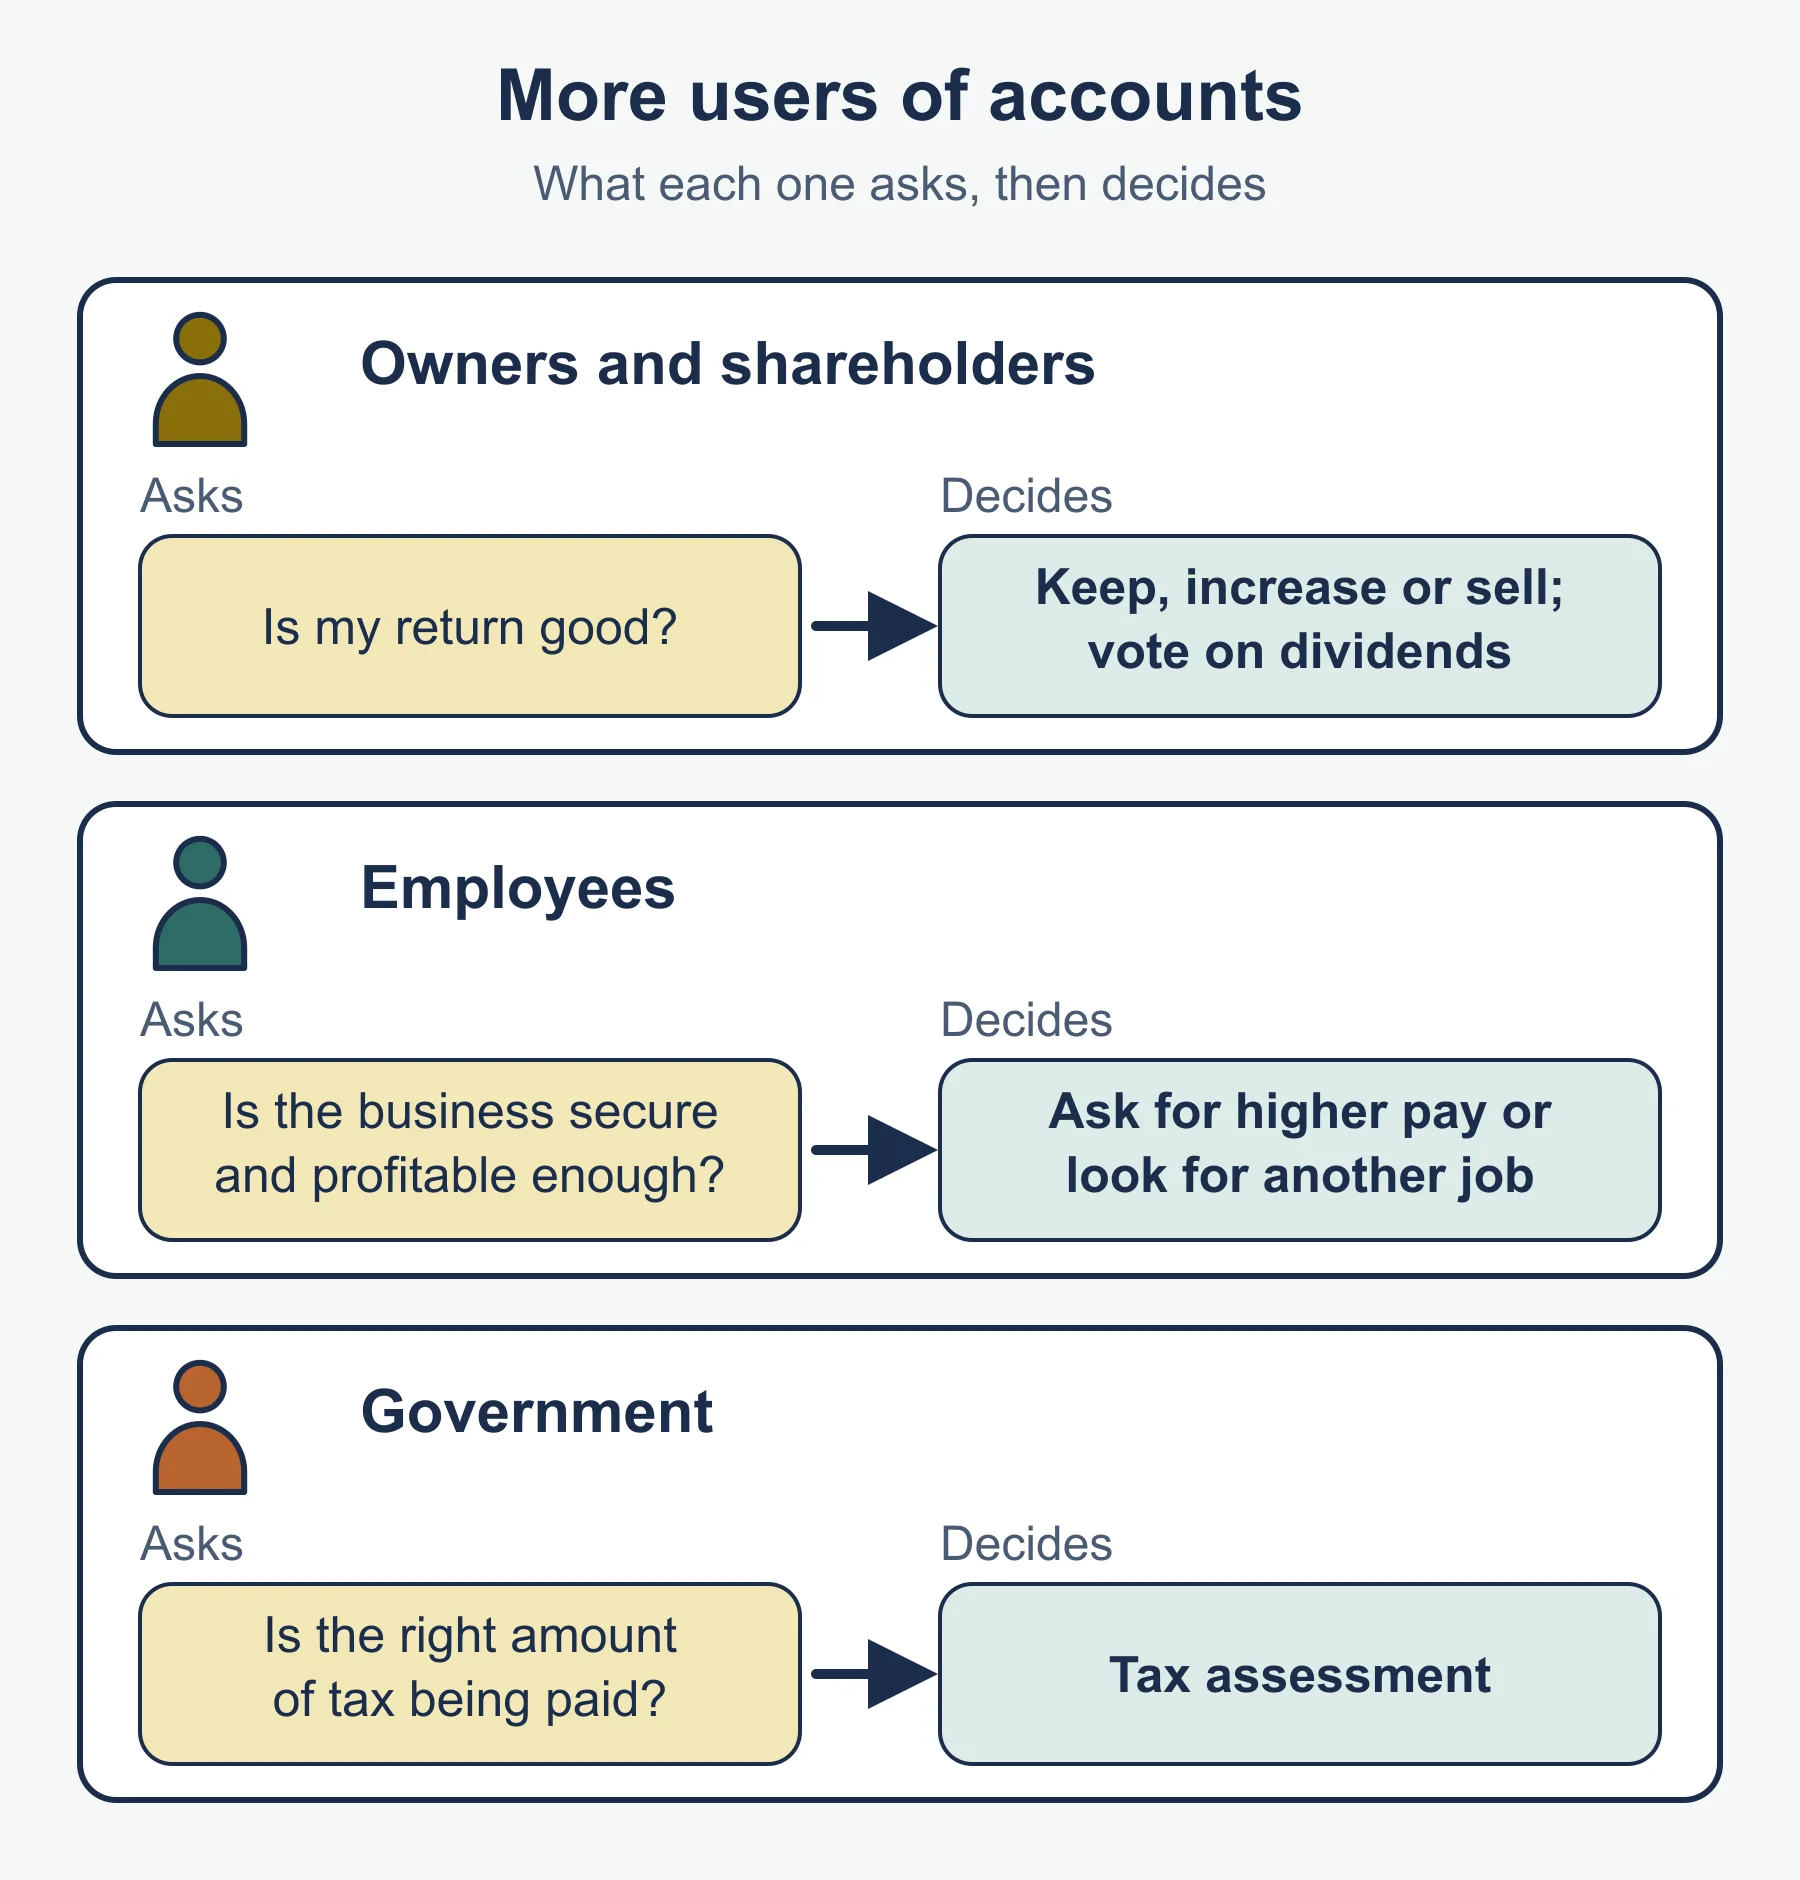
| Owners and shareholders | Is the business making a good return on their investment? | Keep, increase or sell the investment; vote on dividends |
| Managers | Which products and costs need attention? How does this year compare with the plan? | Cut costs, change prices, set targets |
| Lenders such as banks | Can the loan and interest be repaid? | Whether to lend, how much, and on what terms |
| Suppliers | Will invoices be paid on time? | Whether to allow credit, and for how long |
| Employees | Is the business secure and profitable enough to keep jobs and pay rises? | Whether to ask for higher pay or look for another job |
| Government | Is the right amount of tax being paid? | Tax assessment |
| Potential investors | Is the return high enough to justify the risk? | Whether to invest |
These are examples. The syllabus asks for the needs of different users and how they might use results, and gives lending and investing as examples.
Match the ratio to the user. A lender or supplier cares most about liquidity (current ratio, acid test) and profit that can cover interest. An investor cares most about ROCE and profit margin. A manager looks at all five, mainly to spot problems early.
Common errors
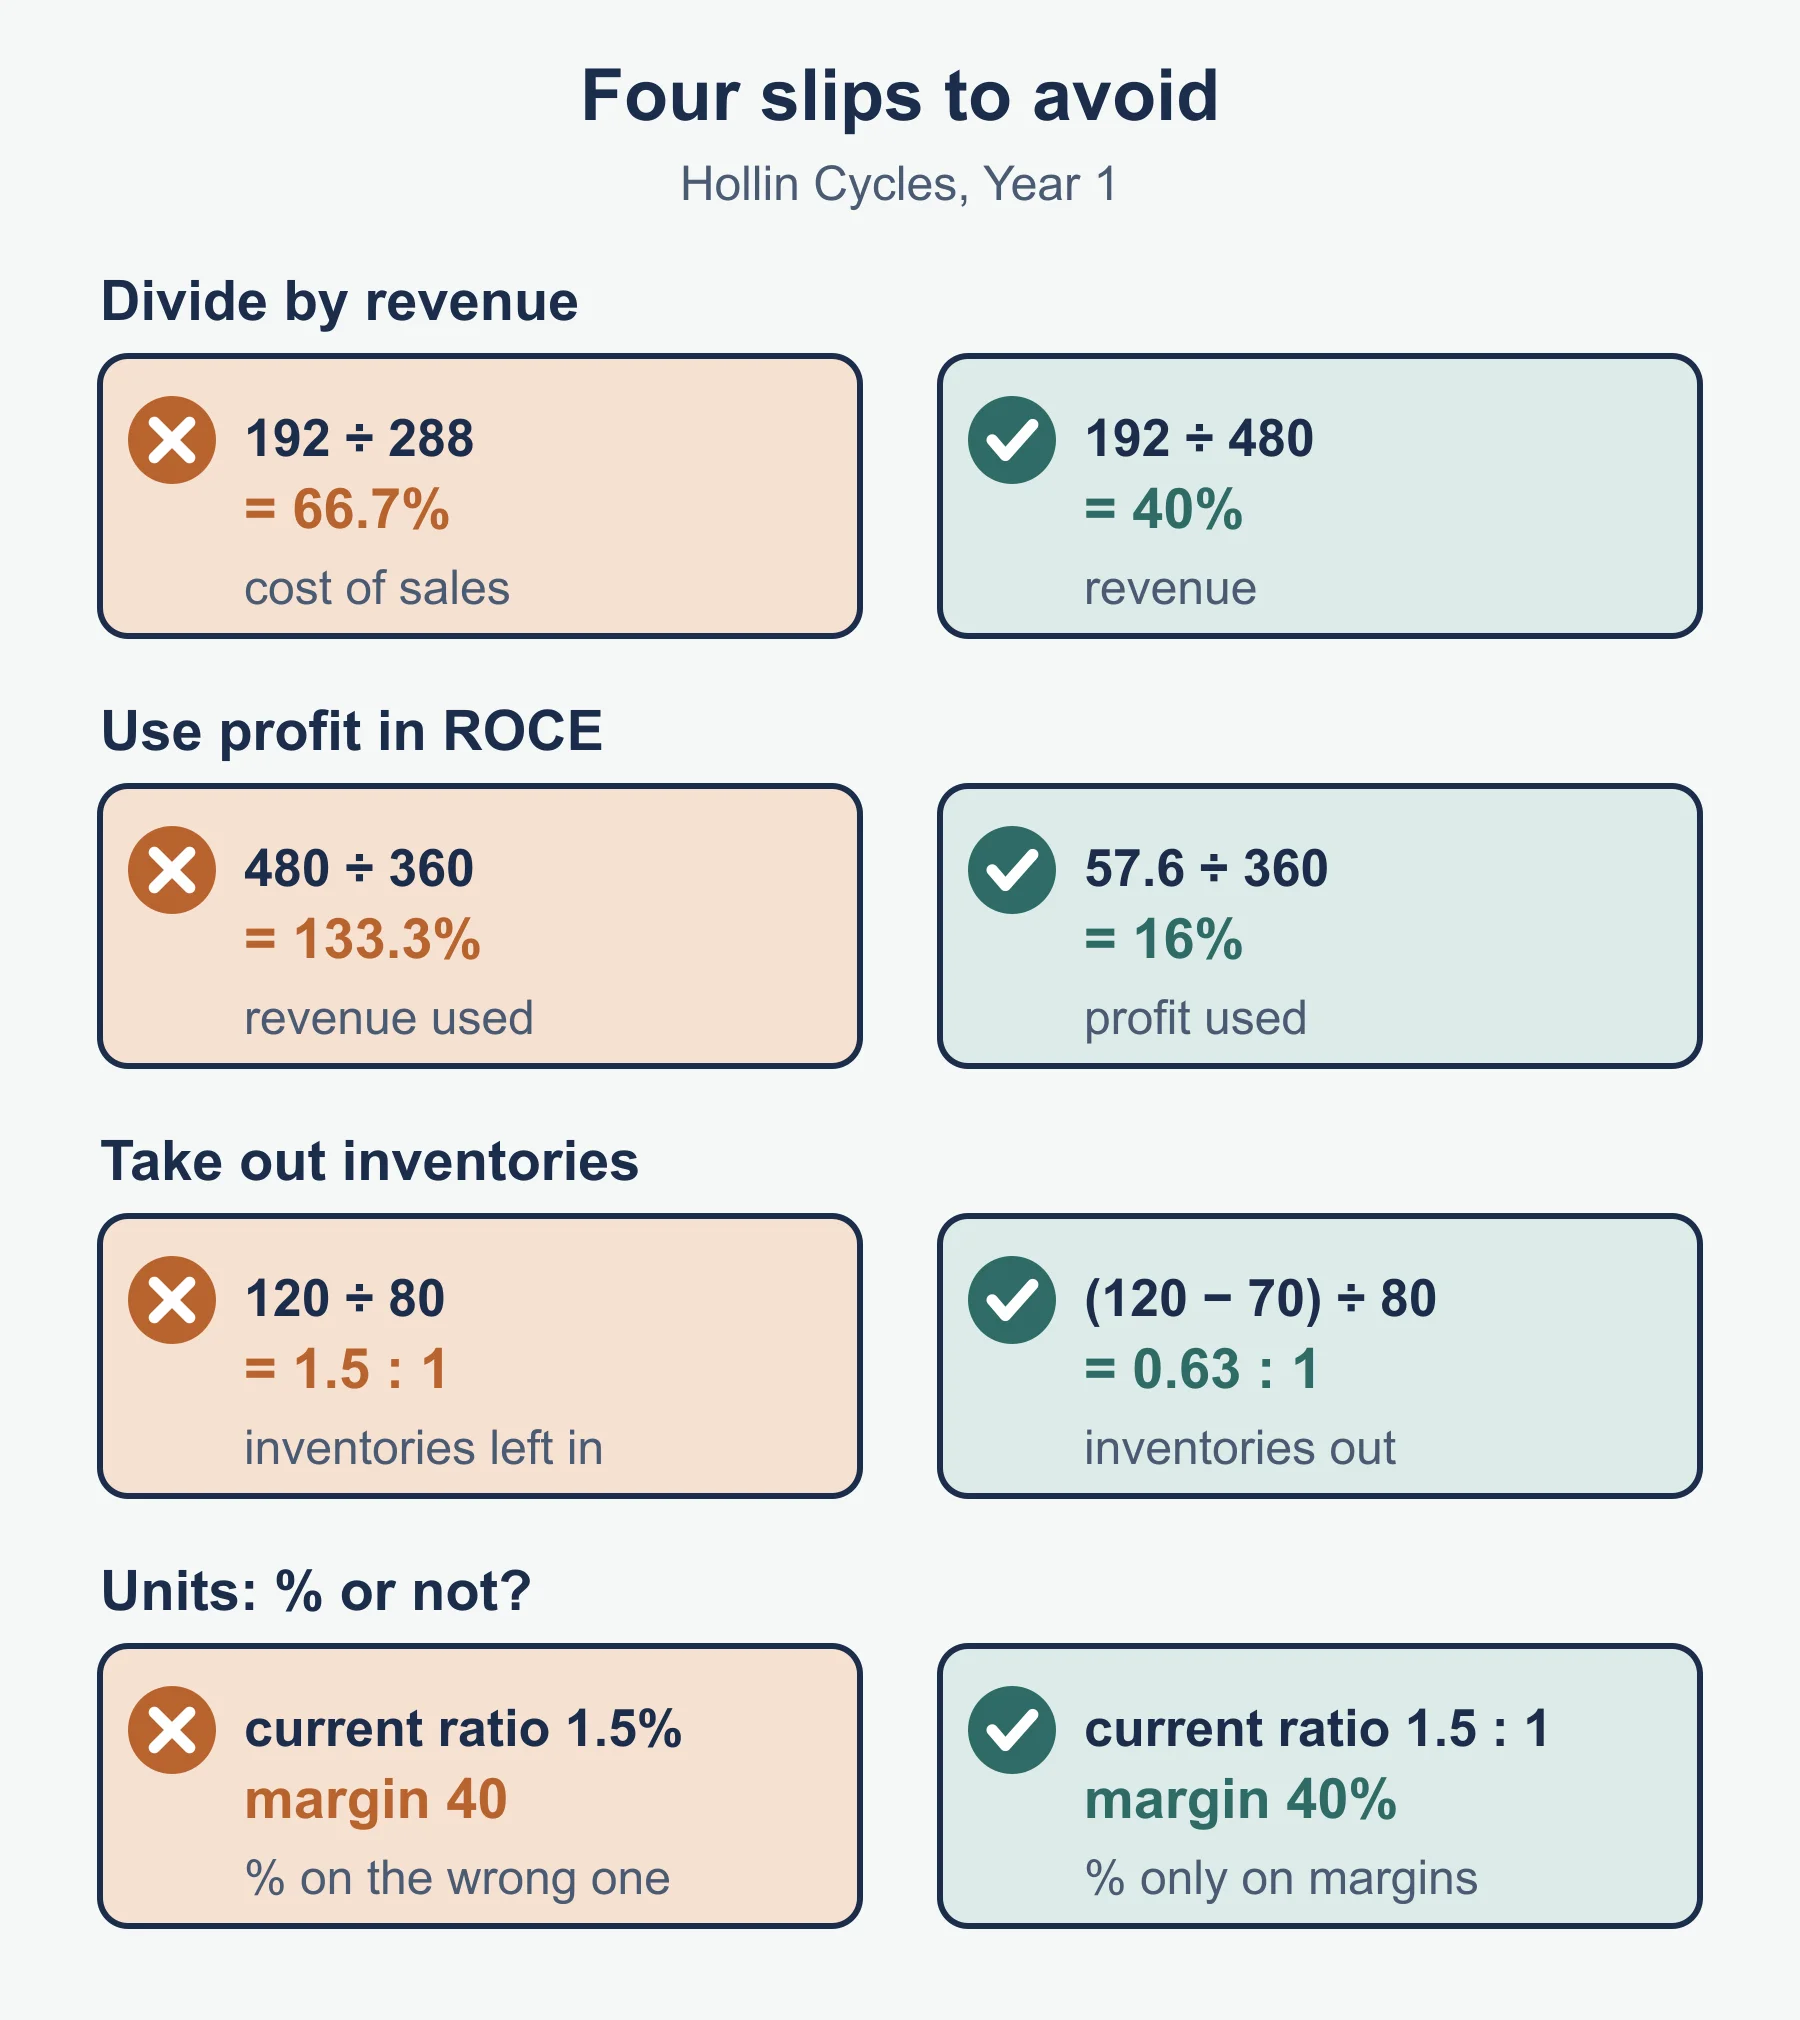
- Dividing gross profit by cost of sales instead of revenue.
- Using revenue as the profit figure in ROCE.
- Writing a % sign after the current ratio or acid test ratio, or leaving it off the margins and ROCE.
- Leaving inventories in the acid test calculation.
- Describing a figure without explaining what it means for the business.
- Saying a high current ratio is always good, with no comment on idle assets.
- Naming a user without saying which result that user would look at and what they would decide.
Frequently asked questions
What is the difference between profitability and liquidity? Profitability is how well a business earns profit compared with its revenue or the money invested in it. Liquidity is its ability to pay short-term debts when they fall due, using cash or assets that can quickly become cash.
What does it mean if gross profit margin is steady but profit margin falls? The cause lies in overheads such as rent, wages or marketing, not in the cost of sales. A fall in gross profit margin itself points to cheaper pricing, dearer suppliers or wastage.
Can a profitable business run out of cash? Yes. Profit and cash are different: a business can sell on credit and record a profit while customers have not yet paid, and it can be forced to stop trading if it cannot pay wages or suppliers on time.
How do you judge whether a ratio is good or bad? A ratio on its own says little. Compare it with the same business in earlier years, with similar businesses and with the business’s own targets, then explain why it changed using the case.
Official syllabus
Cambridge O Level Business Studies 7115 syllabus for examination in 2026, Cambridge International, section 5.5.
Get free revision emails (optional)
Occasional emails with practice questions, worked explanations and links to free resources for the qualification and subjects you choose. No spam, and you can unsubscribe from any email. The free tools on this site never need an email.
Related resources
-
Practice questions
O Level Business: Analysis of accounts (Cambridge 7115) – Practice Questions
Original questions with worked answers on profitability, liquidity, five ratios and users of accounts for Cambridge O Level Business Studies 7115 5.5.
Business · Cambridge · O Level
Try questions -
Revision notes
O Level Business: Analysis of accounts (Cambridge 7115) – Revision Notes
Condensed notes on profitability, liquidity, the five ratios and users of accounts, with a self-test, for Cambridge O Level Business Studies 7115 5.5.
Business · Cambridge · O Level
Revise topic -
Study guides
O Level Business: Business finance: needs and sources (Cambridge 7115)
Why businesses need finance and where it comes from: internal, external, short-term and long-term sources, for Cambridge O Level Business.
Business · Cambridge · O Level
Read guide
Related articles
-
teaching
A Level tuition in Dubai: Cambridge or Pearson Edexcel International A Level?
Schools in Dubai and Abu Dhabi teach either Cambridge International AS & A Level or Pearson Edexcel International A Level. How the two are structured, why it matters for tuition, and how online classes from Lahore work.
9 October 2026
-
curriculum guides
Choosing subjects at IGCSE and A Level
How subject choices at 14 and 16 affect university options later, and how to keep pathways open without overloading a timetable.
28 July 2026
Studying this with a teacher
Working through Business O LEVELS?
This page is free and stays free. If you would rather be taught it, Marlbridge runs Business classes one-to-one and in small groups of up to 15, online in your own time zone. The first trial class is free. WhatsApp replies within an hour (8am–11pm Pakistan time, every day); email the same day.
Cambridge Business teachers at Marlbridge

