
Revision Notes
OCR GCSE Business: Marketing (J204) – Revision Notes
Condensed revision notes for OCR GCSE Business section 2, Marketing: research, segmentation, the four Ps, formulas, a self-test and common errors.
- Subject
- Business
- Level
- GCSE
- Topic
- Business activity, marketing and people
- Author
- Marlbridge Academic Team
- Updated
- Reviewed by
- Salman Ahmad (what this means)
Aligned to OCR GCSE Business (J204), Version 2.0 (January 2026), for first assessment in 2019. Official specification .
Syllabus page (what it covers and how it is assessed): OCR GCSE Business.
Syllabus points this page covers
J204
- 2 Marketing
Found an error? Report a correction.
Need help with this topic? Request a free trial class for GCSE Business (J204).
Quick recall for section 2, Marketing, of OCR GCSE (9-1) Business (J204), Version 2.0 (January 2026), topics 2.1 to 2.4. For full explanations and worked examples, read the study guide. Then test yourself with the practice questions. The wider component is covered in the Business 1 overview, the overview revision notes and the overview practice set. Course links: OCR GCSE Business hub, printable checklist and free diagnostics.
2.1 Role of marketing
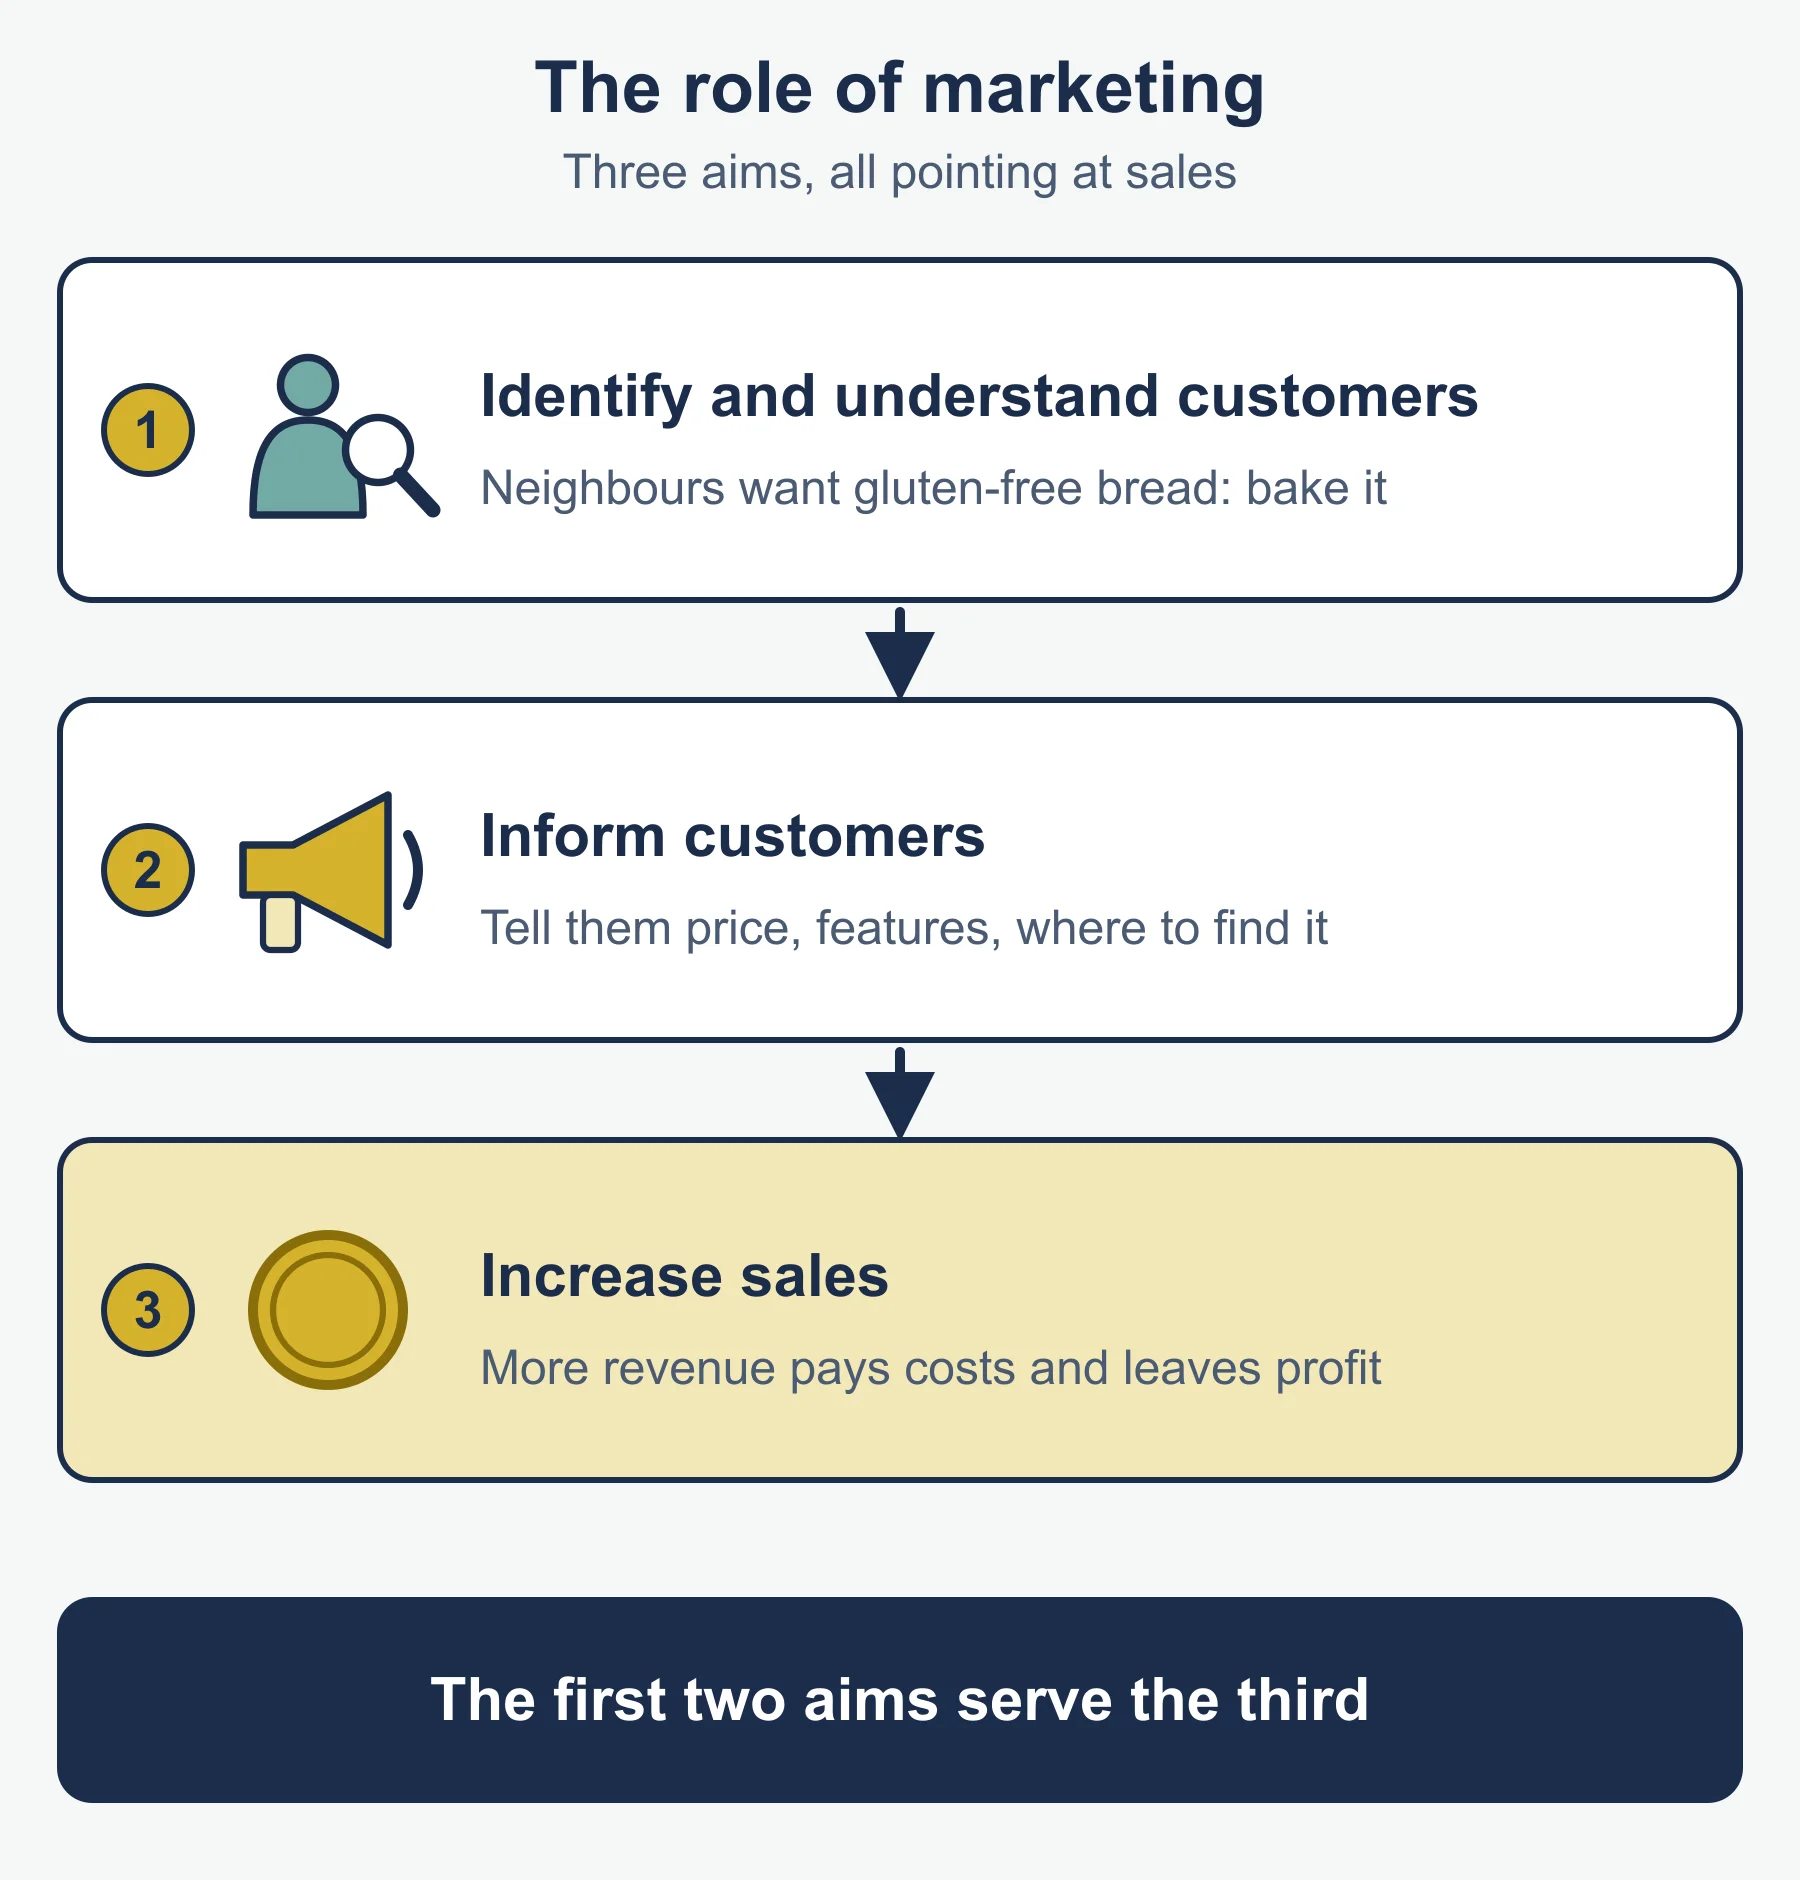
Three jobs, all named in the specification.
- Identify and understand customers
- Inform customers
- Increase sales
Link each to the business in the question.
2.2 Market research
Purpose: to identify and understand customer needs.
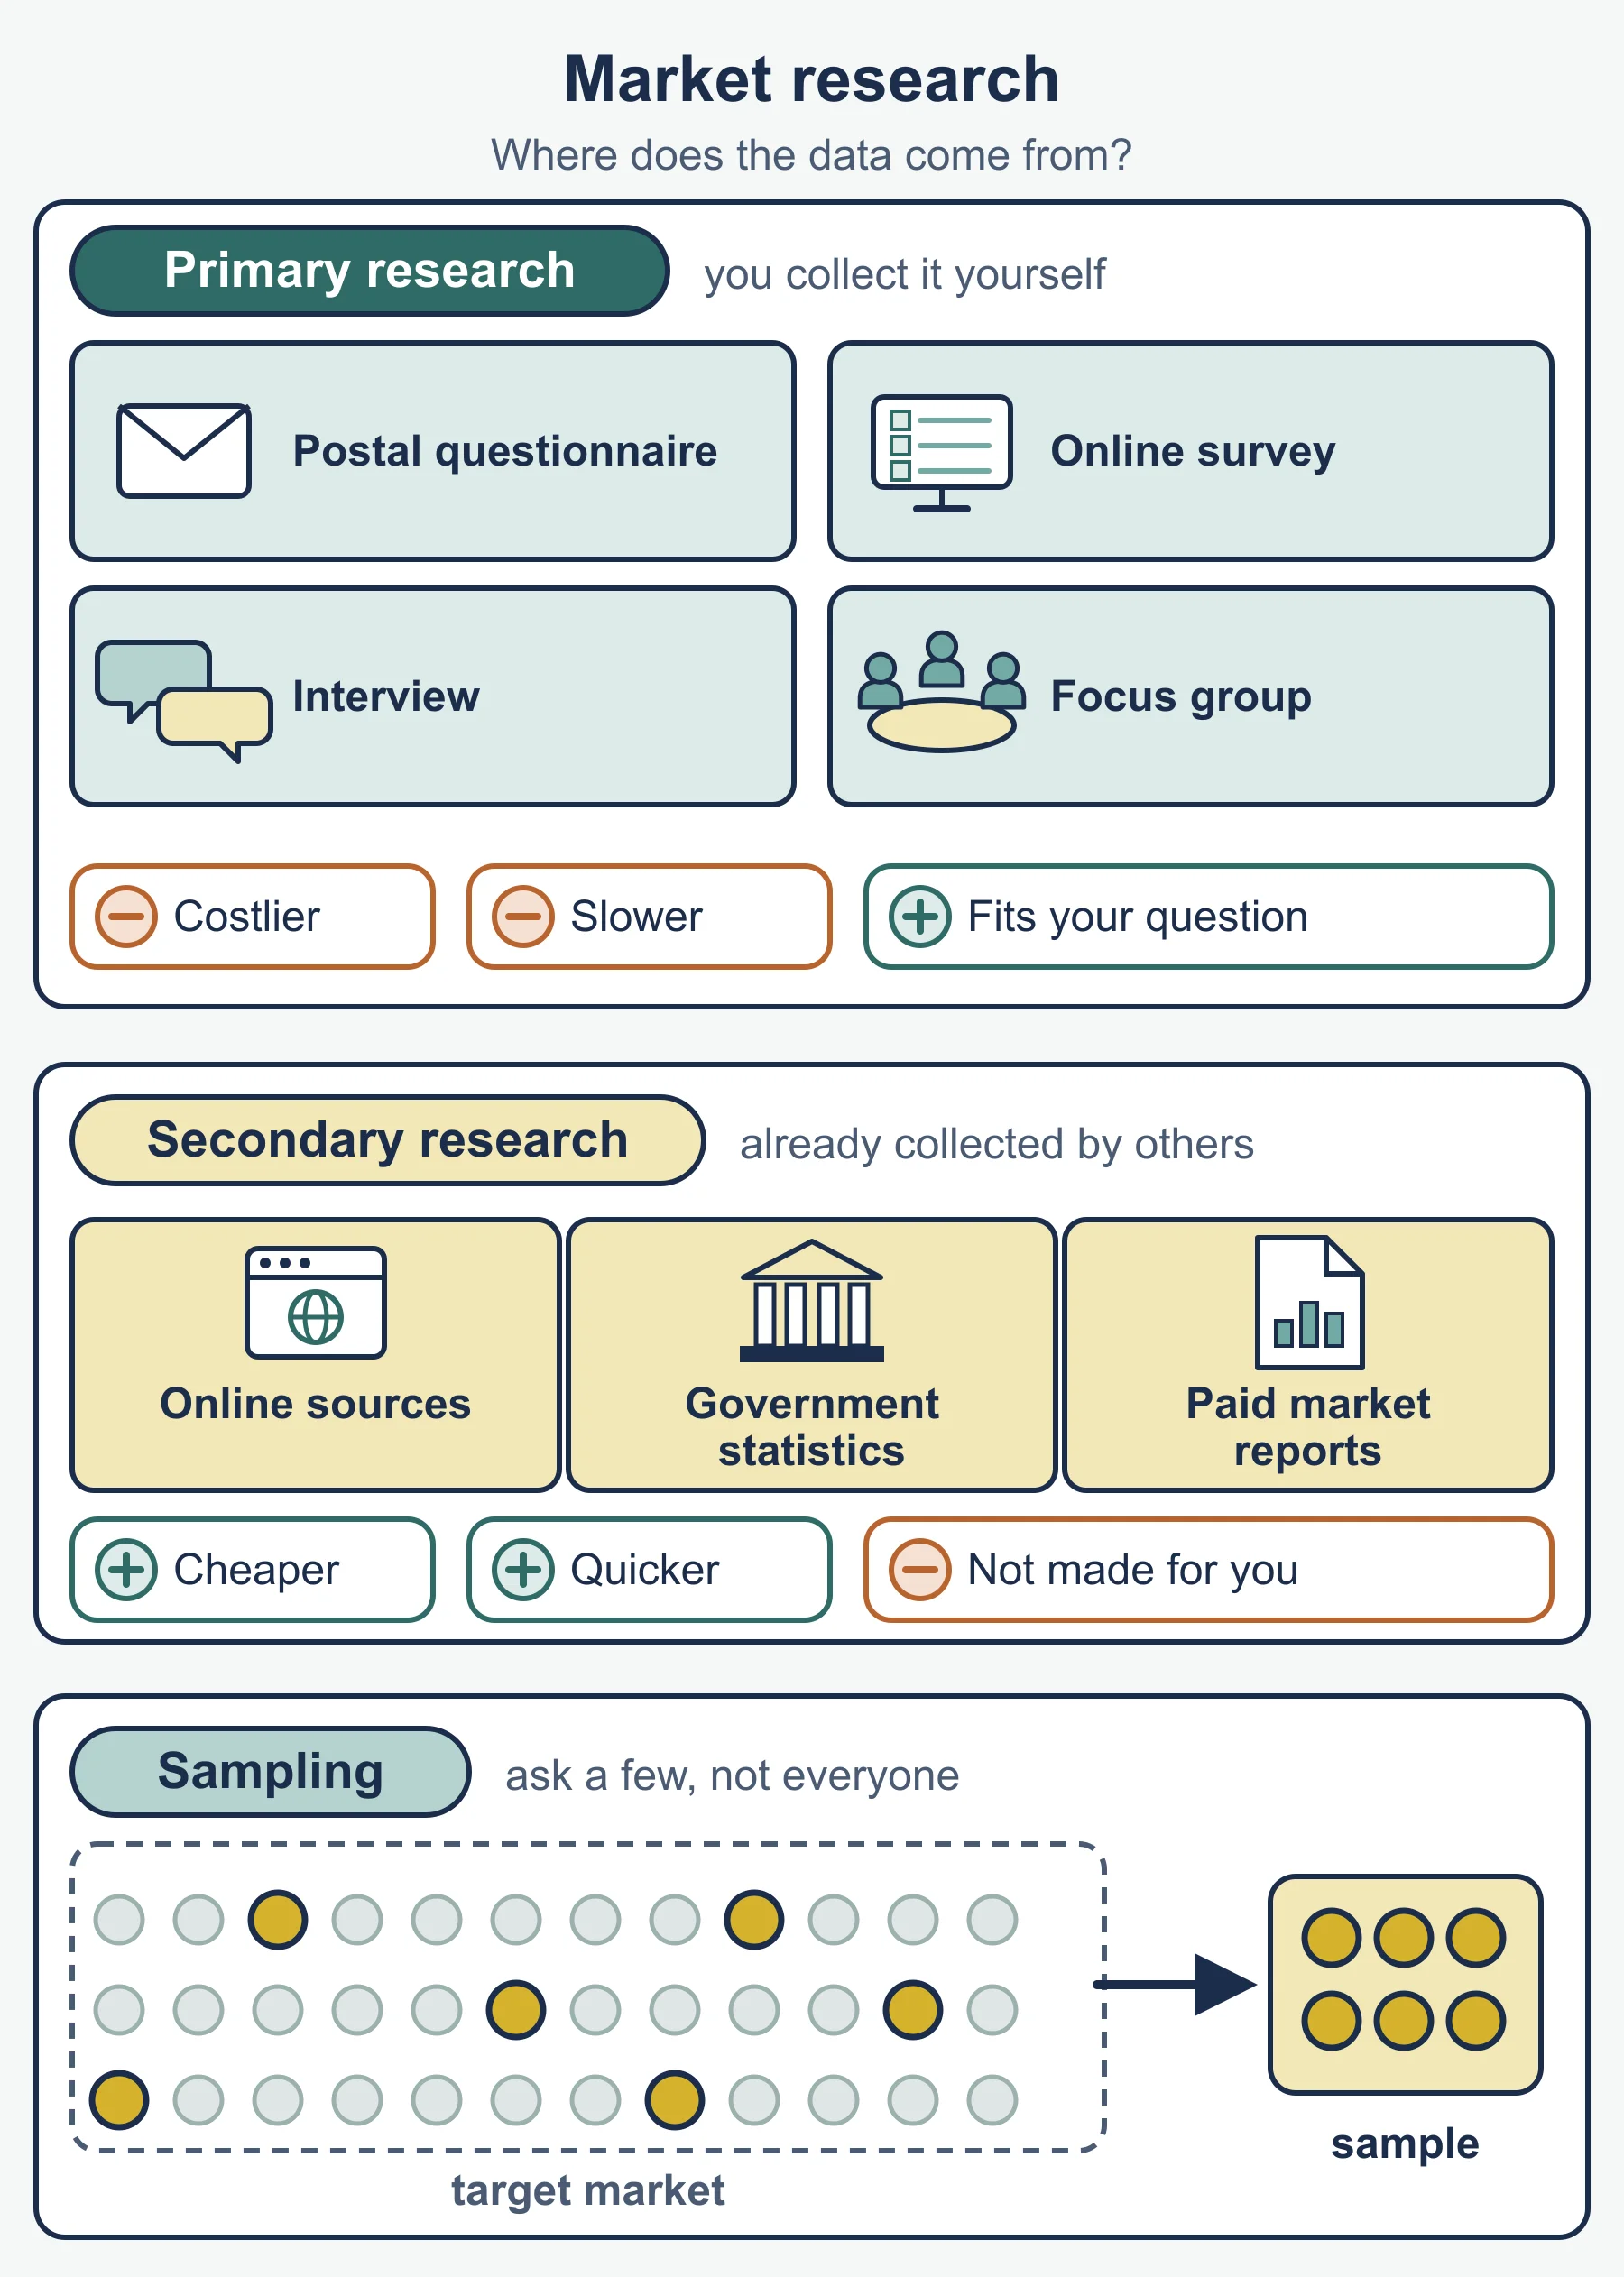
| Primary (first-hand) | Secondary (already exists) |
|---|---|
| Questionnaires | Newspapers and magazines |
| Interviews | Census |
| Trialling | Websites |
| Focus groups | Internal data |
| Primary | Secondary |
|---|---|
| Fits the exact question | Cheaper and quicker |
| Up to date | May be old or gathered for another purpose |
| Slower and costlier | Rivals can see it too |
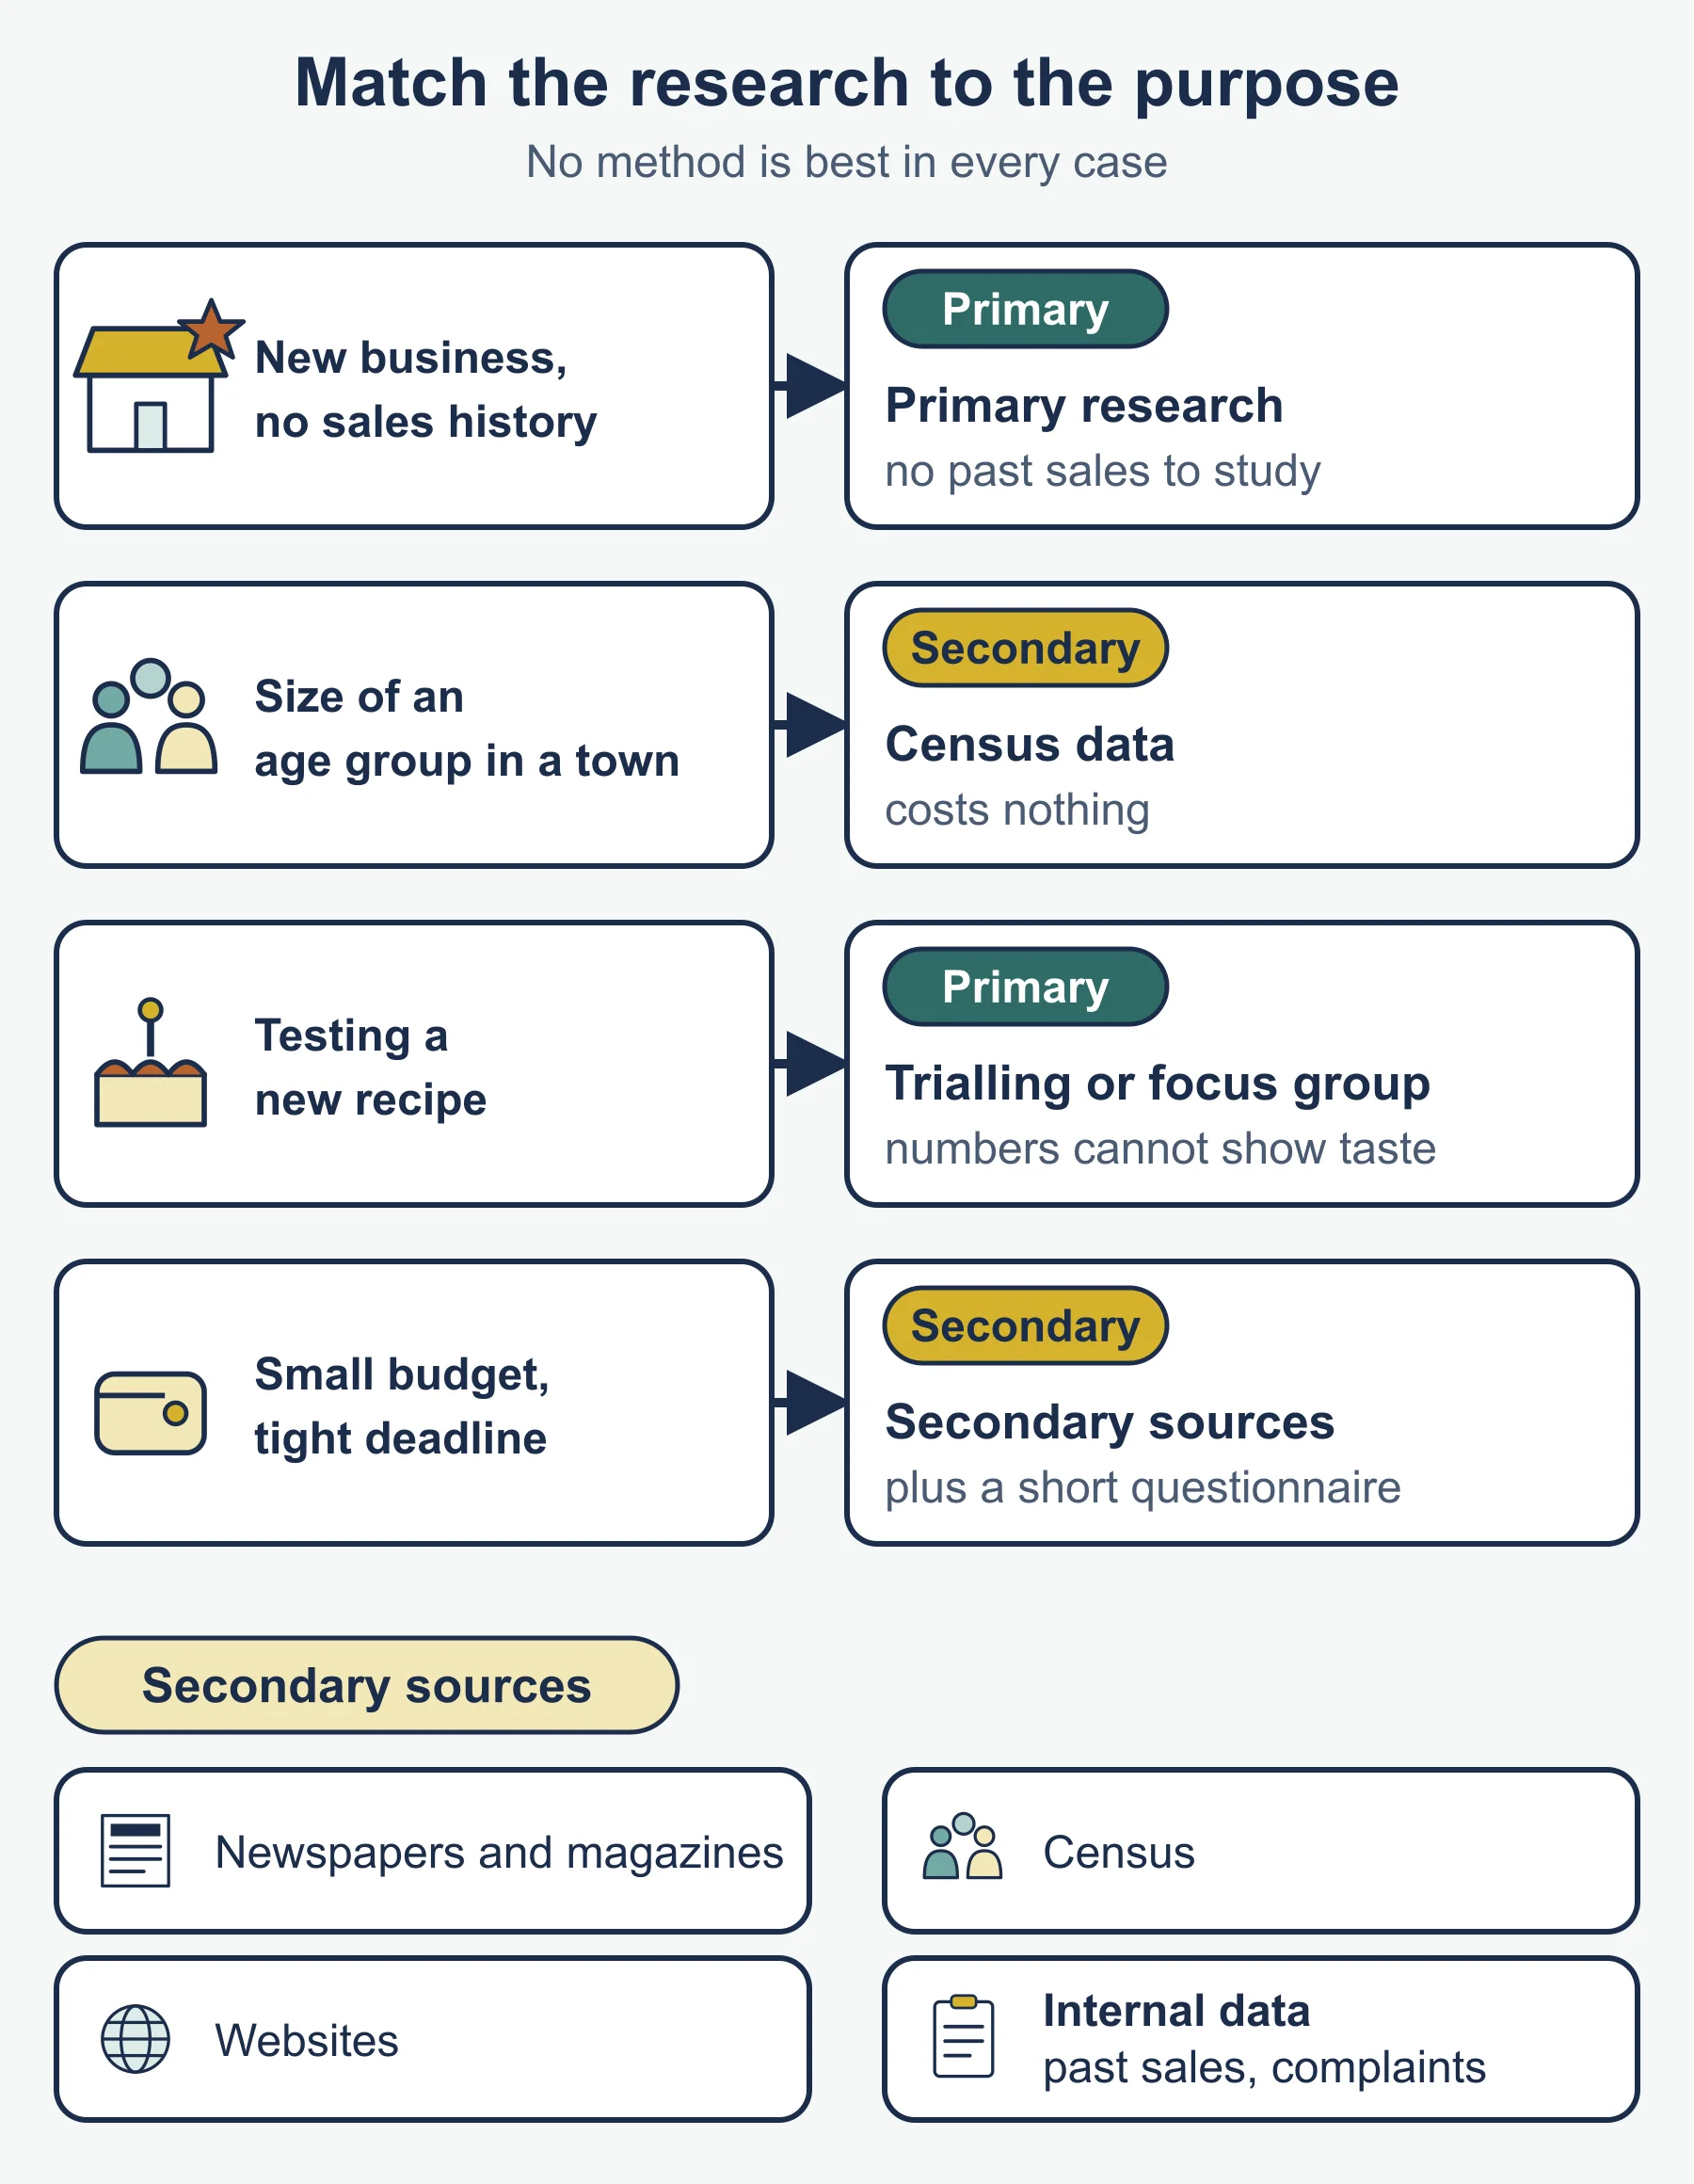
Which method for which purpose?
- Opinions and reasons: interview or focus group
- Many people, simple answers: questionnaire
- Reaction to a real sample: trialling
- Size of a group in an area: census
- Past sales trends: internal data
- Cheap and fast start: secondary sources
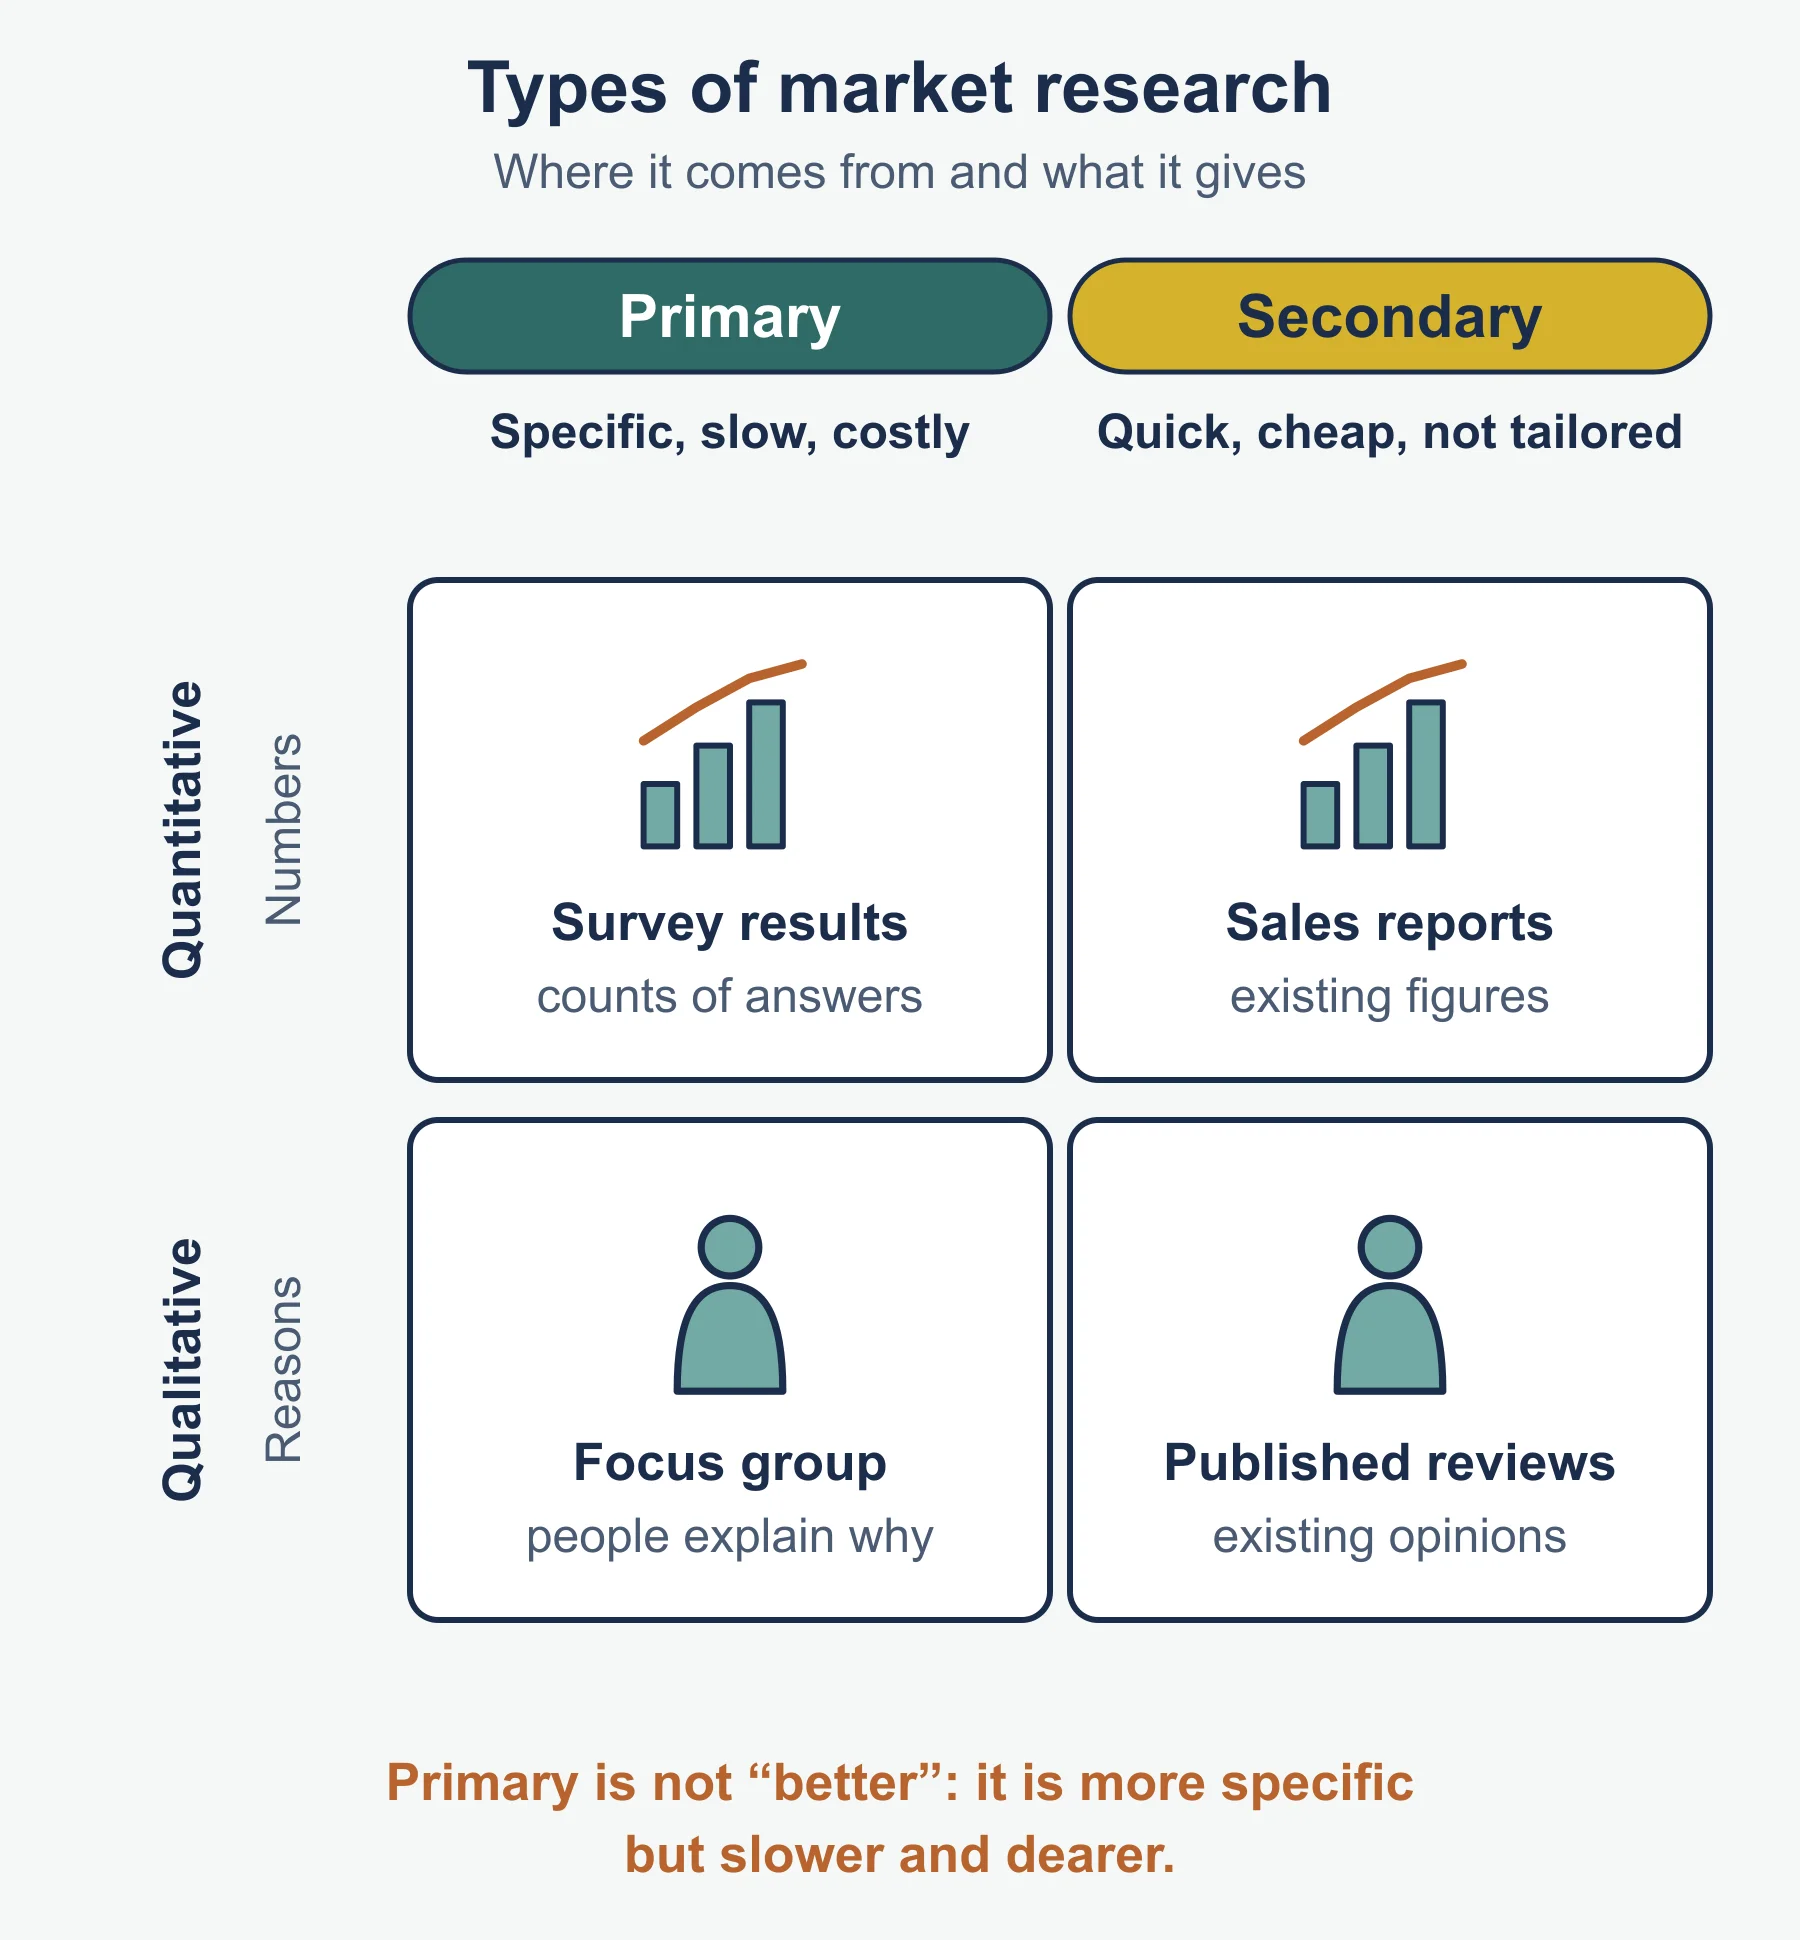
Qualitative versus quantitative
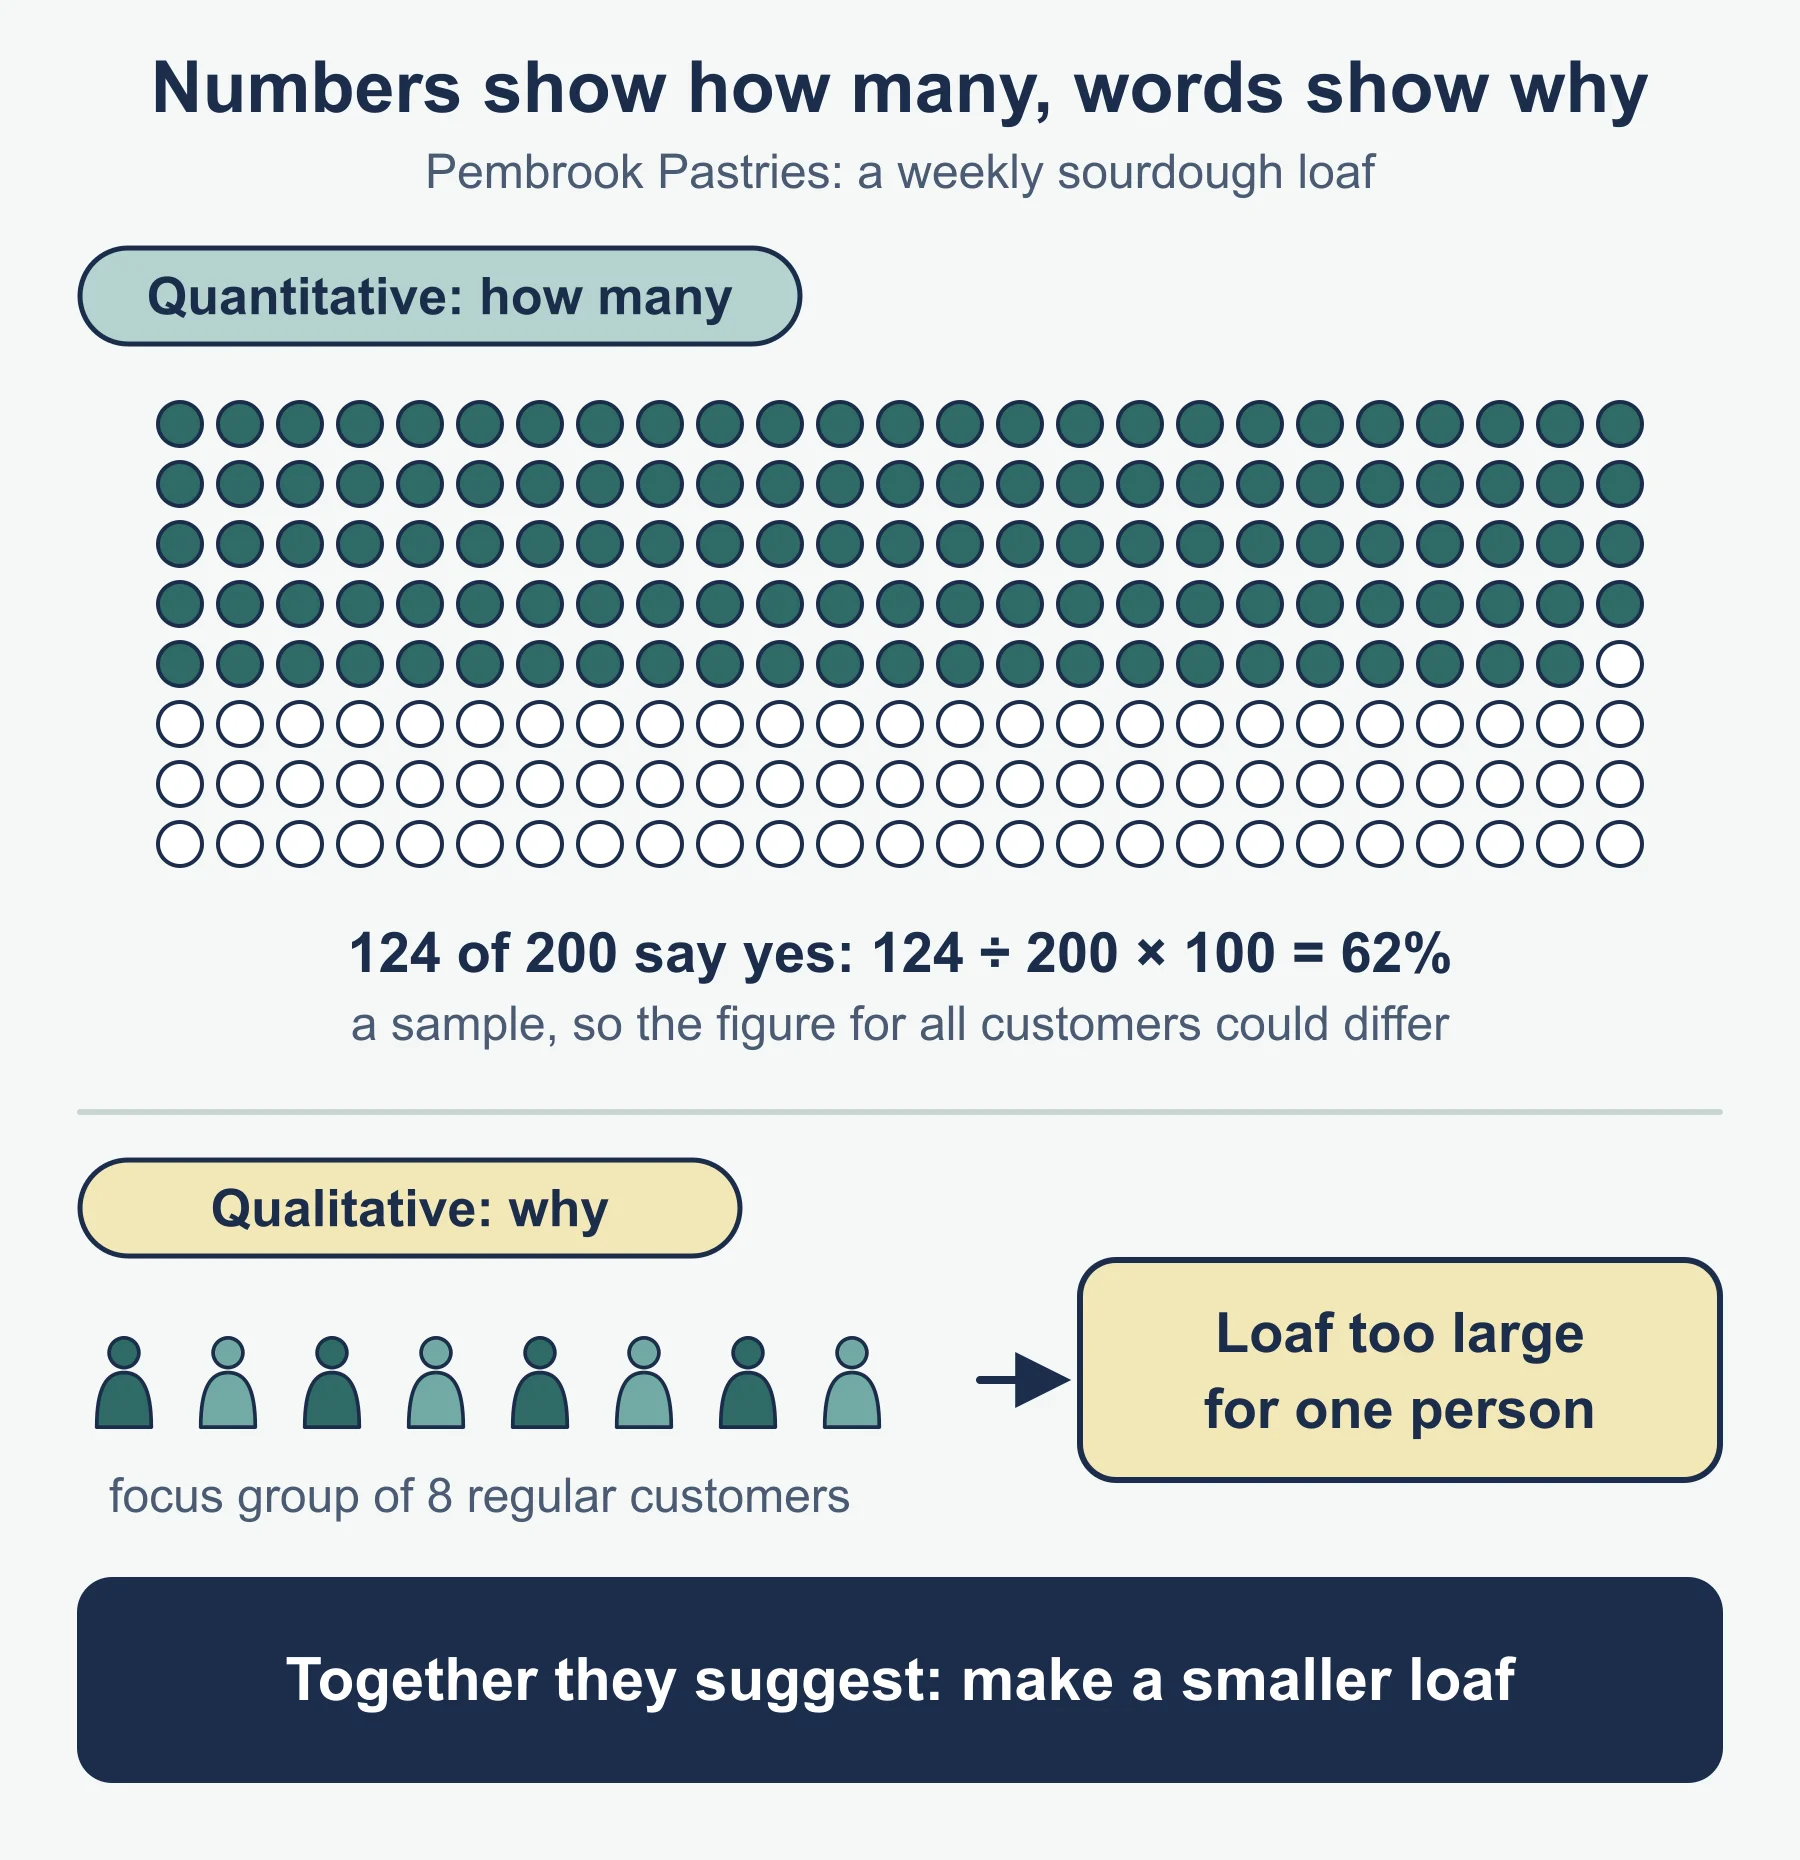
- Quantitative: numbers (counts, percentages, averages). Shows how many.
- Qualitative: opinions and reasons. Shows why.
- Use both. A percentage with no reasons leaves the next step unclear.
2.3 Market segmentation
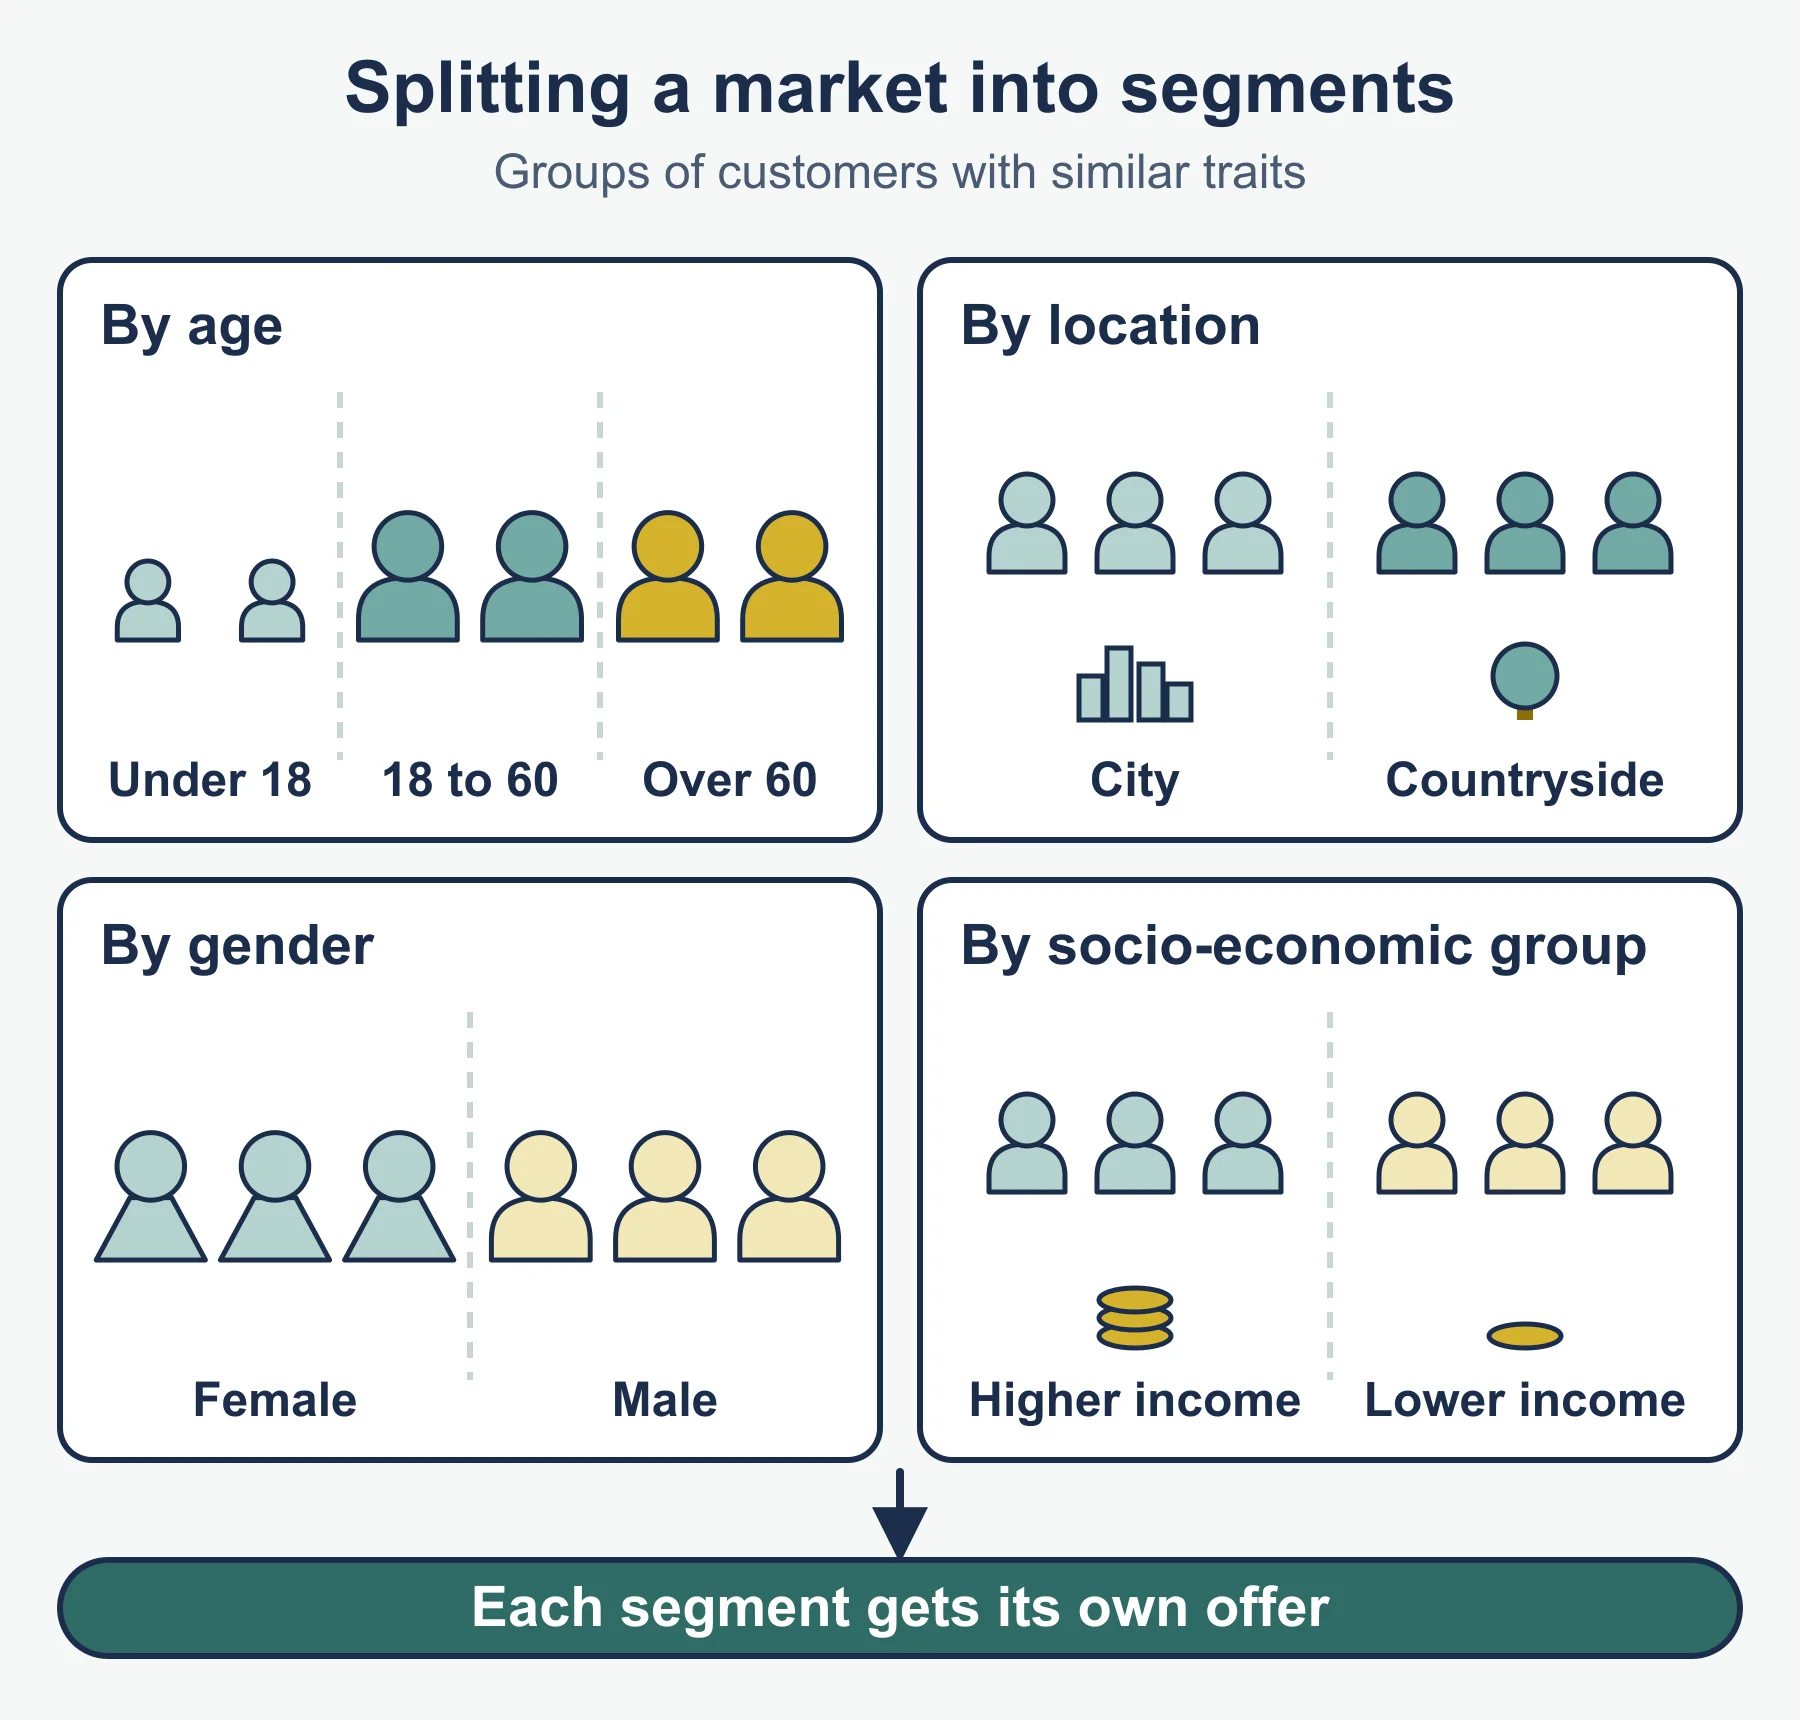
Segmentation splits a market into groups. The five bases in the specification are age, gender, income, location and lifestyle. Benefit: the whole mix can be aimed at one group. Drawback: extra research and sometimes extra products.
2.4 The marketing mix
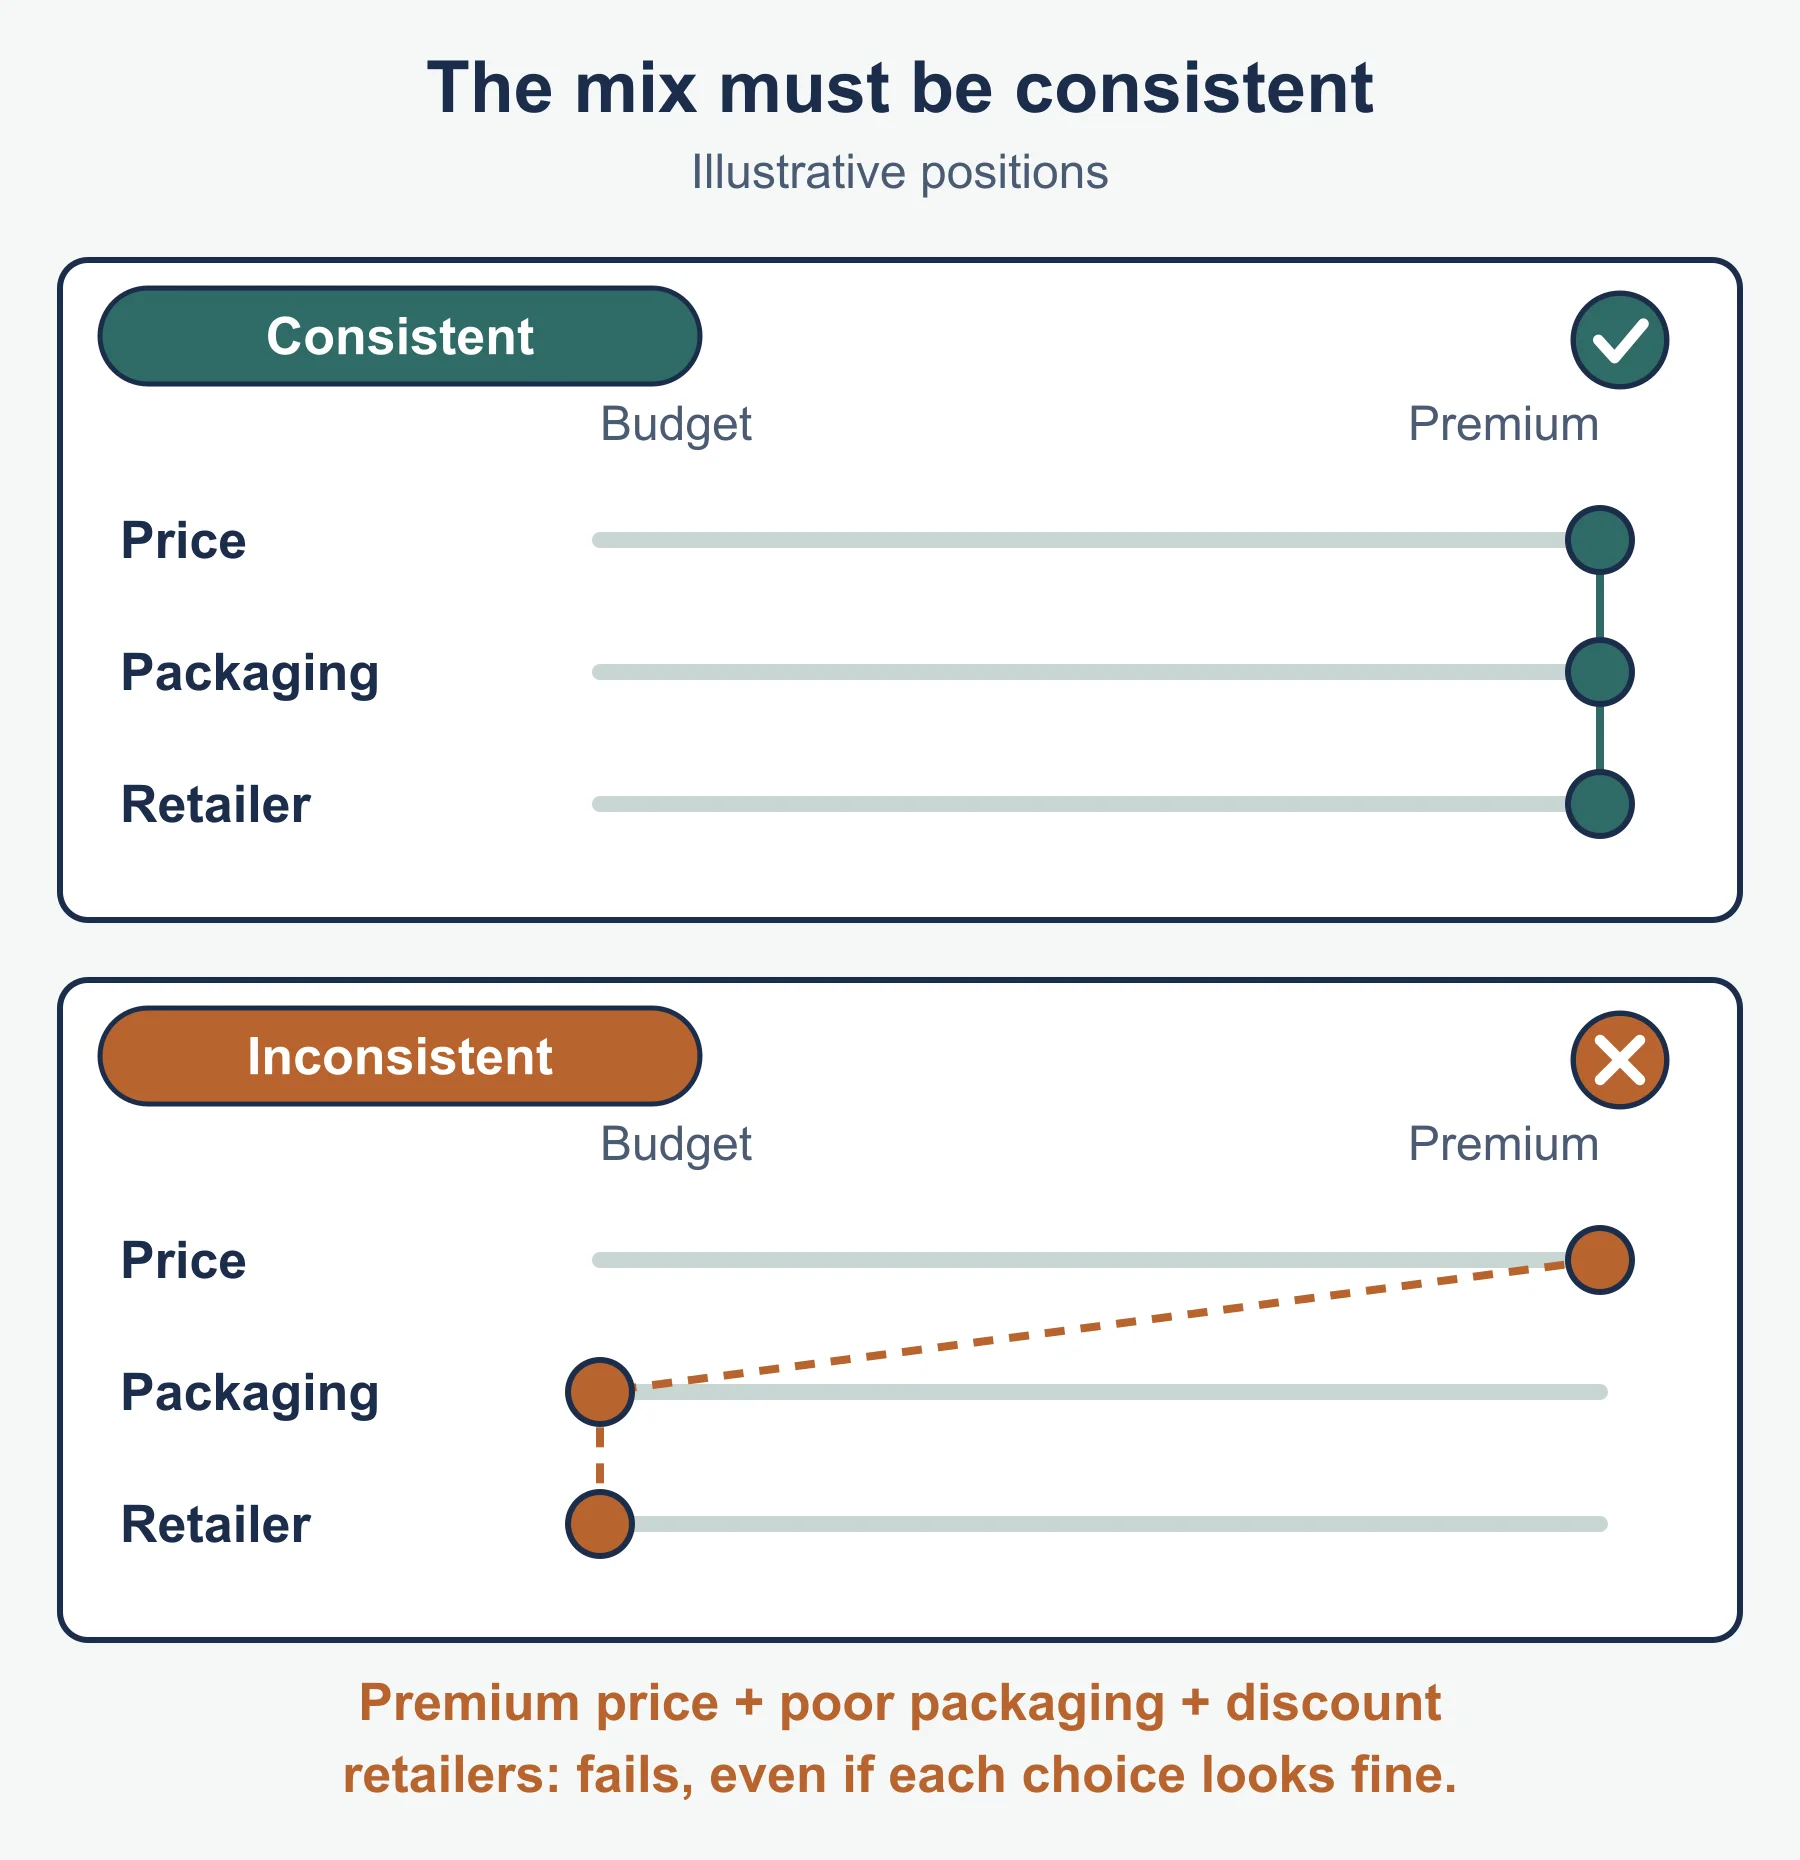
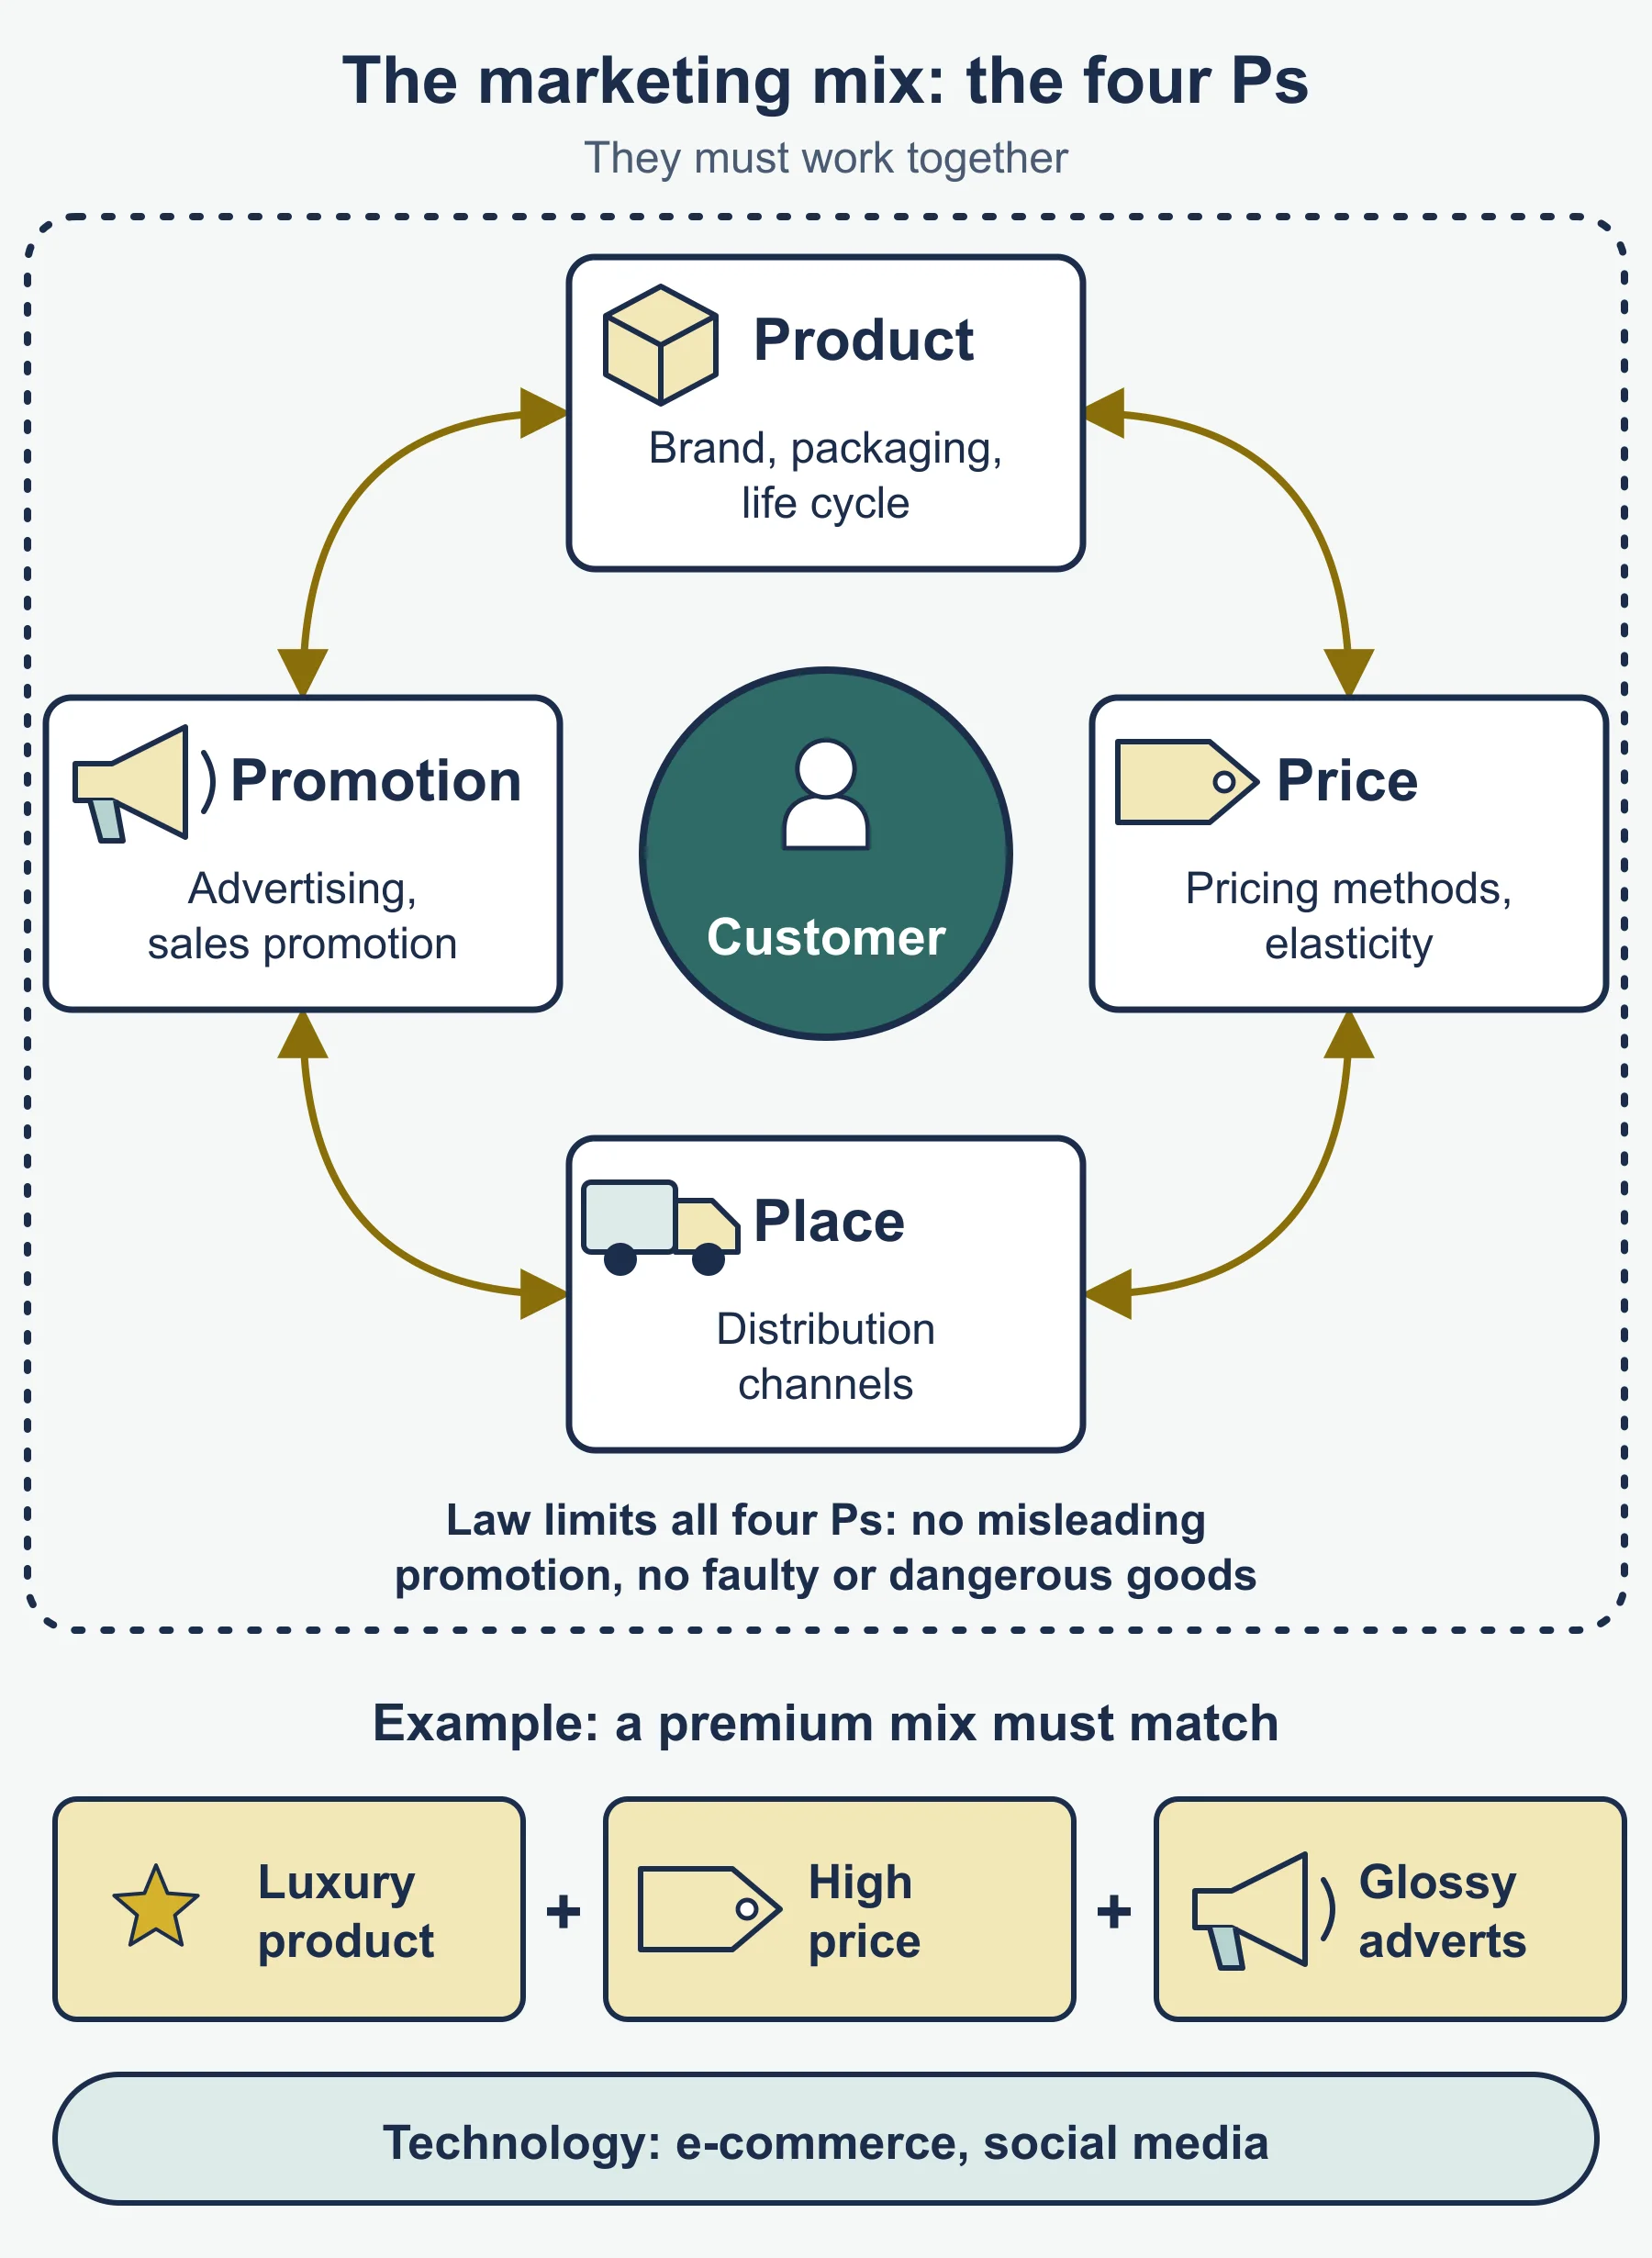
The four Ps: product, price, promotion, place. They must fit together.
| P | Content to know |
|---|---|
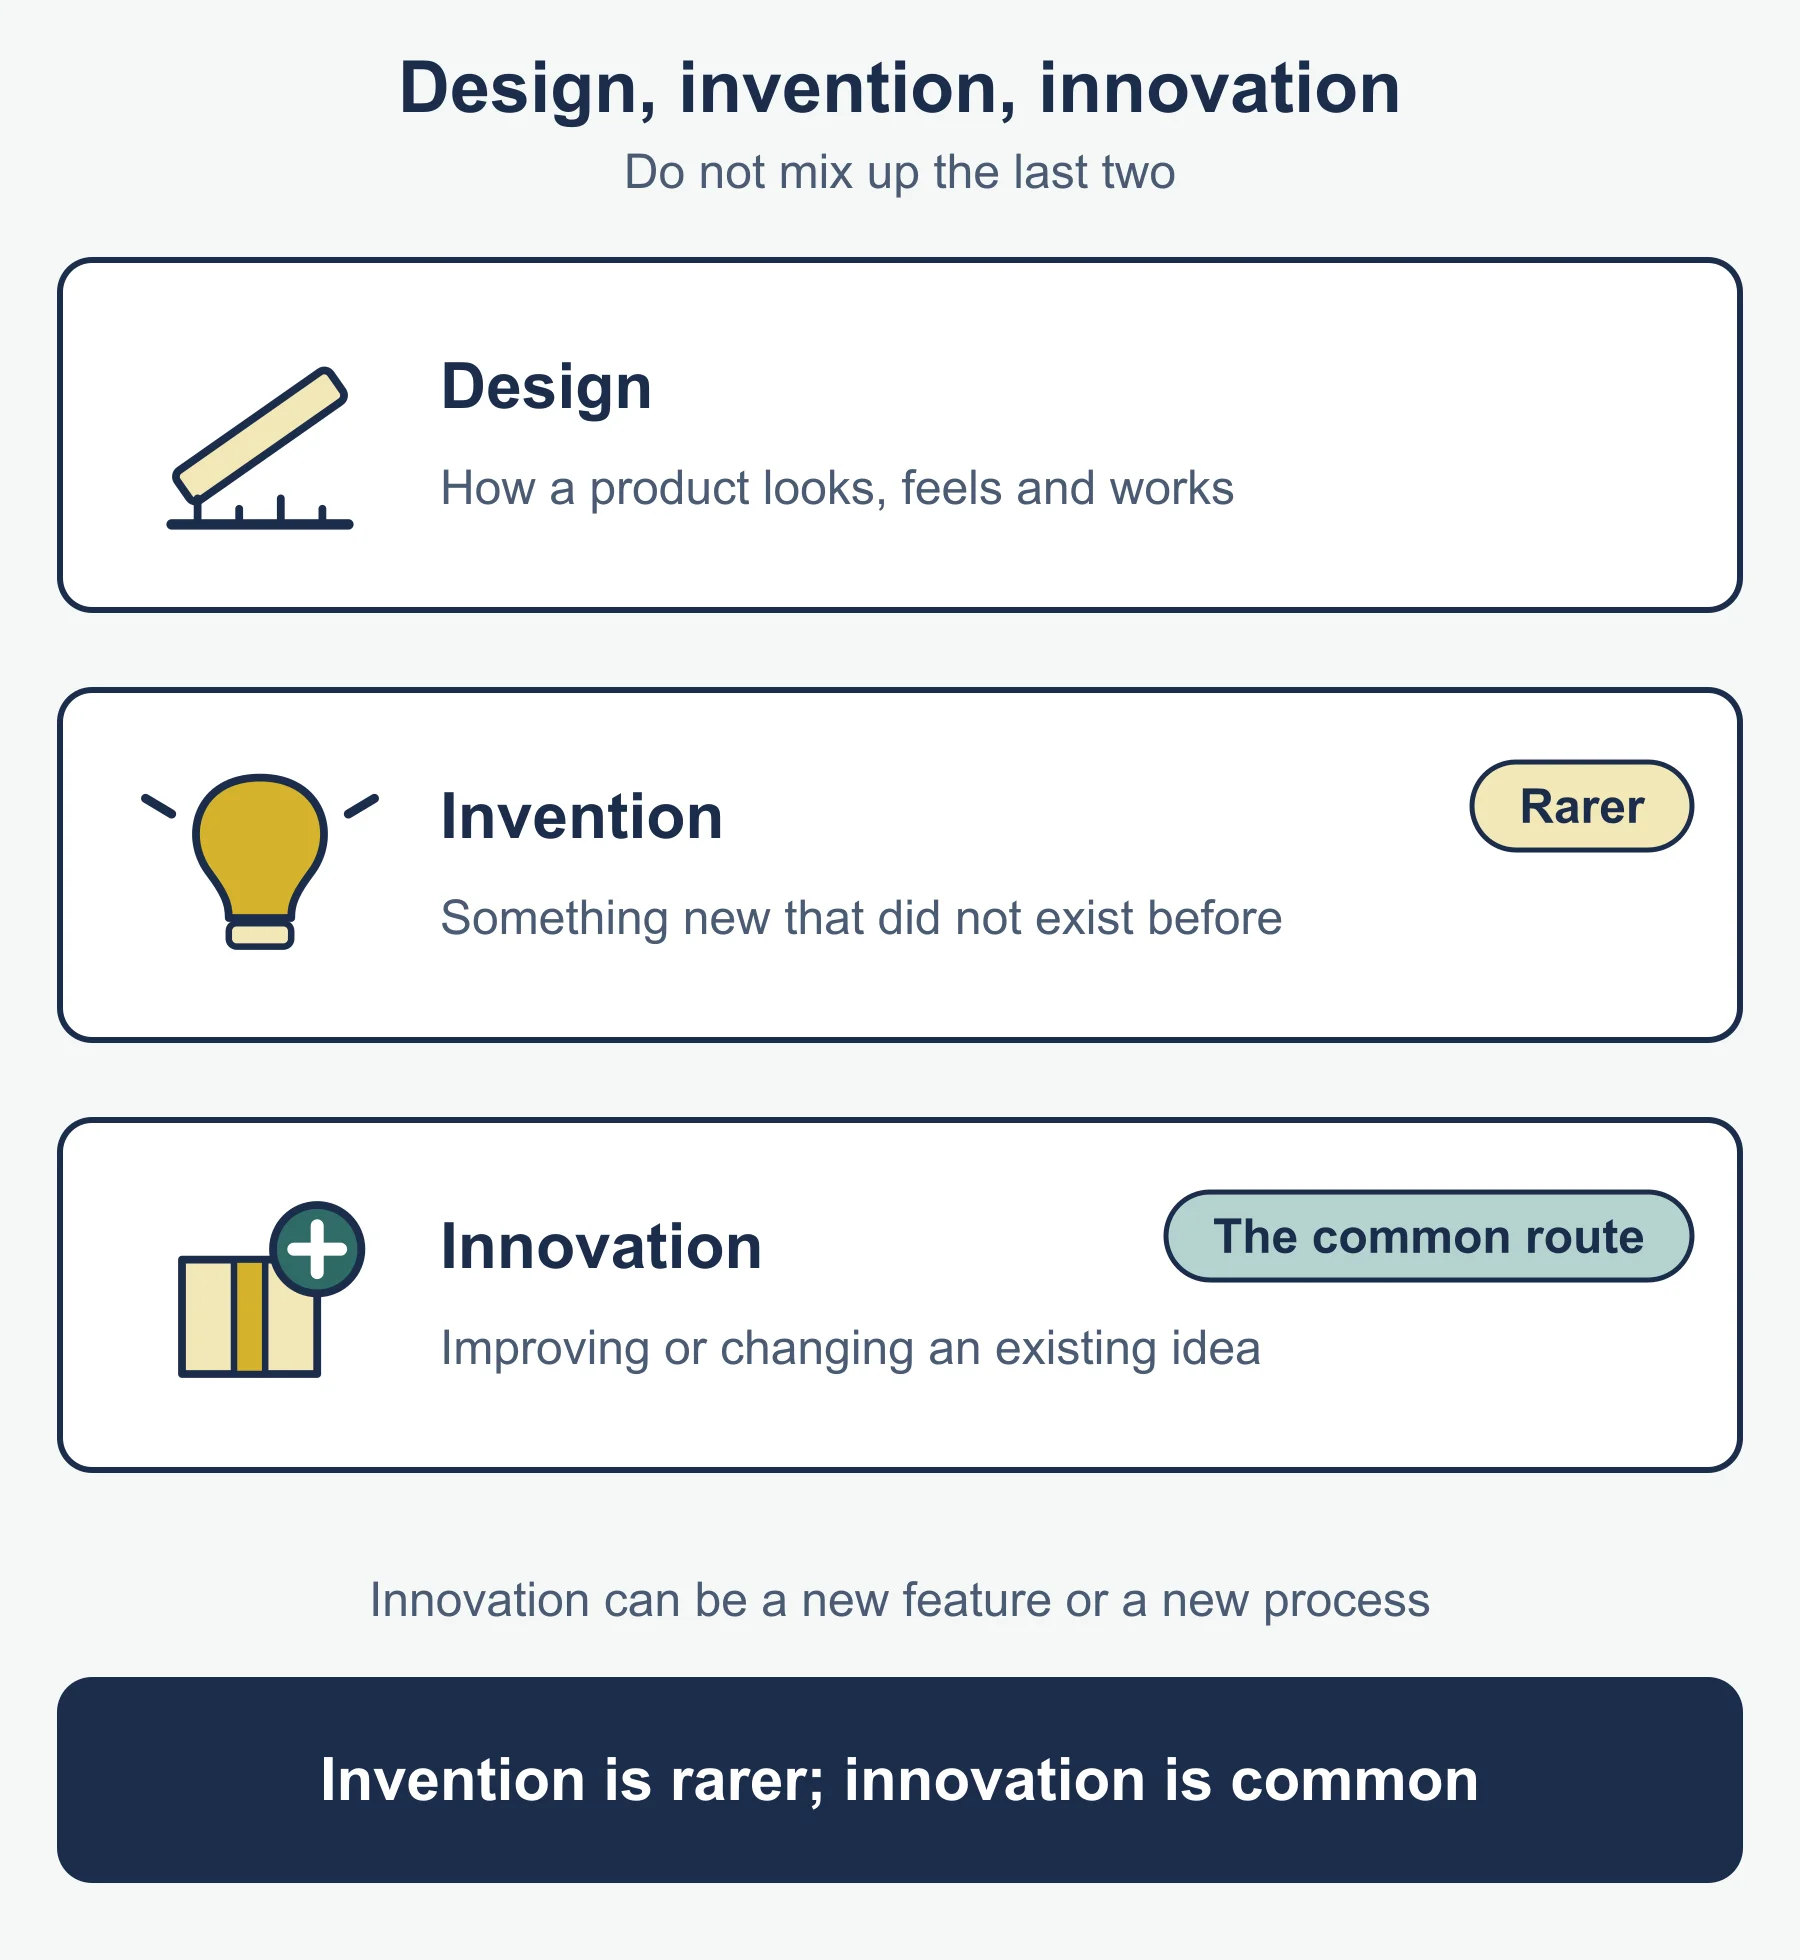
| Product | Design, invention (brand new), innovation (improvement); life cycle stages |
| Price | Skimming, cost-plus, penetration, competitor, promotional |
| Promotion | Point of sale; advertising |
| Place | Digital and physical distribution channels |
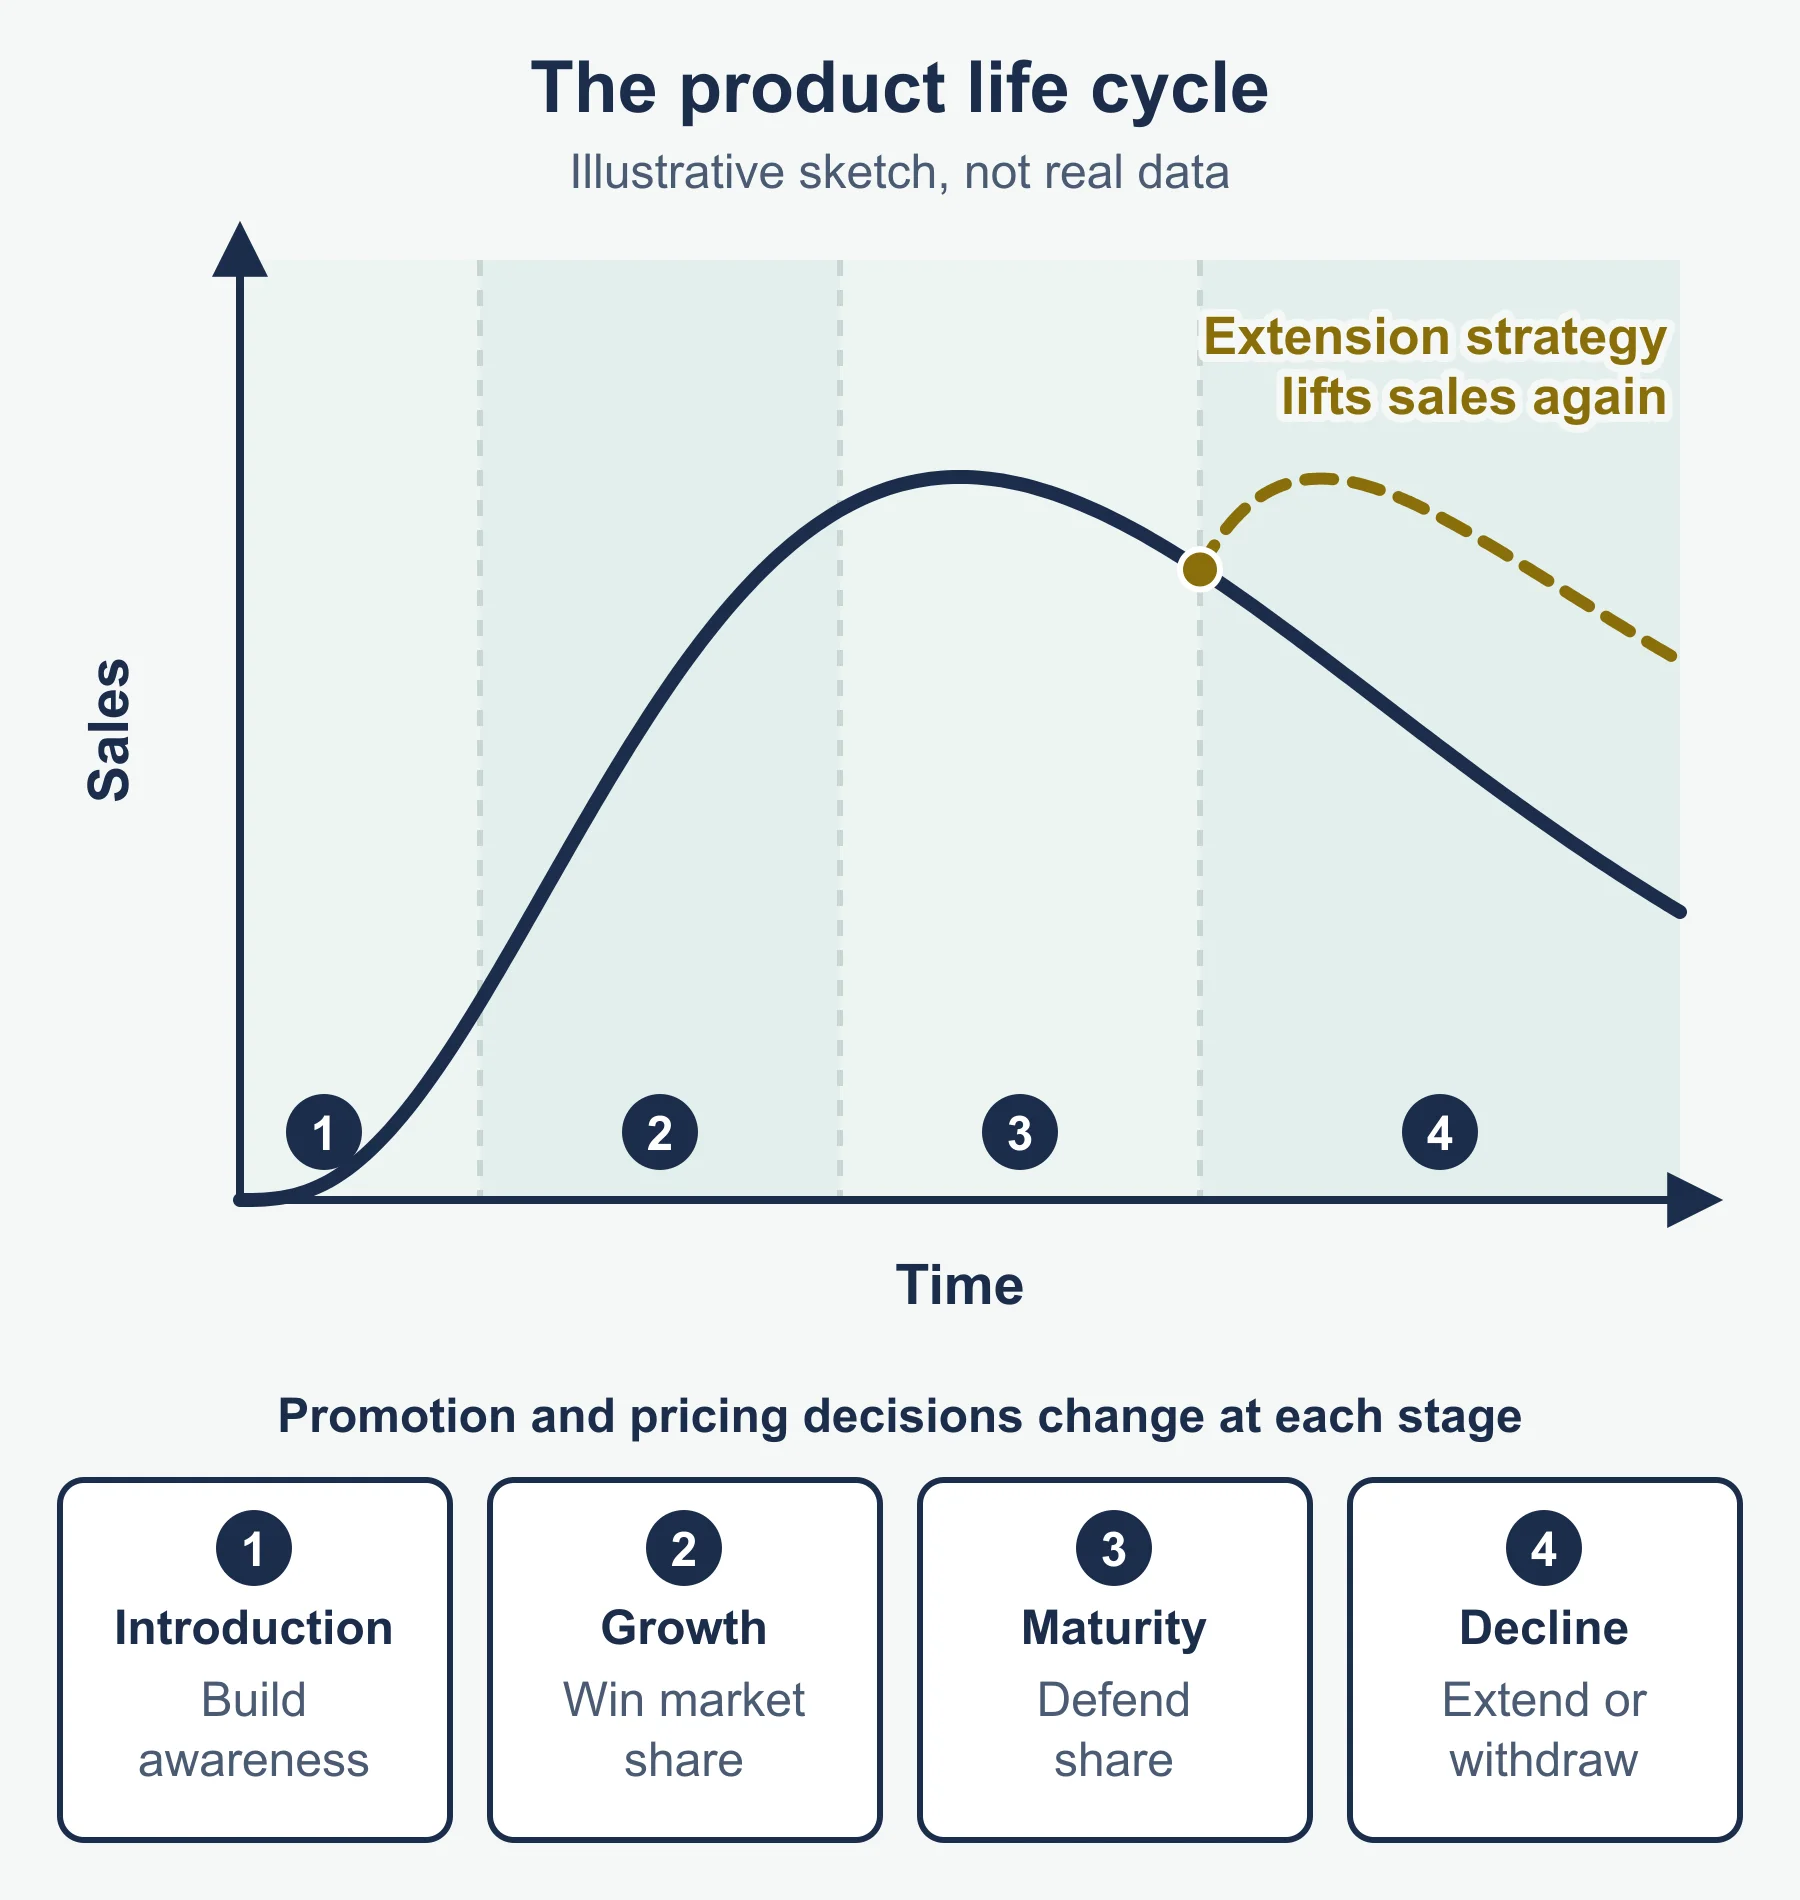
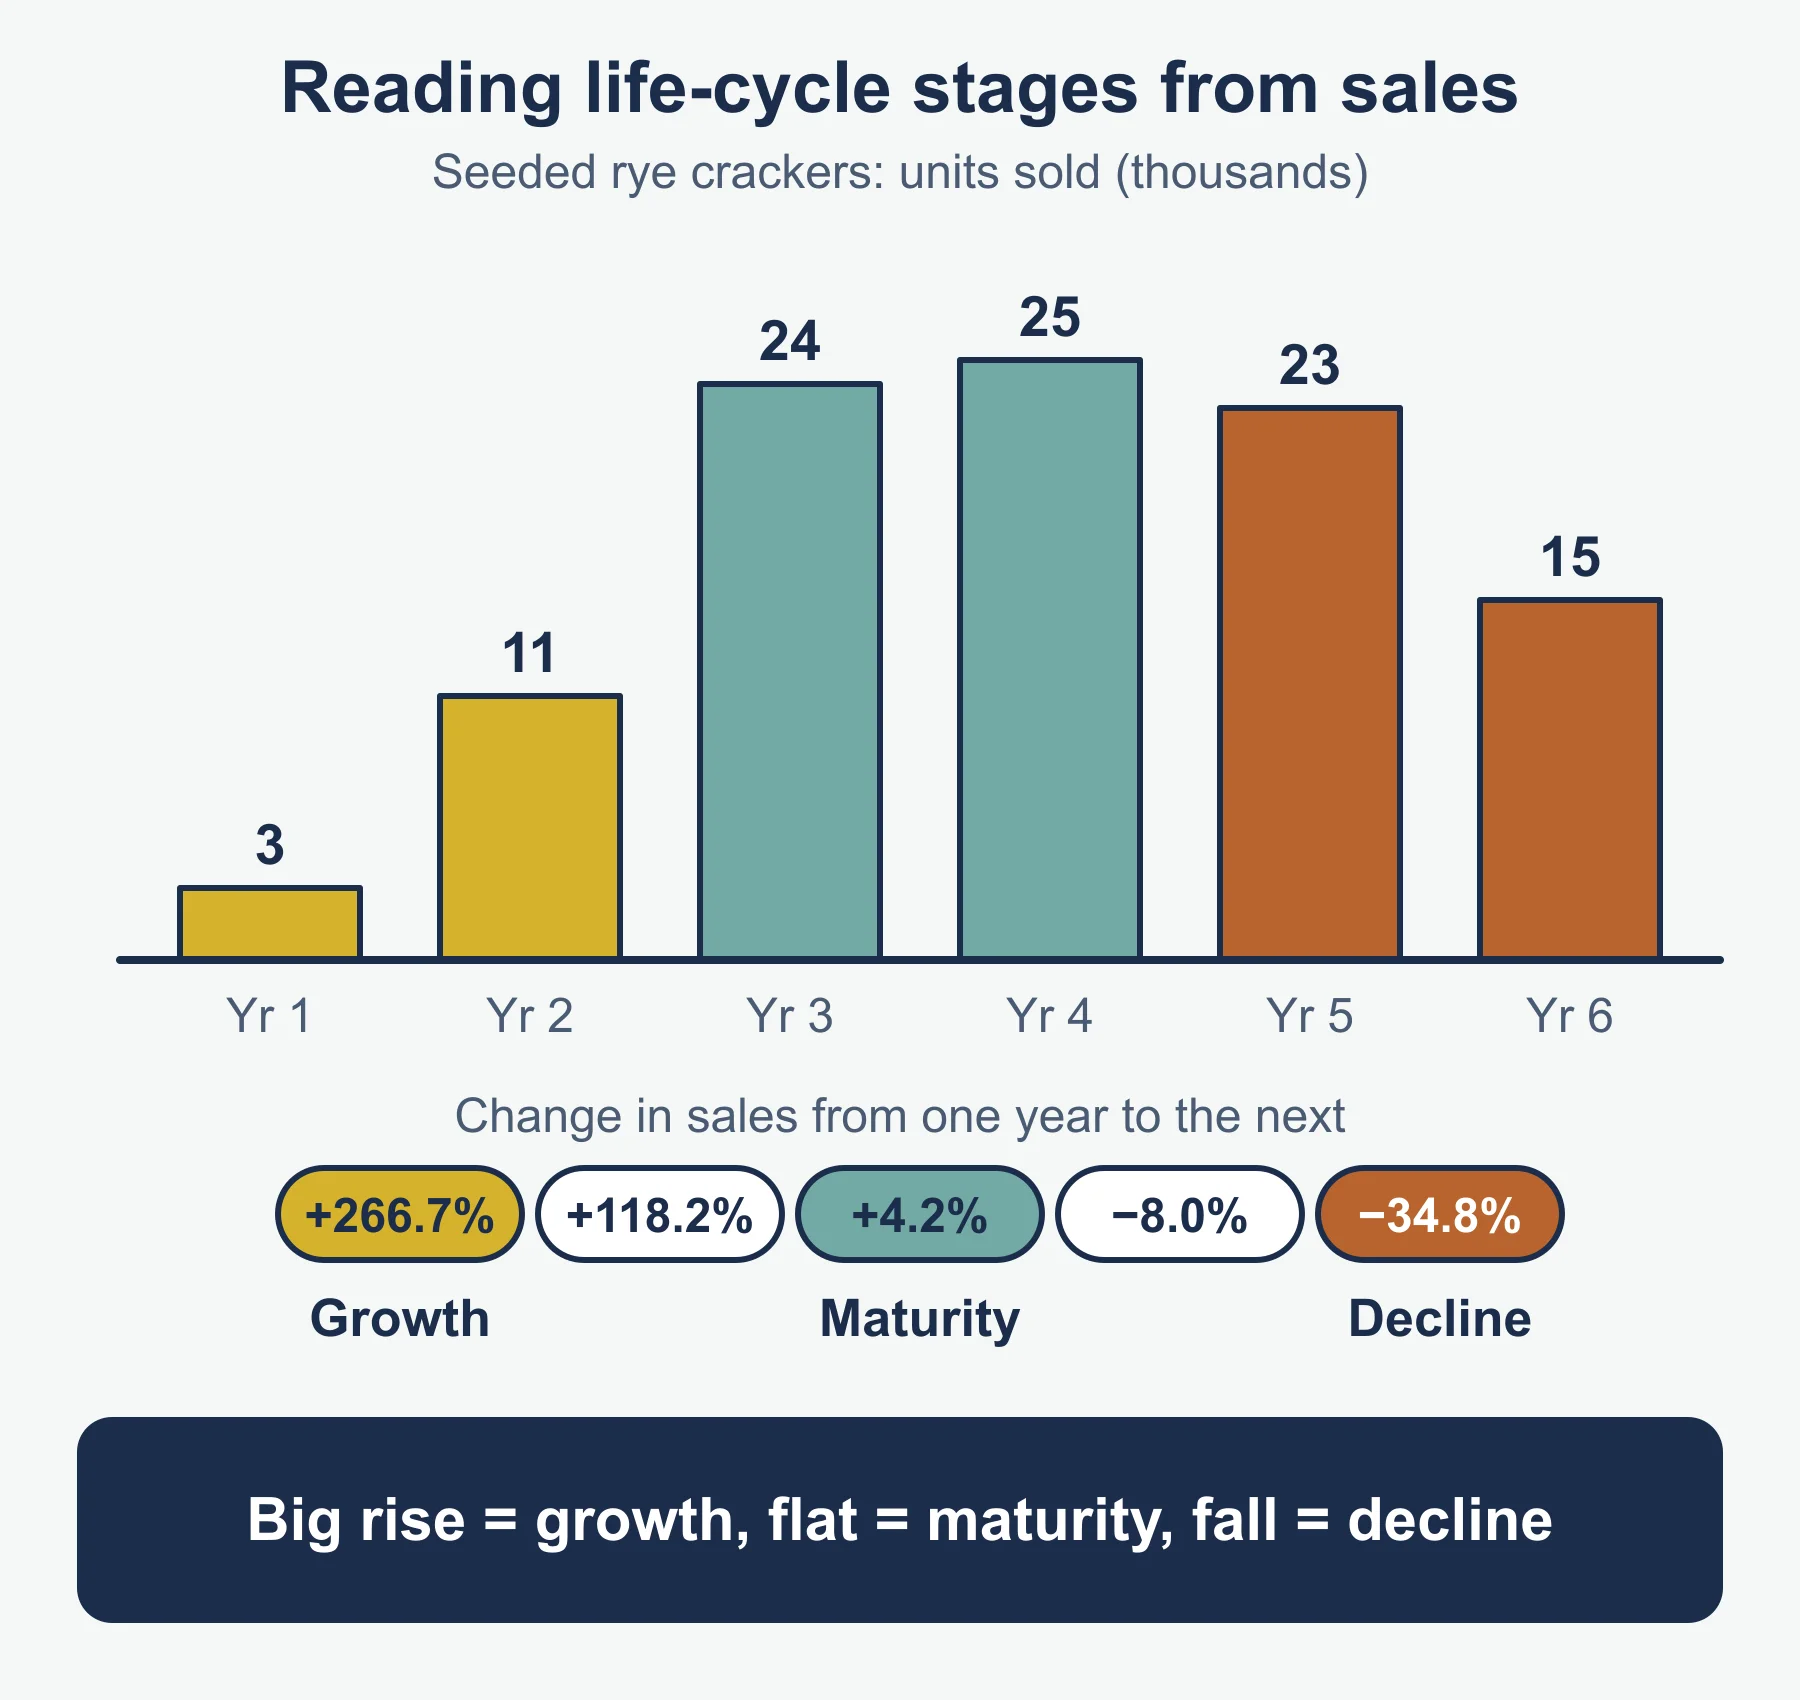
Product life cycle: introduction (low sales), growth (fast rise), maturity (peak, flat), decline (falling).
Pricing methods
| Method | Remember |
|---|---|
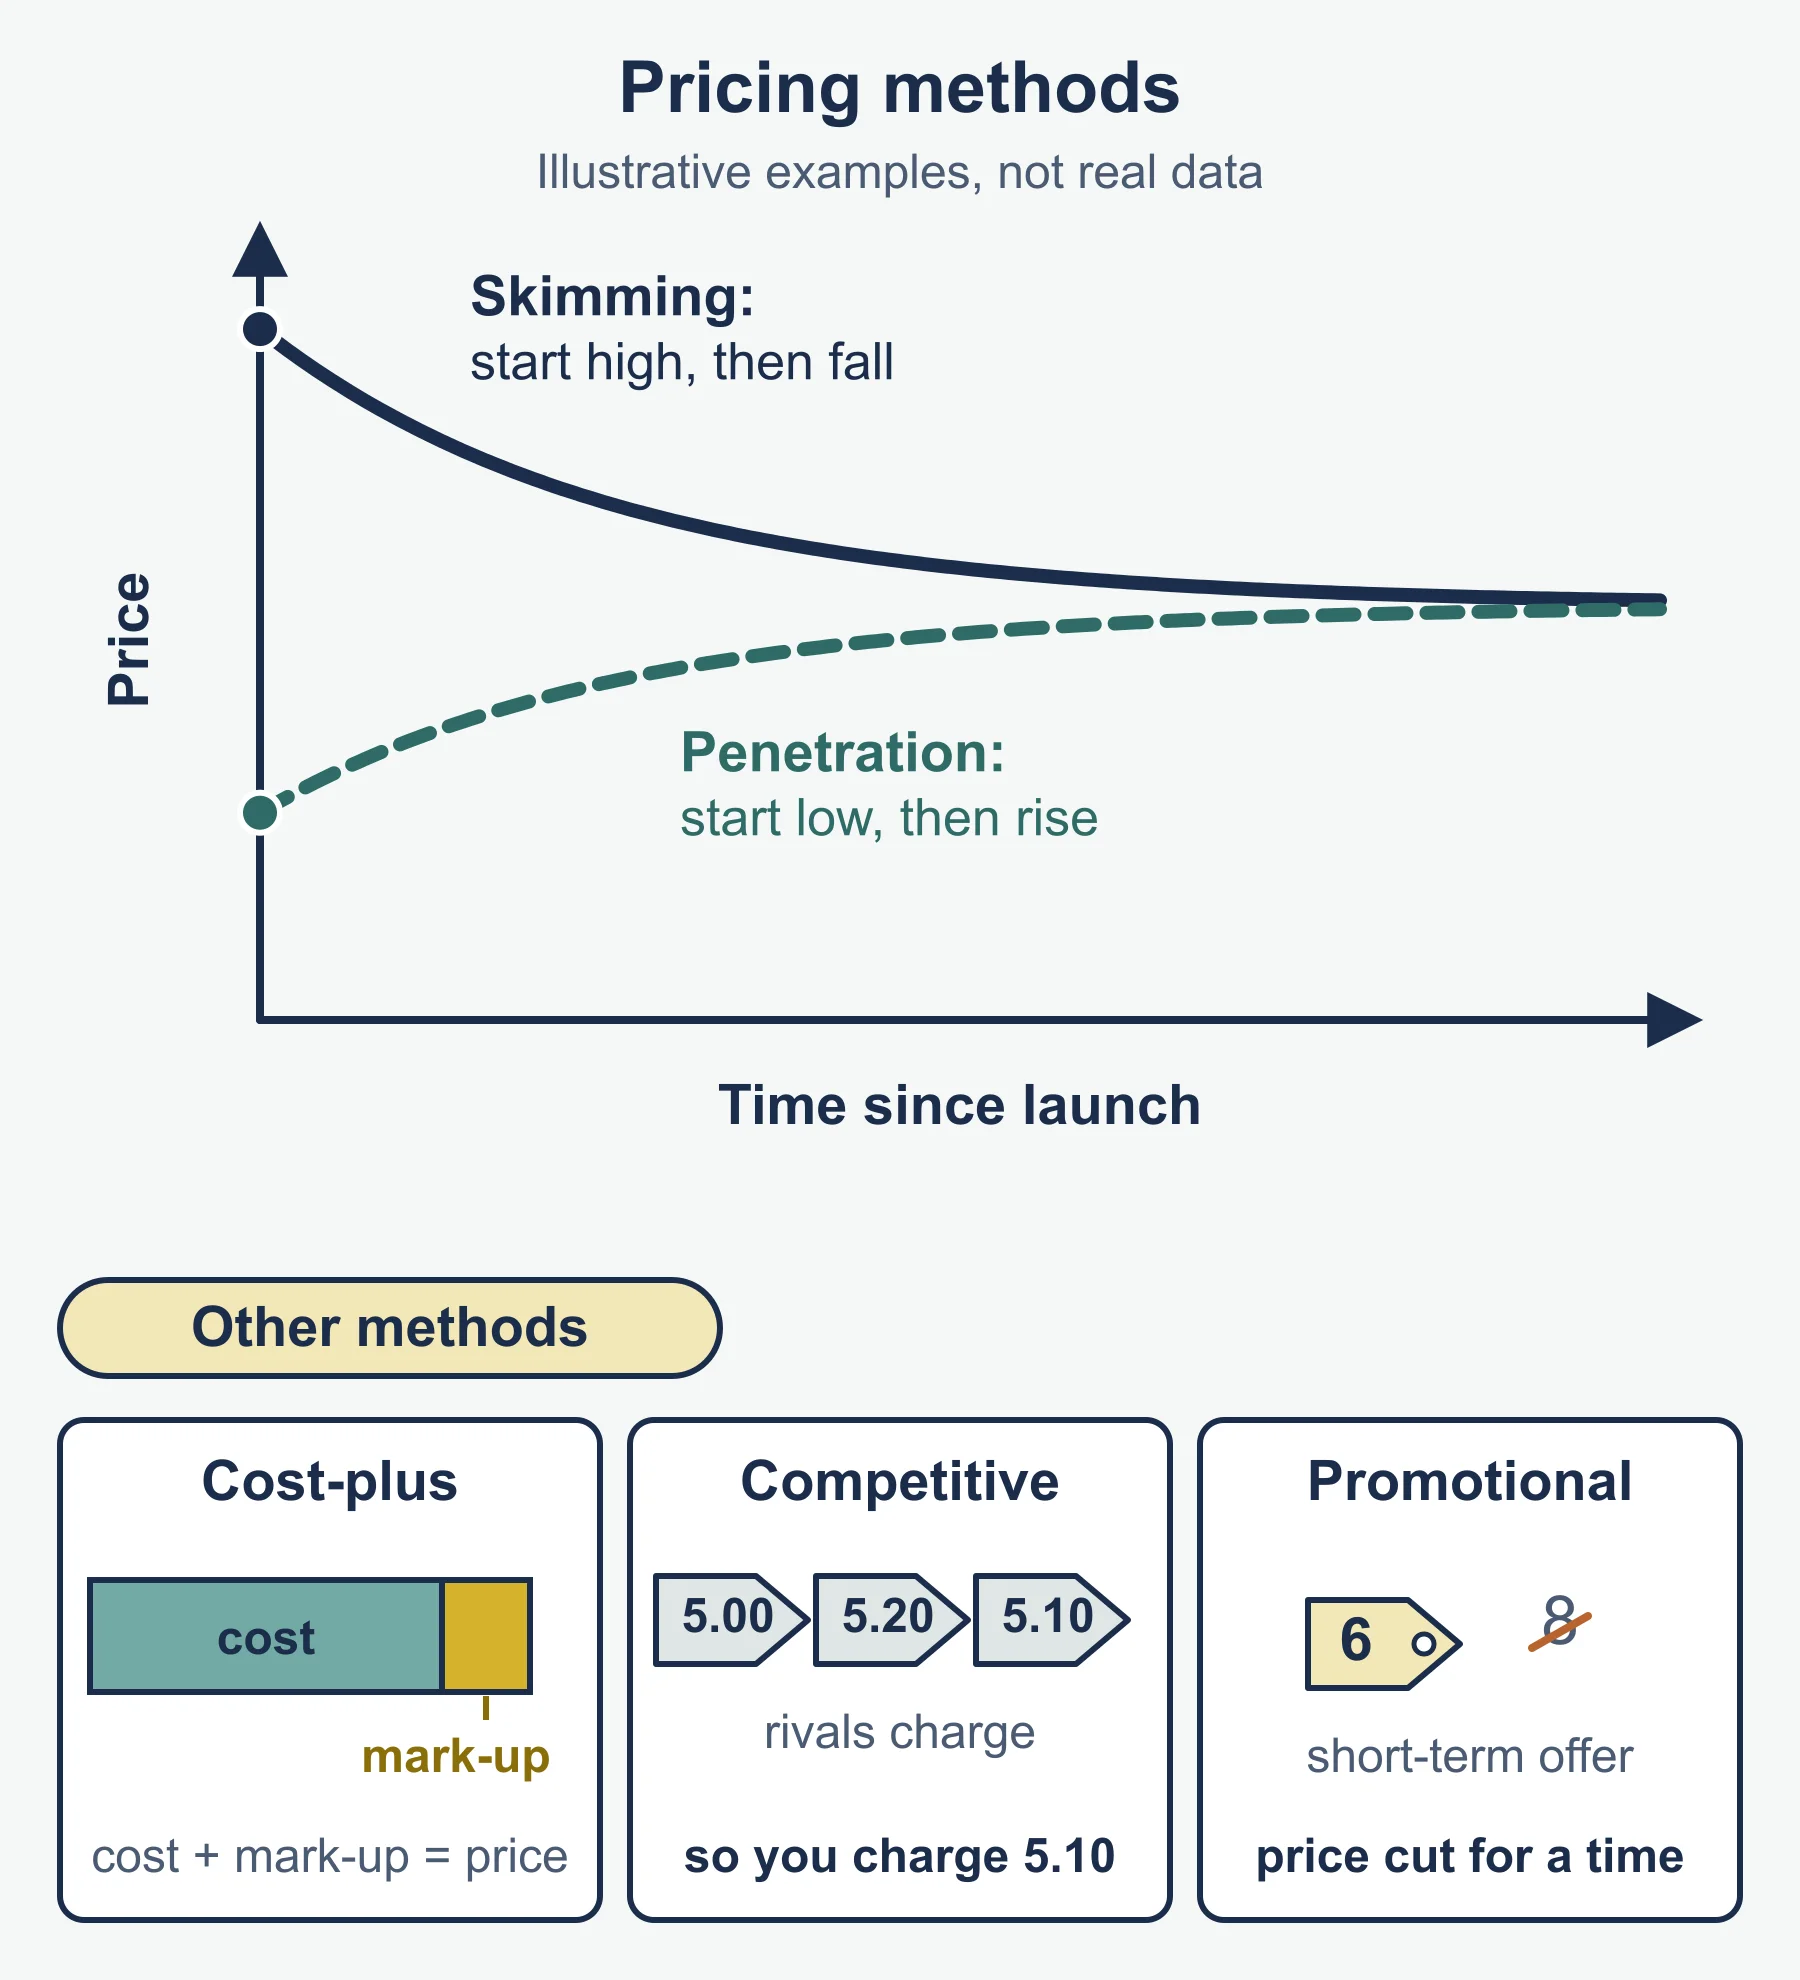
| Skimming | High first, then lower. New product, few rivals |
| Penetration | Low first to win share. Crowded market |
| Cost-plus | Unit cost plus mark-up. Ignores rivals |
| Competitor | Close to rivals. Similar products |
| Promotional | Short-term cut. Stock clearance, attention |
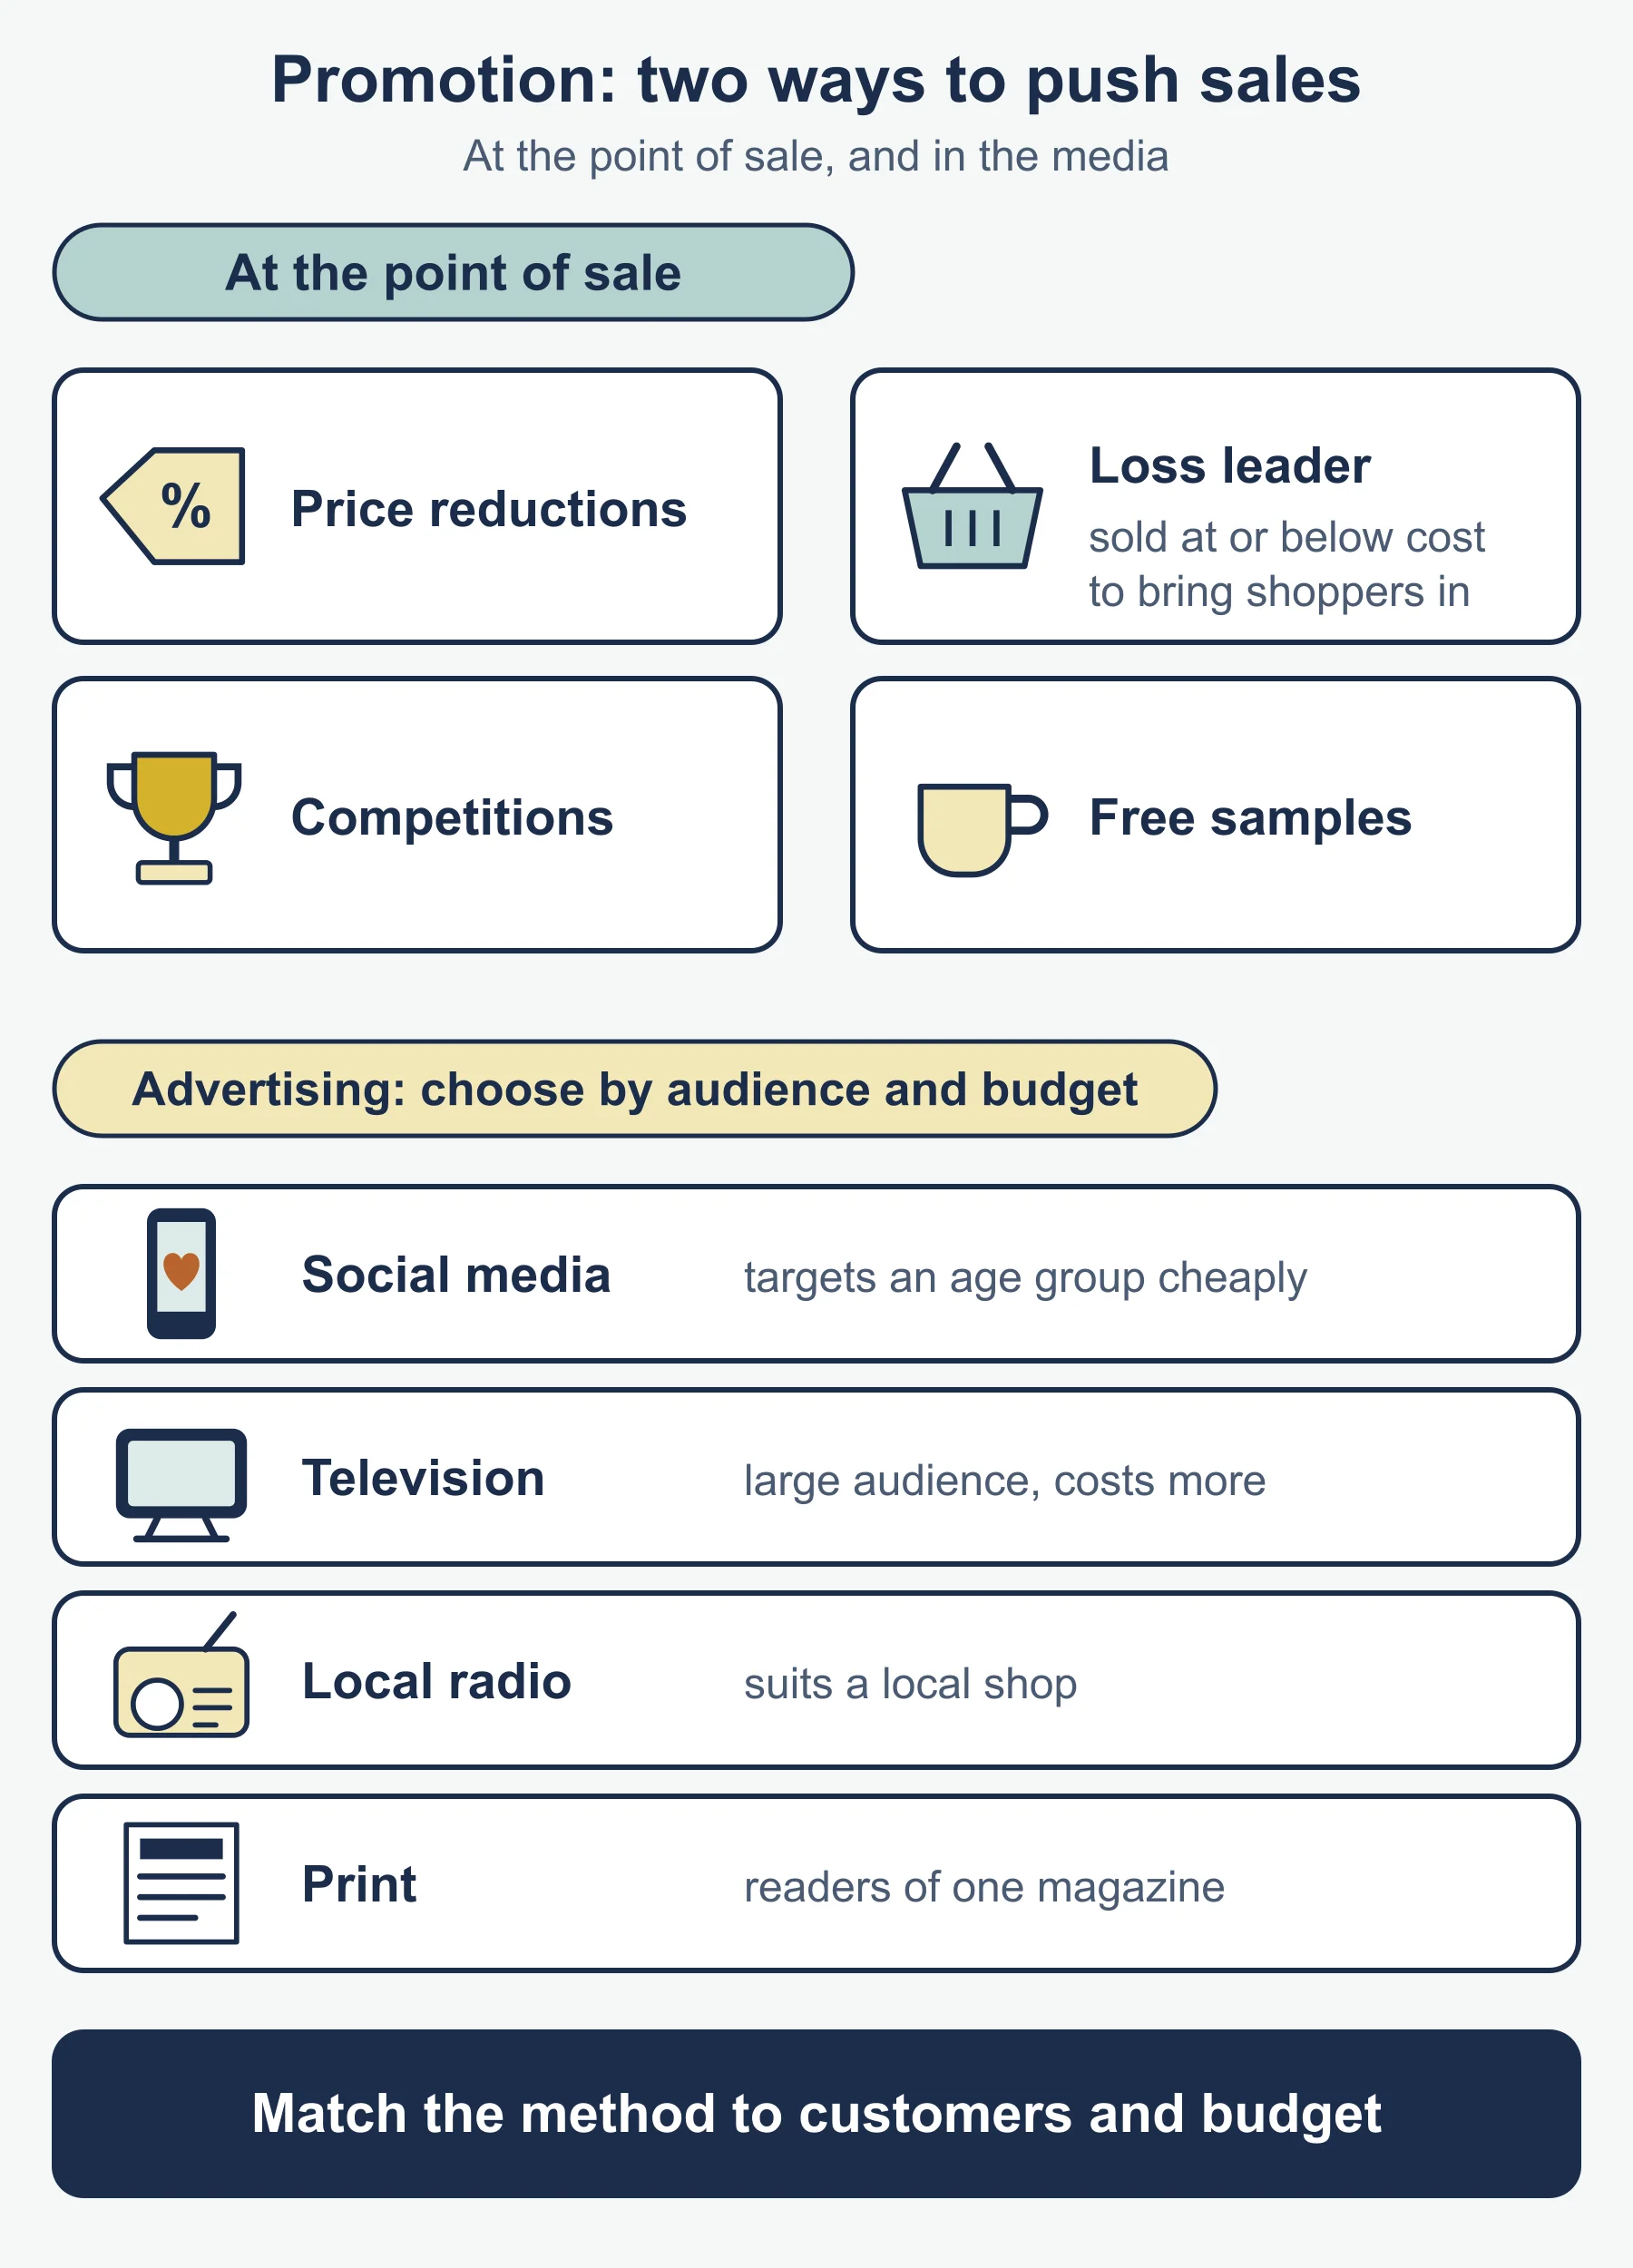
Point of sale: price reductions, loss leaders, competitions, free samples.
Advertising: social media, websites, print media, television, radio. Choose by audience, reach and cost.
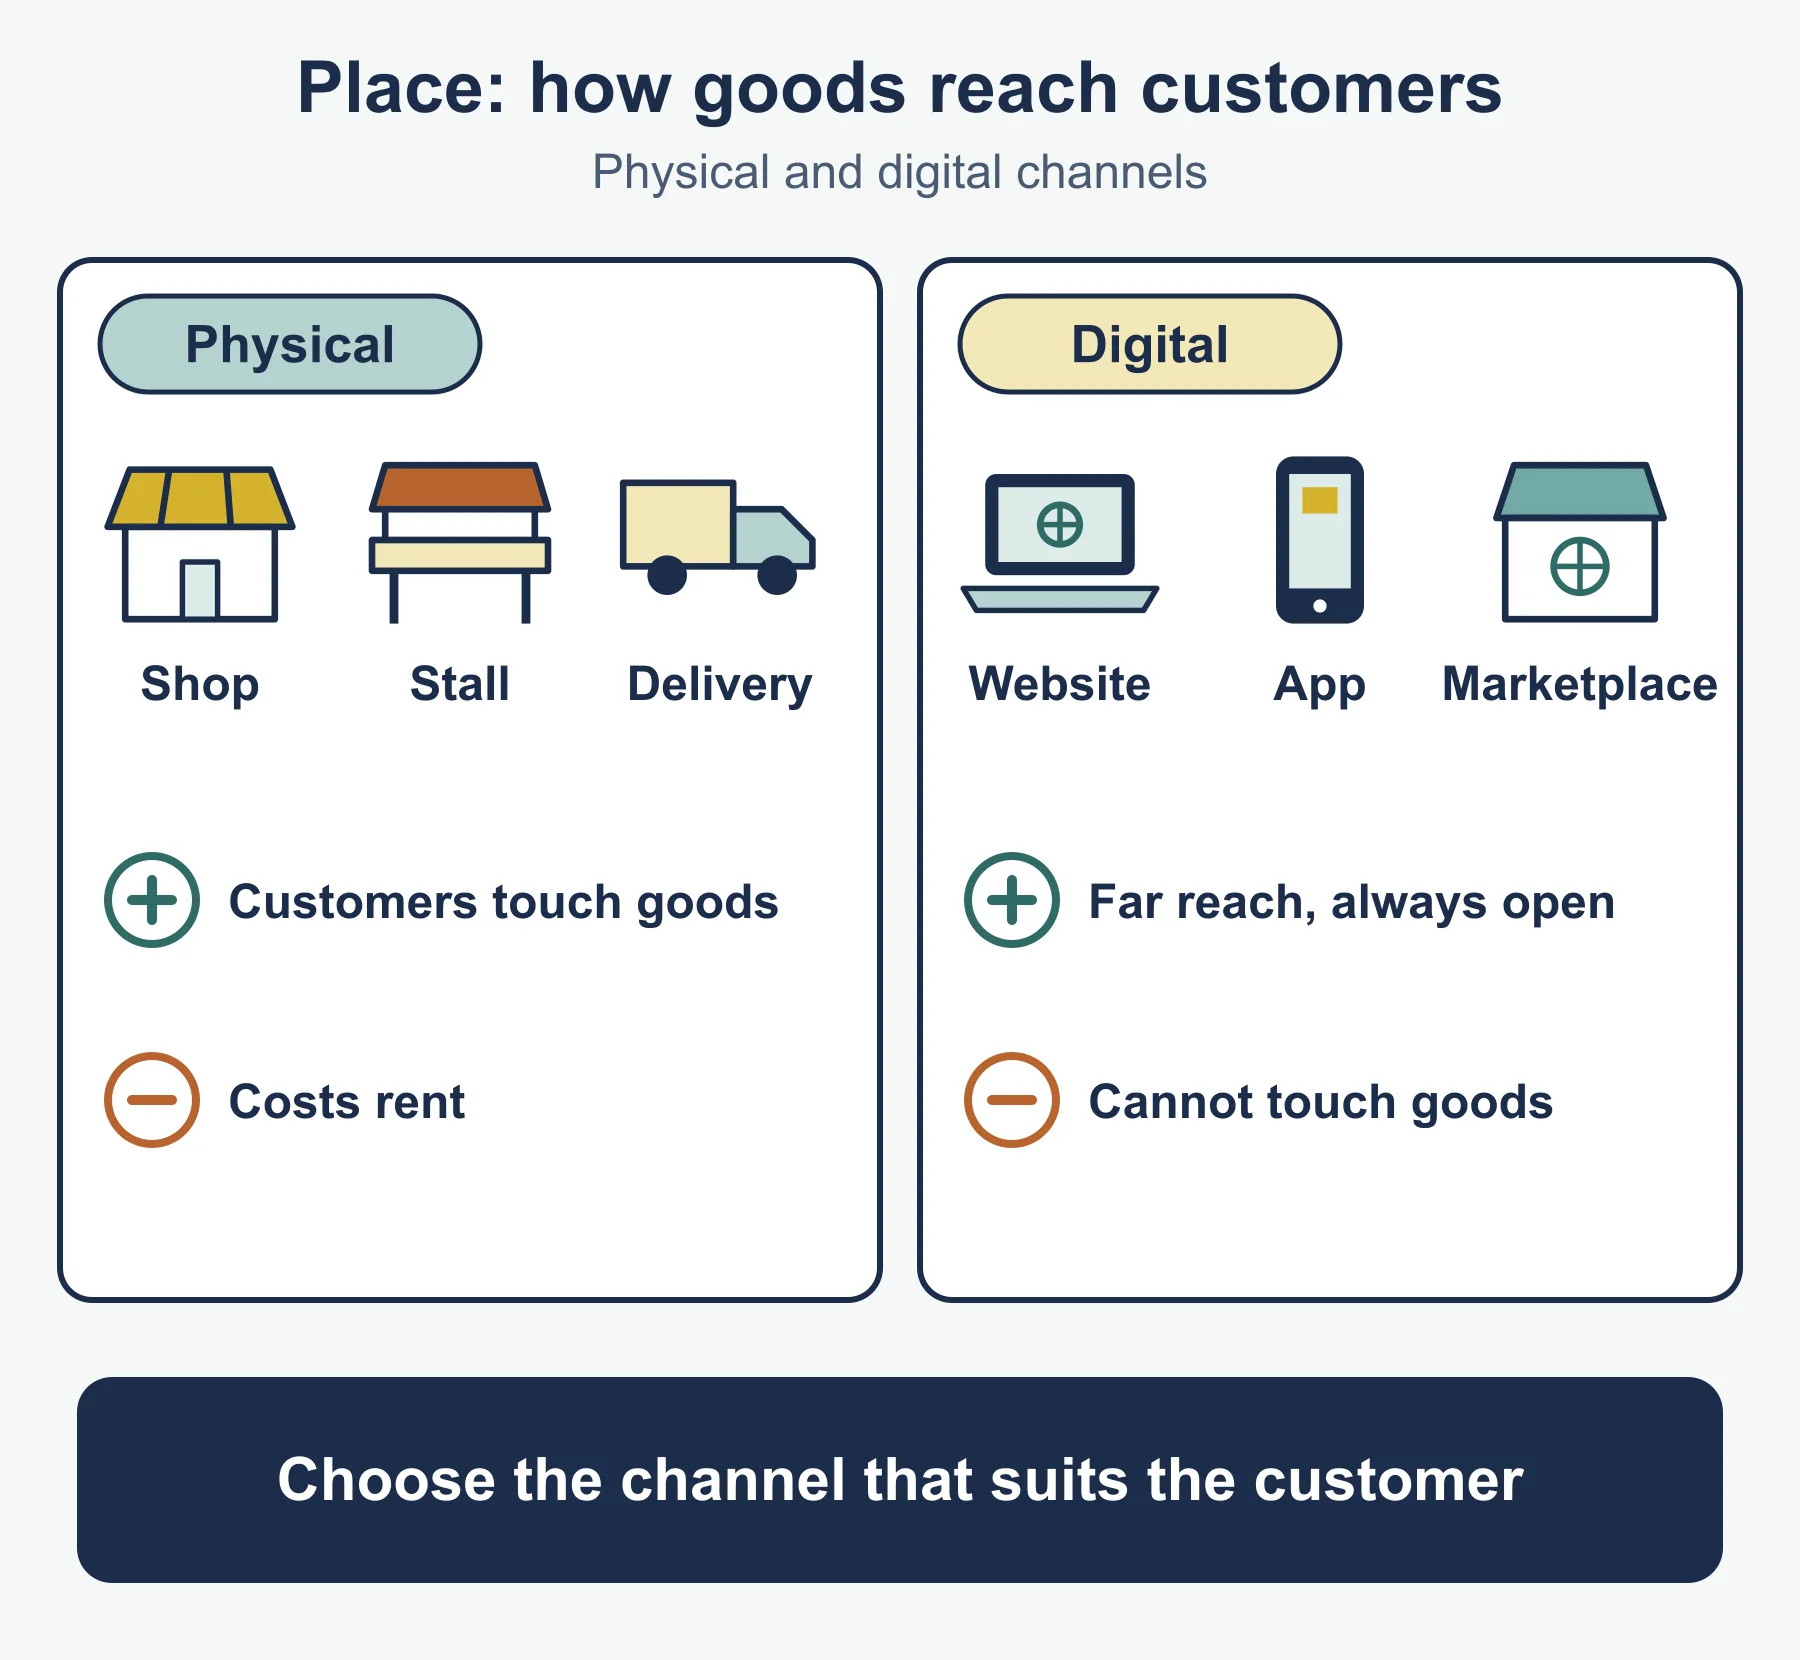
Place: shop, market stall, website, app, online marketplace. Digital reaches further; physical lets people see and touch.
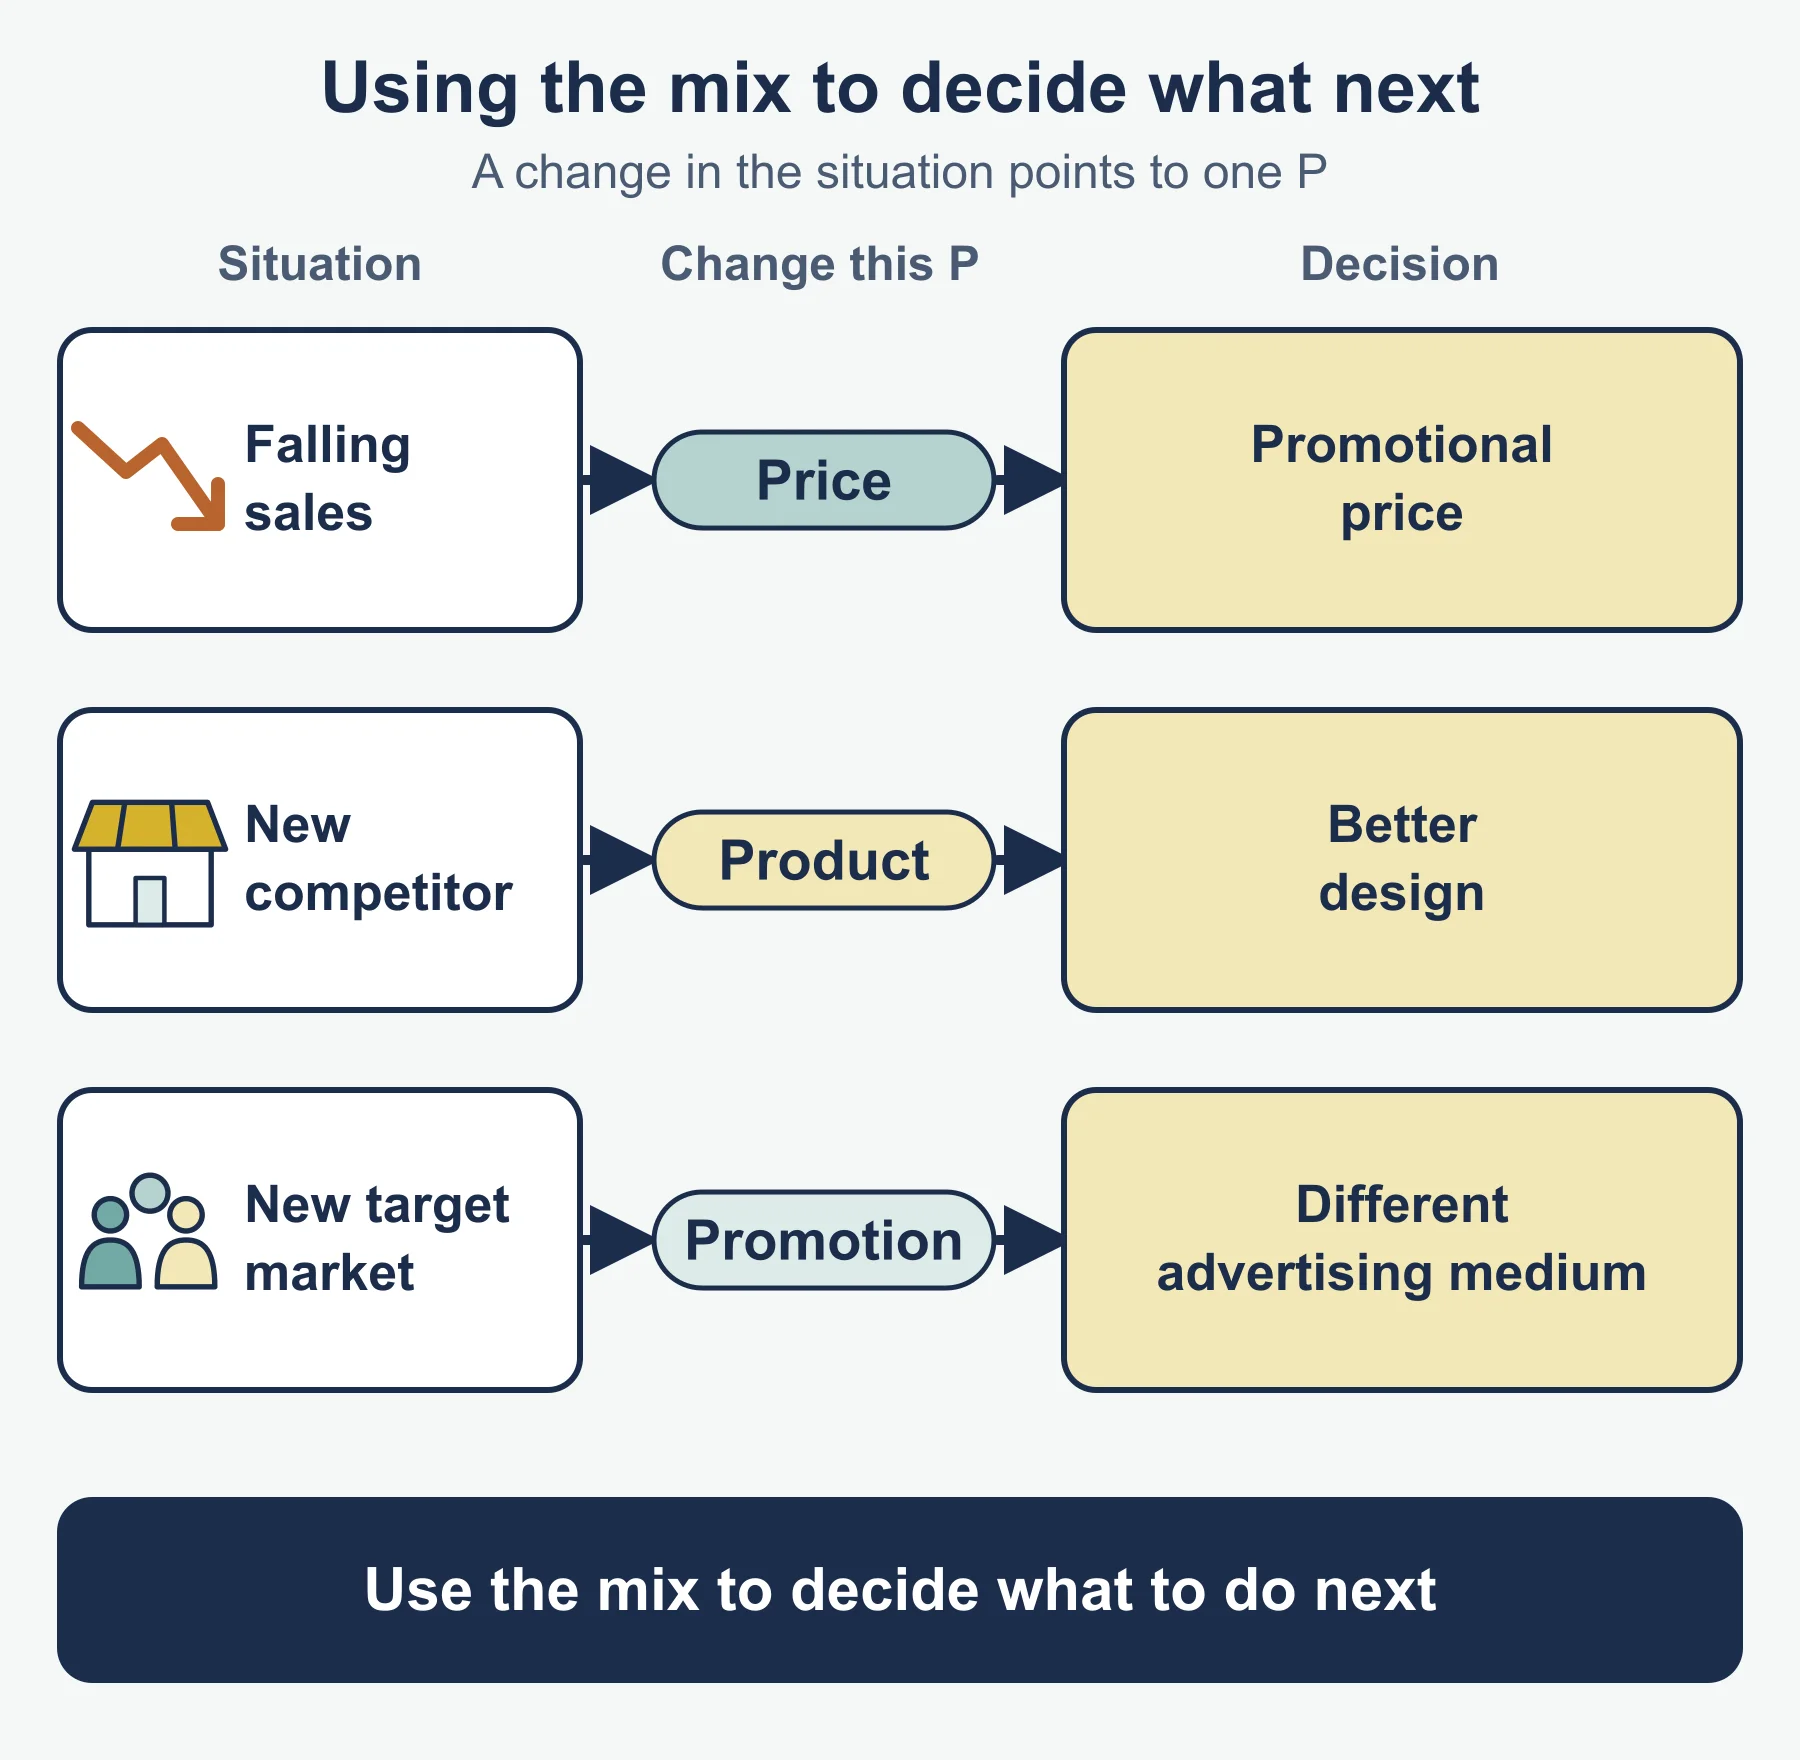
Using the mix: match the change to the problem. Falling share might need a price or promotion change. A new segment might need a new product or channel.
Formulas
The specification does not print these, so each is the standard form.
| Measure | Formula |
|---|---|
| Percentage | part / whole × 100 |
| Percentage change | (new - old) / old × 100 |
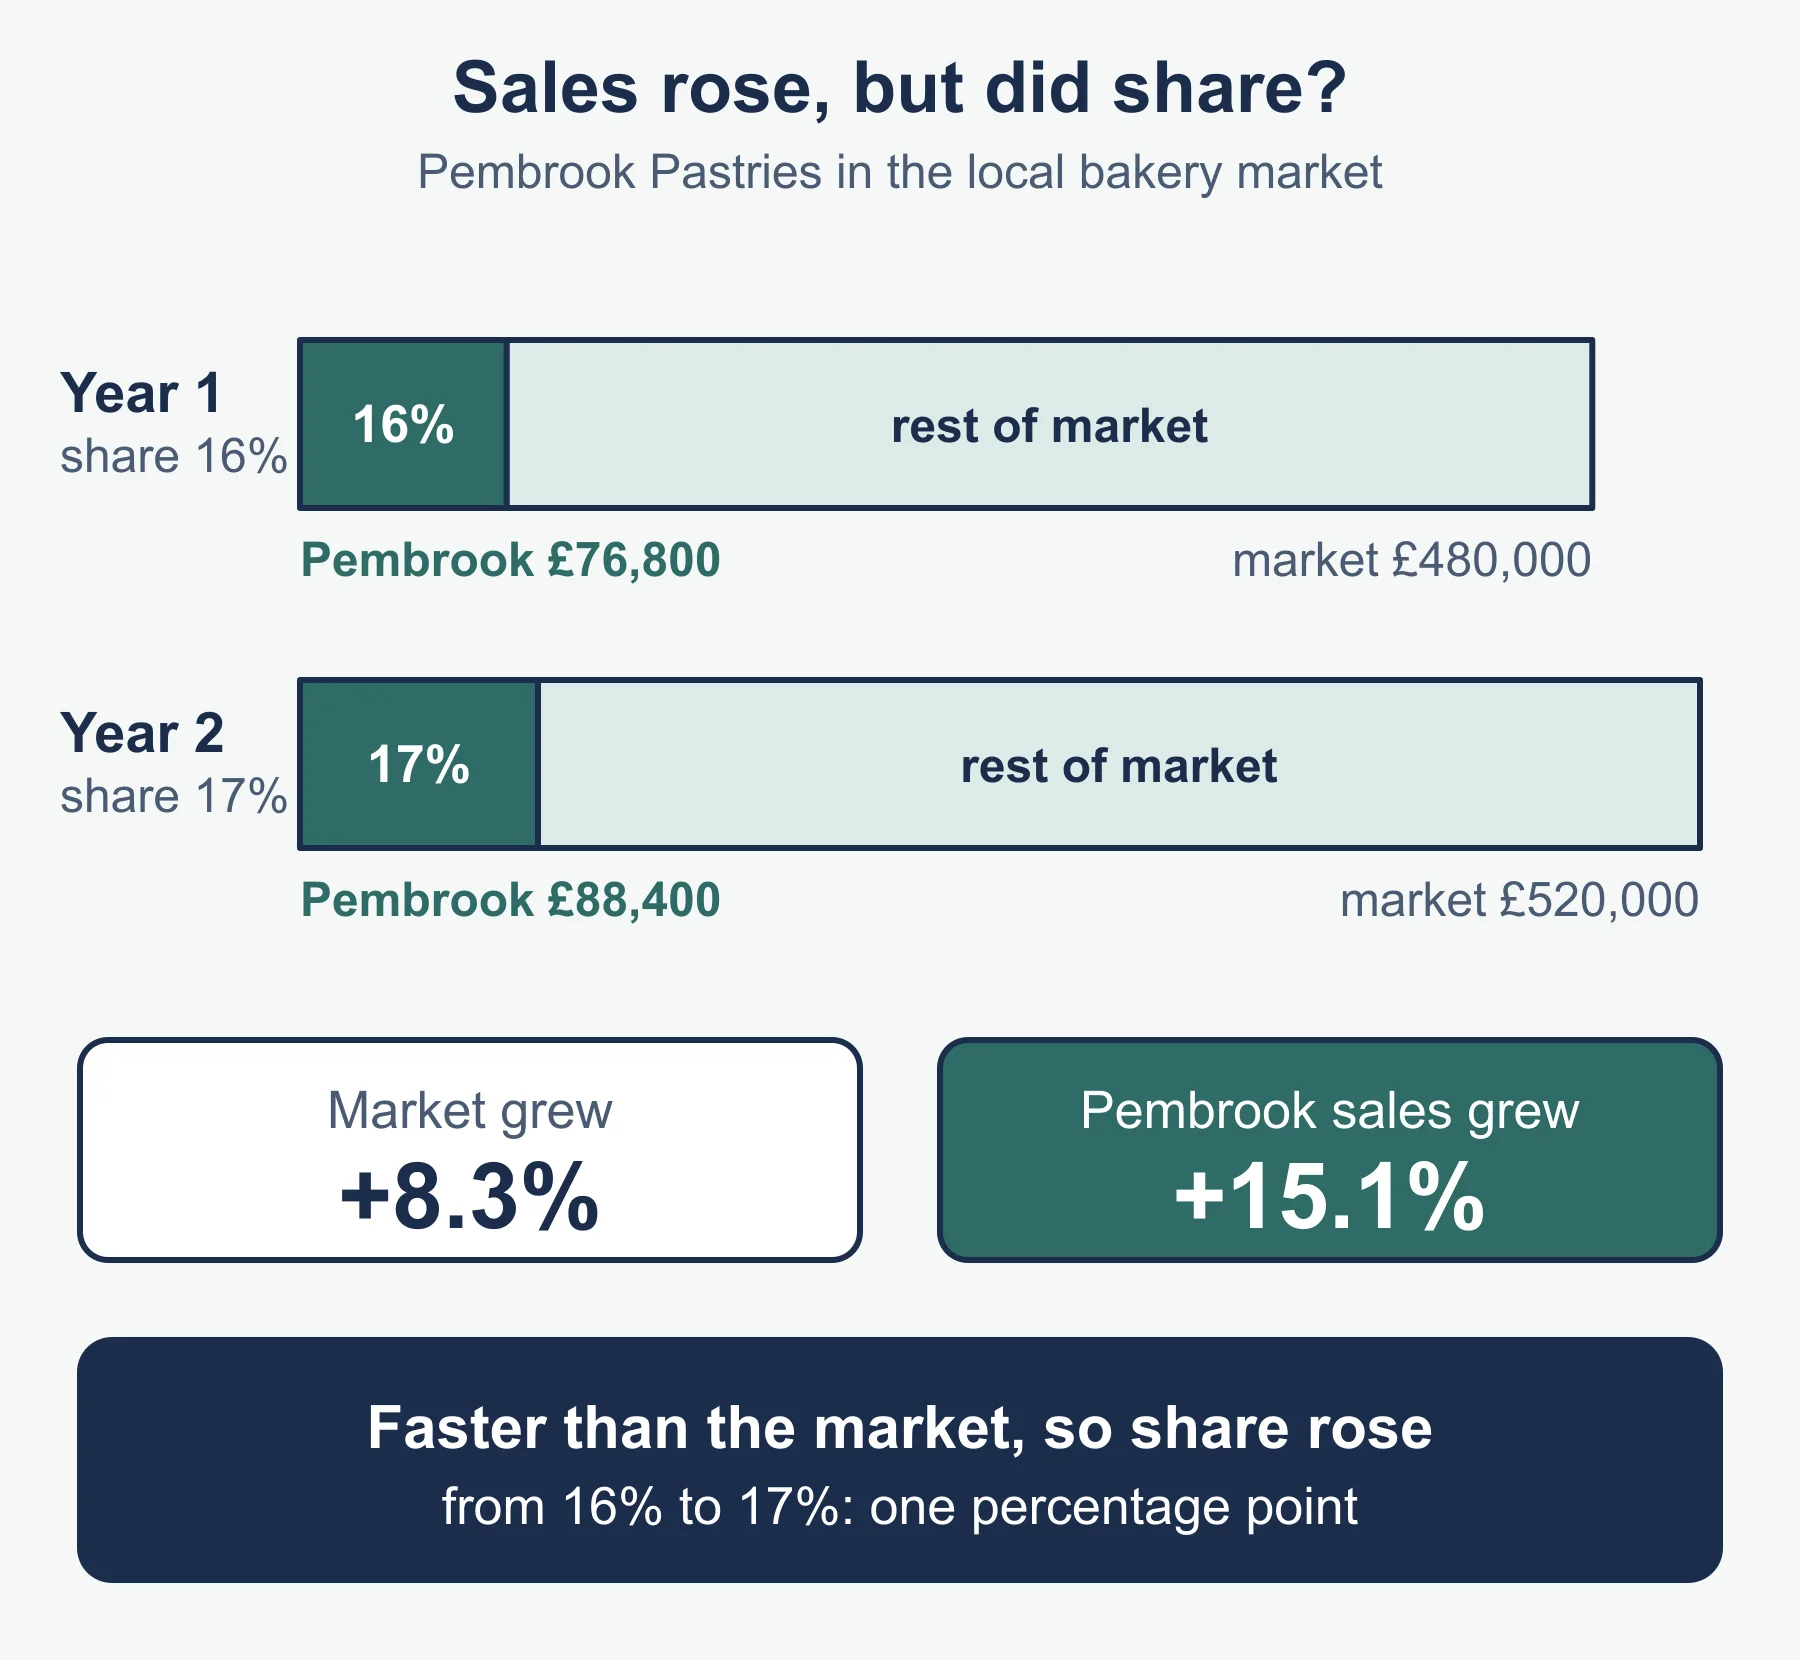
| Market share | business sales / total market sales × 100 |
| Cost-plus price | unit cost + mark-up |
| Average (mean) | total / number of values |
Method for market share questions
- Write the formula.
- Put both sales figures in the same units (pounds, or thousands of units).
- Divide, multiply by 100, and add a % sign.
- Say what it means: share rising means the business is growing faster than the market.
Reading market data: compare the business with the market. Sales up 10% in a market up 15% is a loss of share.
Worked reminders
Market data. A market for gym memberships is worth £600,000 in a year. Wynstay’s sales are £48,000, so its share is 48,000 / 600,000 × 100 = 8%. If the market then grows to £640,000 and Wynstay’s sales reach £54,000, the new share is 54,000 / 640,000 × 100 = 8.4% (to 1 decimal place). Wynstay’s sales grew 12.5% against market growth of 6.7%, so it is gaining share.
Mean. Four weeks of new members: 18, 24, 21, 33. Total 96, divided by 4 gives a mean of 24 a week.
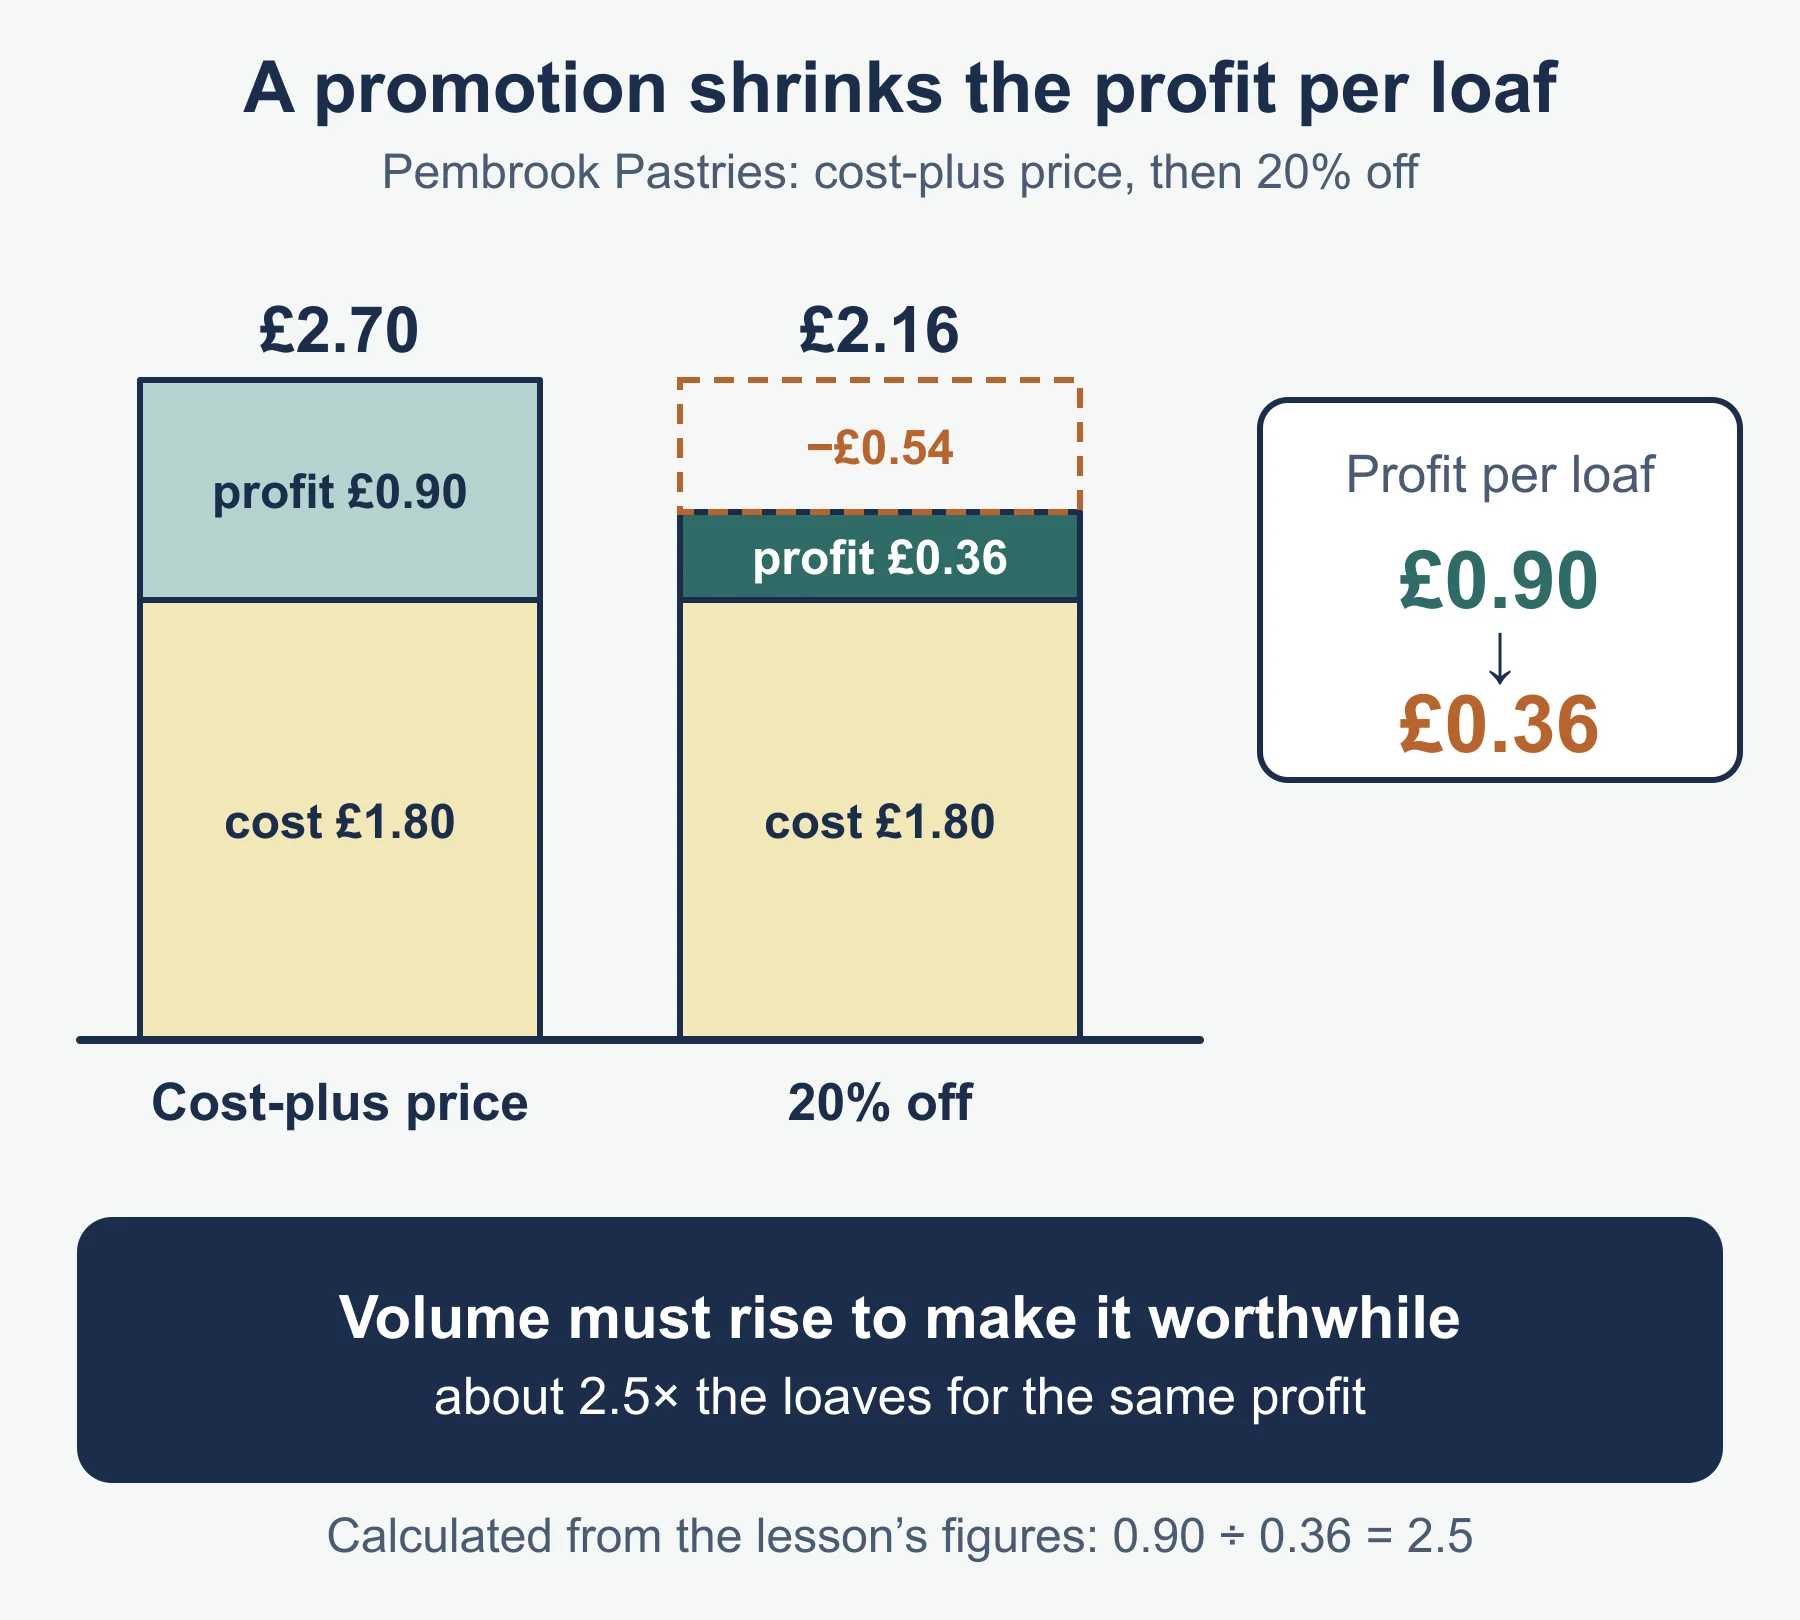
Cost-plus and promotion. A day pass costs £6 to provide. A 50% mark-up gives £9. A promotional price of 20% off is £7.20, which still covers the cost with £1.20 left over.
Command words in this topic
| Command word | What the answer needs |
|---|---|
| Identify, State | A short fact, no development |
| Explain | A point linked to the business, with a reason |
| Calculate, Complete | Formula, working and the final figure with units |
| Analyse | A chain of reasoning: point, because, so, which means |
| Discuss, Evaluate | Both sides weighed, then a supported judgement |
| Recommend | A clear choice backed by reasons |
For analysis, use the chain: the gym lowers its joining fee, so more people can afford to join, so membership rises, which could raise income from monthly fees. For evaluation, finish with a decision and a reason for it, such as “penetration pricing is right because the market is crowded, as long as the fee rise later does not drive members away”.
Case-study checklist
Before you write, underline the target market, the stage the product has reached, the budget and the channel in the stem. Then ask four questions.
- Which part of the mix is the question about?
- Who is the target customer, and how would they be segmented?
- What does the data show, and how does it compare with the market?
- Which other P would be affected by this choice?
Linking the Ps in a case study
Examples of fit and clash, to use as models.
- Fit: a premium gym sets a high monthly fee (price), offers new equipment and small classes (product), advertises in a lifestyle magazine (promotion) and has one central site (place).
- Clash: the same gym advertises large discounts on social media and fills the building with cheap equipment. The price signal and the product signal disagree.
- Fit: a low-cost gym uses penetration pricing, free trial passes (a free-sample style offer) and a website for sign-up.
When you meet a new business in an exam, run the same check. Name each P, then say whether the four tell one story to the chosen segment.
Distinctions to keep clear
- Primary or secondary: who collected it, and for what
- Quantitative or qualitative: numbers or reasons
- Invention or innovation: brand new or improved
- Skimming or penetration: high first or low first
- Loss leader or promotional price: one item to draw shoppers in, or a temporary cut to an ordinary product
- Percentage points or percentage change: share going from 13% to 14% is one point, but a 7.7% rise in share
Quick self-test
Wynstay Fitness runs gyms. Answer these.
- State the three purposes of marketing named in the specification.
- Give two examples of primary research.
- Give two examples of secondary sources.
- Wynstay sells 650 memberships in a local fitness market of 5,000 memberships. Calculate its market share.
- Wynstay’s monthly sales rise from £48,000 to £54,000. Calculate the percentage change.
- A smoothie bar costs £4.50 to make and sells at cost plus a 30% mark-up. Calculate the price.
- Visits fall from 500 to 425 in a week. Calculate the percentage change.
- In a survey of 150 members, 90 want evening classes. What percentage is this?
- Name the pricing method: a gym sets a very low joining fee to attract as many new members as possible.
- State which stage of the product life cycle shows falling sales.
- Explain one reason a gym might use a focus group rather than a questionnaire.
- Explain one reason segmenting by lifestyle could help a gym.
Answers
- Identify and understand customers; inform customers; increase sales.
- Any two of questionnaires, interviews, trialling, focus groups.
- Any two of newspapers and magazines, census, websites, internal data.
- 650 / 5,000 × 100 = 13%.
- (54,000 - 48,000) / 48,000 × 100 = 12.5% increase.
- 30% of £4.50 = £1.35, so the price is £5.85.
- (425 - 500) / 500 × 100 = -15% (a 15% fall).
- 90 / 150 × 100 = 60%.
- Penetration pricing.
- Decline.
- A focus group lets members explain why they feel as they do and respond to each other. A questionnaire gives short answers with little explanation.
- Lifestyle groups, such as people who train daily, want different classes and hours. The gym can design and advertise the offer for the group it targets.
Where marks are usually lost
- Naming a method but not saying why it suits the purpose.
- Writing that primary research is “better” without a reason.
- Giving a market share figure with no interpretation.
- Dividing by the new figure instead of the old one in a percentage change.
- Forgetting the % sign or the direction (increase or fall).
- Listing the four Ps without judging whether they fit the target market.
- Applying skimming or penetration to the wrong kind of market.
- Using general statements instead of the business named in the stem.
Frequently asked questions
What are the three purposes of marketing in OCR GCSE Business? The OCR GCSE Business (J204) specification names three: identifying and understanding customers, informing customers, and increasing sales. Link each to the business in the question.
What are the stages of the product life cycle? The stages are introduction with low sales, growth with a fast rise, maturity where sales peak and flatten, and decline where sales fall. Extension strategies can be used to delay decline.
Which research method suits which purpose? Interviews or focus groups suit finding out opinions and reasons, questionnaires suit collecting simple answers from many people, trialling suits seeing how customers react to a real sample, and the census suits finding the size of a group in an area. Naming a method without saying why it suits the purpose loses marks.
Is primary research better than secondary research? Neither is always better. Primary research fits the exact question and is up to date, while secondary research is cheaper and quicker, so the right choice depends on what the business needs to find out.
Official syllabus
OCR GCSE (9-1) in Business (J204), Version 2.0, OCR, section 2: Marketing, topics 2.1 to 2.4.
Get free revision emails (optional)
Occasional emails with practice questions, worked explanations and links to free resources for the qualification and subjects you choose. No spam, and you can unsubscribe from any email. The free tools on this site never need an email.
Related resources
-
Study guides
OCR GCSE Business: People (J204)
A full study guide to section 3 People in OCR GCSE (9-1) Business J204: structures, communication, recruitment, motivation, training and employment law.
Business · OCR · GCSE
Read guide -
Practice questions
OCR GCSE Business: People (J204) – Practice Questions
Original practice questions with worked answers on section 3 People in OCR GCSE Business J204, using short-answer, calculation and case-study items.
Business · OCR · GCSE
Try questions -
Revision notes
OCR GCSE Business: People (J204) – Revision Notes
Condensed recall notes for section 3 People in OCR GCSE Business J204: structures, communication, recruitment, motivation, training and law.
Business · OCR · GCSE
Revise topic
Related articles
-
teaching
A Level tuition in Dubai: Cambridge or Pearson Edexcel International A Level?
Schools in Dubai and Abu Dhabi teach either Cambridge International AS & A Level or Pearson Edexcel International A Level. How the two are structured, why it matters for tuition, and how online classes from Lahore work.
9 October 2026
-
curriculum guides
Choosing subjects at IGCSE and A Level
How subject choices at 14 and 16 affect university options later, and how to keep pathways open without overloading a timetable.
28 July 2026
Studying this with a teacher
Working through Business GCSE?
This page is free and stays free. If you would rather be taught it, Marlbridge runs Business classes one-to-one, online in your own time zone. One-to-one only for this course: Rs 6,000 per class in Pakistan, with other currencies on the fees page. The first trial class is free. WhatsApp replies within an hour (8am–11pm Pakistan time, every day); email the same day.
OCR Business teachers at Marlbridge
