
Study Guides
OCR GCSE Business: Marketing (J204)
Study guide to OCR GCSE Business section 2, Marketing: market research, segmentation, the four Ps and market data, with worked examples.
- Subject
- Business
- Level
- GCSE
- Topic
- Business activity, marketing and people
- Author
- Marlbridge Academic Team
- Updated
- Reviewed by
- Salman Ahmad (what this means)
Aligned to OCR GCSE Business (J204), Version 2.0 (January 2026), for first assessment in 2019. Official specification .
Syllabus page (what it covers and how it is assessed): OCR GCSE Business.
Syllabus points this page covers
J204
- 2 Marketing
Found an error? Report a correction.
Need help with this topic? Request a free trial class for GCSE Business (J204).
This guide teaches section 2, Marketing, of the OCR GCSE (9-1) Business specification (J204), Version 2.0 (January 2026). It covers topics 2.1 to 2.4: the role of marketing, market research, market segmentation and the marketing mix. The content is examined in Business 1: business activity, marketing and people, a 1 hour 30 minute paper worth 80 marks. Business 2 assumes you know it too.
Use it with the revision notes and the practice questions. The earlier Business 1 overview, overview revision notes and overview practice set cover the whole component, and this guide goes deeper on marketing. Course links: OCR GCSE Business hub, printable checklist and free diagnostics.
What the specification lists
| Topic | You must be able to |
|---|---|
| 2.1 Role of marketing | Explain the purpose of marketing: identifying and understanding customers, informing customers, increasing sales |
| 2.2 Market research | Explain its purpose; describe primary methods (questionnaires, interviews, trialling, focus groups) and secondary sources (newspapers and magazines, census, websites, internal data); judge which suits which purpose; use and interpret qualitative and quantitative data |
| 2.3 Market segmentation | Explain how segmenting (age, gender, income, location, lifestyle) helps target customers |
| 2.4 Marketing mix | The four Ps and why they matter; design, invention, innovation; the product life cycle; five pricing methods; point of sale; advertising; place; how the Ps work together; using the mix to make decisions; interpreting market data |
The specification expects calculations with percentages, percentage changes, averages and market share, and marketing data such as market research results. Command words in the assessment include identify, state, explain, calculate, complete, analyse, discuss, evaluate and recommend.
2.1 The role of marketing
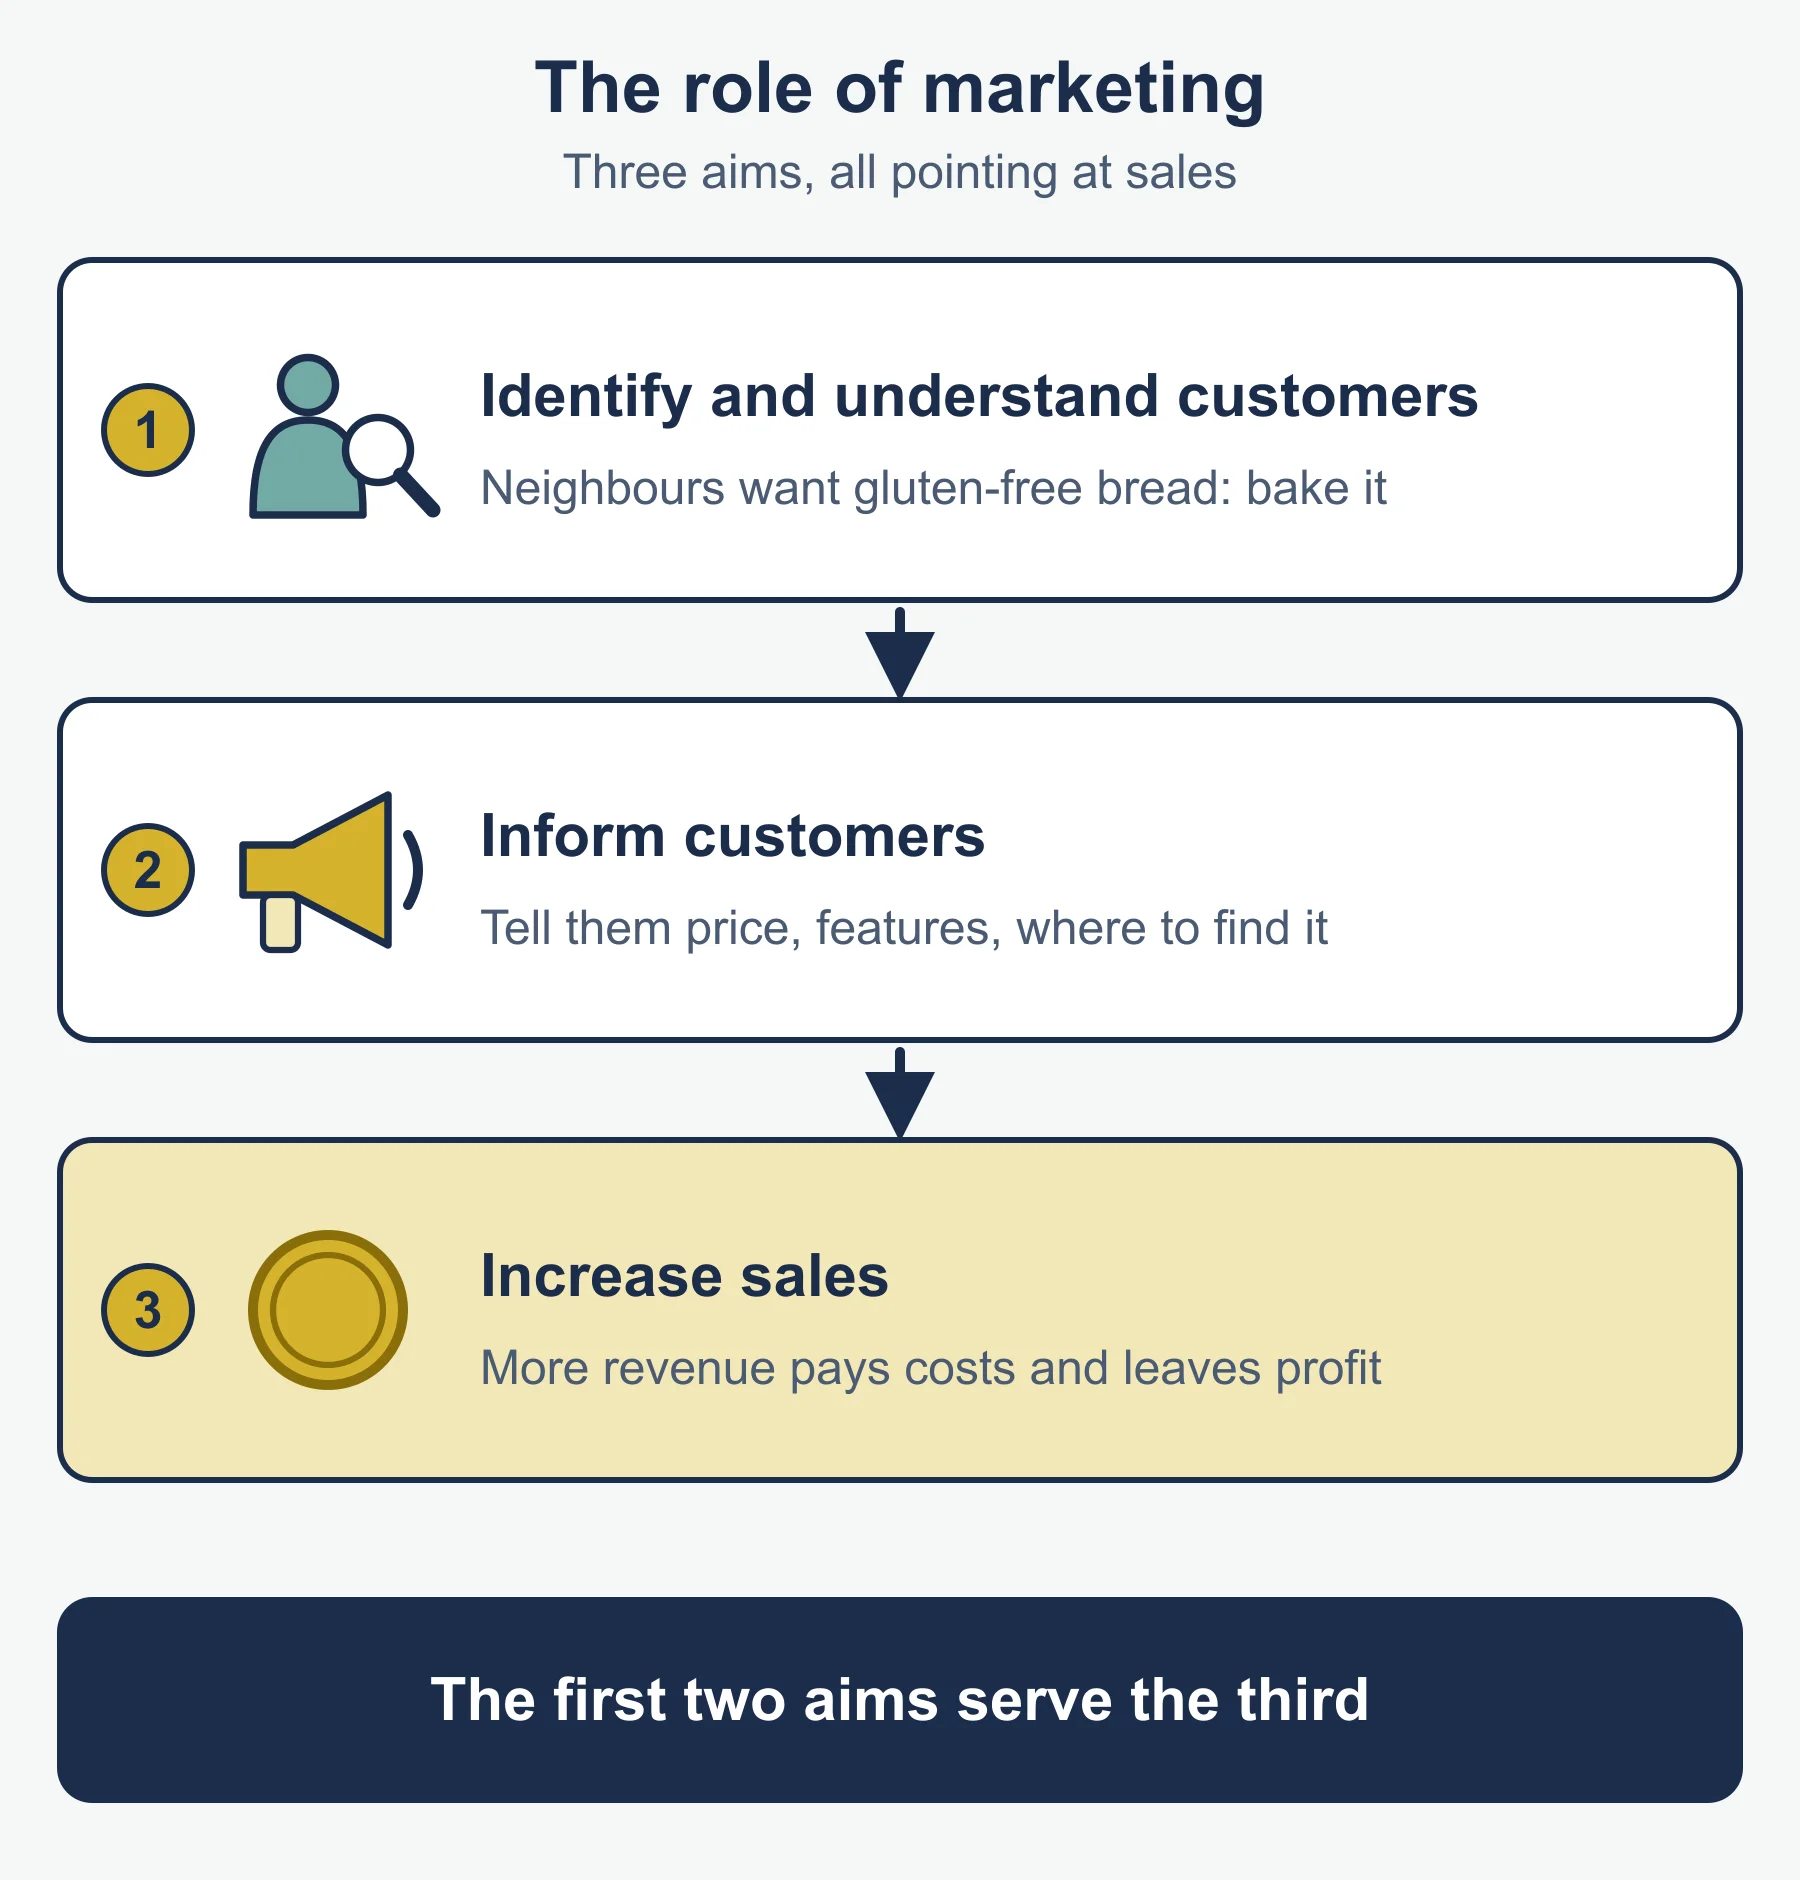
Marketing is how a business connects what it sells with the people who might buy it. The specification names three parts.
- Identifying and understanding customers. A business cannot make something people want until it knows who they are and what they need. A bakery that finds its neighbours want gluten-free bread has a reason to bake it.
- Informing customers. Customers cannot buy what they have not heard of. They also need to know price, features and where to find it.
- Increasing sales. The first two aims serve this one. More sales bring more revenue, and revenue is what pays for costs and leaves profit.
In an answer, tie each point to the business in the stem. “Marketing increases sales” earns little. “Pembrook Pastries is new on the high street, so advertising its opening informs shoppers who walk past every day” is applied.
2.2 Market research
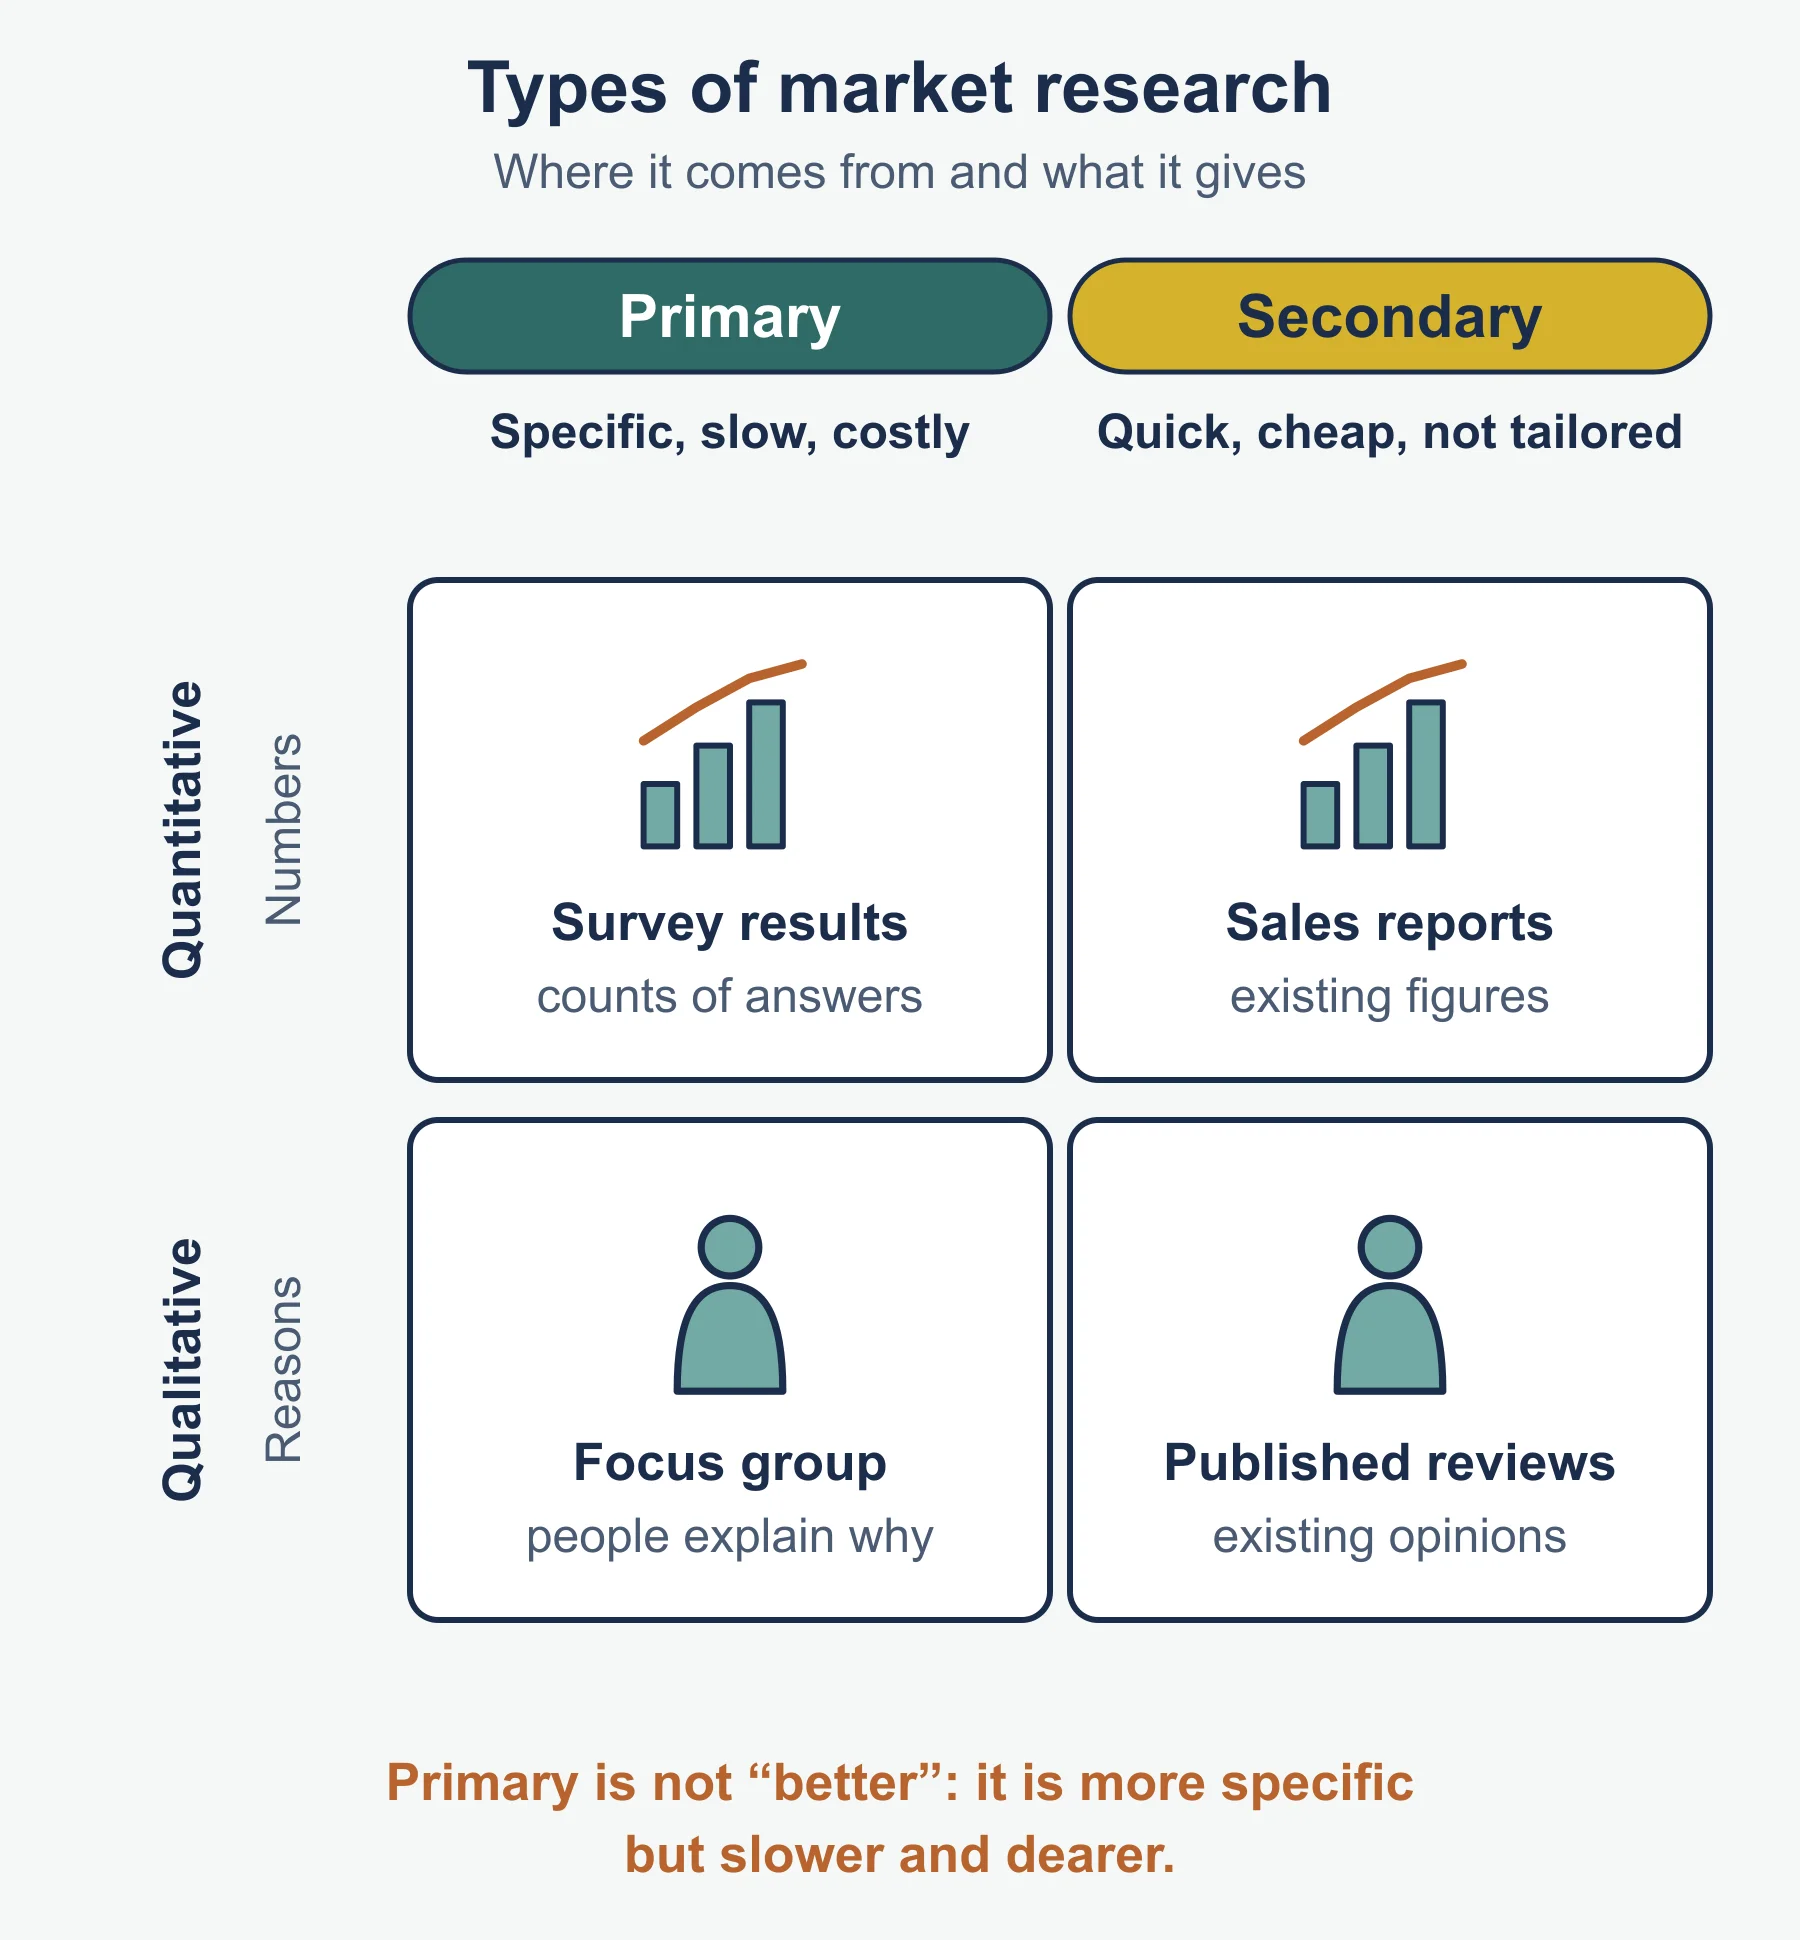
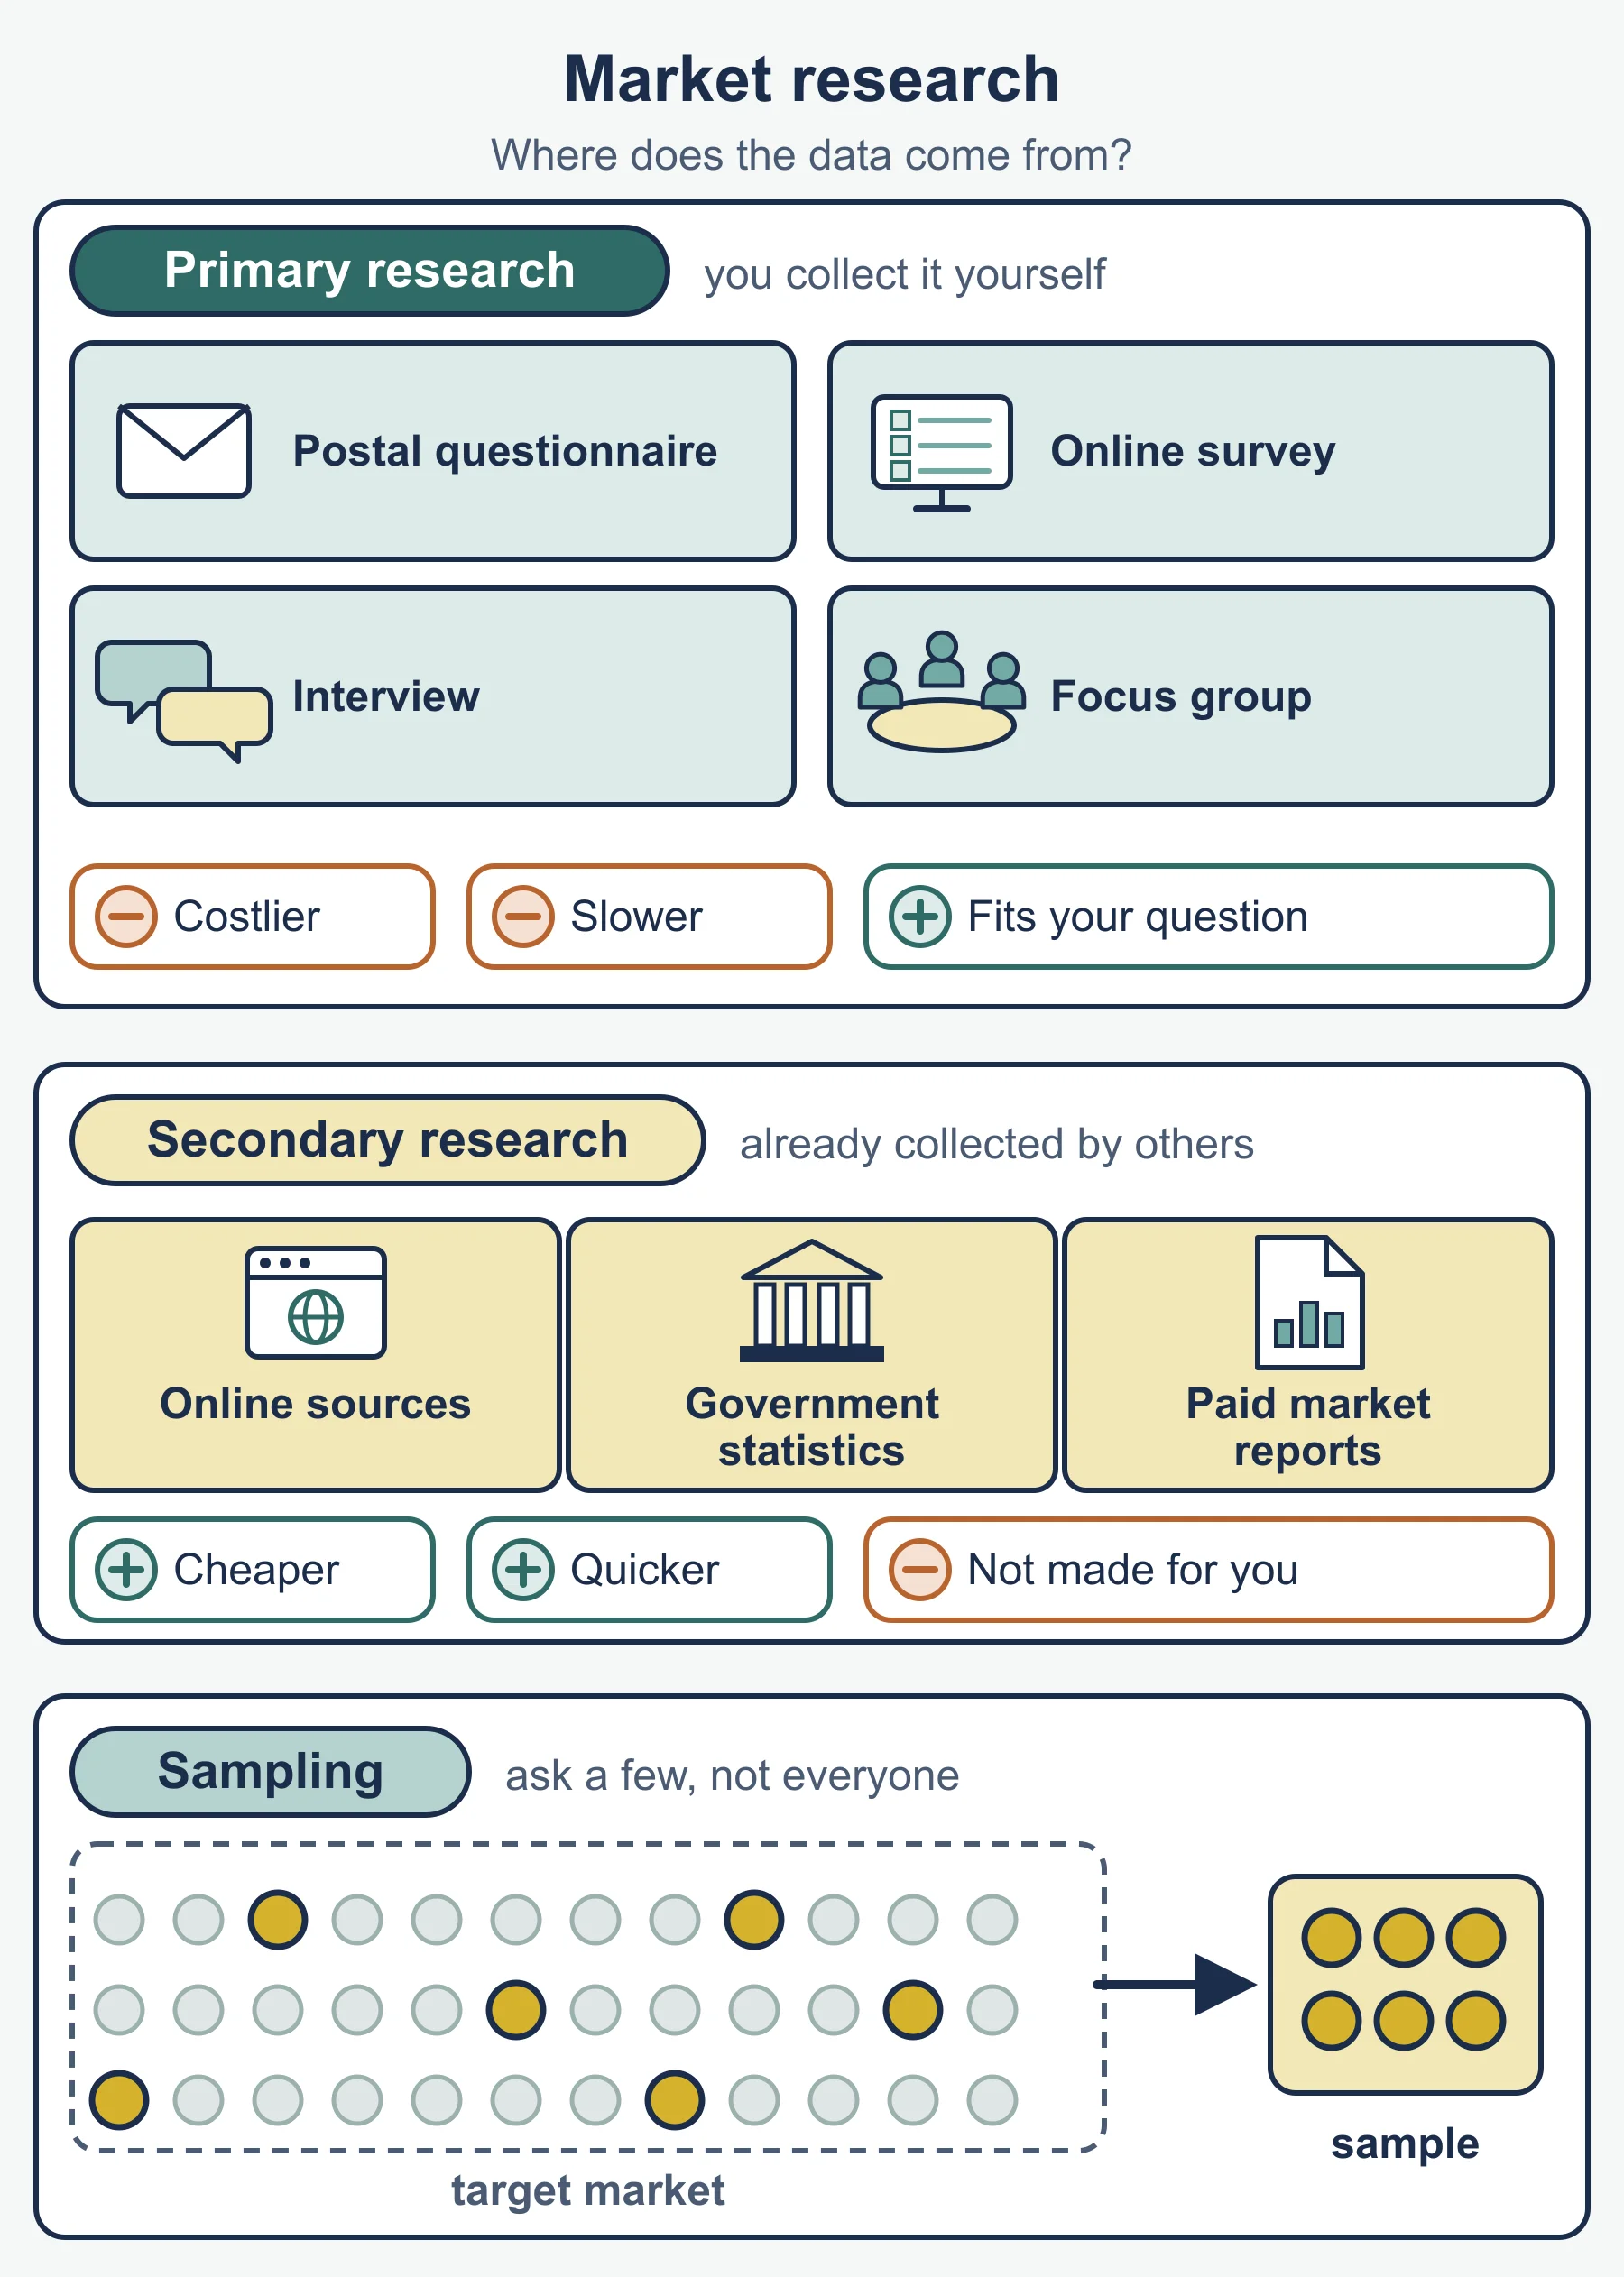
Market research is the collection and study of information about customers, competitors and the market. Its purpose is to identify and understand customer needs, so a business takes decisions on evidence rather than guesses.
Primary research (first-hand)
| Method | Strength | Weakness |
|---|---|---|
| Questionnaires | Many answers at low cost per person; easy to turn into numbers | Poor wording or a small sample misleads; people may not reply |
| Interviews | Can ask follow-up questions and probe reasons | Slow; interviewer time is costly; fewer people covered |
| Trialling | Customers use or taste the real product, so reactions are honest | Needs a finished sample; costs money to produce |
| Focus groups | Group discussion shows opinions and why they are held | Small group; strong voices can dominate |
Secondary research (already exists)
Newspapers and magazines, the census, websites and the business’s own internal data (past sales records, customer complaints) are quicker and cheaper than collecting new data. The limits are that the data may be old, may have been gathered for another purpose, and competitors can see the same sources.
Choosing methods and sources
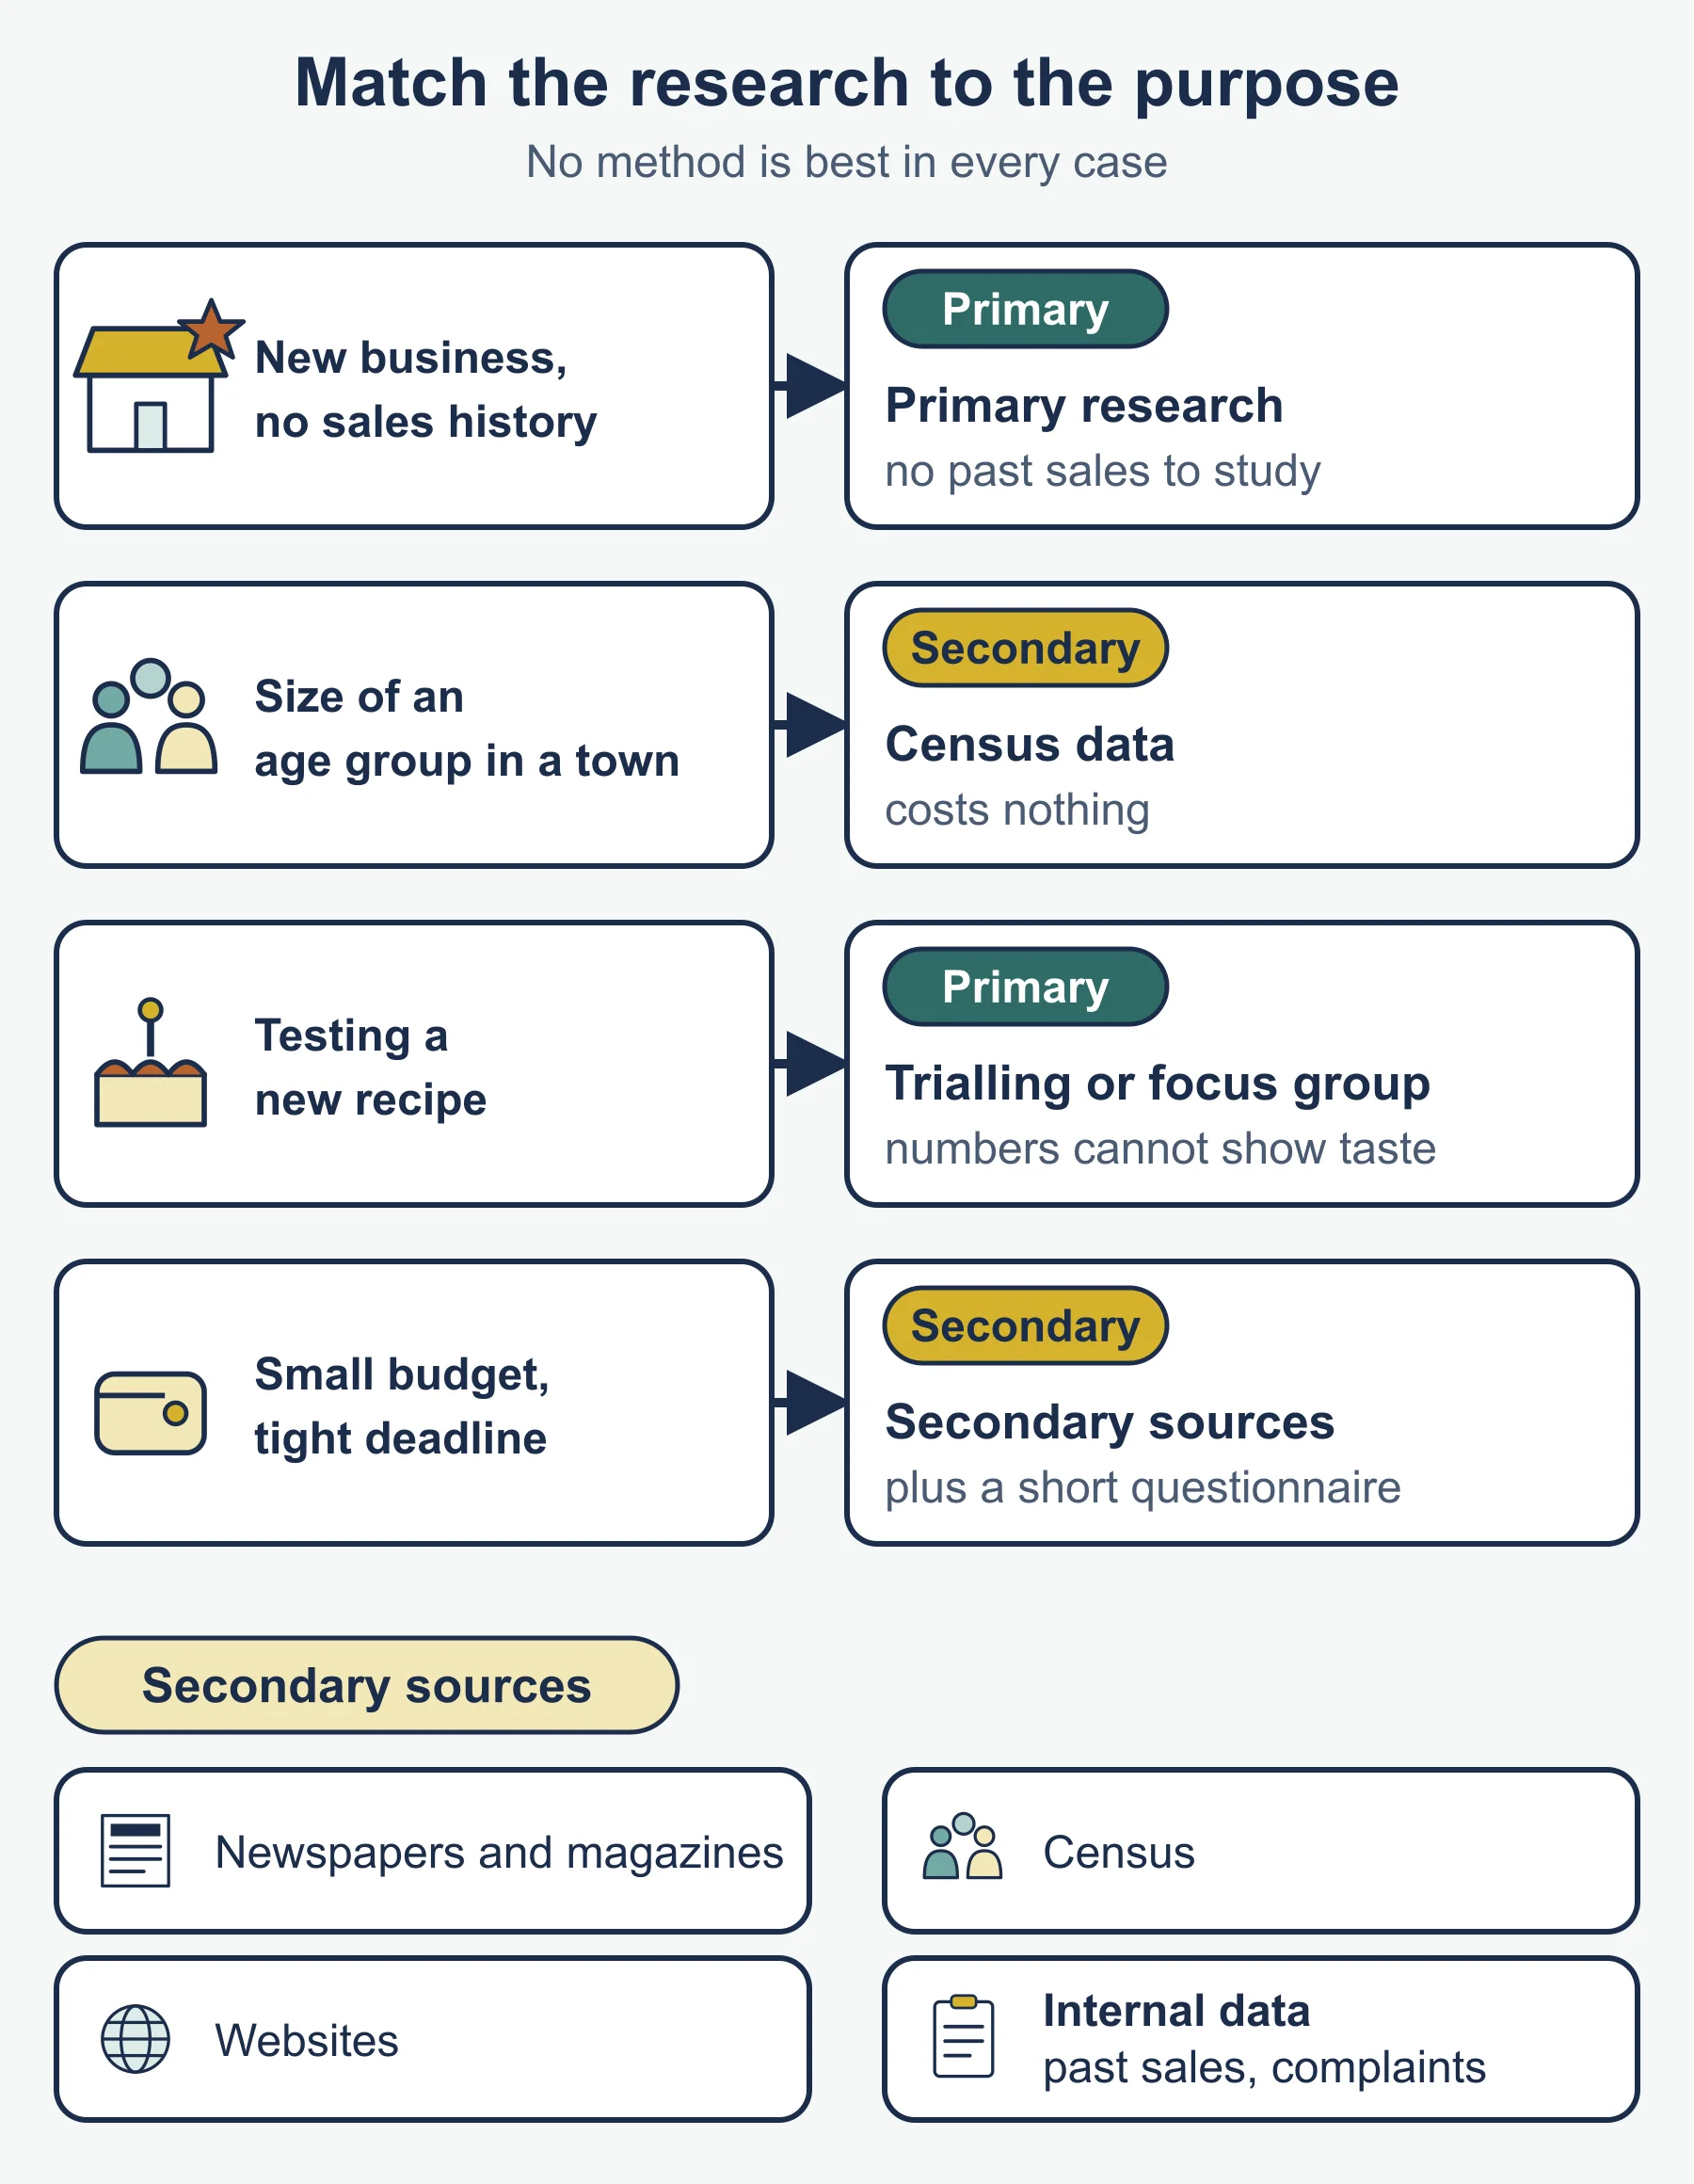
No method is best in every case. Match the method to the purpose.
- A new business with no sales history has no internal data, so it needs primary research.
- A firm checking the size of an age group in a town could use census data, which costs nothing.
- A firm testing a new recipe needs trialling or a focus group, because a statistic cannot tell it how something tastes.
- A firm with a small budget and a tight deadline will lean on secondary sources and perhaps a short questionnaire.
Qualitative and quantitative data
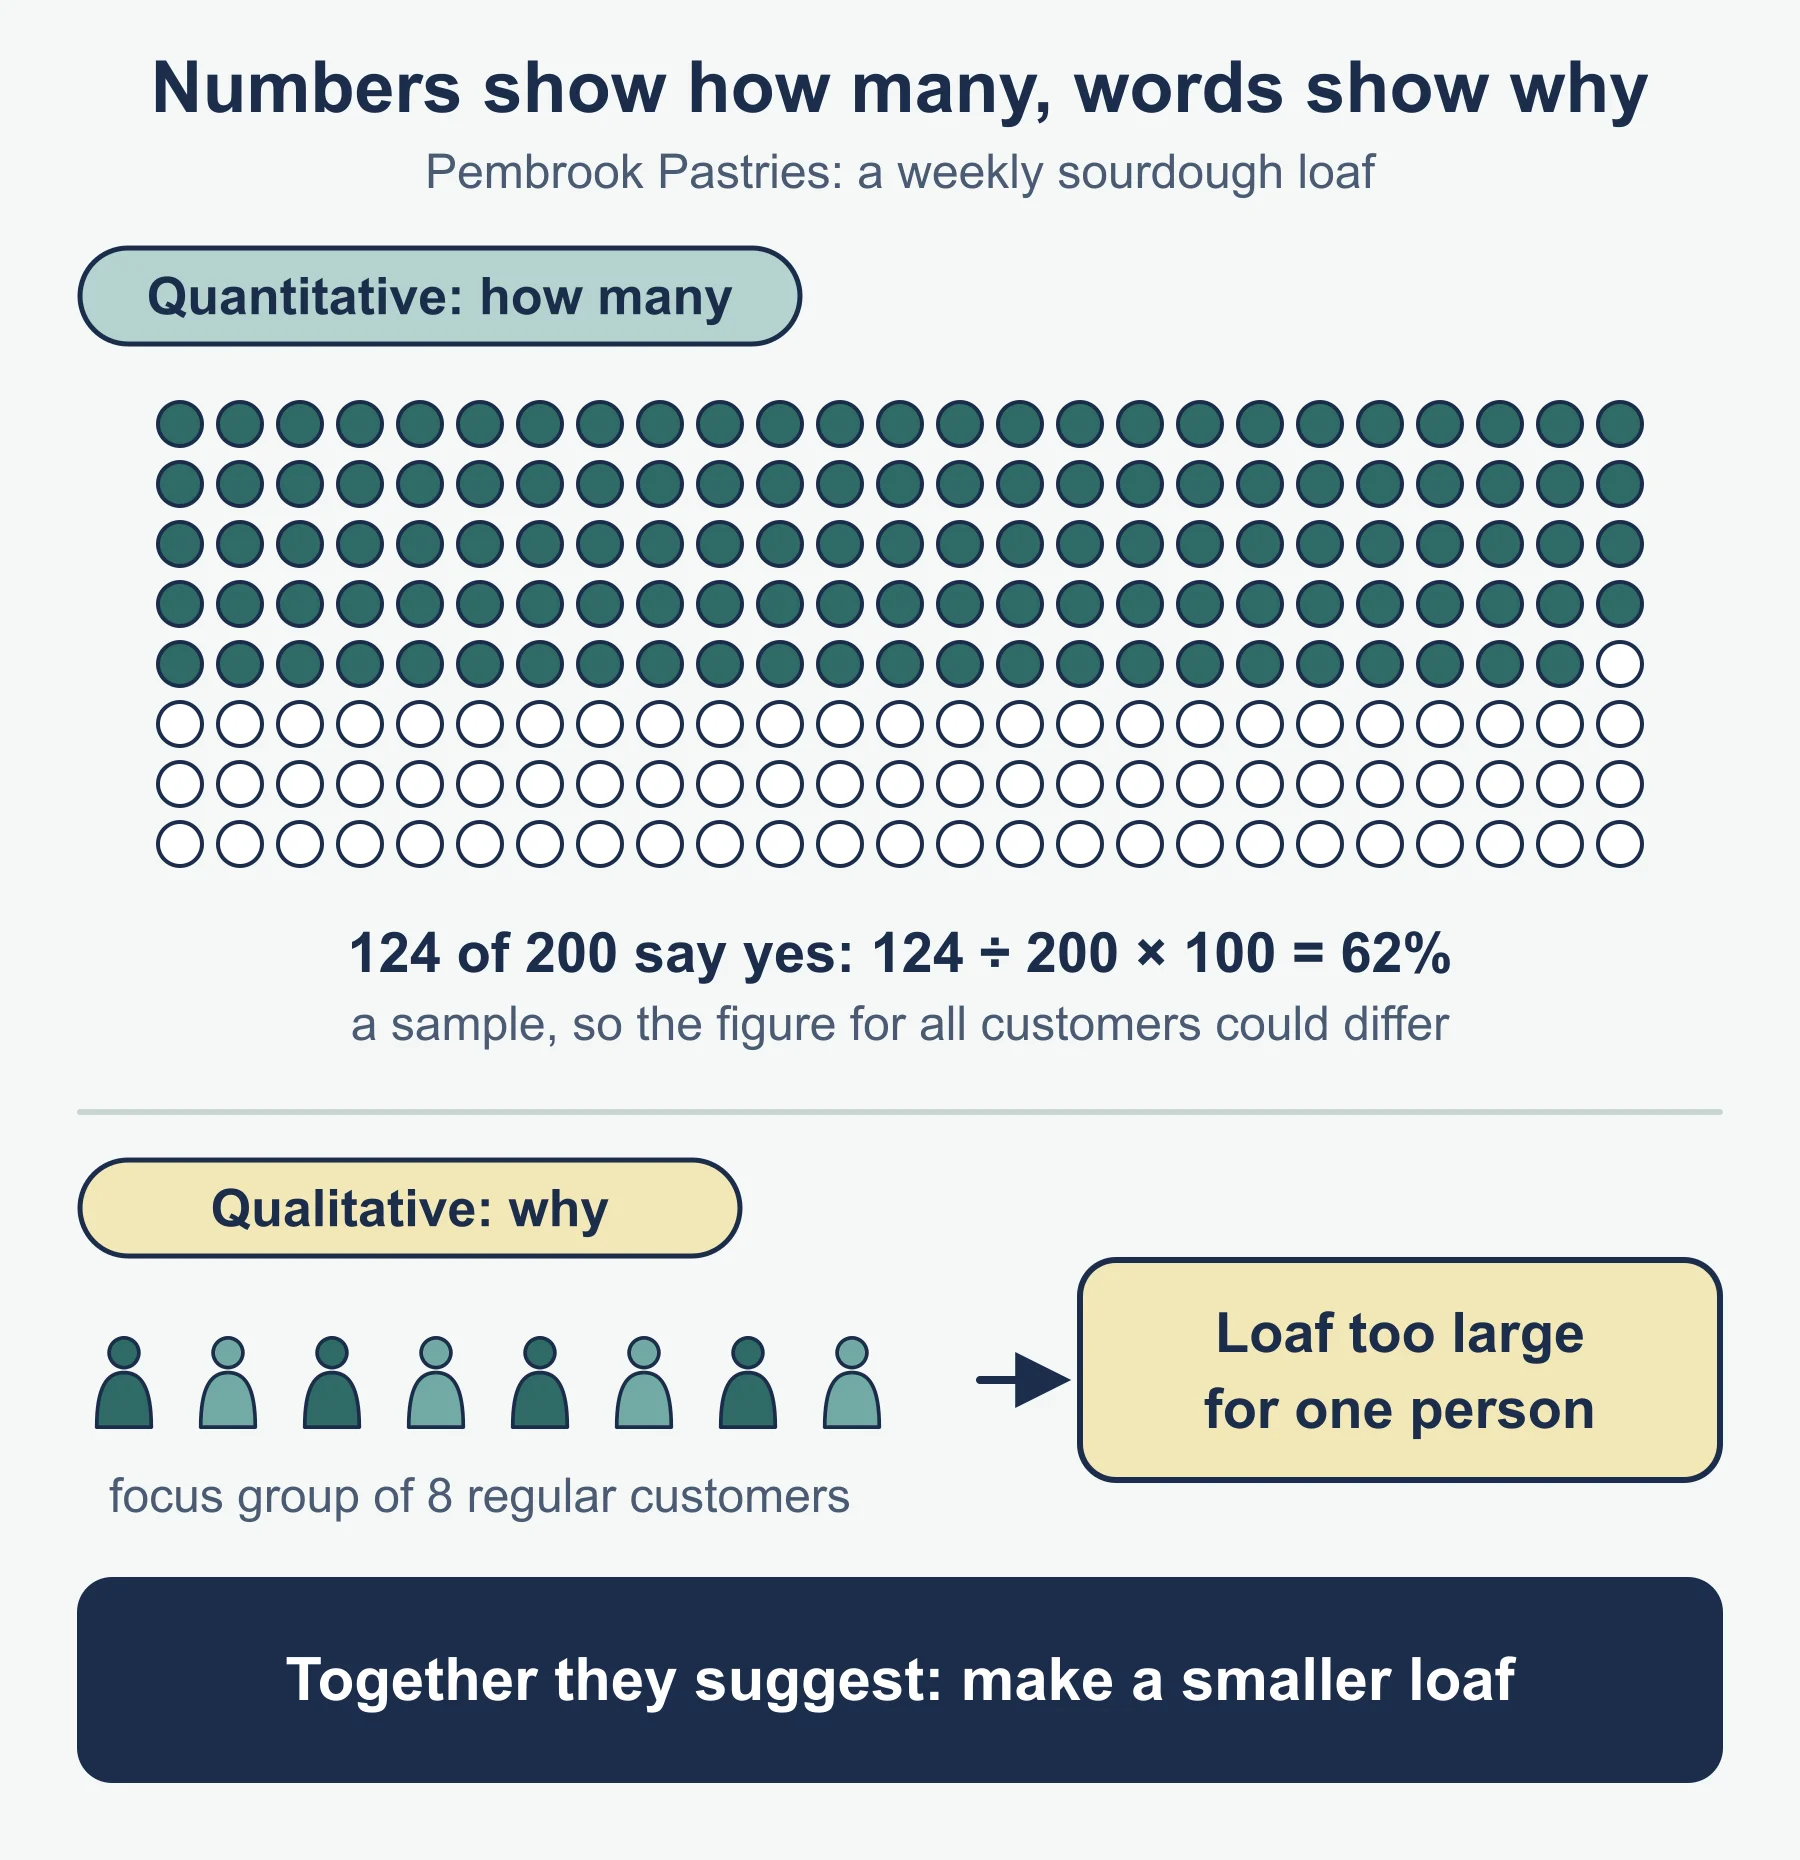
Quantitative data is numerical: counts, percentages, averages. Qualitative data is descriptive: opinions, reasons, feelings. Numbers show how many; words show why. Good decisions often use both.
Worked example. Pembrook Pastries asks 200 customers whether they would buy a sourdough loaf each week. 124 say yes.
Percentage saying yes = 124 / 200 × 100 = 62%
That is quantitative. A focus group of eight regular customers adds that they like the sourdough but find the loaf too large for one person. That is qualitative, and it suggests a smaller loaf. The percentage alone could not have told Pembrook that. The 62% is also a sample, so the figure for all customers could differ.
2.3 Market segmentation
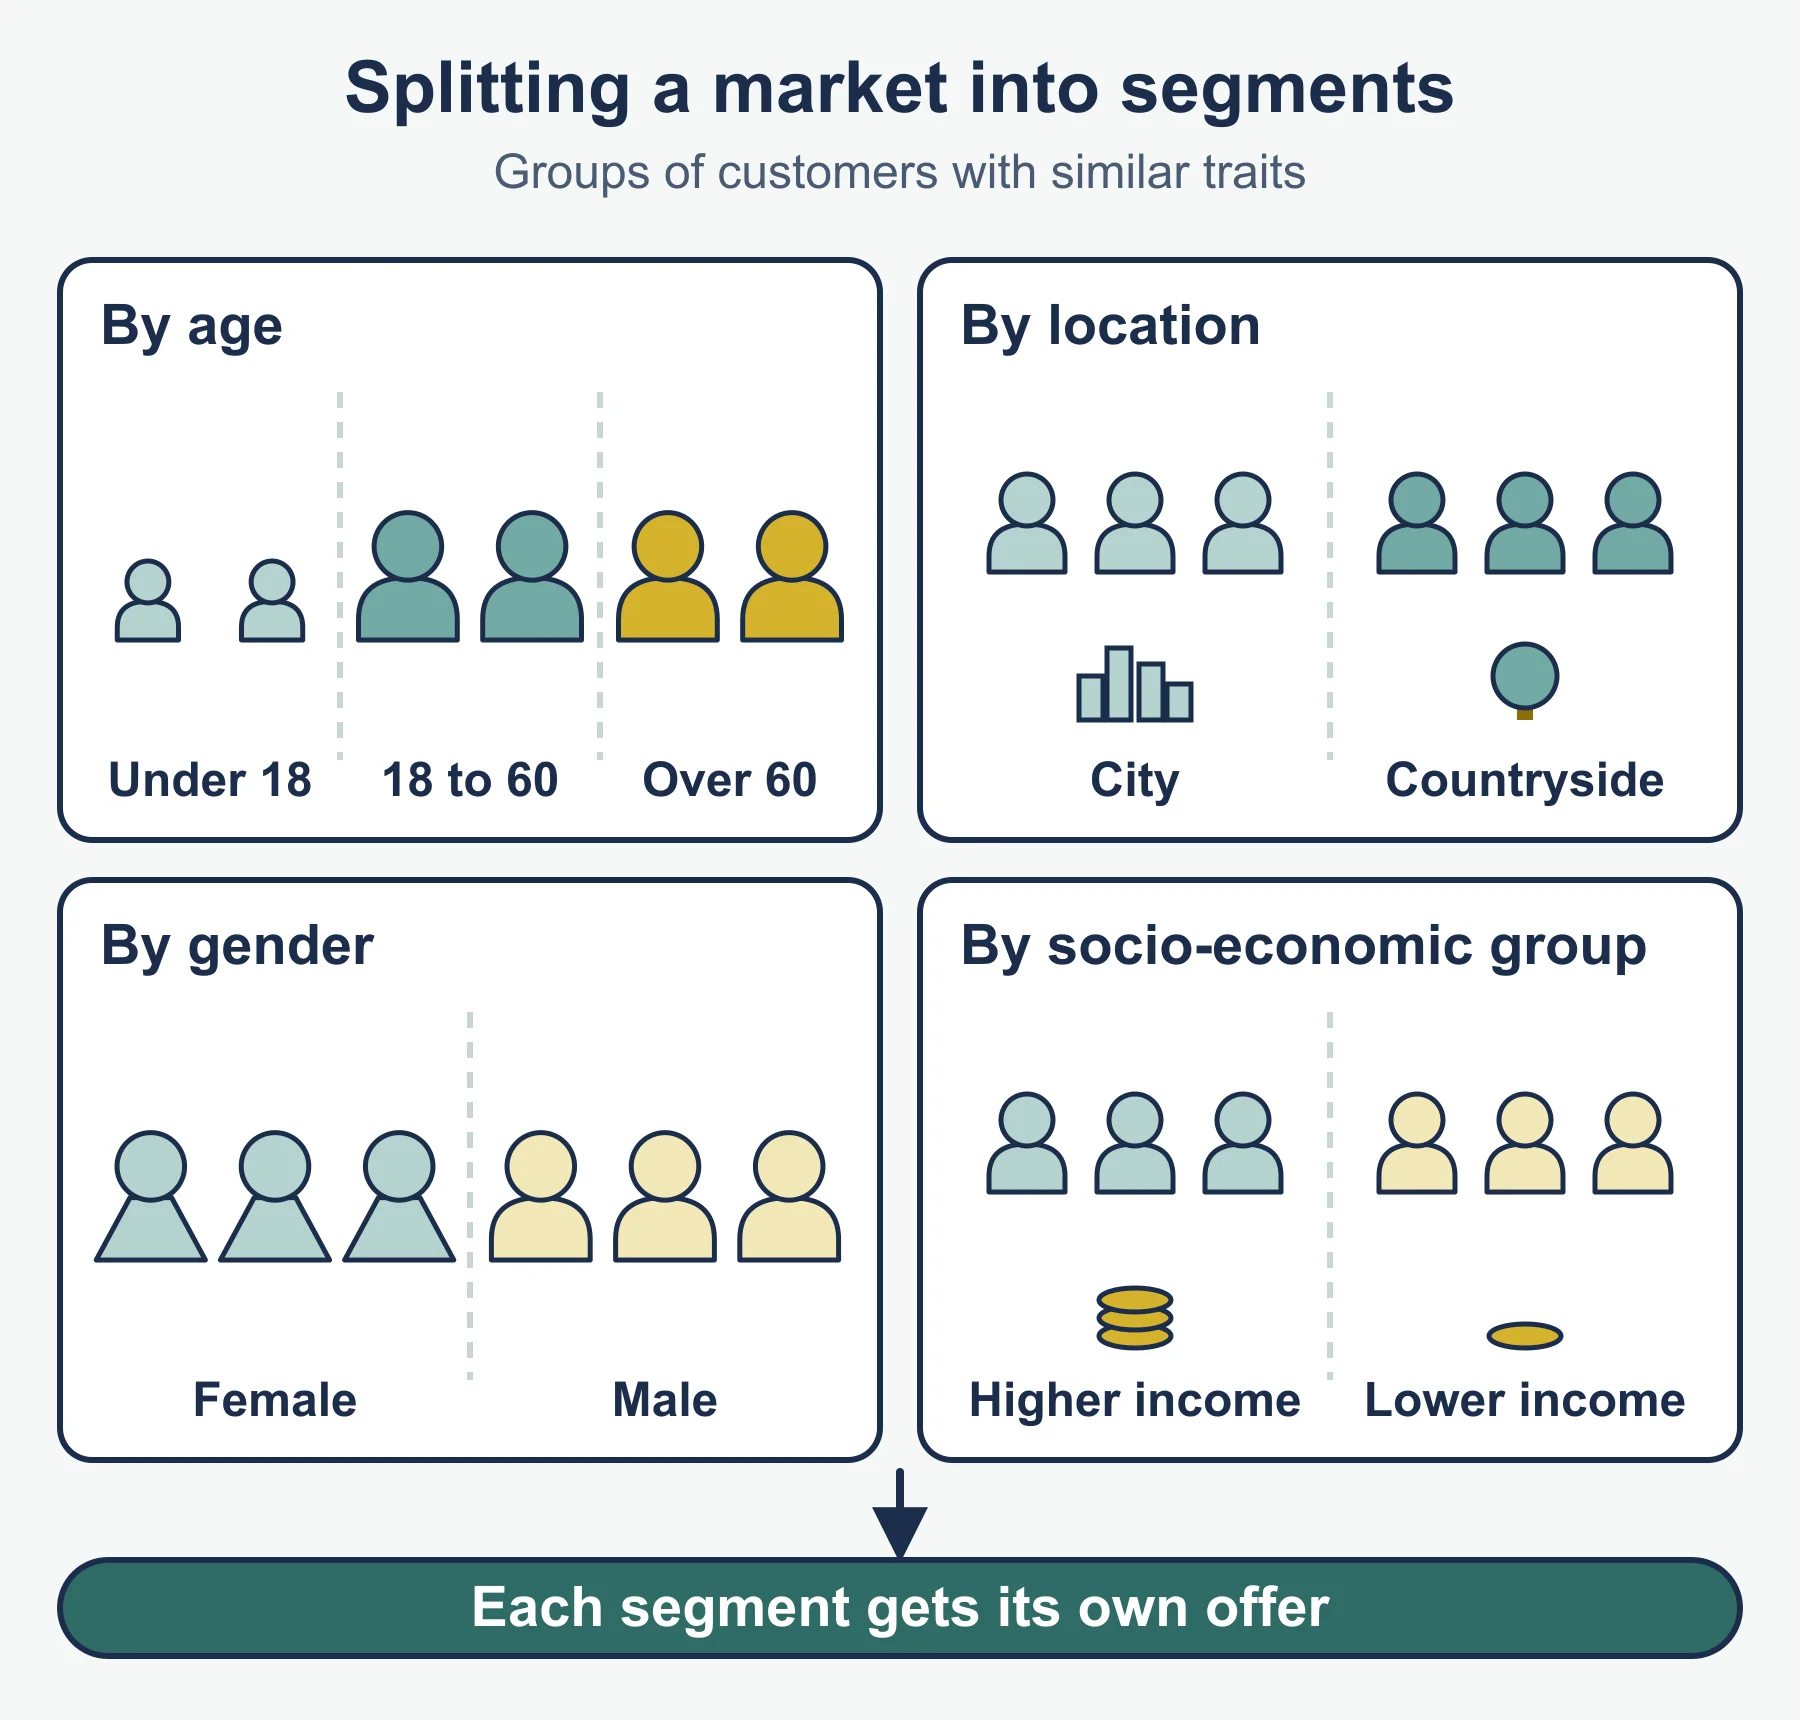
Market segmentation divides a market into groups of customers who share characteristics. A business then targets the segments it wants rather than everyone. The specification lists five bases.
| Basis | Example |
|---|---|
| Age | Cheap mobile phone plans for teenagers |
| Gender | A razor range designed for women |
| Income | A budget range and a luxury range of the same item |
| Location | Warm coats in northern towns, sun cream in coastal resorts |
| Lifestyle | Running shoes for people who train regularly |
Segmentation helps because the product, price, promotion and place can then be chosen to suit that group. A stall selling energy bars to marathon runners might advertise in a running magazine (lifestyle) and sell at race events (place). Segmenting has a cost: the business must research each segment and may need separate products or adverts.
2.4 The marketing mix
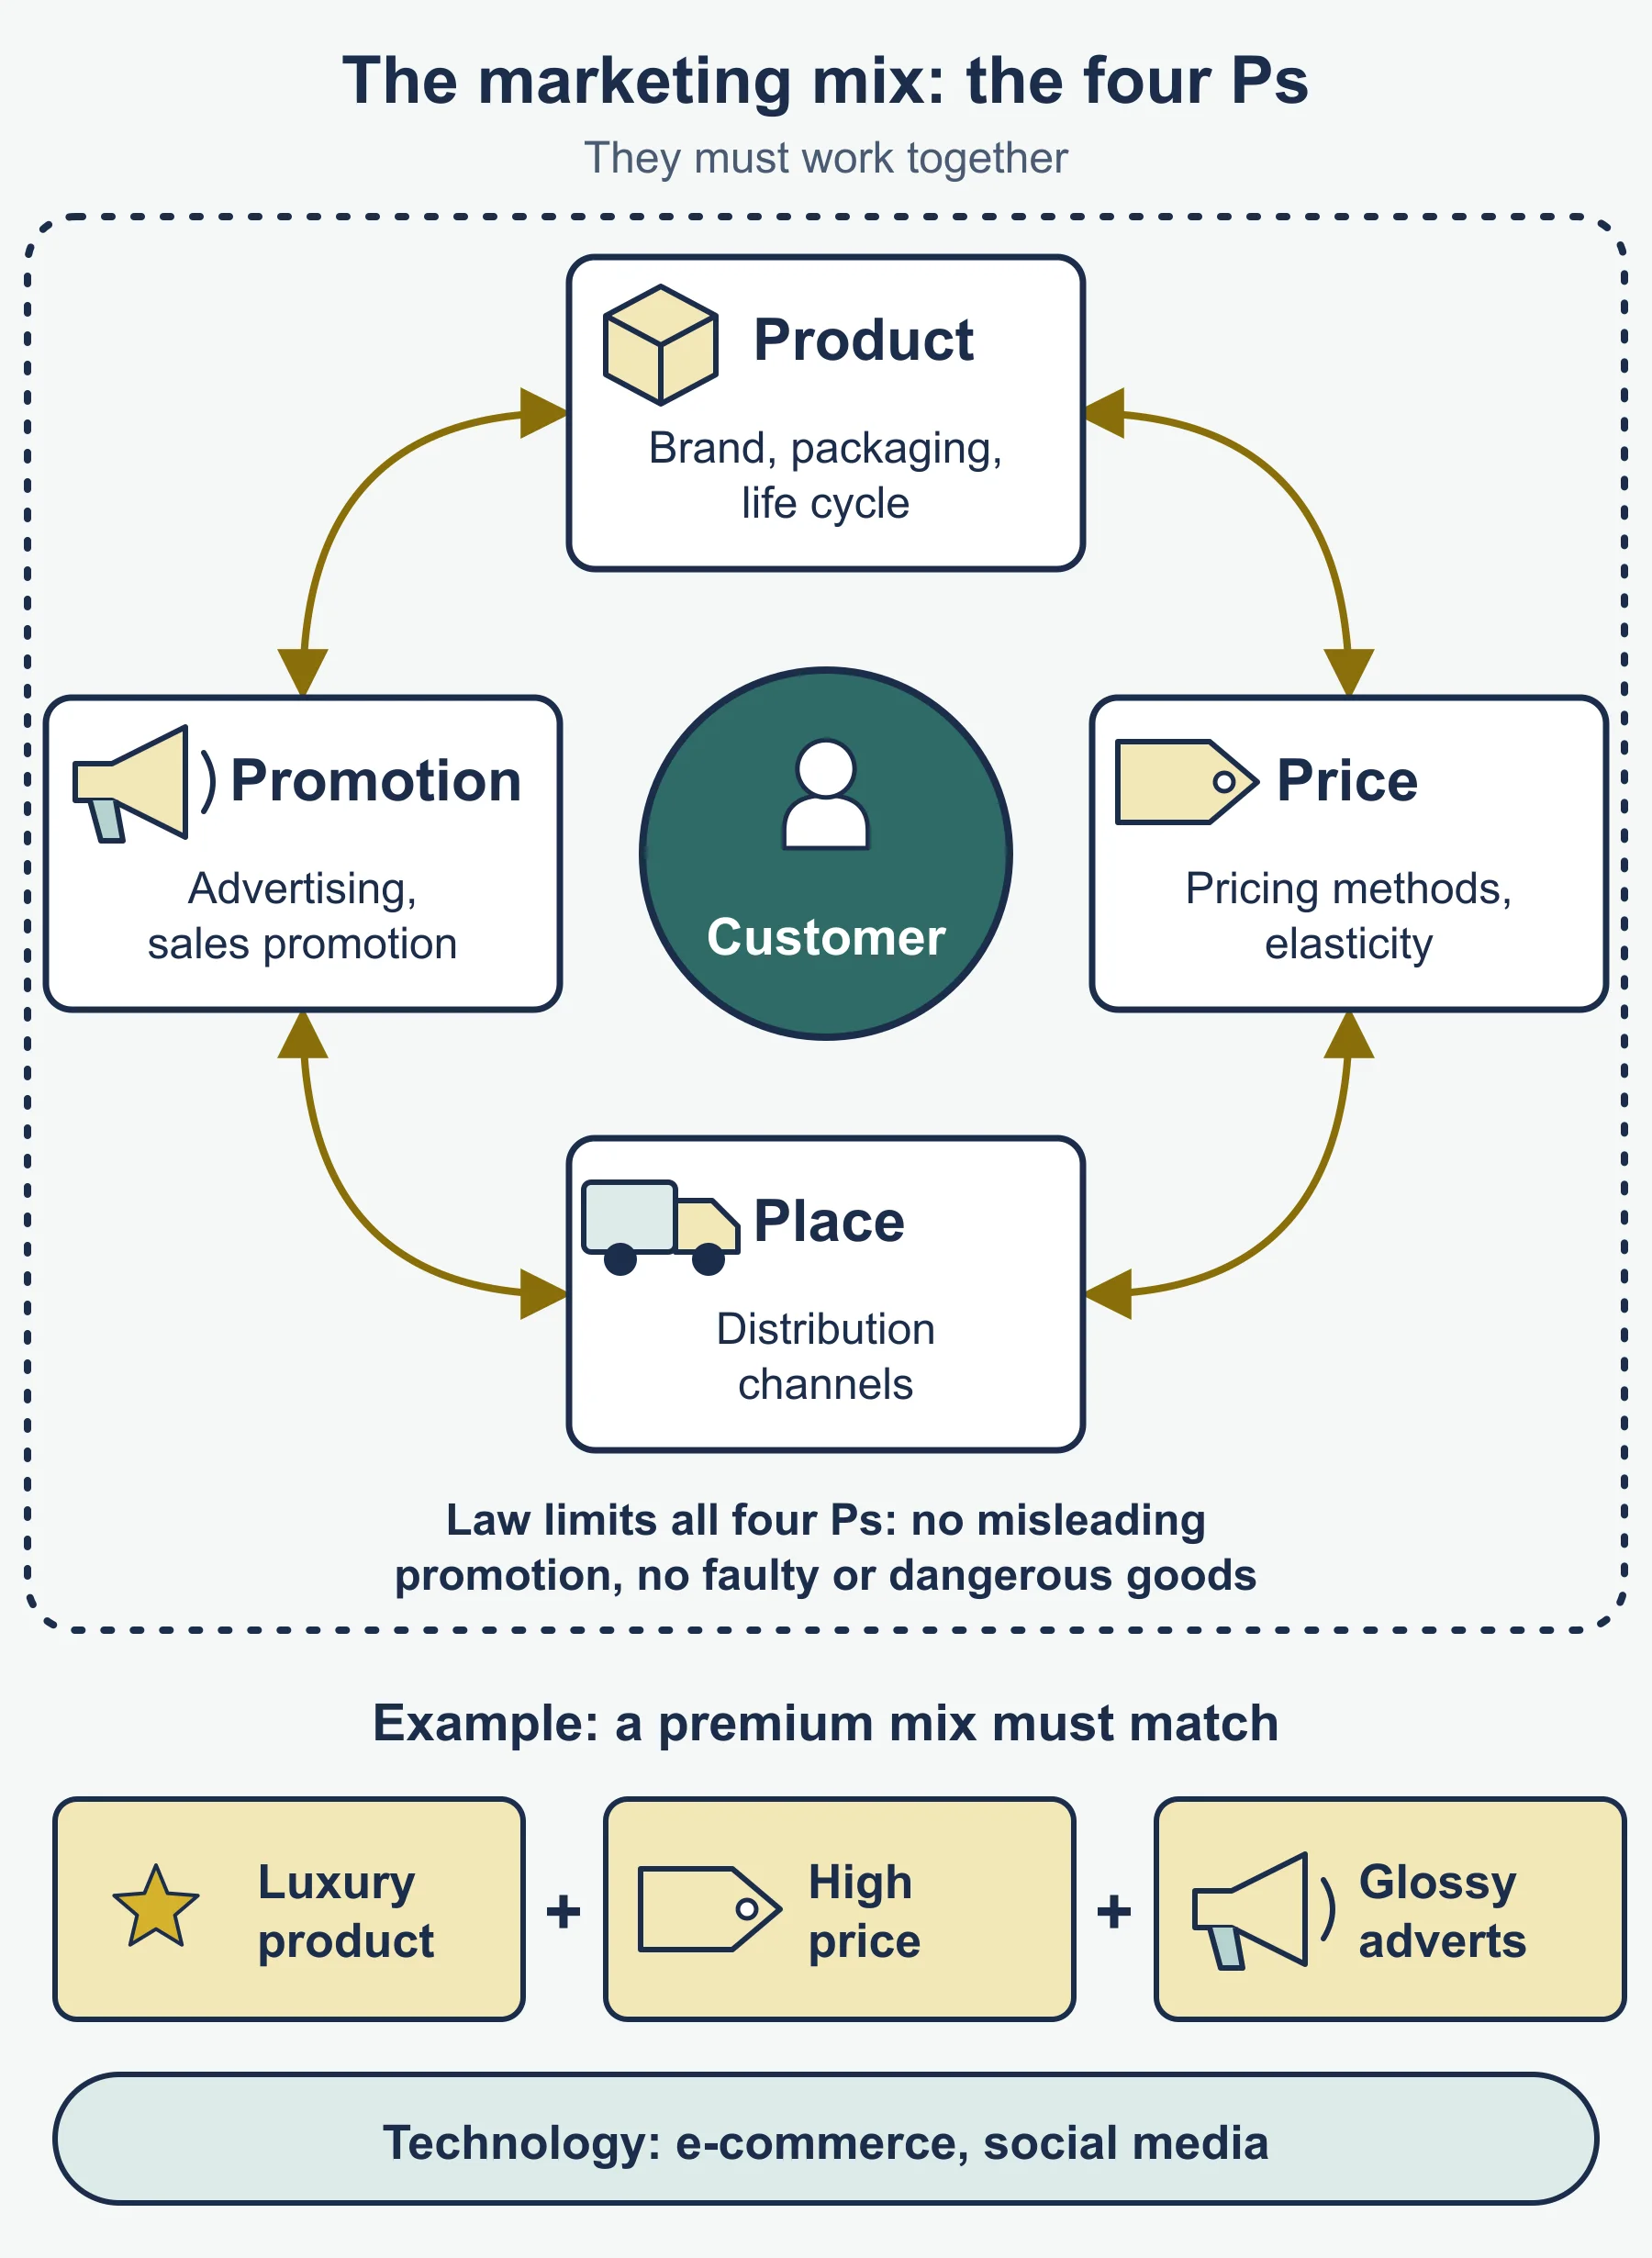
The marketing mix is the combination of the four Ps: product, price, promotion and place. It matters because customers react to the whole offer, not to one part of it.
Product: design, invention, innovation
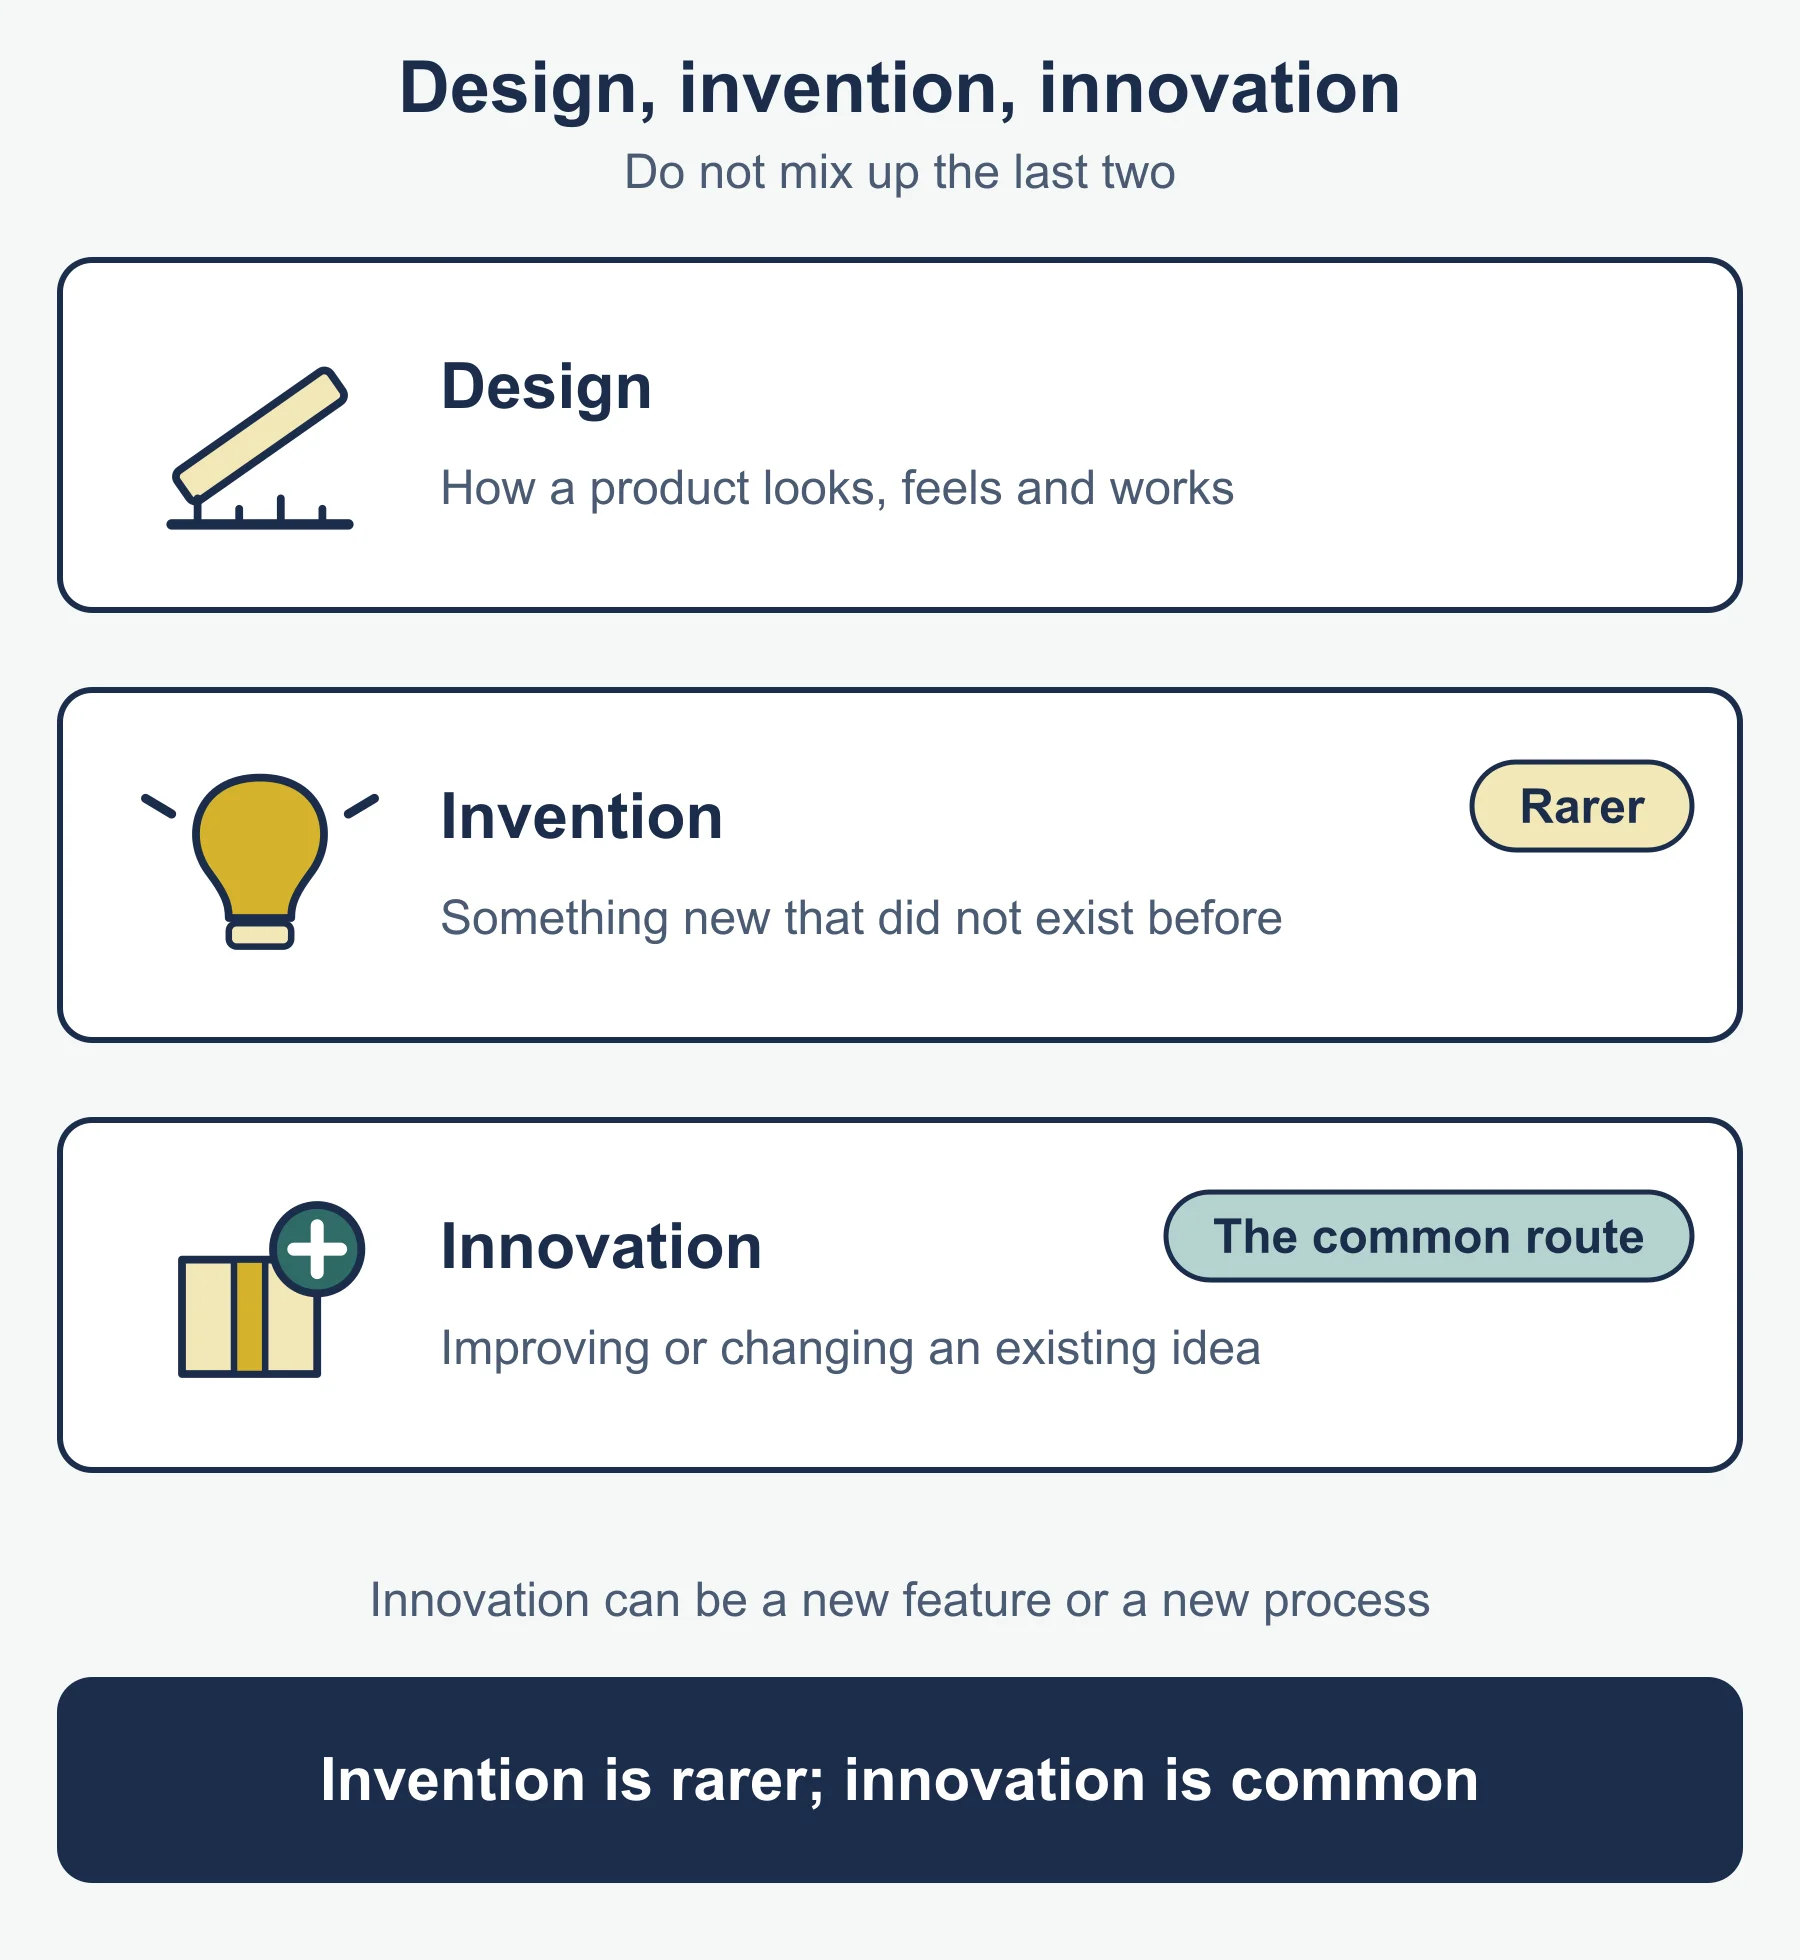
Design is how a product looks, feels and works. Invention is creating something new that did not exist before. Innovation is improving or changing an existing idea, such as adding a feature or using a new process. Invention is rarer; innovation is the common route for most firms.
The product life cycle
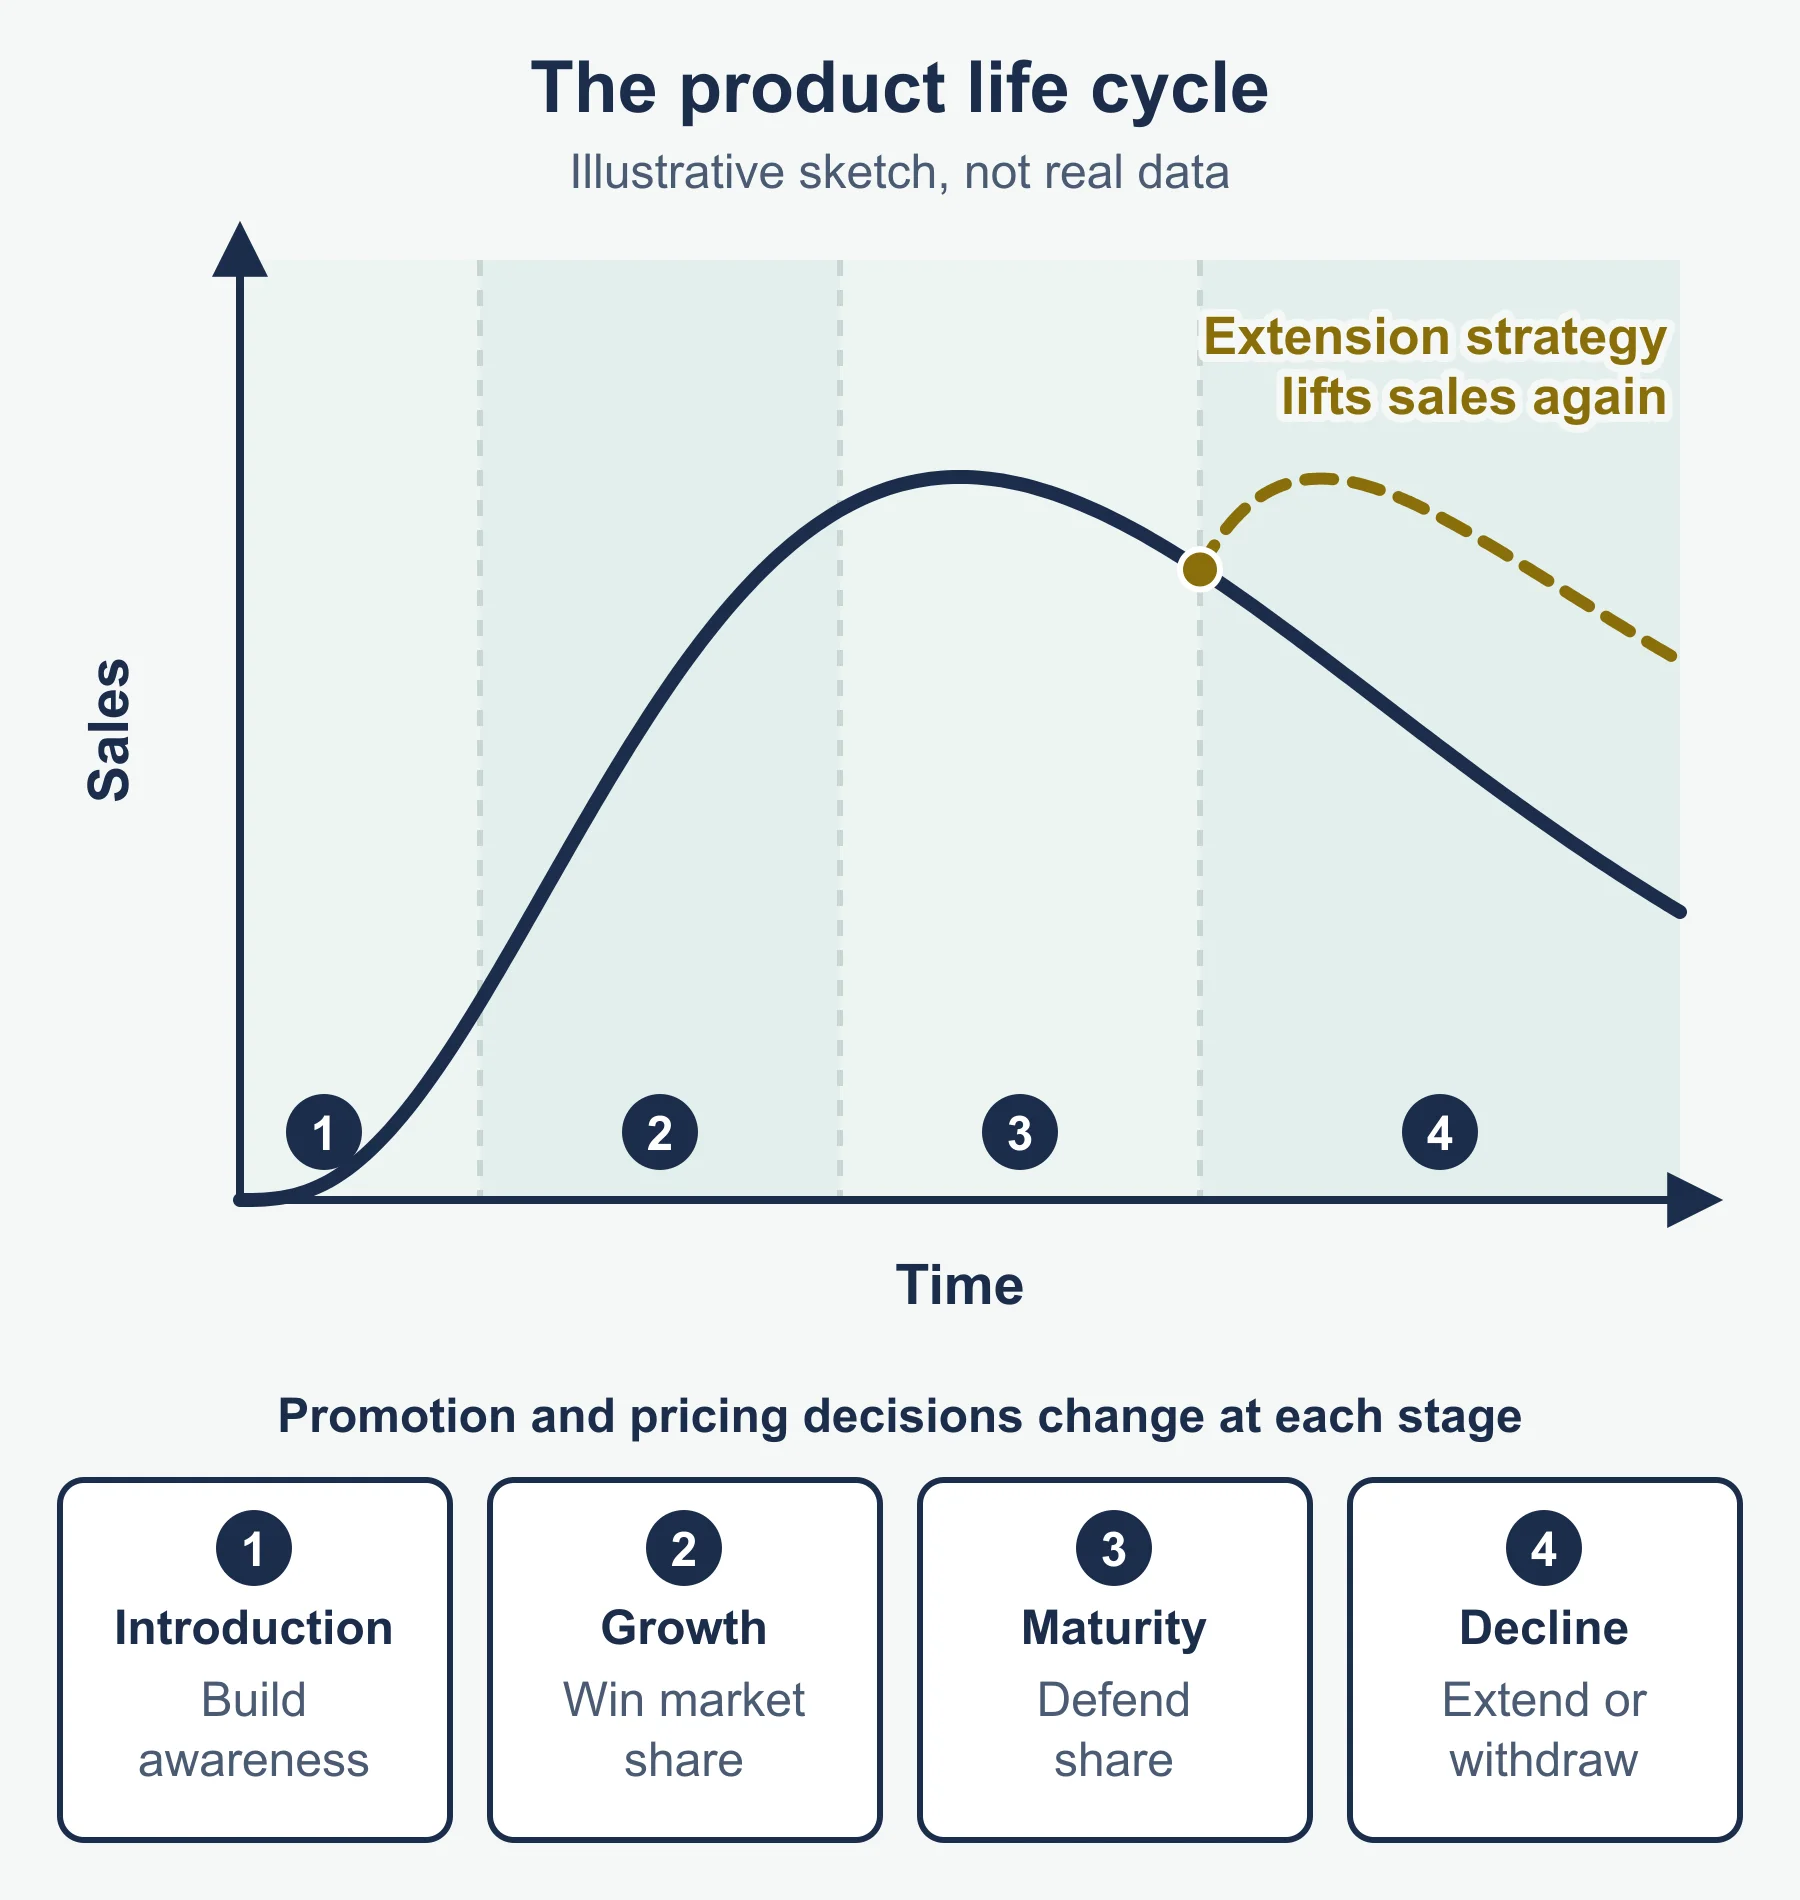
| Stage | Sales | What usually happens |
|---|---|---|
| Introduction | Low, starting to build | Few customers know it; promotion matters |
| Growth | Rising quickly | More buyers; rivals notice |
| Maturity | Highest, levelling off | Sales stop rising |
| Decline | Falling | Tastes move on or better products appear |
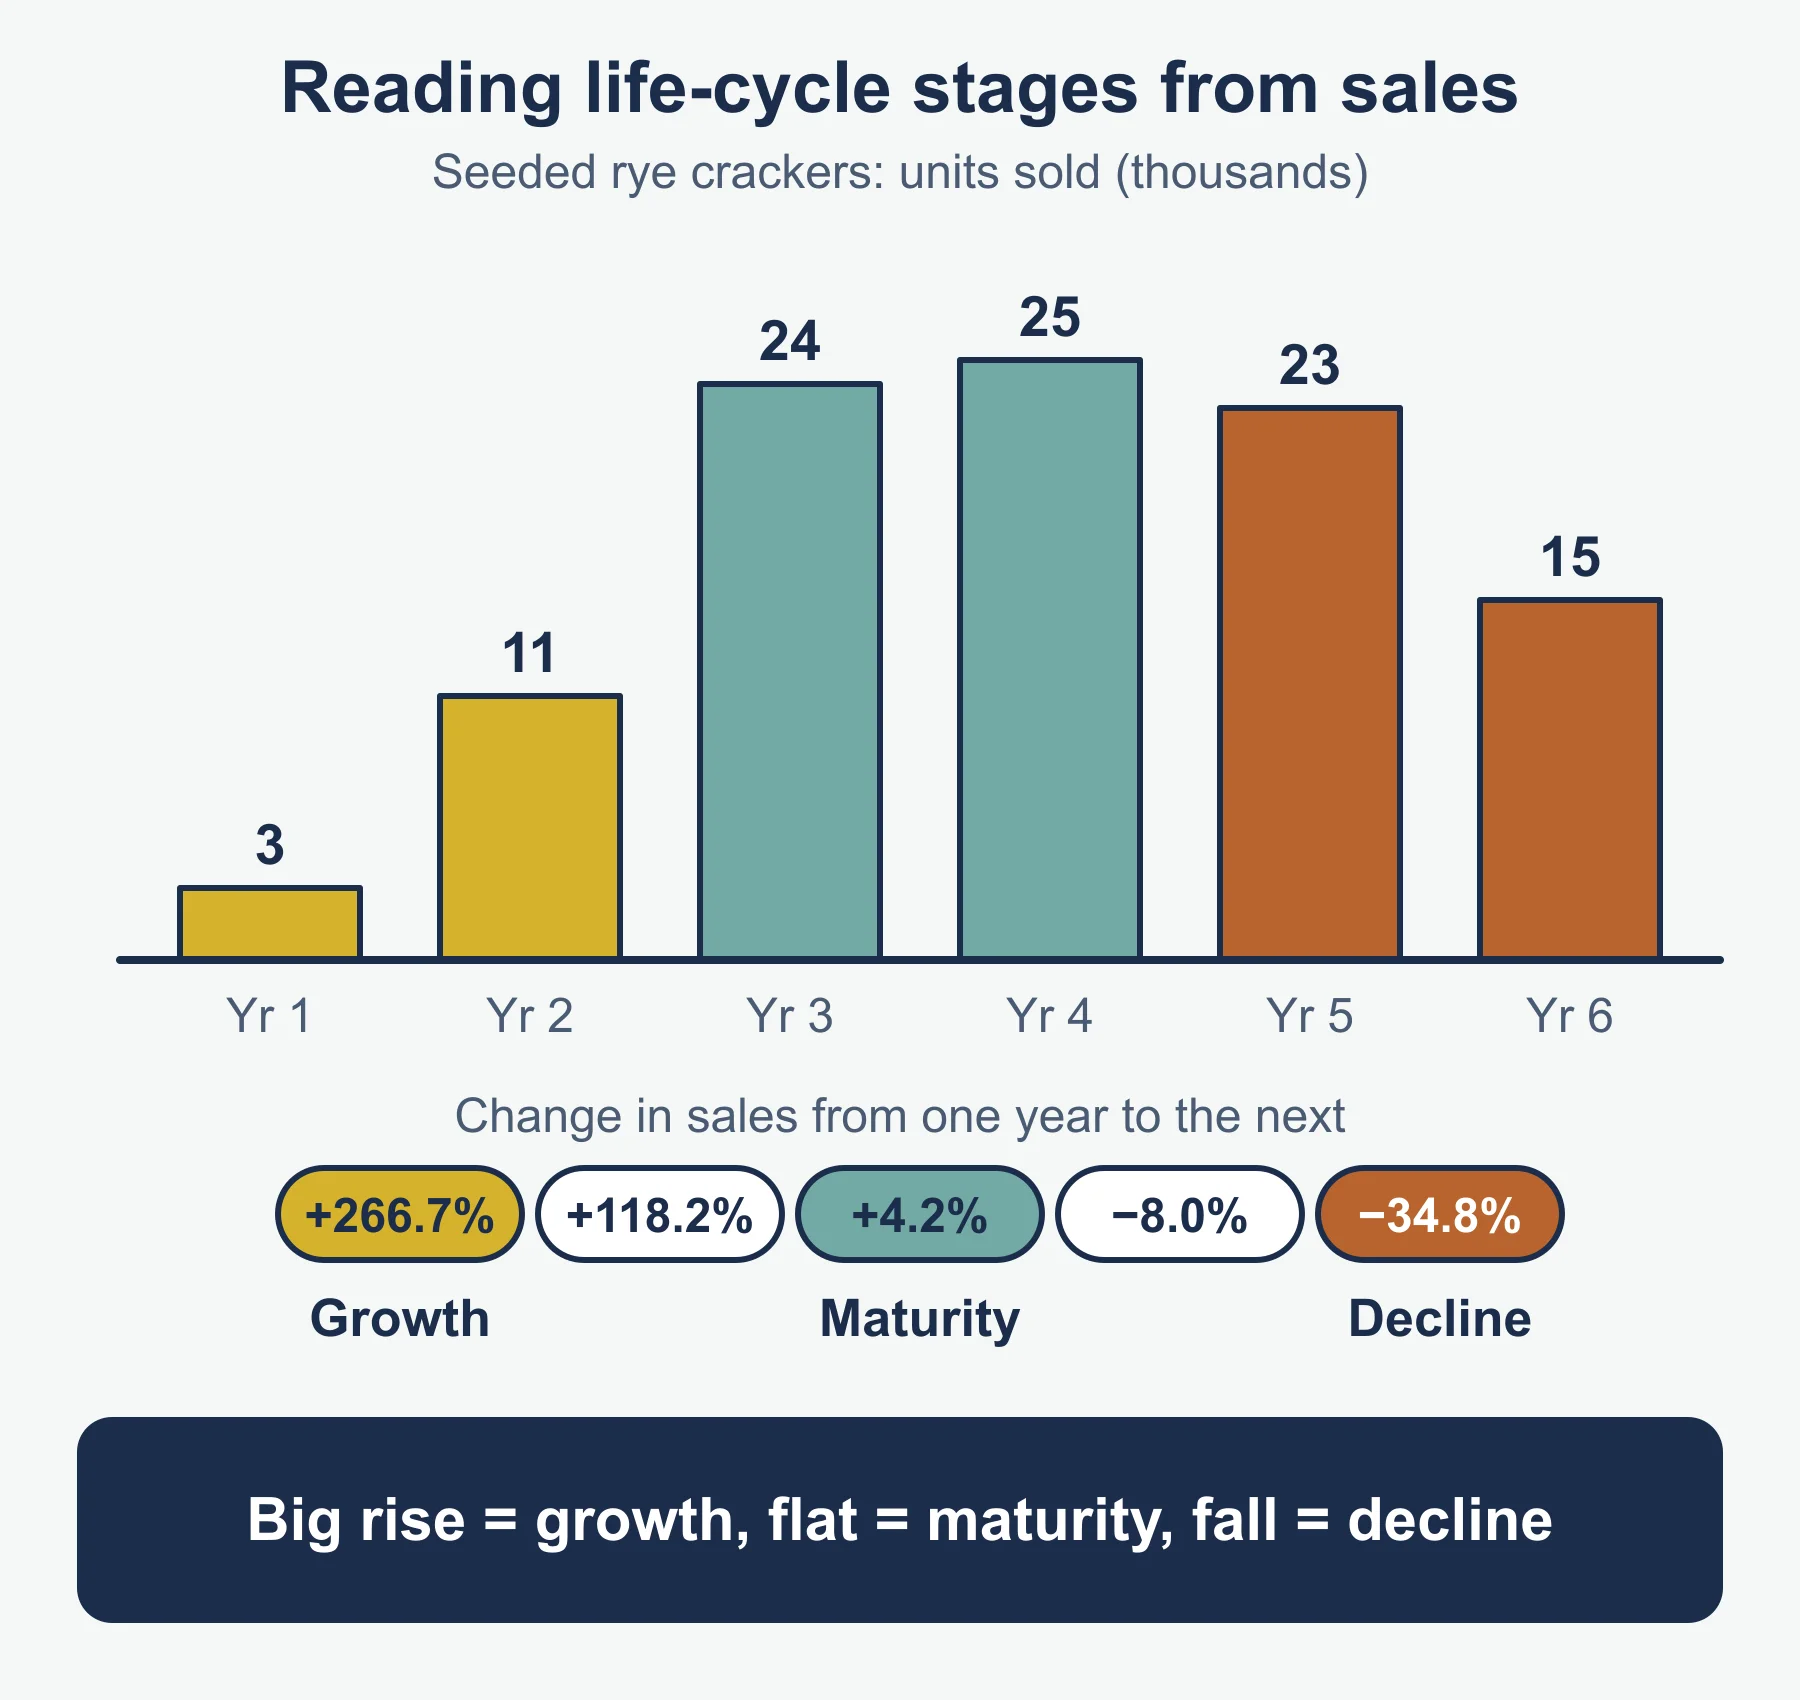
Worked example. Pembrook sells seeded rye crackers. Units sold, in thousands: year 1: 3; year 2: 11; year 3: 24; year 4: 25; year 5: 23; year 6: 15.
Year 3 to year 4: (25 - 24) / 24 × 100 = +4.2%. Sales have almost stopped rising, so this is maturity. Year 5 to year 6: (15 - 23) / 23 × 100 = -34.8%. Sales are falling fast, so this is decline. Year 1 to year 2 is +266.7%, which fits growth.
Pricing methods
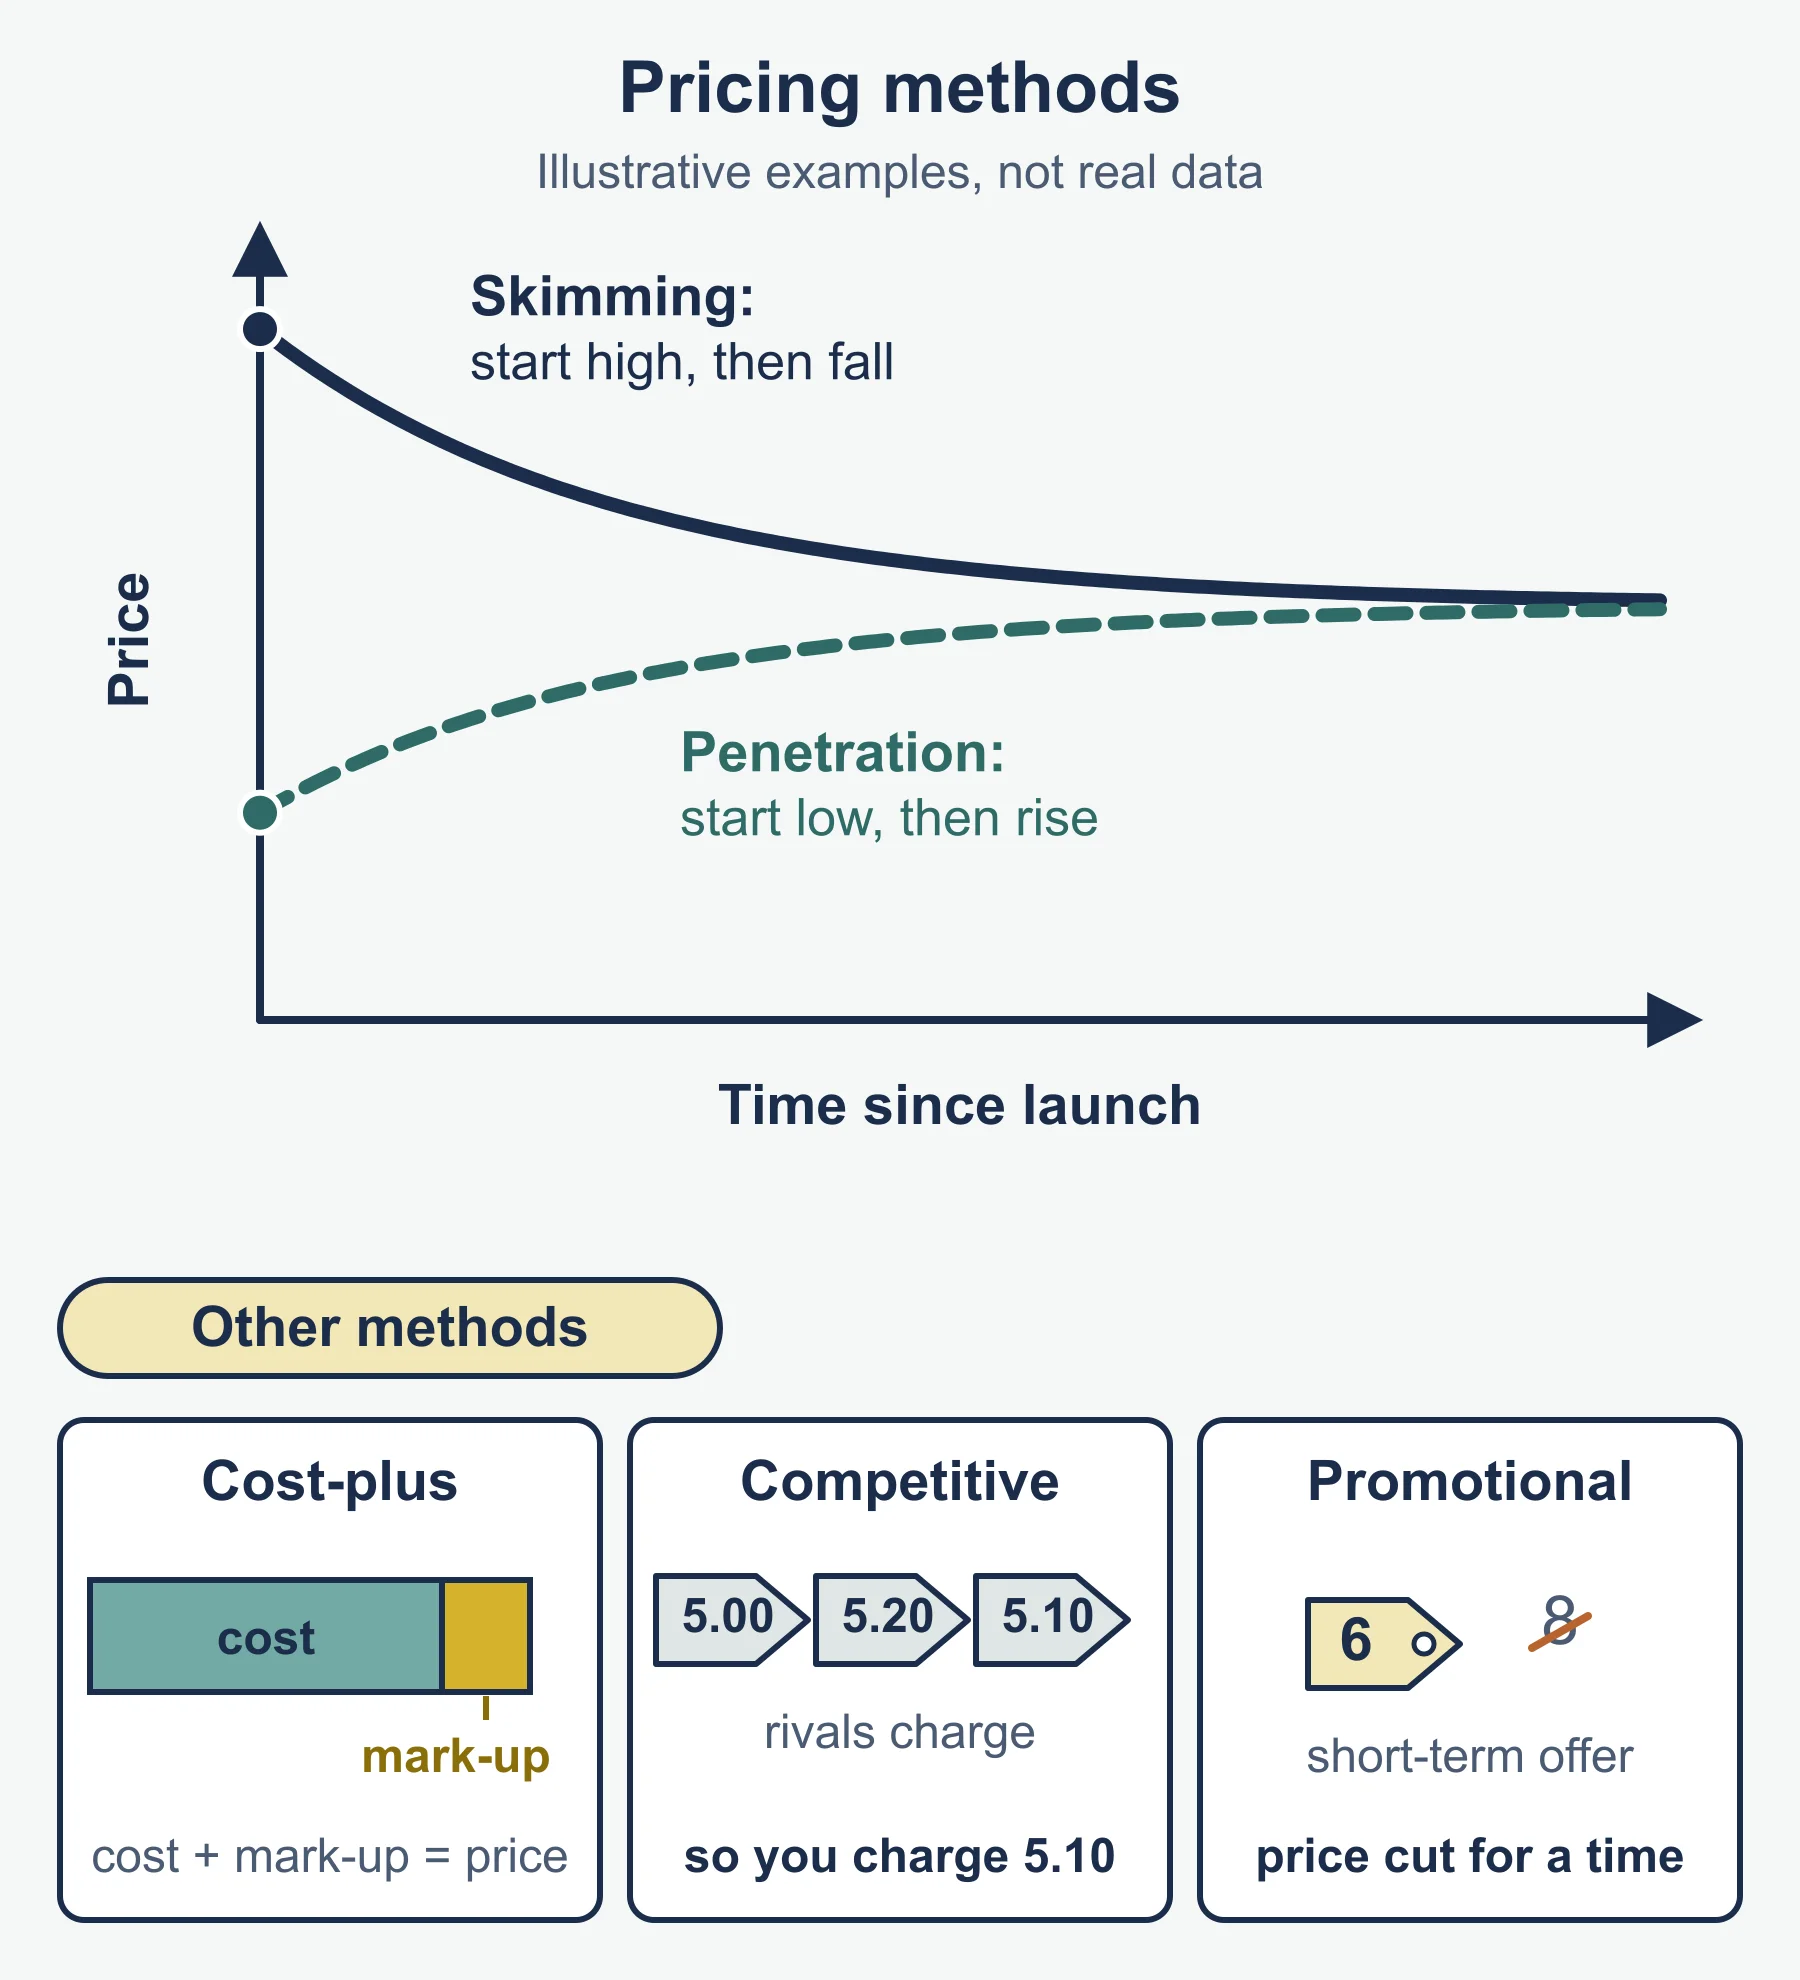
| Method | How it works | Suits |
|---|---|---|
| Price skimming | High price at launch, lowered later | A new, desirable product with few rivals |
| Penetration | Low price at launch to win customers quickly | A new product entering a crowded market |
| Cost-plus | Unit cost plus a mark-up | Simple jobs; a business that must cover costs |
| Competitor pricing | Set near what rivals charge | A market with similar products |
| Promotional pricing | Temporary price cut | Clearing stock or attracting attention |
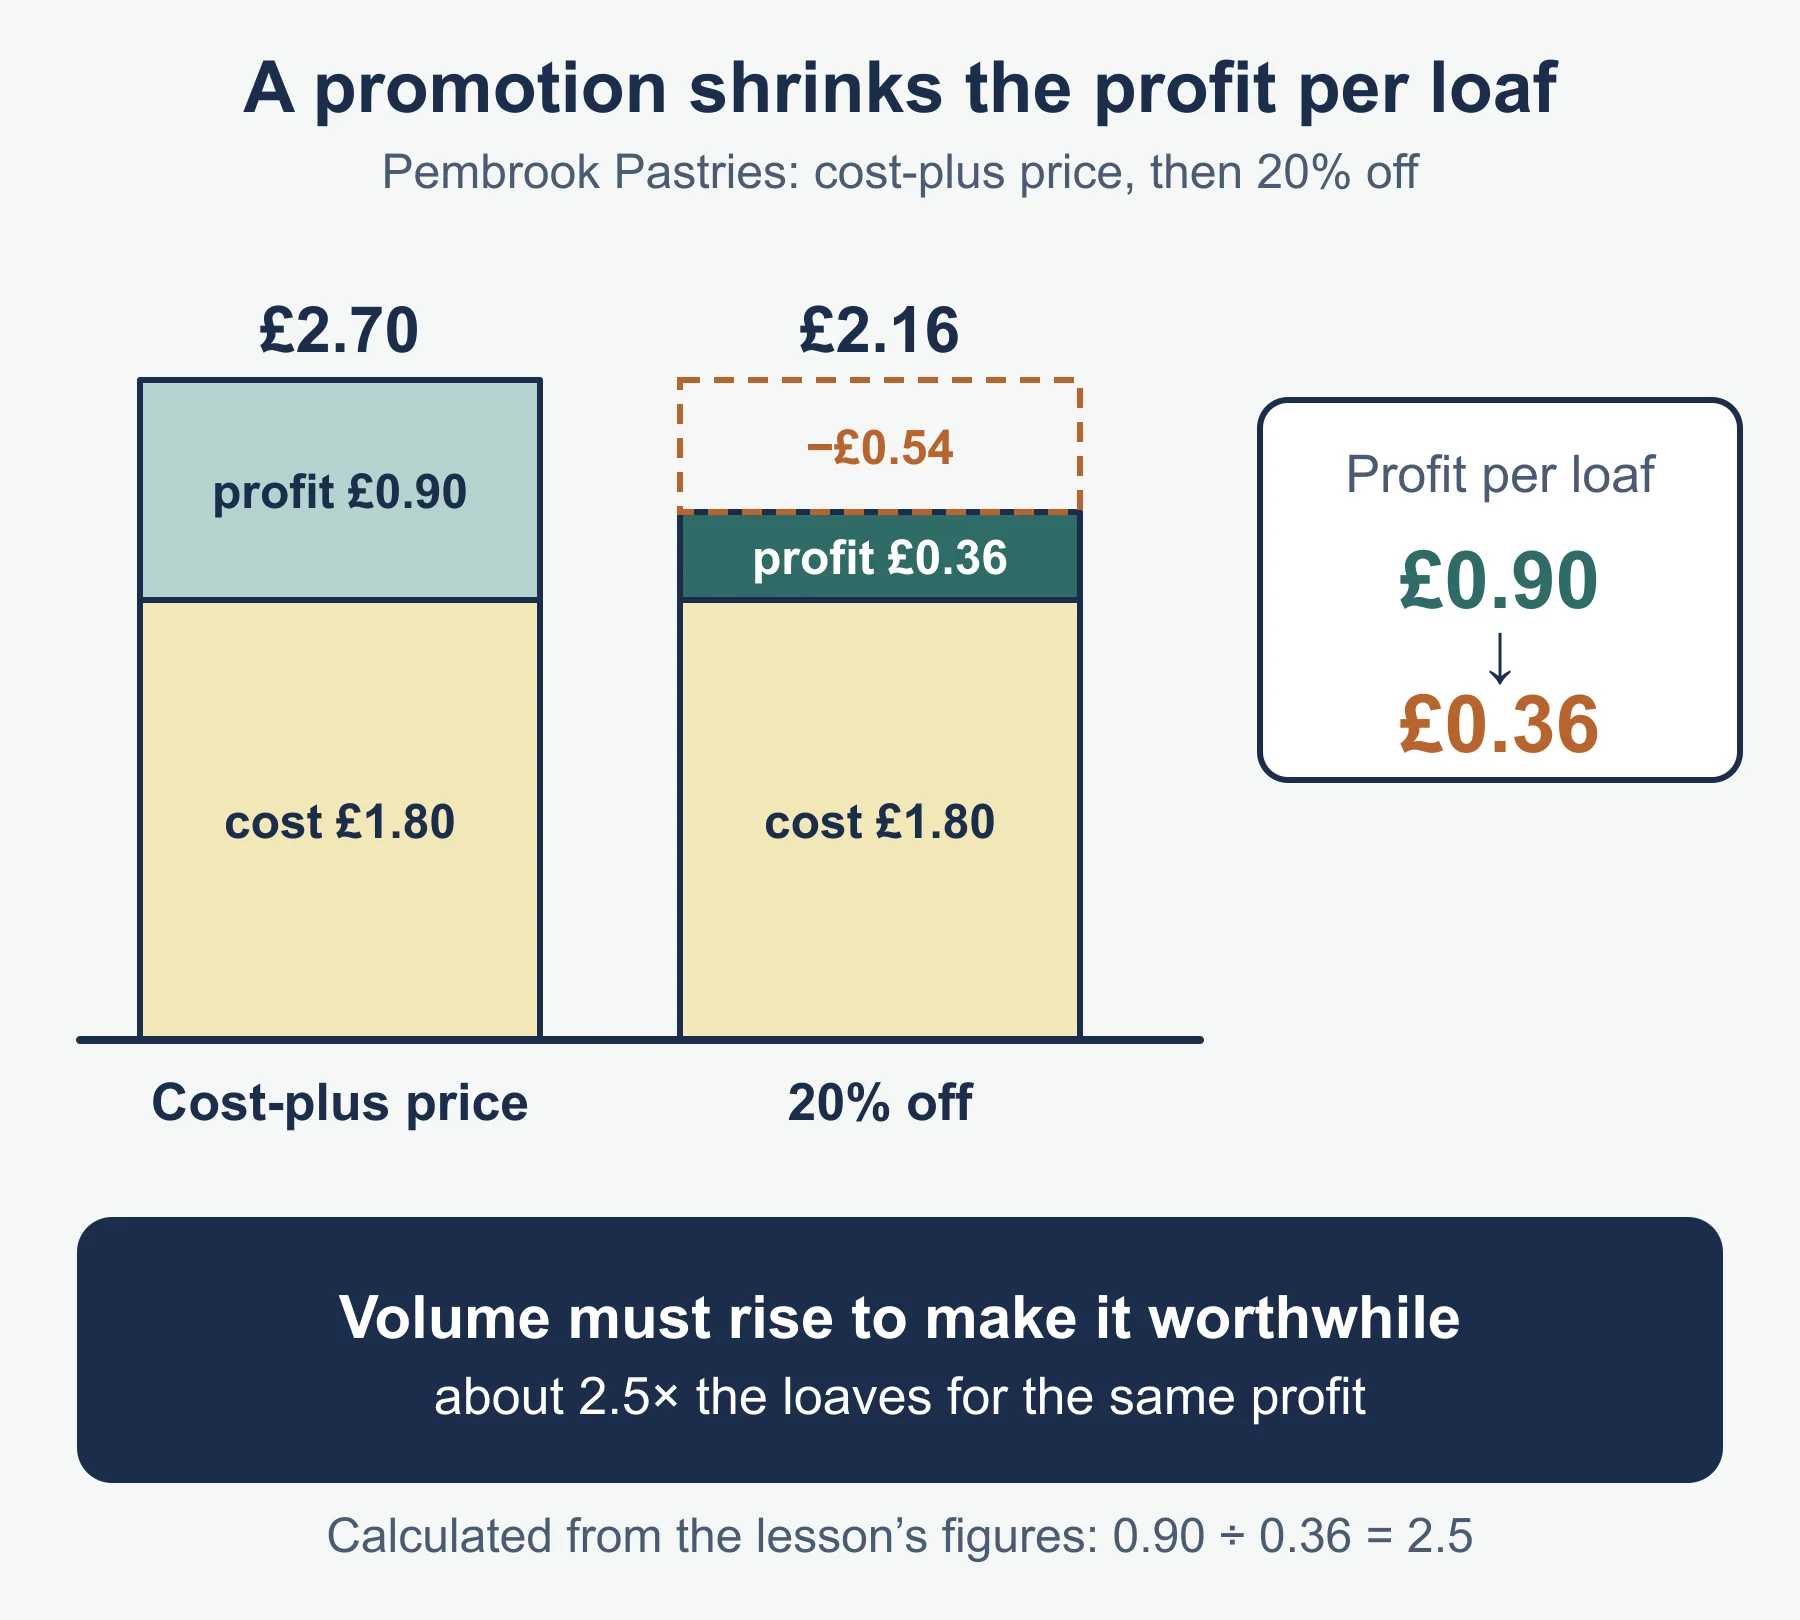
The specification does not give a cost-plus formula, so this is the standard form: selling price = unit cost + mark-up. Pembrook’s loaf costs £1.80 to make. With a 50% mark-up, 50% of £1.80 is £0.90, so the price is £2.70. In a promotion of 20% off, 20% of £2.70 is £0.54, giving £2.16. Pembrook still makes £0.36 on each loaf (£2.16 - £1.80), against £0.90 normally, so the promotion must raise volume to be worthwhile.
Promotion
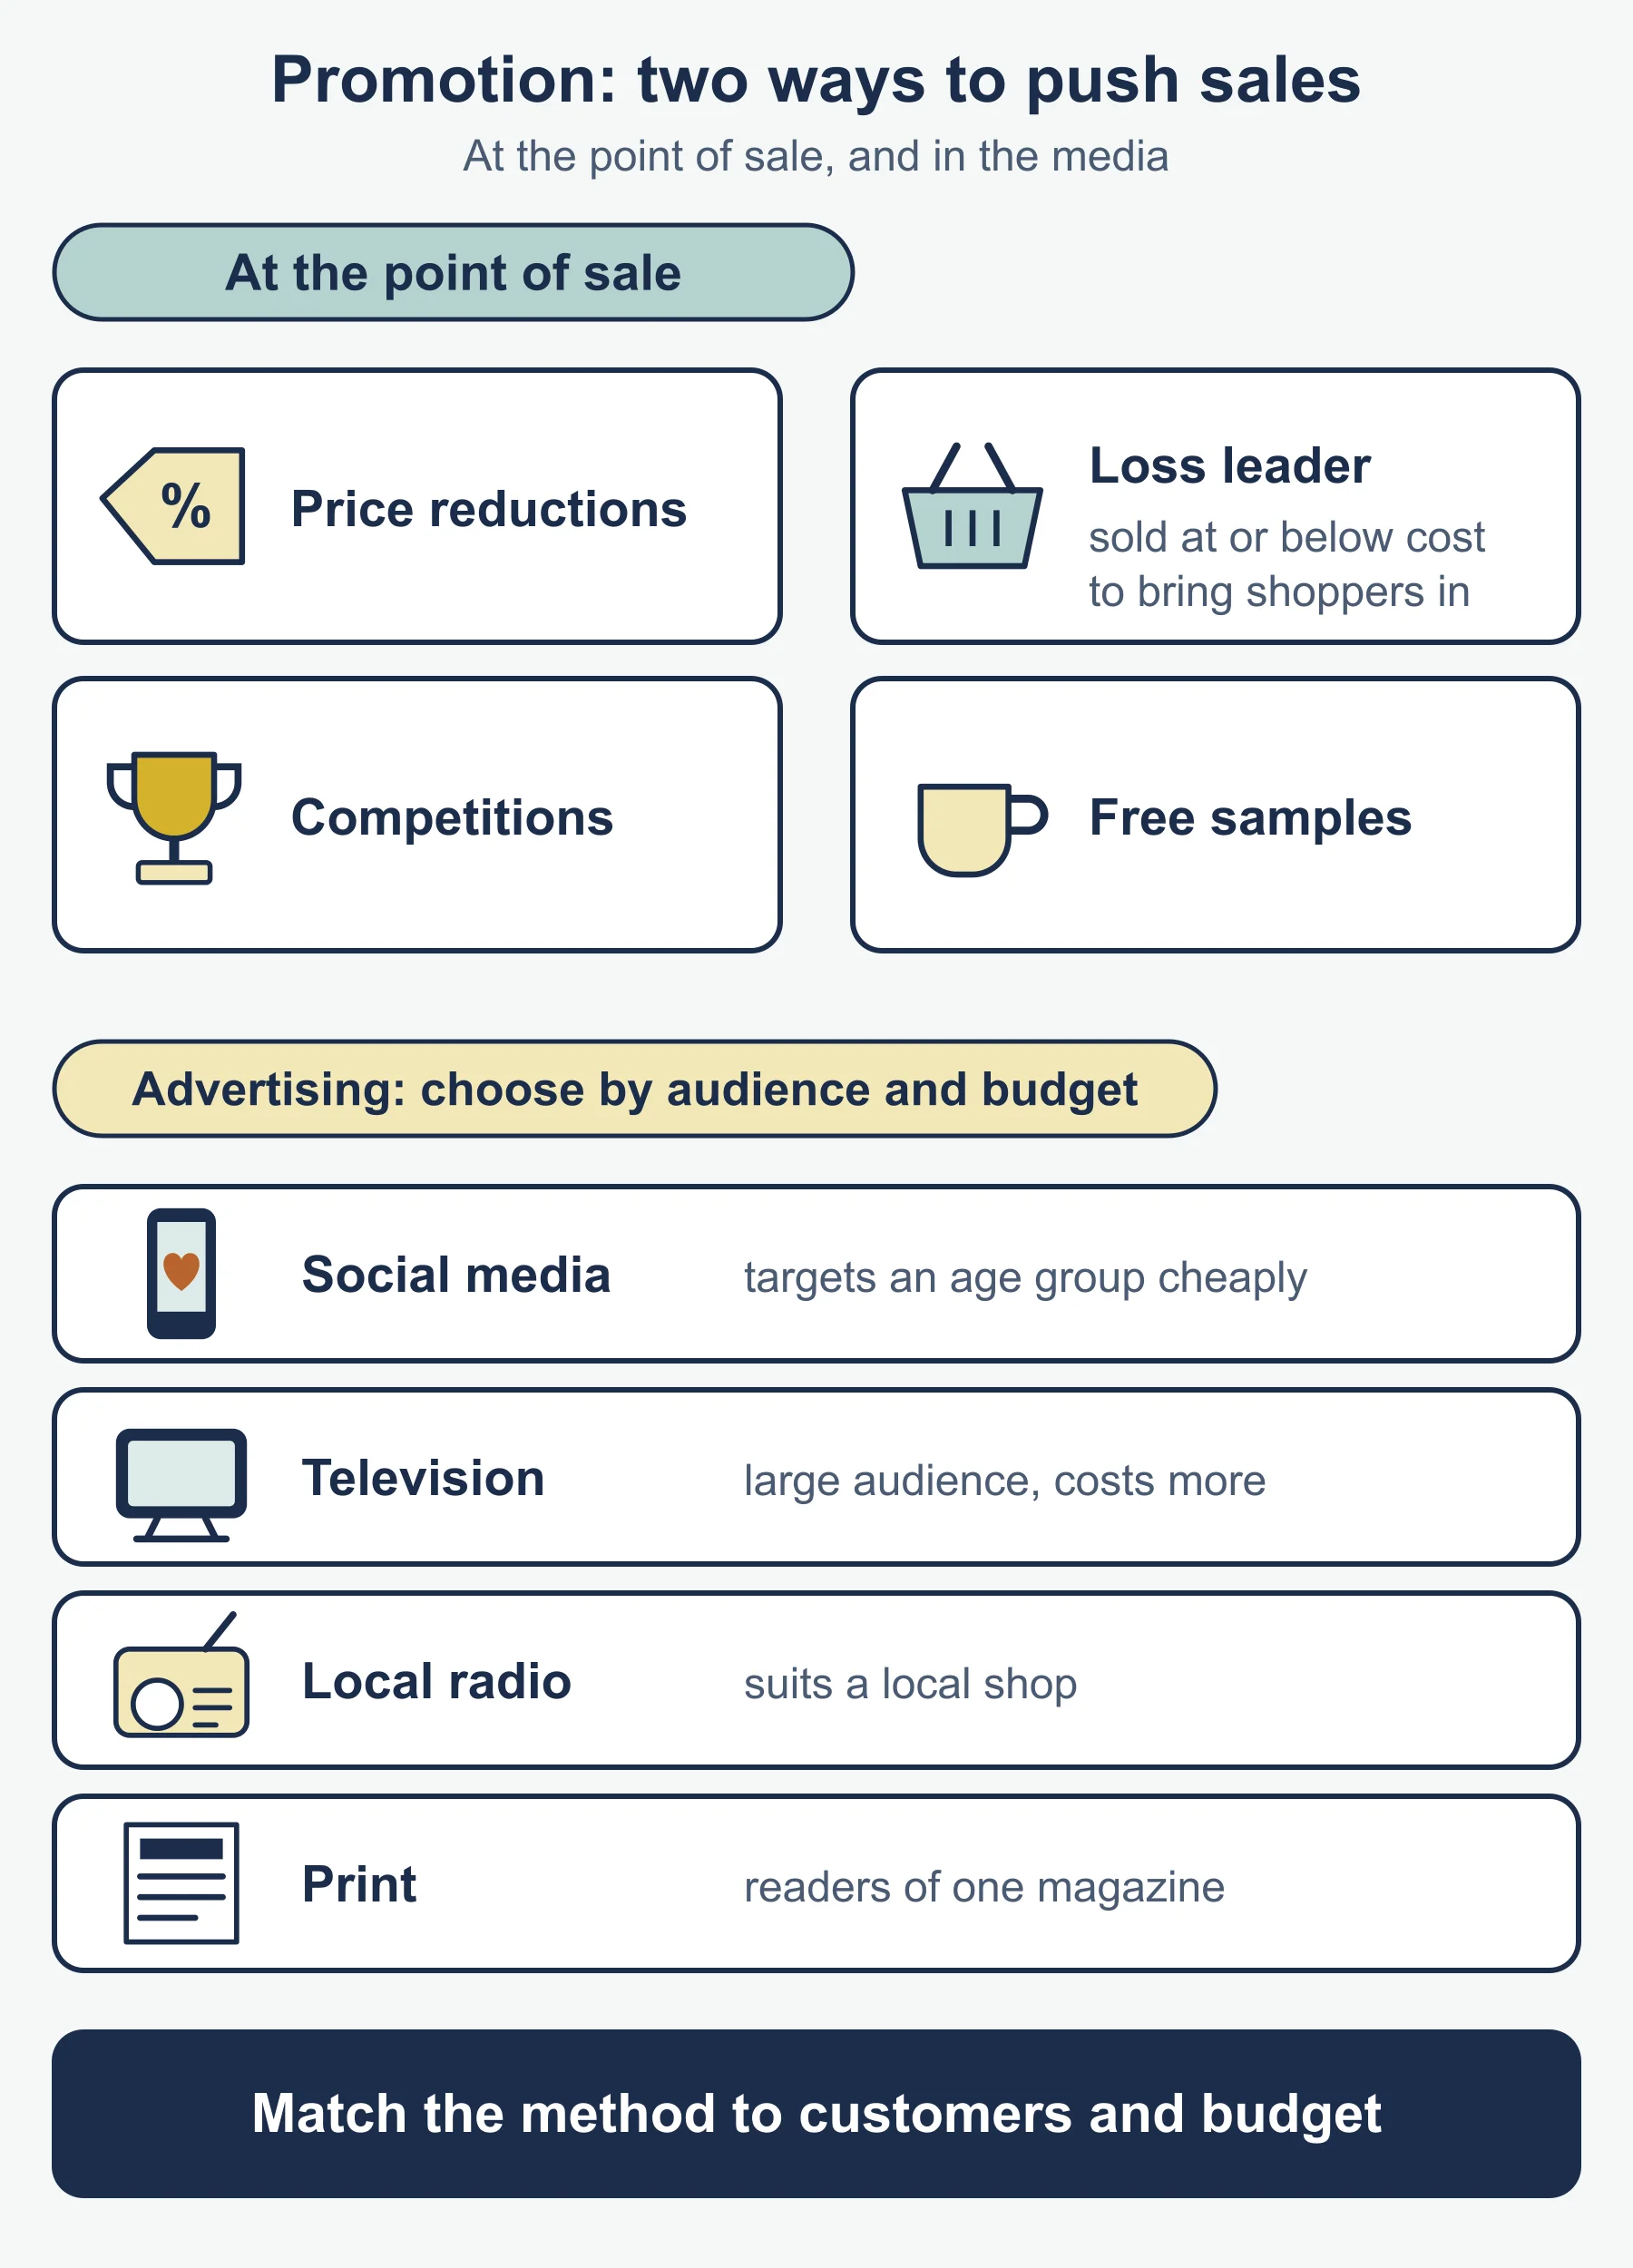
Point of sale methods work where the customer is about to buy:
- Price reductions
- Loss leaders: a product sold at or below cost to bring shoppers in, hoping they buy other items
- Competitions
- Free samples
Advertising uses media such as social media, websites, print media, television and radio. Choose by audience and budget. Social media can target an age group cheaply. Television reaches a large audience but costs more. Local radio suits a local shop. Print reaches readers of a particular magazine.
Place
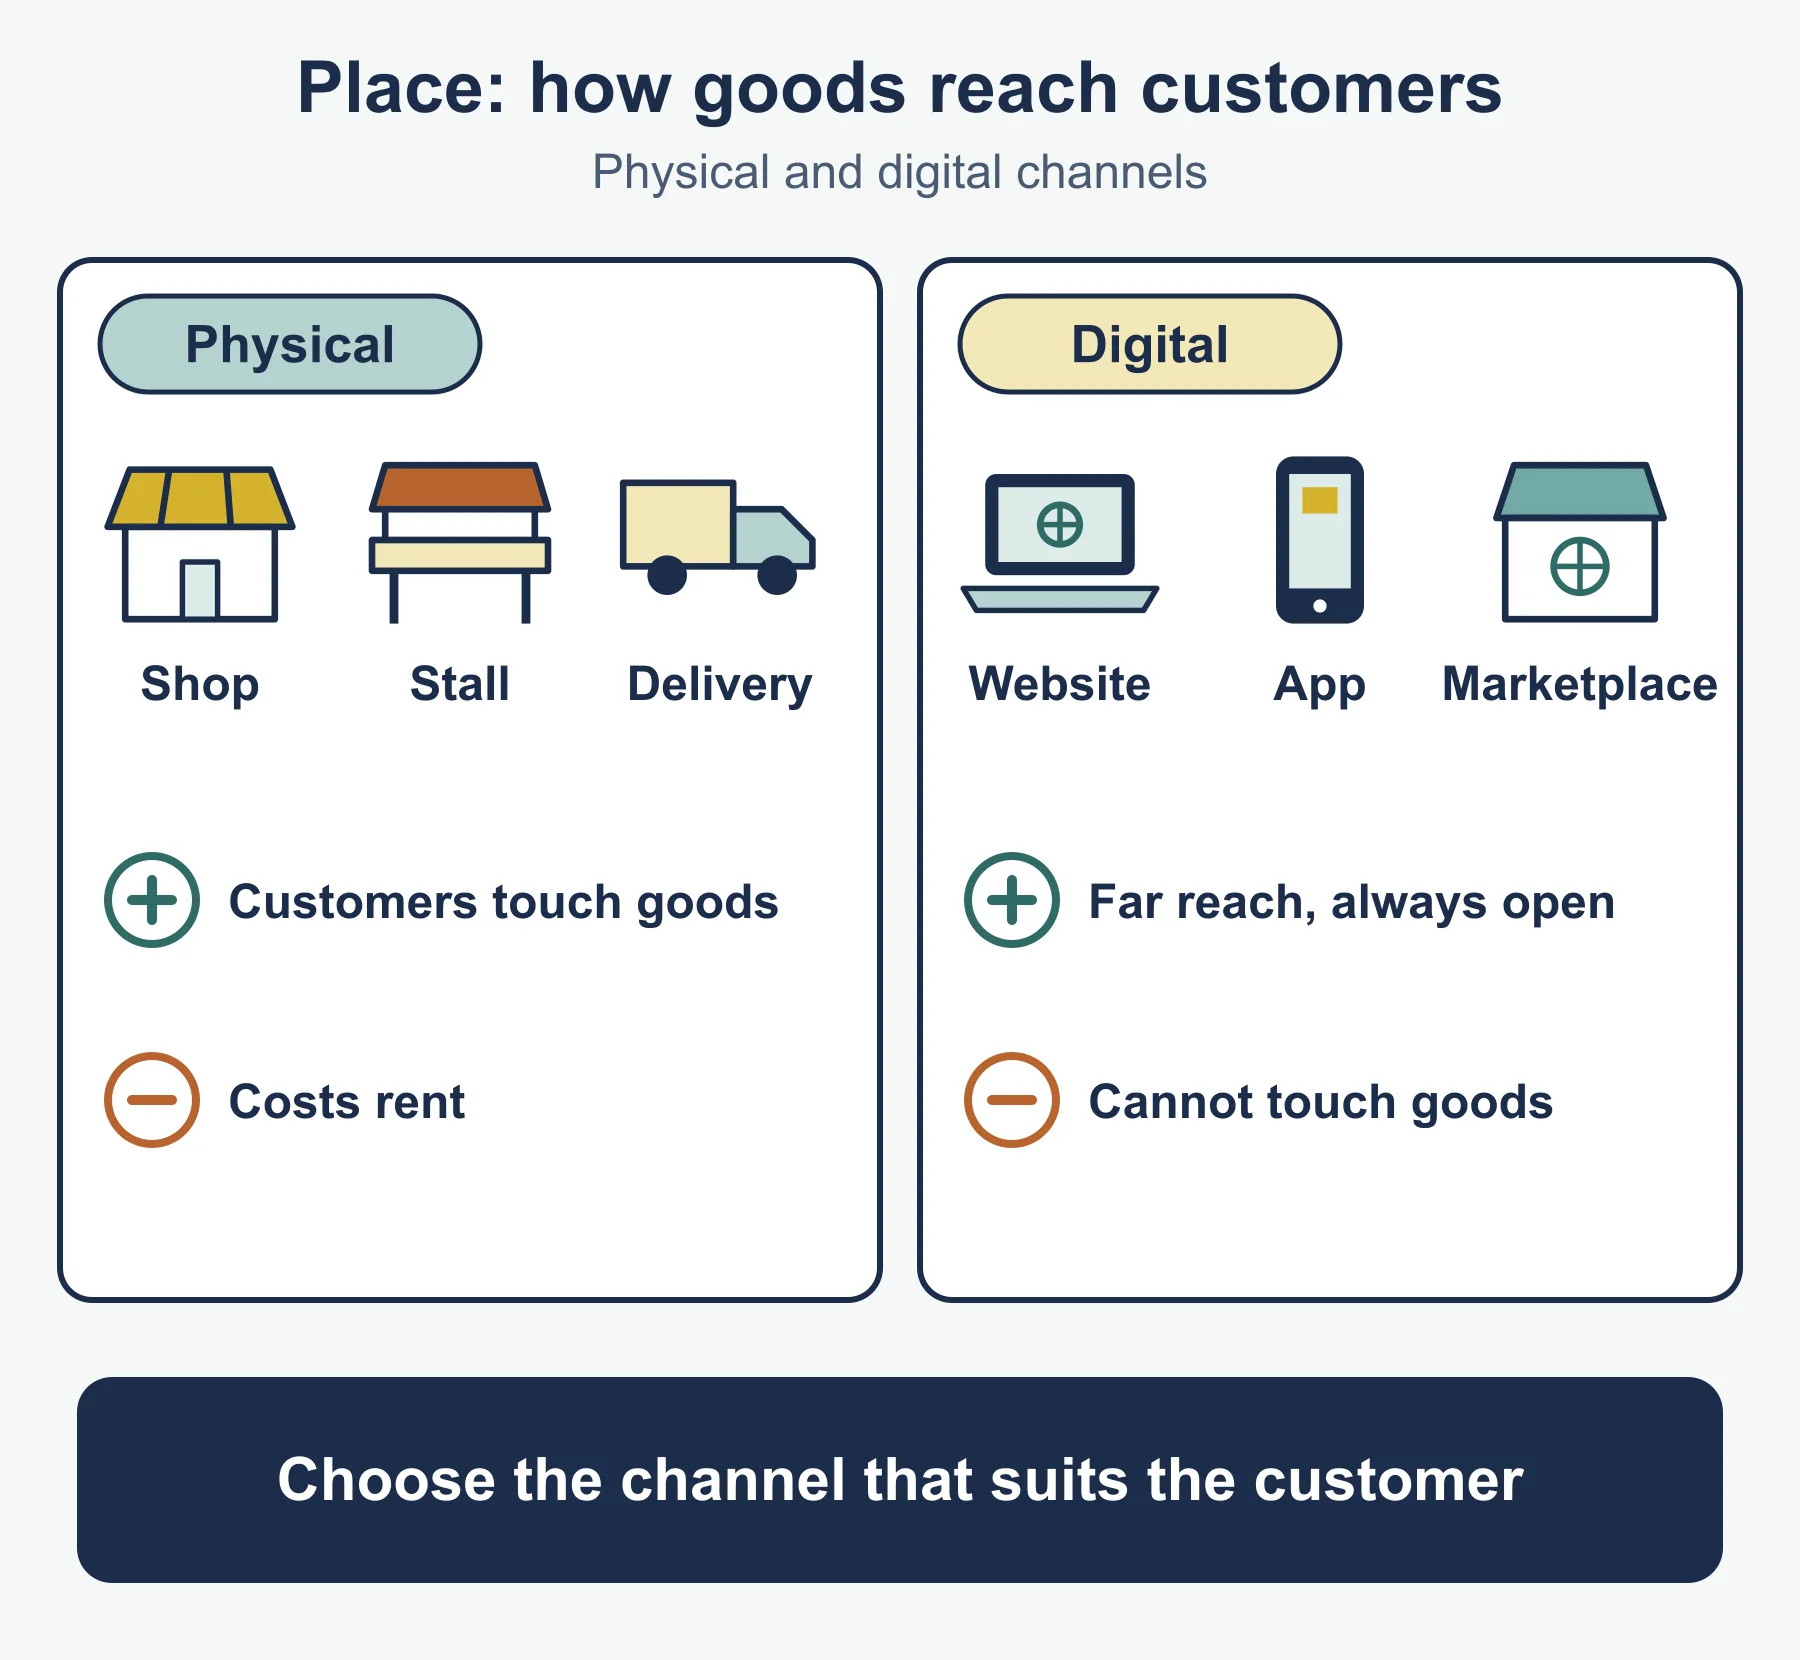
Place is how products and services reach customers through digital and physical distribution channels. A physical channel is a shop, market stall or delivery to a premises. A digital channel is the business’s own website, an app or an online marketplace. Digital channels reach customers far away and are open at all hours but customers cannot touch the goods; physical outlets allow that but cost rent.
How the four Ps work together
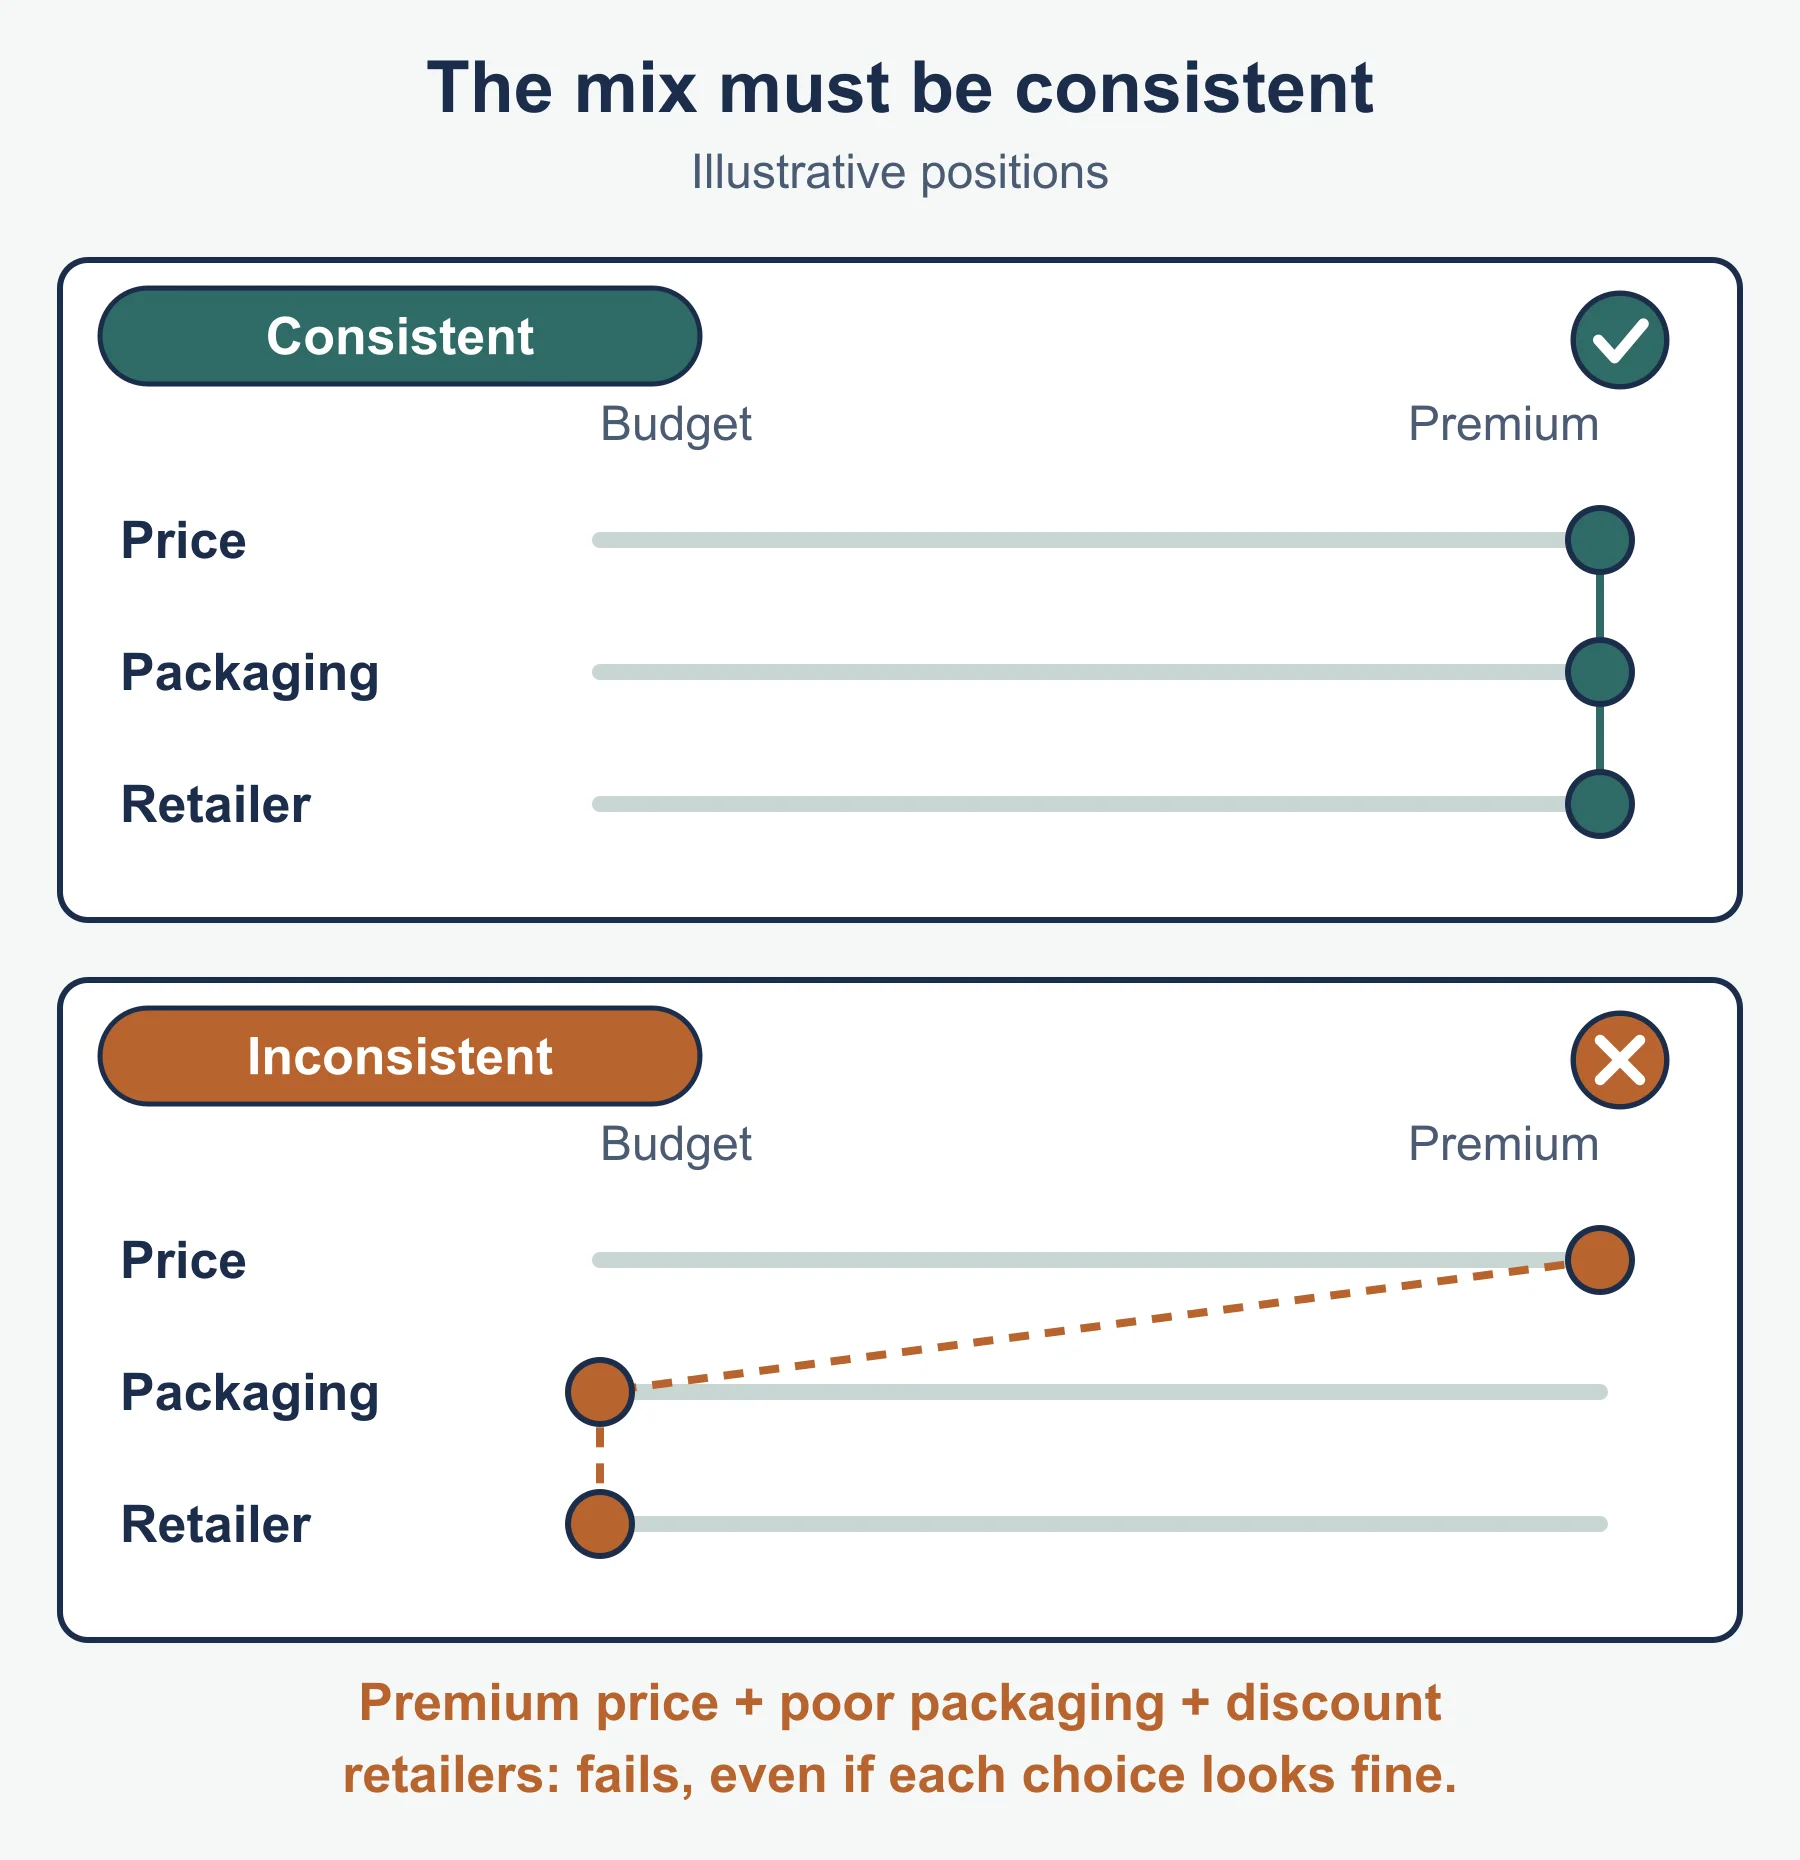
The four Ps must send one message. A luxury chocolate with a high price needs fine packaging, stylish promotion and sale through upmarket shops. Selling it in a pound shop undermines the price. When writing about a case, say what each P is, then whether they fit one another.
Using the mix to make decisions
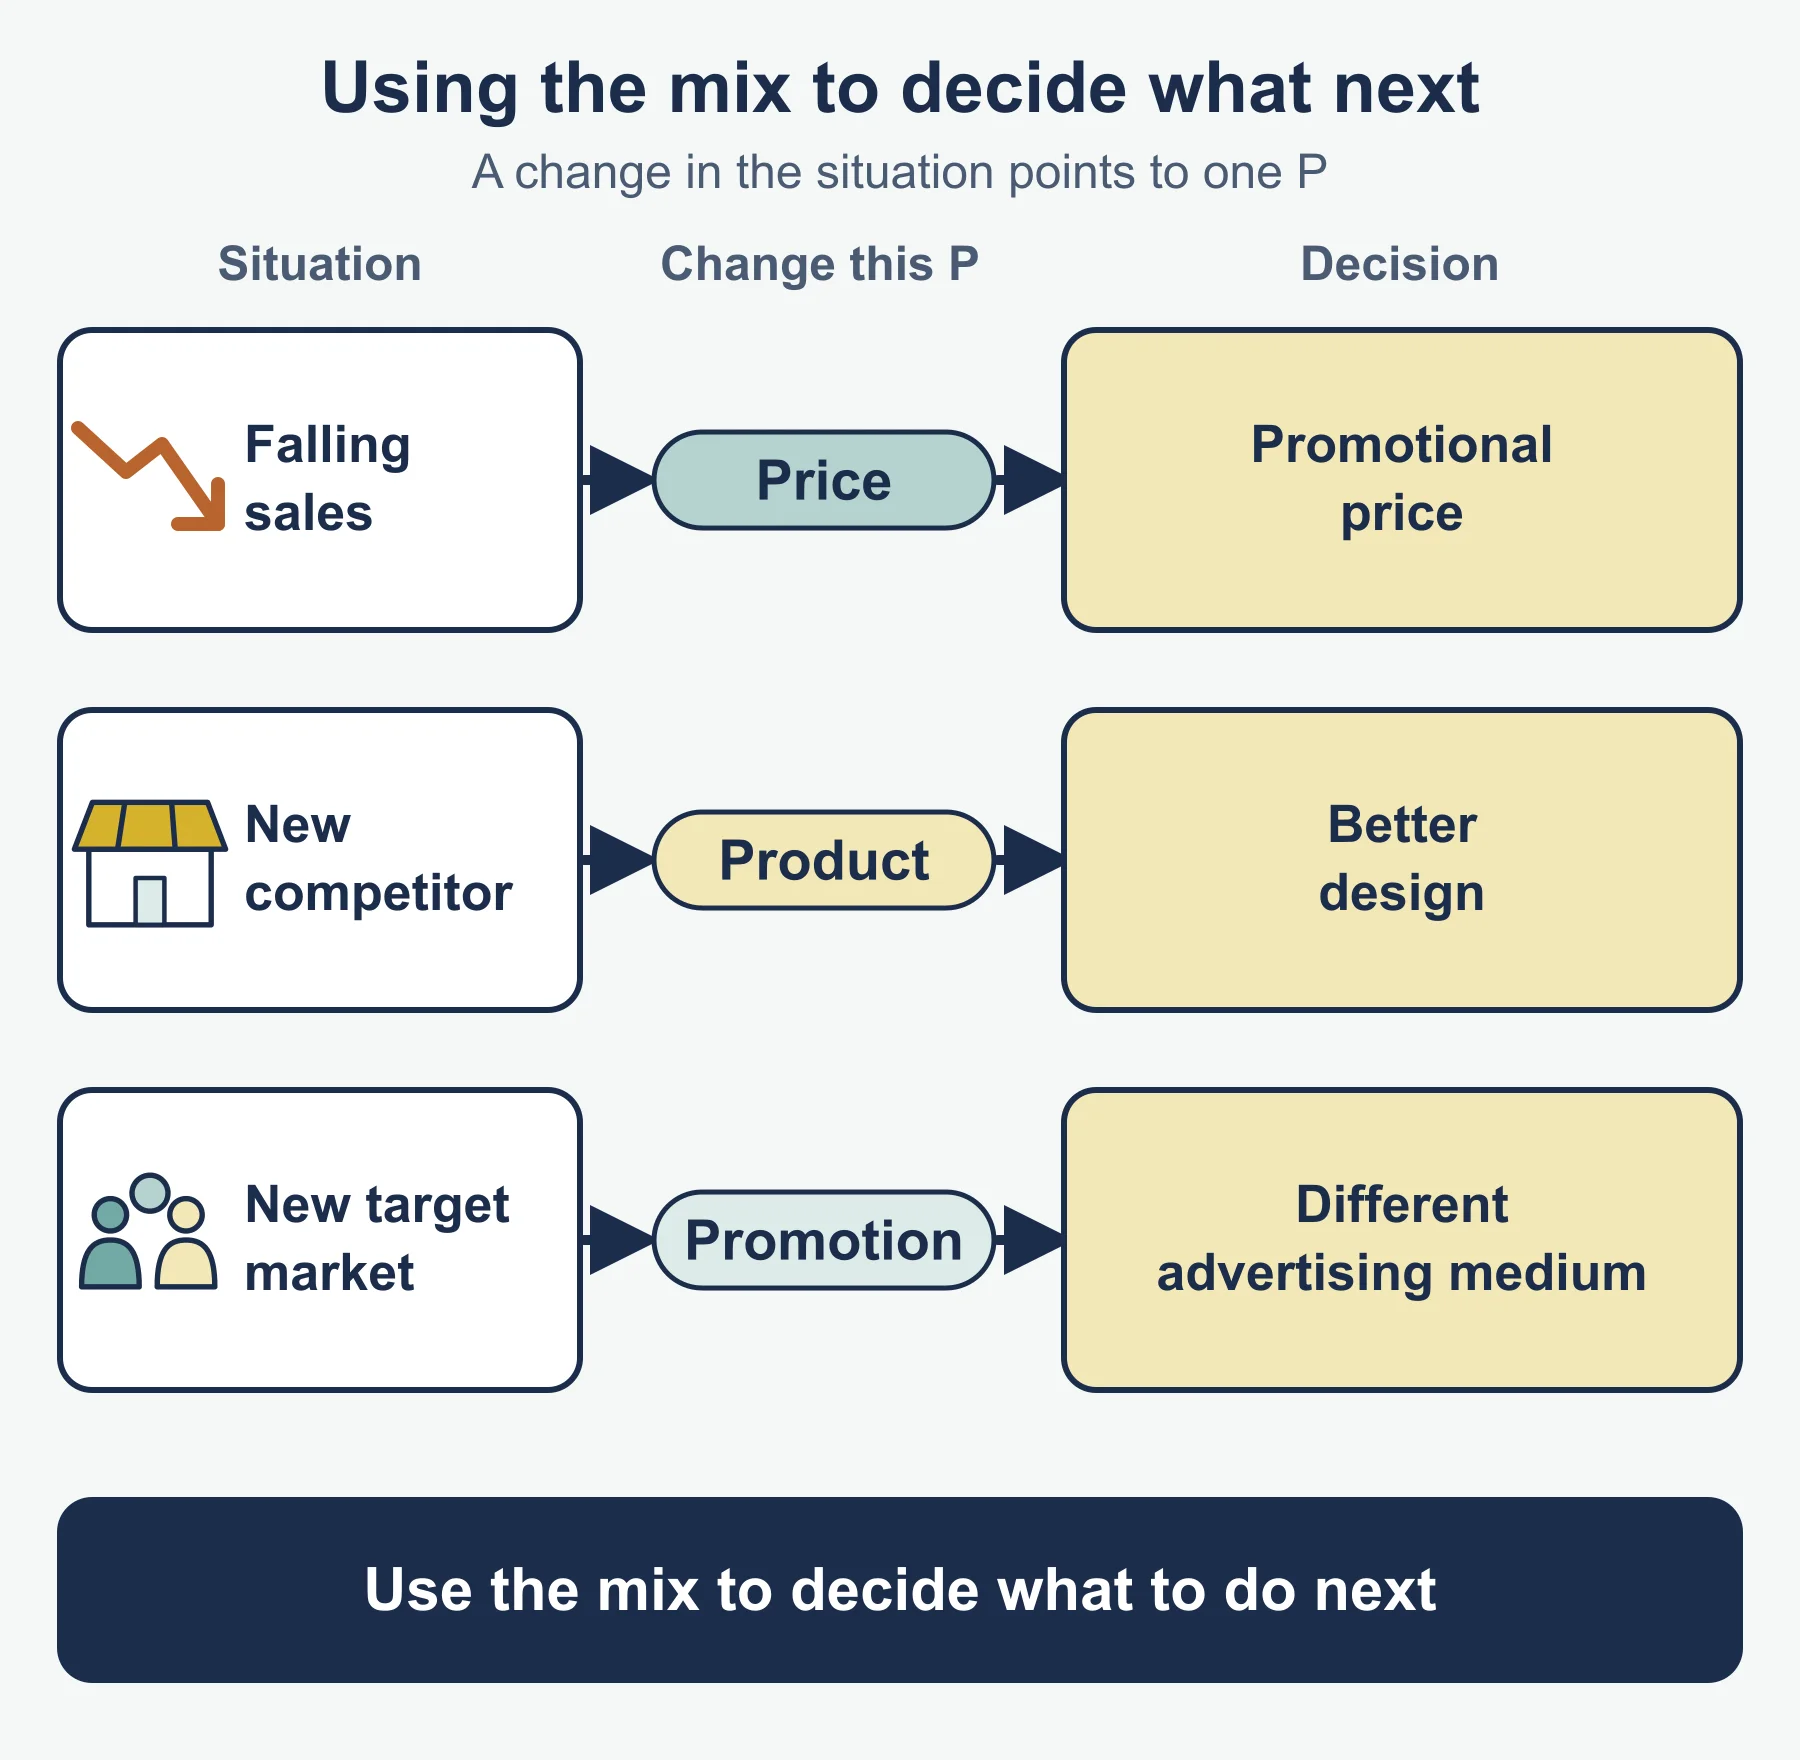
Managers use the mix to decide what to do next. Falling sales might lead to a promotional price. A new competitor might lead to a better design. A new target market might lead to a different advertising medium.
Interpreting market data
The specification points to changes in demand, target market and market share, changes in product and the effects of promotion.
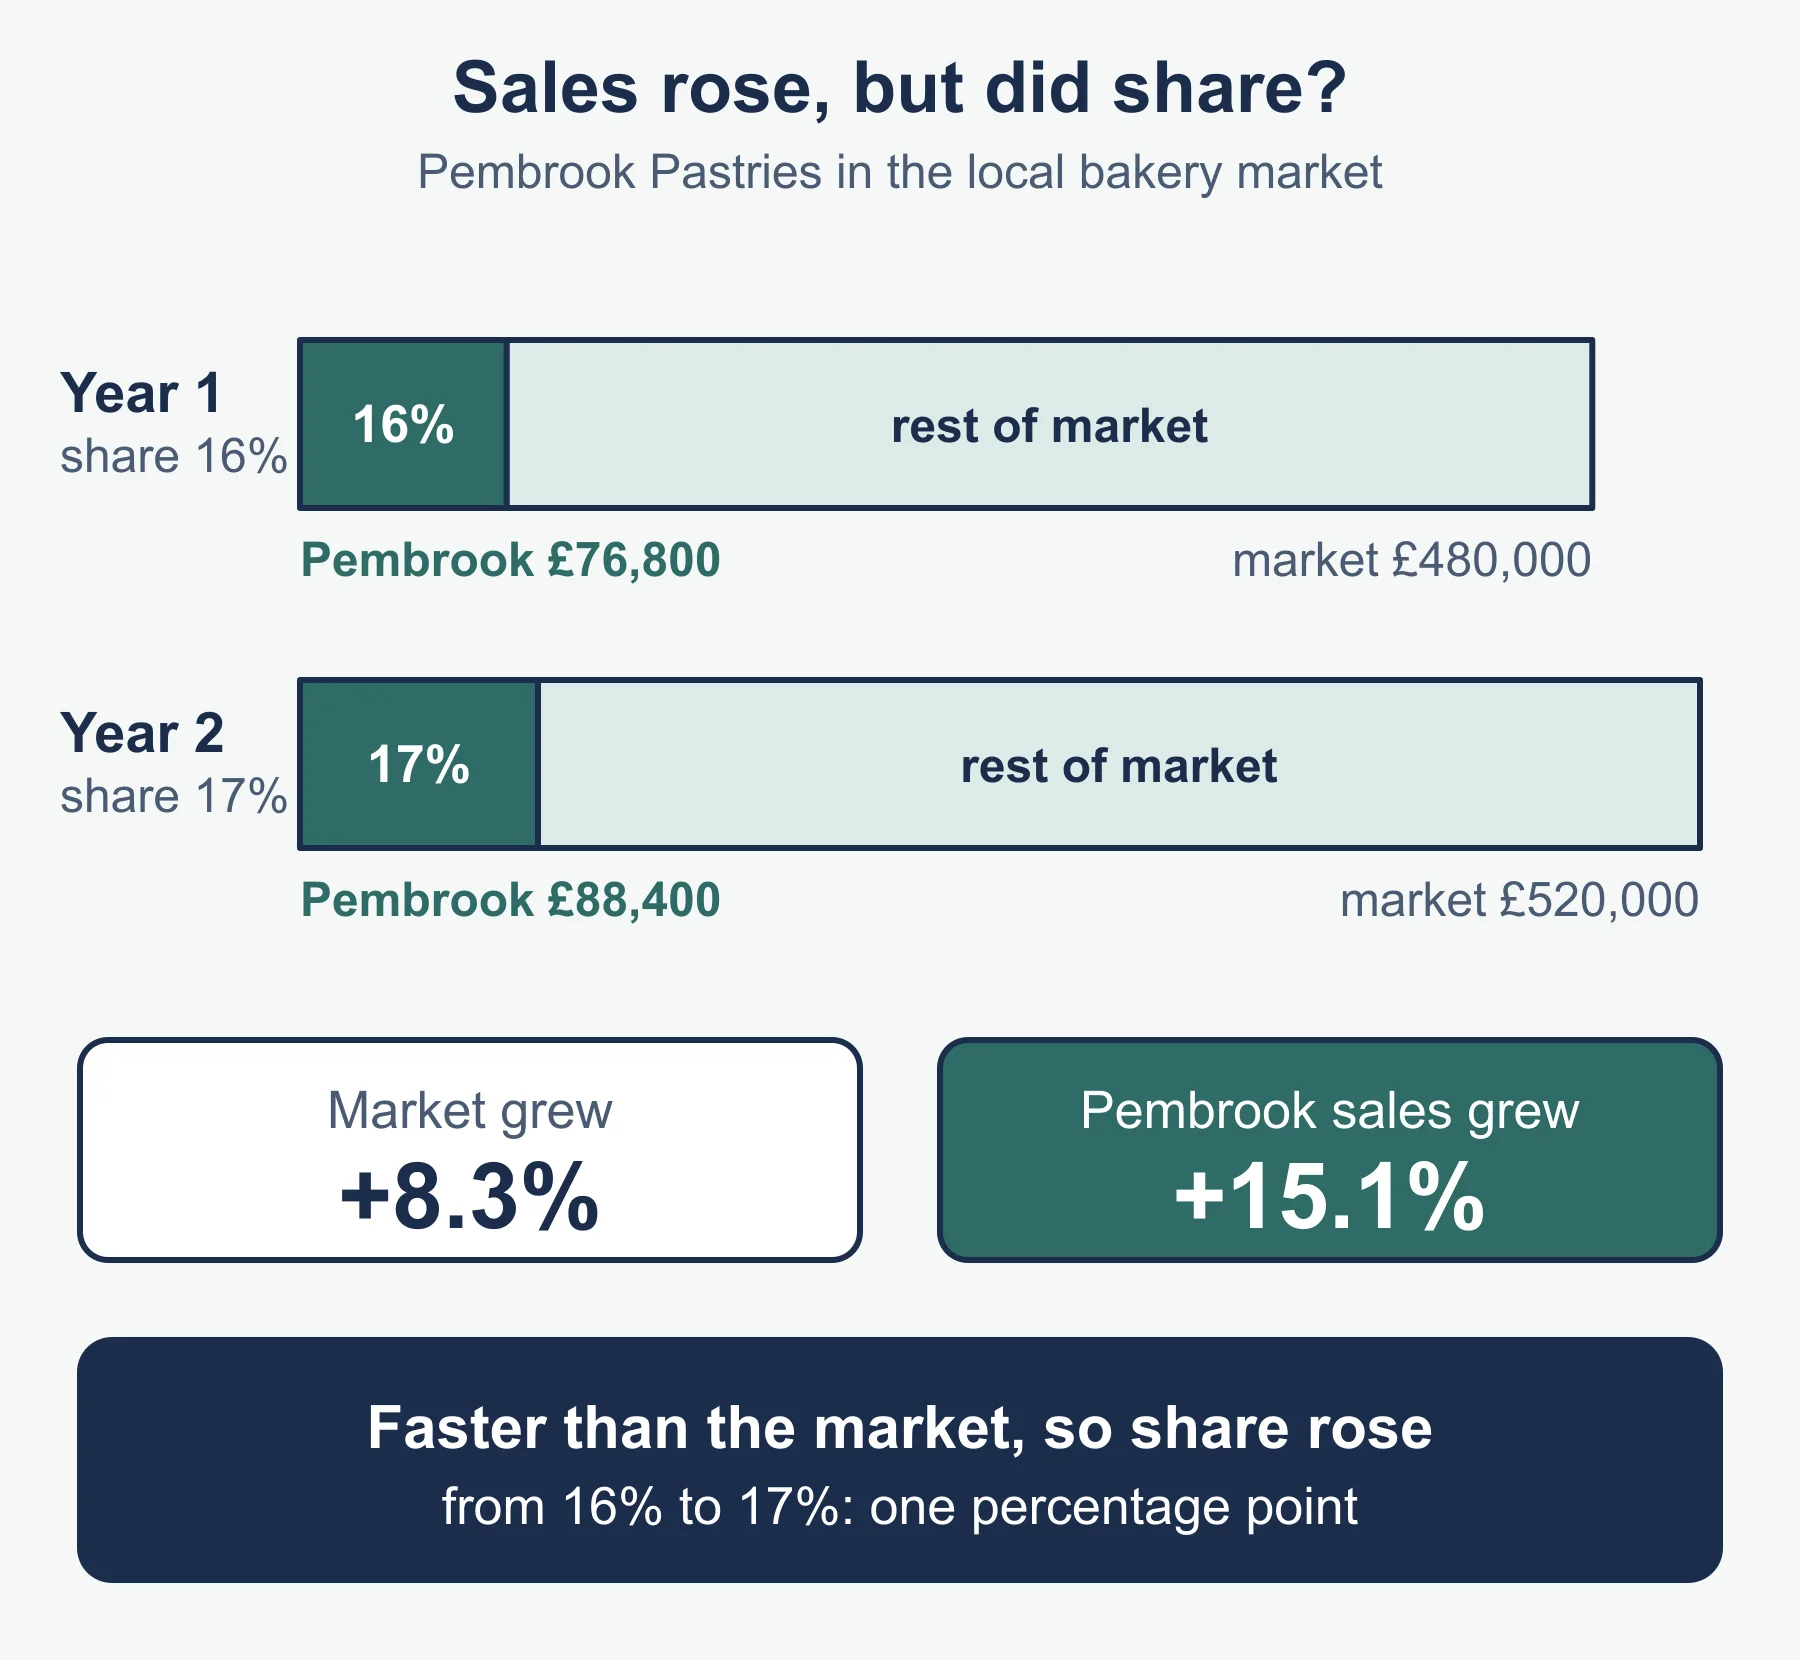
Market share = (business sales / total market sales) × 100. This is the standard form.
Worked example. The local bakery market was worth £480,000 in year 1 and £520,000 in year 2. Pembrook’s sales were £76,800 and £88,400.
- Share in year 1 = 76,800 / 480,000 × 100 = 16%.
- Share in year 2 = 88,400 / 520,000 × 100 = 17%.
- Change in Pembrook’s sales = (88,400 - 76,800) / 76,800 × 100 = 15.1%. The market grew 8.3%.
Pembrook grew faster than the market, so its share rose one percentage point. A fall in share while sales rise would mean rivals grew faster. If the year 2 rise followed a promotion, you can only say it is consistent with the promotion working. Other causes, such as a rival closing, could explain it.
Common errors
- Writing “questionnaire” without saying why it suits the purpose.
- Treating secondary data as worthless. It is cheaper and quicker, and often the right place to start.
- Mixing up invention and innovation.
- Calling a loss leader a permanent price. It is used to attract customers.
- Stating that sales rose without comparing them to the market. Share is the comparison.
- Describing a P in isolation, with no judgement about whether it suits the target market.
Frequently asked questions
What pricing methods do you need to know for OCR GCSE Business? The pricing methods are price skimming, penetration pricing, cost-plus pricing, competitor pricing and promotional pricing. Each suits a different situation, for example skimming suits a new, desirable product with few rivals.
What is a loss leader? A loss leader is a product sold at or below cost to bring shoppers in, in the hope that they buy other items at full price. It is one of the point of sale promotion methods.
What is market segmentation? Market segmentation divides a market into groups of customers who share characteristics, such as age, gender, income, location or lifestyle. It lets a business choose the product, price, promotion and place to suit each group.
What is the difference between invention and innovation? Invention is creating something new that did not exist before. Innovation is improving or changing an existing idea, such as adding a feature or using a new process, and is the more common route.
How do you calculate market share in OCR GCSE Business? Market share is the business’s sales divided by total market sales, multiplied by 100. In OCR GCSE Business (J204) you should then compare it with the growth of the market, because a firm’s sales can rise while its share falls.
Official syllabus
OCR GCSE (9-1) in Business (J204), Version 2.0, OCR, section 2: Marketing, topics 2.1 to 2.4, within Business 1: business activity, marketing and people.
Get free revision emails (optional)
Occasional emails with practice questions, worked explanations and links to free resources for the qualification and subjects you choose. No spam, and you can unsubscribe from any email. The free tools on this site never need an email.
Related resources
-
Practice questions
OCR GCSE Business: Marketing (J204) – Practice Questions
Original practice questions with worked answers on OCR GCSE Business section 2, Marketing: research, segmentation, the four Ps and market data.
Business · OCR · GCSE
Try questions -
Revision notes
OCR GCSE Business: Marketing (J204) – Revision Notes
Condensed revision notes for OCR GCSE Business section 2, Marketing: research, segmentation, the four Ps, formulas, a self-test and common errors.
Business · OCR · GCSE
Revise topic -
Study guides
OCR GCSE Business: People (J204)
A full study guide to section 3 People in OCR GCSE (9-1) Business J204: structures, communication, recruitment, motivation, training and employment law.
Business · OCR · GCSE
Read guide
Related articles
-
teaching
A Level tuition in Dubai: Cambridge or Pearson Edexcel International A Level?
Schools in Dubai and Abu Dhabi teach either Cambridge International AS & A Level or Pearson Edexcel International A Level. How the two are structured, why it matters for tuition, and how online classes from Lahore work.
9 October 2026
-
curriculum guides
Choosing subjects at IGCSE and A Level
How subject choices at 14 and 16 affect university options later, and how to keep pathways open without overloading a timetable.
28 July 2026
Studying this with a teacher
Working through Business GCSE?
This page is free and stays free. If you would rather be taught it, Marlbridge runs Business classes one-to-one, online in your own time zone. One-to-one only for this course: Rs 6,000 per class in Pakistan, with other currencies on the fees page. The first trial class is free. WhatsApp replies within an hour (8am–11pm Pakistan time, every day); email the same day.
OCR Business teachers at Marlbridge
