
Study Guides
AQA A-Level Business: Analysing the strategic position of a business (7132)
Study guide to AQA A-Level Business 7132 topic 7: mission and strategy, ratios, performance, external change, Porter and investment appraisal.
- Subject
- Business
- Level
- A LEVELS
- Topic
- Analysing the strategic position of a business
- Author
- Marlbridge Academic Team
- Updated
- Reviewed by
- Salman Ahmad (what this means)
Aligned to AQA A Level Business (7132), For first teaching from September 2023. Official specification .
Syllabus page (what it covers and how it is assessed): AQA A Level Business.
Syllabus points this page covers
7132
- 7 Analysing the strategic position of a business (whole topic)
Found an error? Report a correction.
Need help with this topic? Request a free trial class for A Level Business (7132).
This guide covers the whole of topic 3.7, Analysing the strategic position of a business, in the AQA AS and A-level Business specification (7131 and 7132). The topic is A-level only. Every content point in its eight sections is covered, the external-environment sections most briefly.
Use it with the revision notes and the practice questions. Background: external environment and stakeholders. Course hub: AQA A-level Business. Checklist: printable checklist. Try a free diagnostic.
Map of the topic
| Section | Title |
|---|---|
| 3.7.1 | Mission, corporate objectives and strategy |
| 3.7.2 | Internal position: financial ratio analysis |
| 3.7.3 | Internal position: overall performance |
| 3.7.4 | External: political and legal change |
| 3.7.5 | External: economic change |
| 3.7.6 | External: social and technological |
| 3.7.7 | External: the competitive environment |
| 3.7.8 | Strategic options: investment appraisal |
3.7.1 Mission, corporate objectives and strategy
The mission is the broad purpose of the business: why it exists and what it stands for. Corporate objectives are measurable goals for the whole business, such as a growth target. Strategy is the long-term plan for achieving them. Tactics are short-term actions that put it into effect, such as a seasonal promotion.
Influences on the mission include owners’ values, stakeholders, the market served and the business’s history.
Influences on corporate objectives and decisions can be internal or external:
- Pressure for short termism, such as shareholders expecting quick results, which can push out long-term projects.
- Business ownership: owners free of outside shareholder pressure can plan further ahead, and a social enterprise may put social aims first.
- The internal environment: resources, skills, finance, culture.
- The external environment: competition, the economy, law and technology.
The links. The mission sets direction, corporate objectives turn it into targets, strategy chooses how to reach them and tactics carry it out. A strategy that does not fit the mission weakens the chain.
Impact on functional decisions. A strategy of exporting means marketing targets overseas segments, operations expands capacity and finance raises funds.
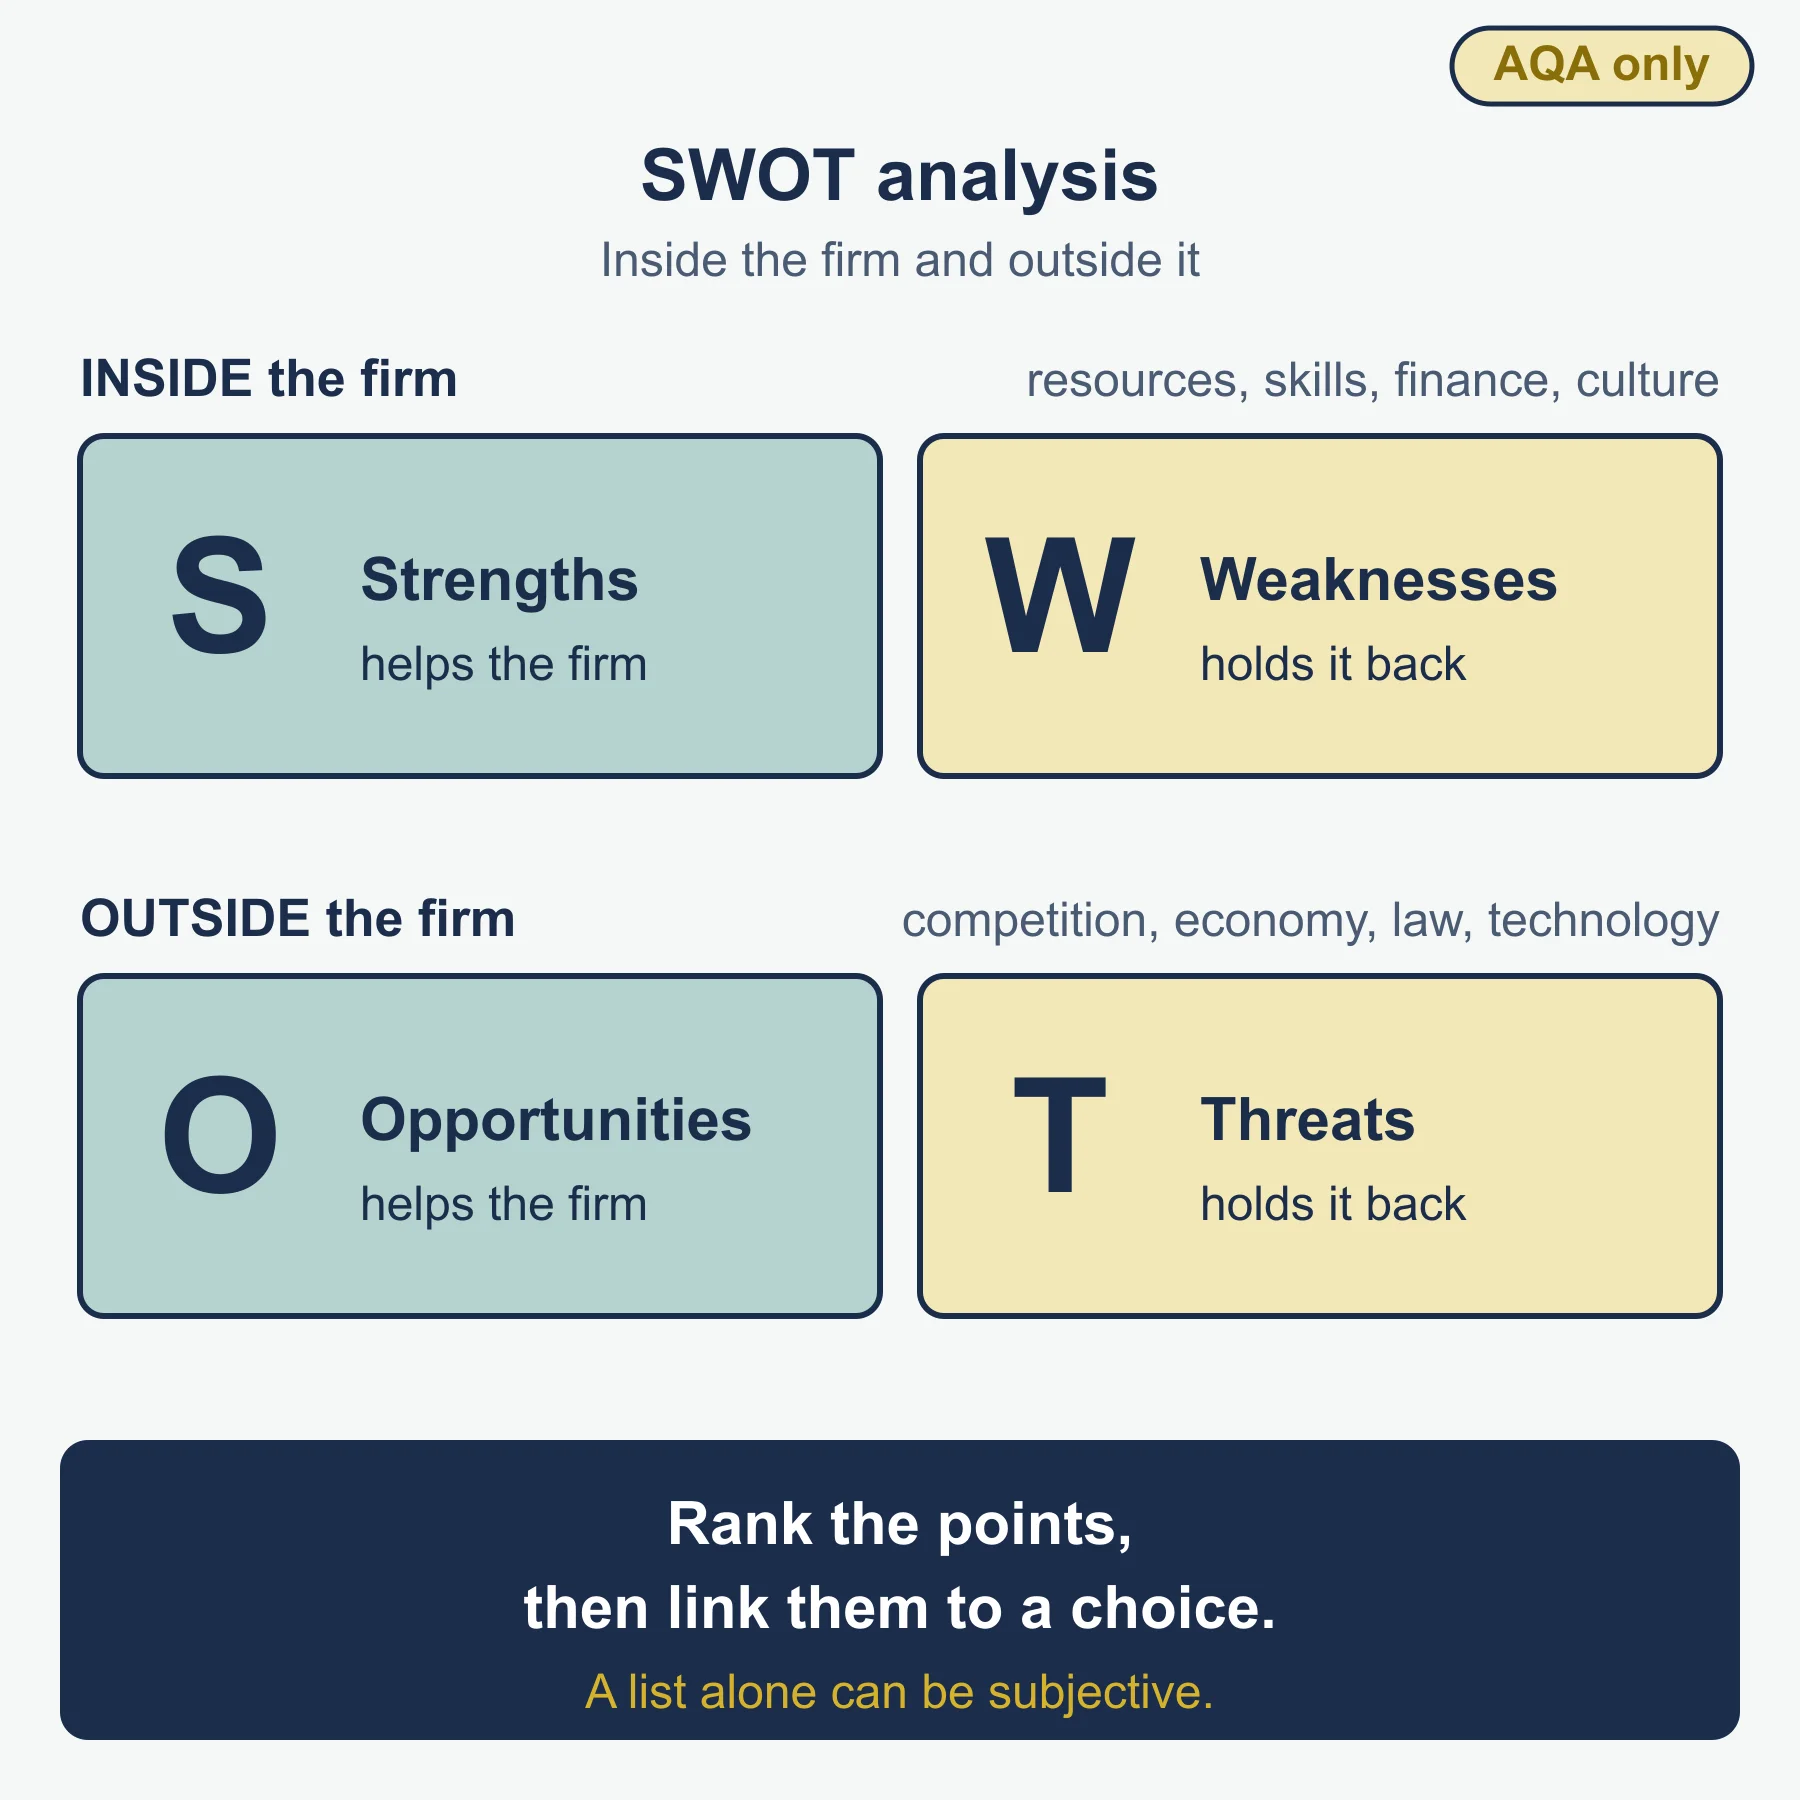
SWOT analysis lists internal strengths and weaknesses and external opportunities and threats. Its value is that it is quick and organises evidence. Its limits: it is only a list, can be subjective and dates quickly. Rank the points and link them to a choice.
3.7.2 Financial ratio analysis
You assess performance from the balance sheet (assets, liabilities and equity at one date) and the income statement (revenue, costs and profit over a period). The specification names six ratios but gives no formulas, so the standard forms are used here.
| Ratio | Standard form | Measures |
|---|---|---|
| ROCE | operating profit / capital employed x 100 | Profitability |
| Current ratio | current assets : current liabilities | Liquidity |
| Gearing | non-current liabilities / capital employed x 100 | Financial risk |
| Receivables days | receivables / revenue x 365 | Speed of collecting from customers |
| Payables days | payables / cost of sales x 365 | Time taken to pay suppliers |
| Inventory turnover | cost of sales / inventories (times a year) | How fast stock sells |
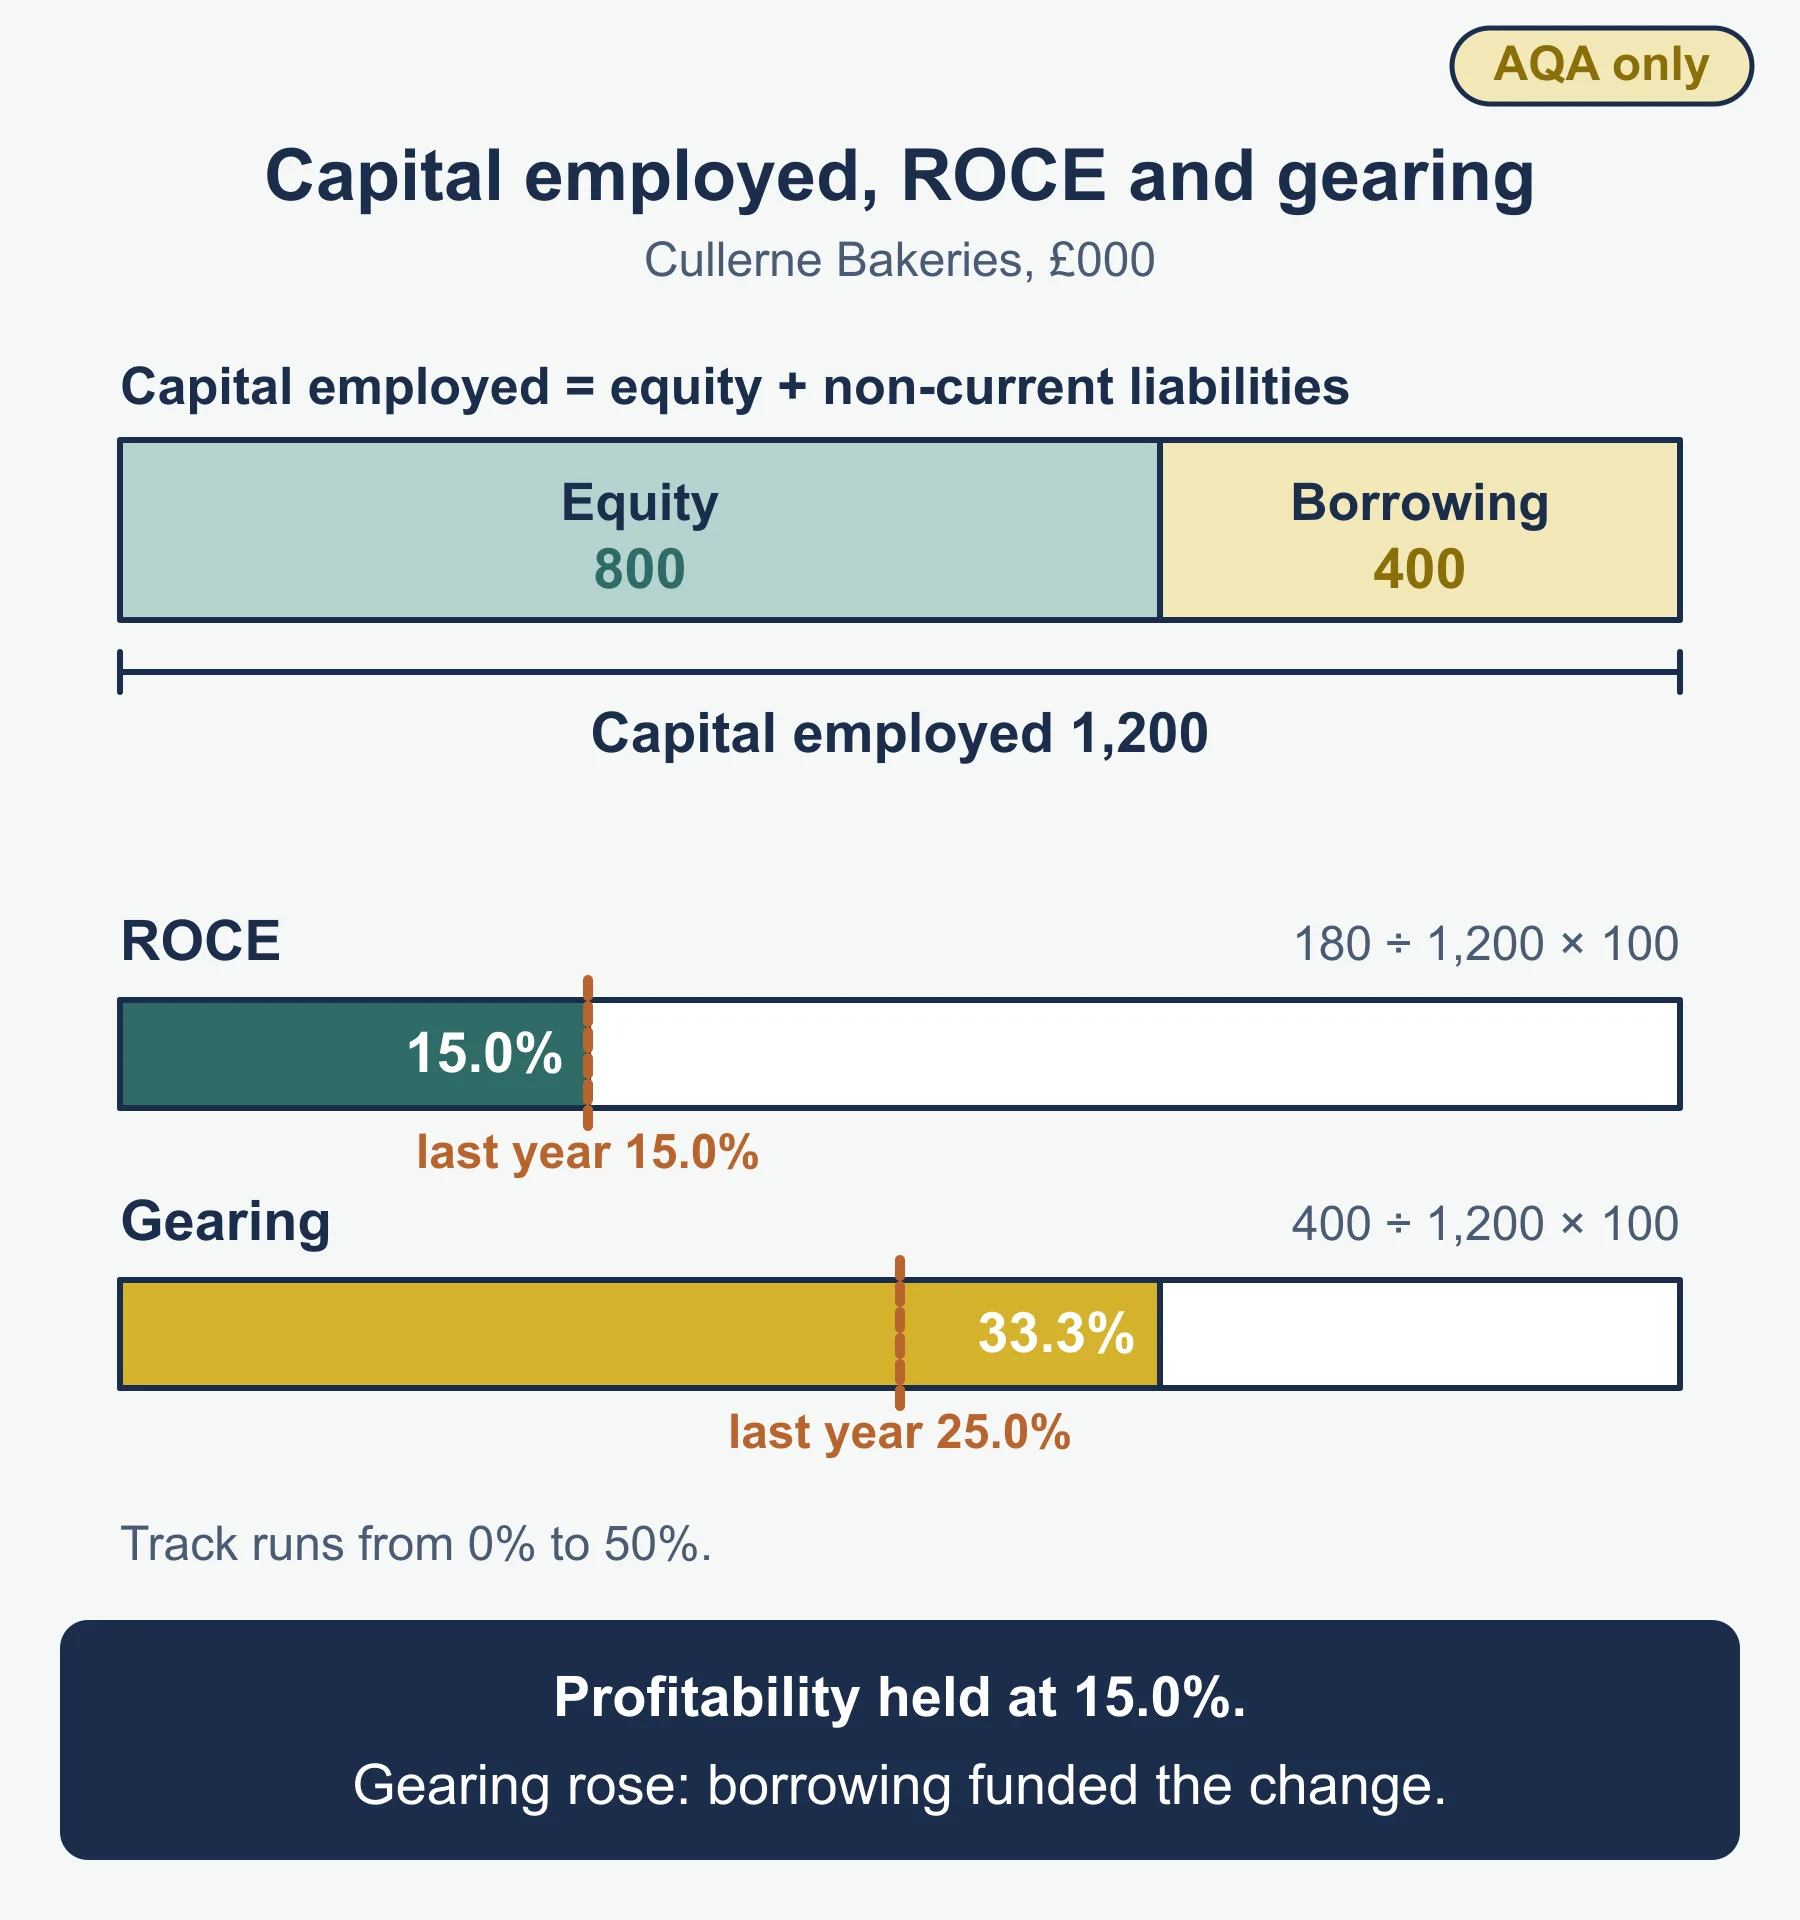
Capital employed is total equity plus non-current liabilities.
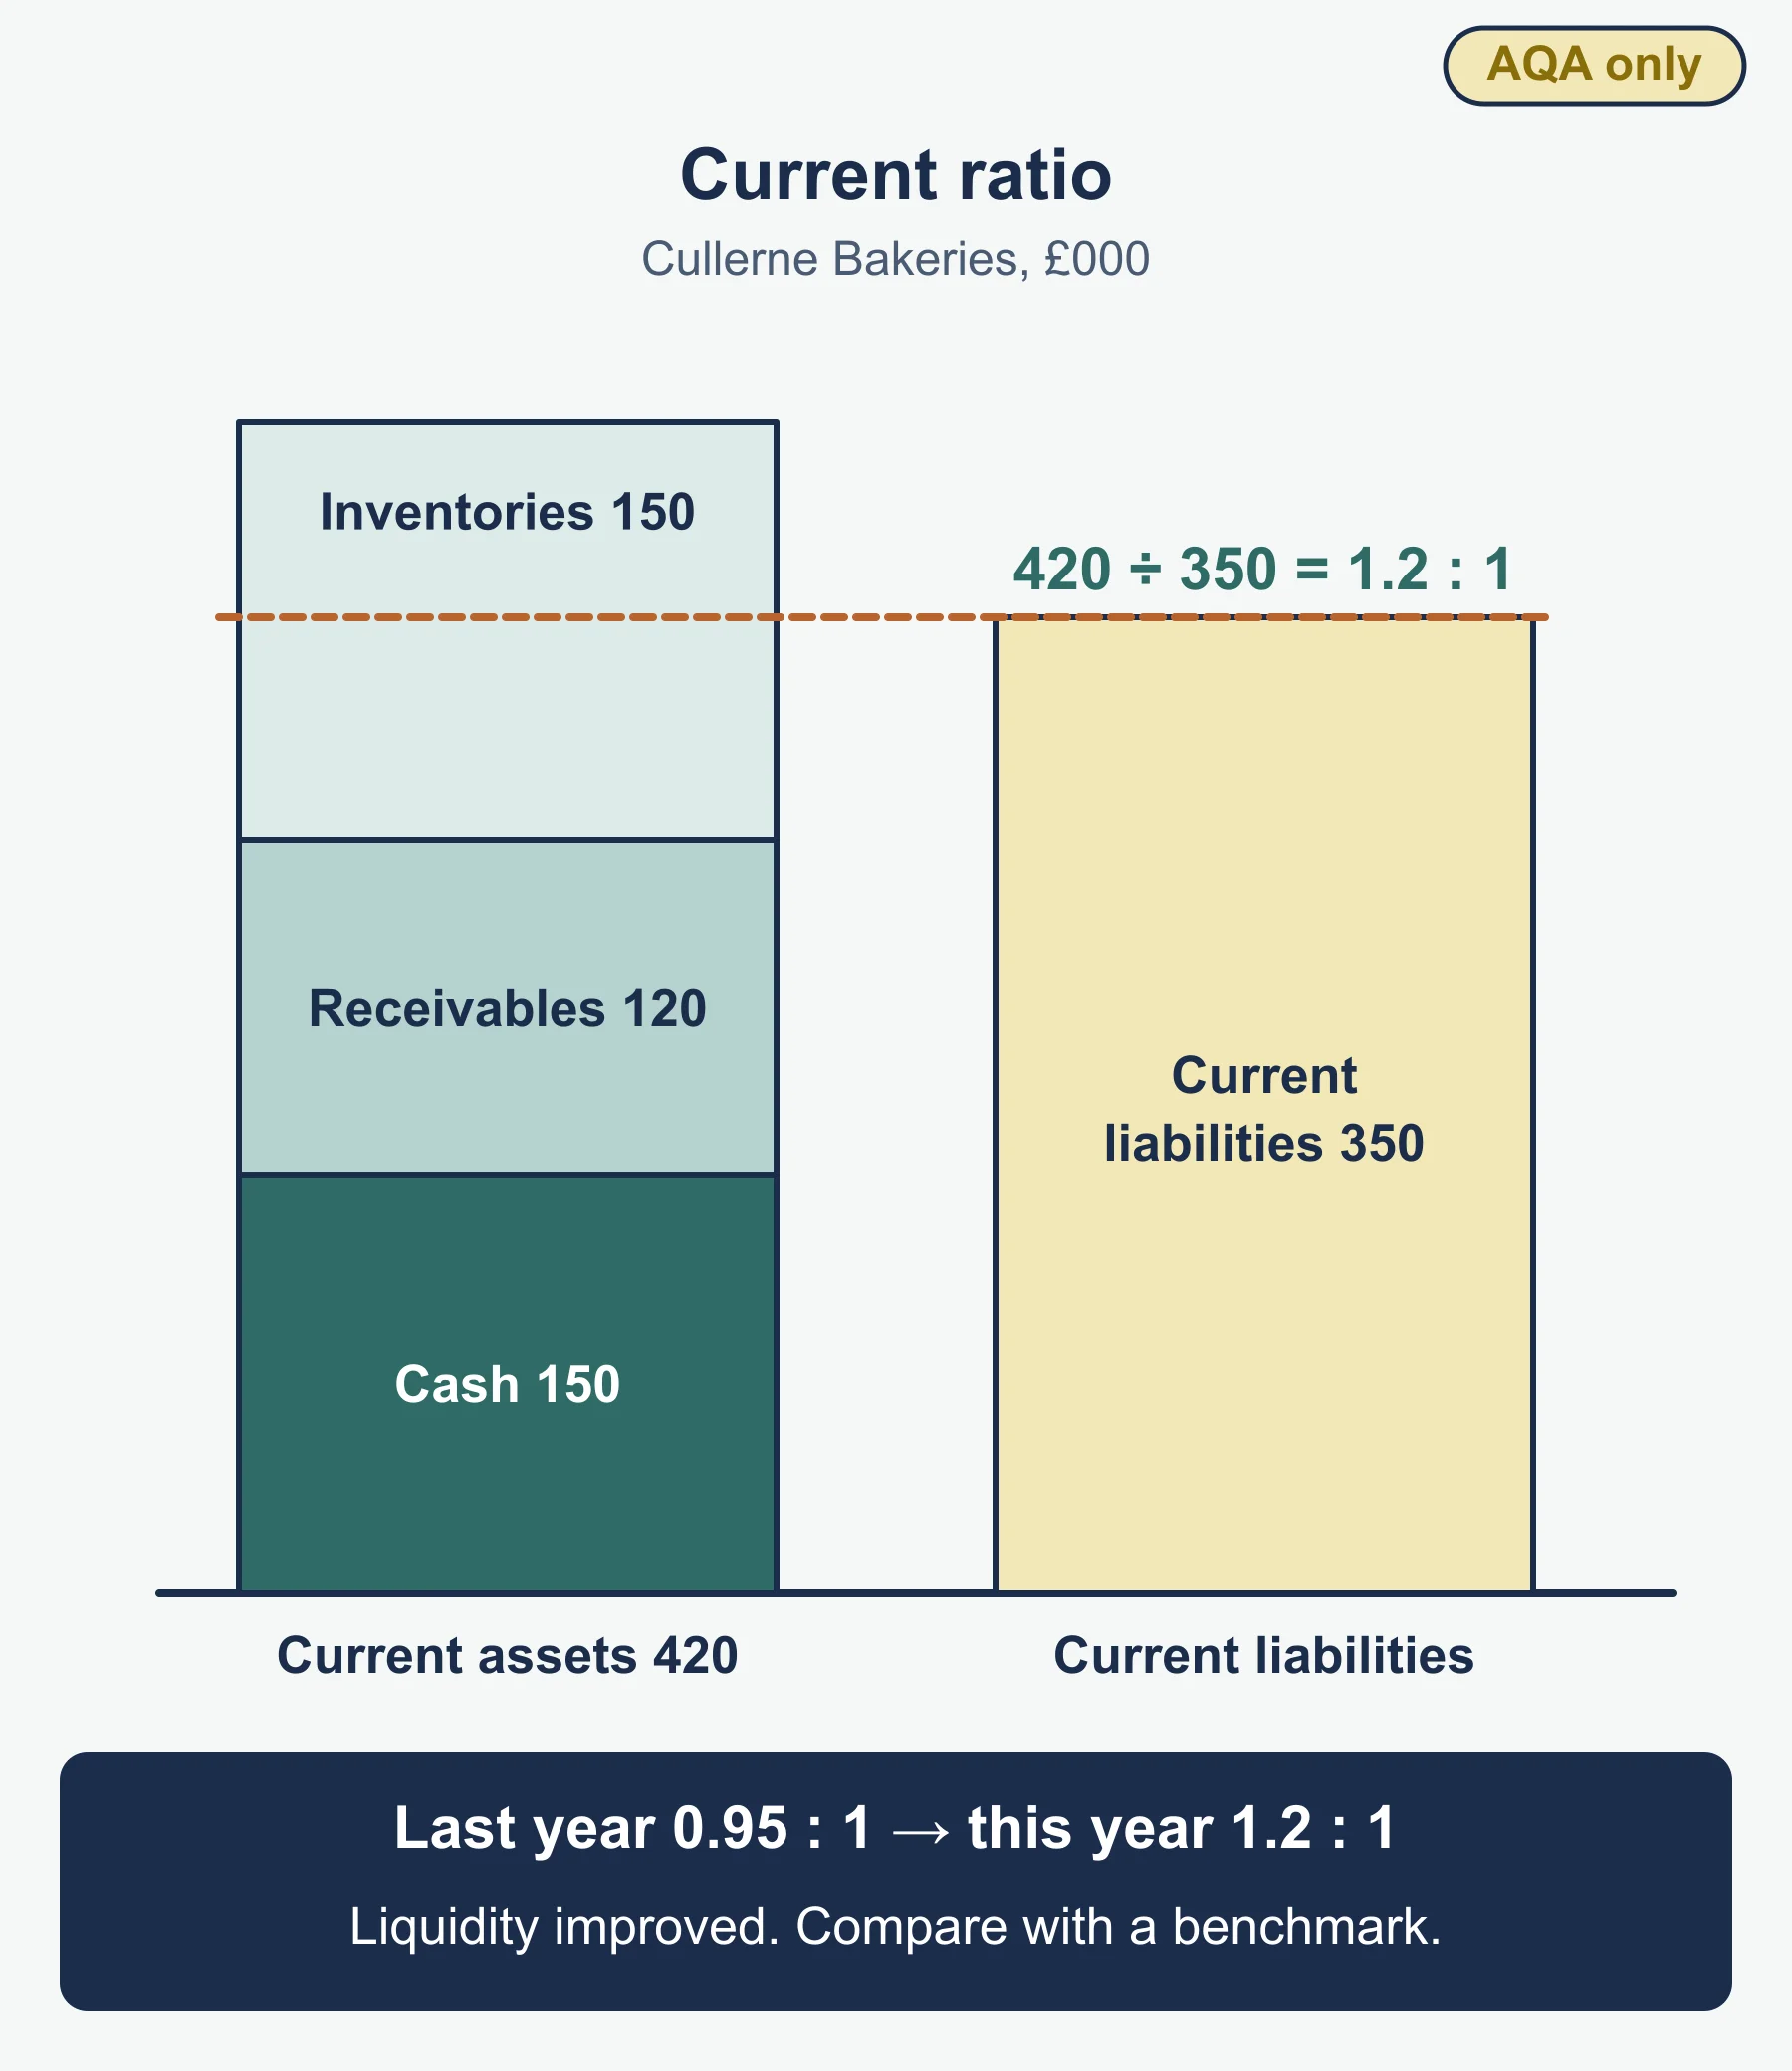
Worked example. Cullerne Bakeries (figures in £000). Revenue 1,500; cost of sales 900; operating profit 180. Balance sheet: inventories 150, receivables 120, cash 150, so current assets 420; current liabilities 350, including payables 110; non-current liabilities 400; total equity 800.
- Capital employed = 800 + 400 = 1,200.
- ROCE = 180 / 1,200 x 100 = 15.0%.
- Current ratio = 420 / 350 = 1.2 : 1.
- Gearing = 400 / 1,200 x 100 = 33.3%.
- Receivables days = 120 / 1,500 x 365 = 29.2 days.
- Payables days = 110 / 900 x 365 = 44.6 days.
- Inventory turnover = 900 / 150 = 6.0 times.
Last year ROCE was also 15.0%, the current ratio 0.95 and gearing 25.0%. So profitability held, liquidity improved and gearing rose, suggesting borrowing funded the improvement.
The value of ratios. They allow comparison over time and with other businesses. But they use past data, depend on accounting policies, ignore non-financial factors and need a sensible benchmark, since a good current ratio varies by industry.
3.7.3 Overall performance
Data other than financial statements include:
- Operations data: capacity utilisation, productivity, unit costs, defect rates, delivery times.
- Human resource data: labour turnover, absenteeism, training, labour productivity.
- Marketing data: market share, customer satisfaction, retention, sales by segment.
Analyse each over time and against rivals.
Core competences are things a business does especially well that rivals find hard to copy and customers value, such as a design skill or a trusted brand. They support competitive advantage.
Short- and long-term performance. Profit this year may come from cutting training or maintenance. Judge both short-term measures (profit, cash) and long-term ones (market position, skills, reputation, investment).
Kaplan and Norton’s Balanced Scorecard measures performance from four perspectives: financial; customer; internal business processes; and learning and growth. It balances short-term financial results with the drivers of future performance, but choosing and weighting measures is difficult.
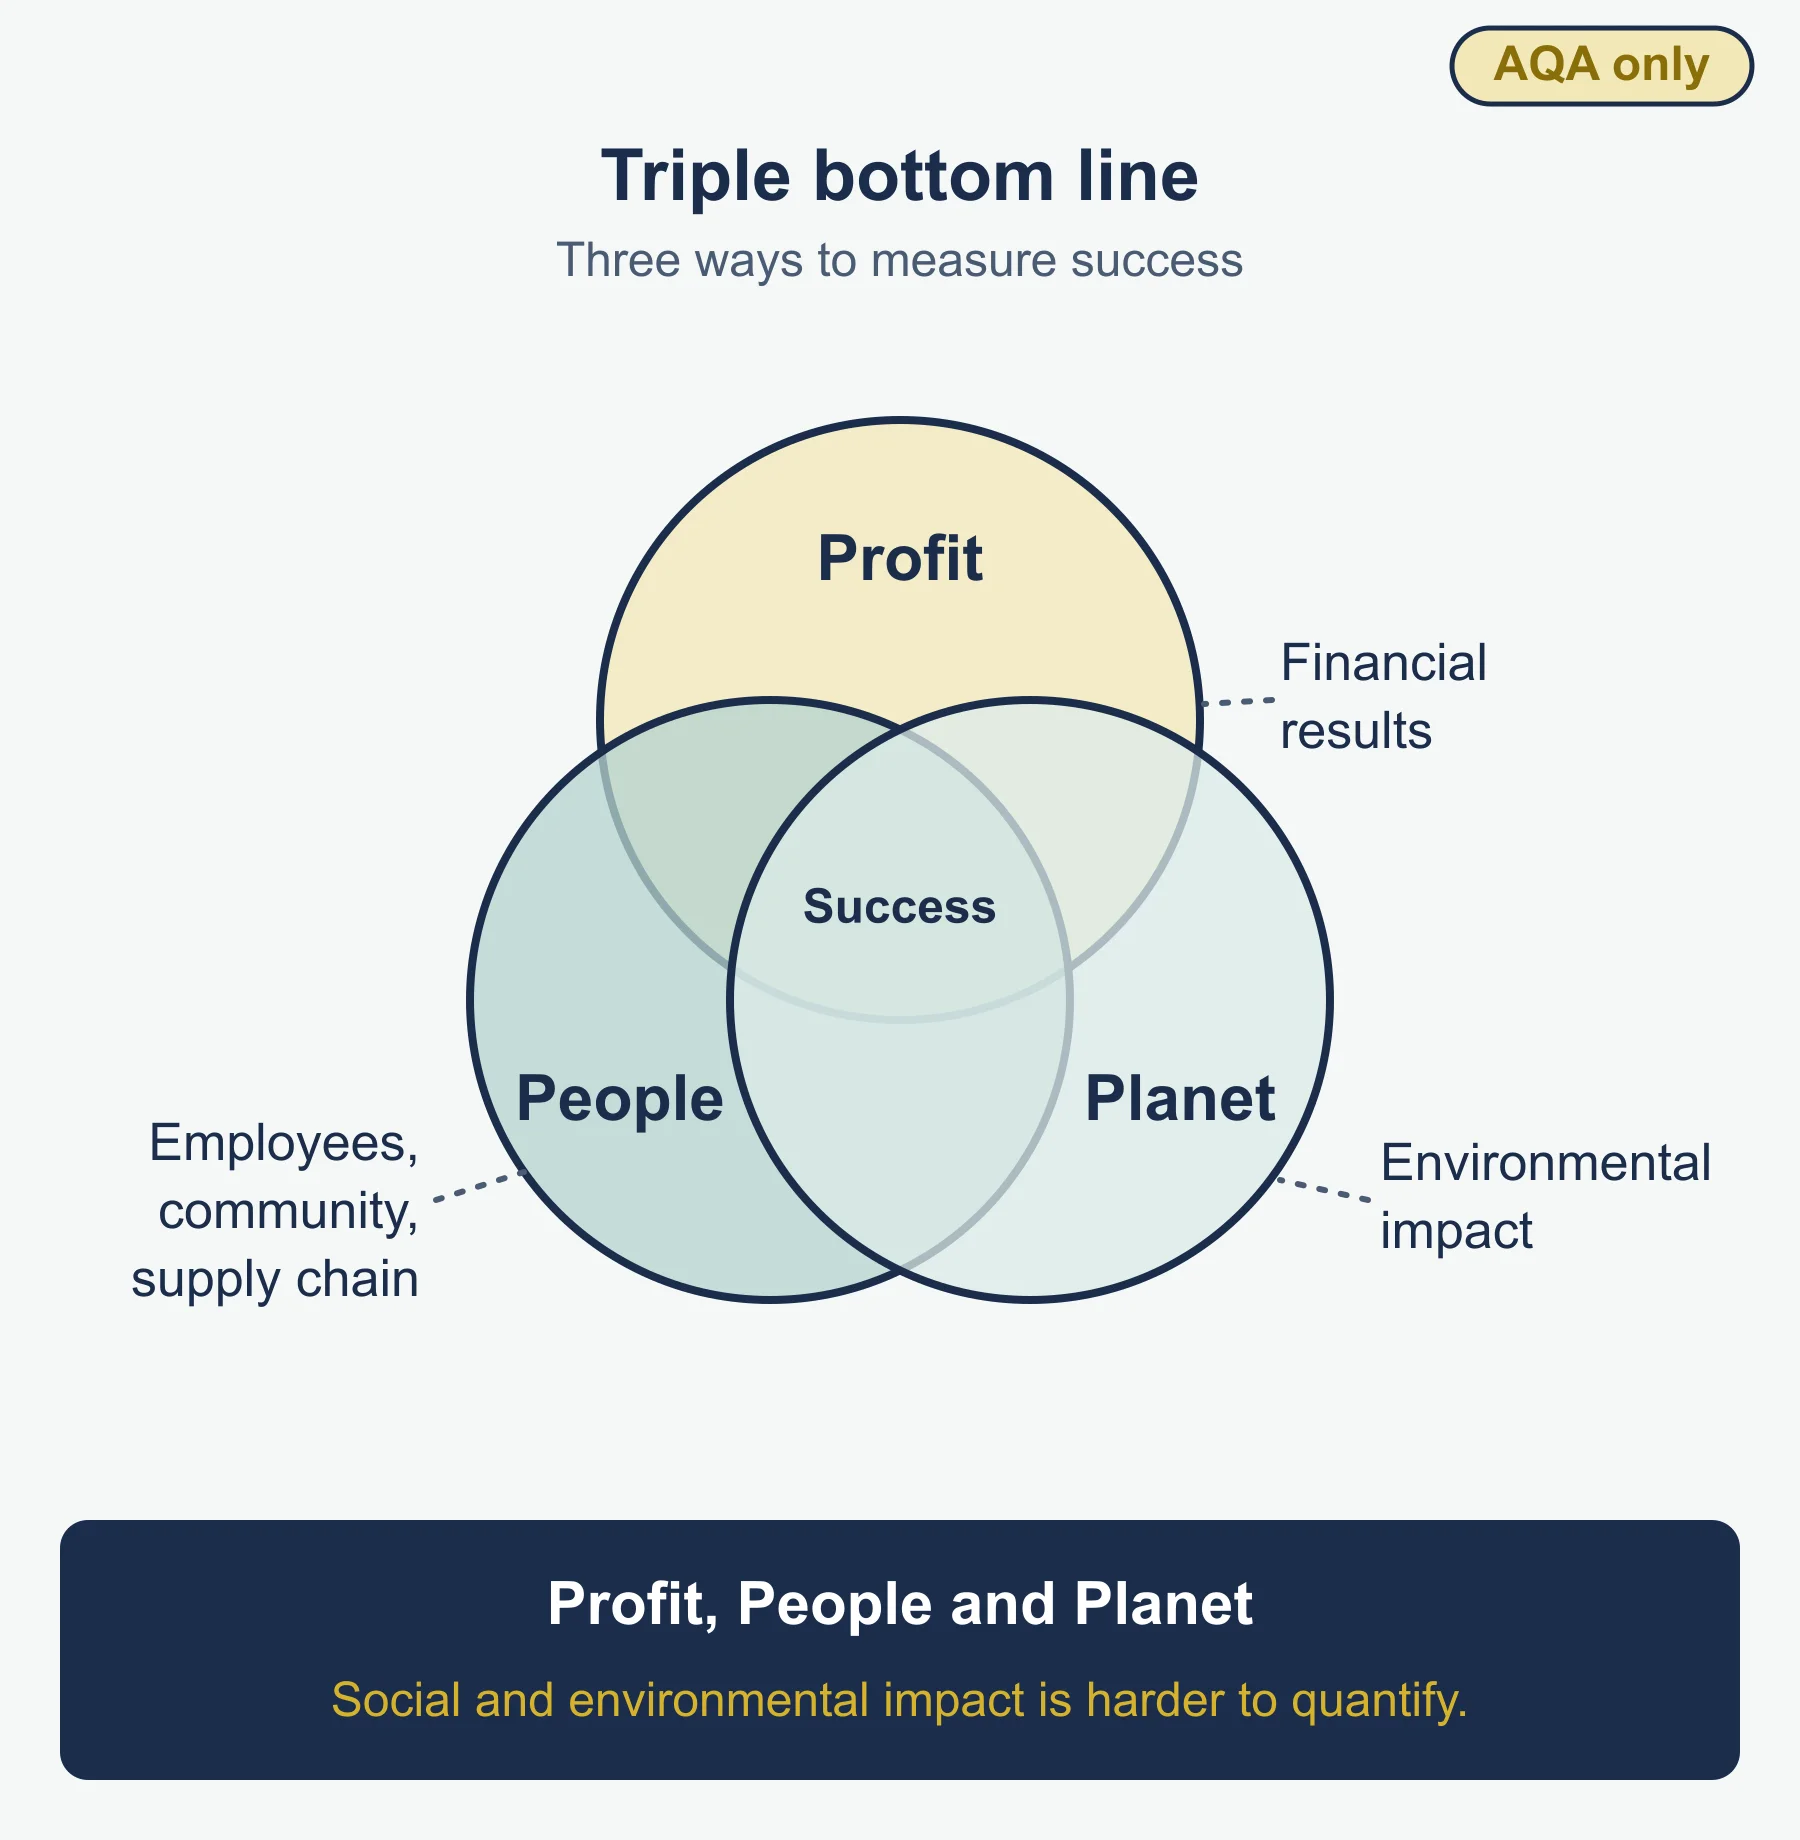
Elkington’s Triple Bottom Line reports Profit, People and Planet: financial results, social impact (employees, community, supply chain) and environmental impact. It widens the definition of success, but social and environmental impact is harder to quantify.
No single measure is enough: ratios are precise but backward-looking, while the scorecard and triple bottom line show more but are more subjective.
3.7.4 Political and legal change
You need a broad understanding of the scope and effects of UK and EU law on competition (controls on cartels and abuse of market power, merger scrutiny), the labour market (pay, working time, discrimination and employment rights) and the environment (limits on emissions, waste and pollution). Keep descriptions general.
Government policy affects business through:
- Enterprise policy: grants and support for start-ups and small firms.
- Regulators: bodies that oversee markets, set rules and can fine firms.
- Infrastructure: transport, broadband and energy spending, which affects costs and location.
- Environmental policy: taxes and standards that raise costs but create demand for greener products.
- International trade policy: tariffs, quotas and agreements.
The effect is on strategy (entering a market, relocating) and functions: higher minimum pay raises labour costs, stricter emissions rules change operations. Judge the size of the change and whether rivals face the same rule.
3.7.5 Economic change
The specification lists these factors and expects you to interpret data for the UK, the European Union and globally.
- GDP: growth usually raises demand, especially for luxuries; a recession cuts it.
- Taxation: higher corporation tax cuts retained profit; higher income tax or VAT cuts spending power.
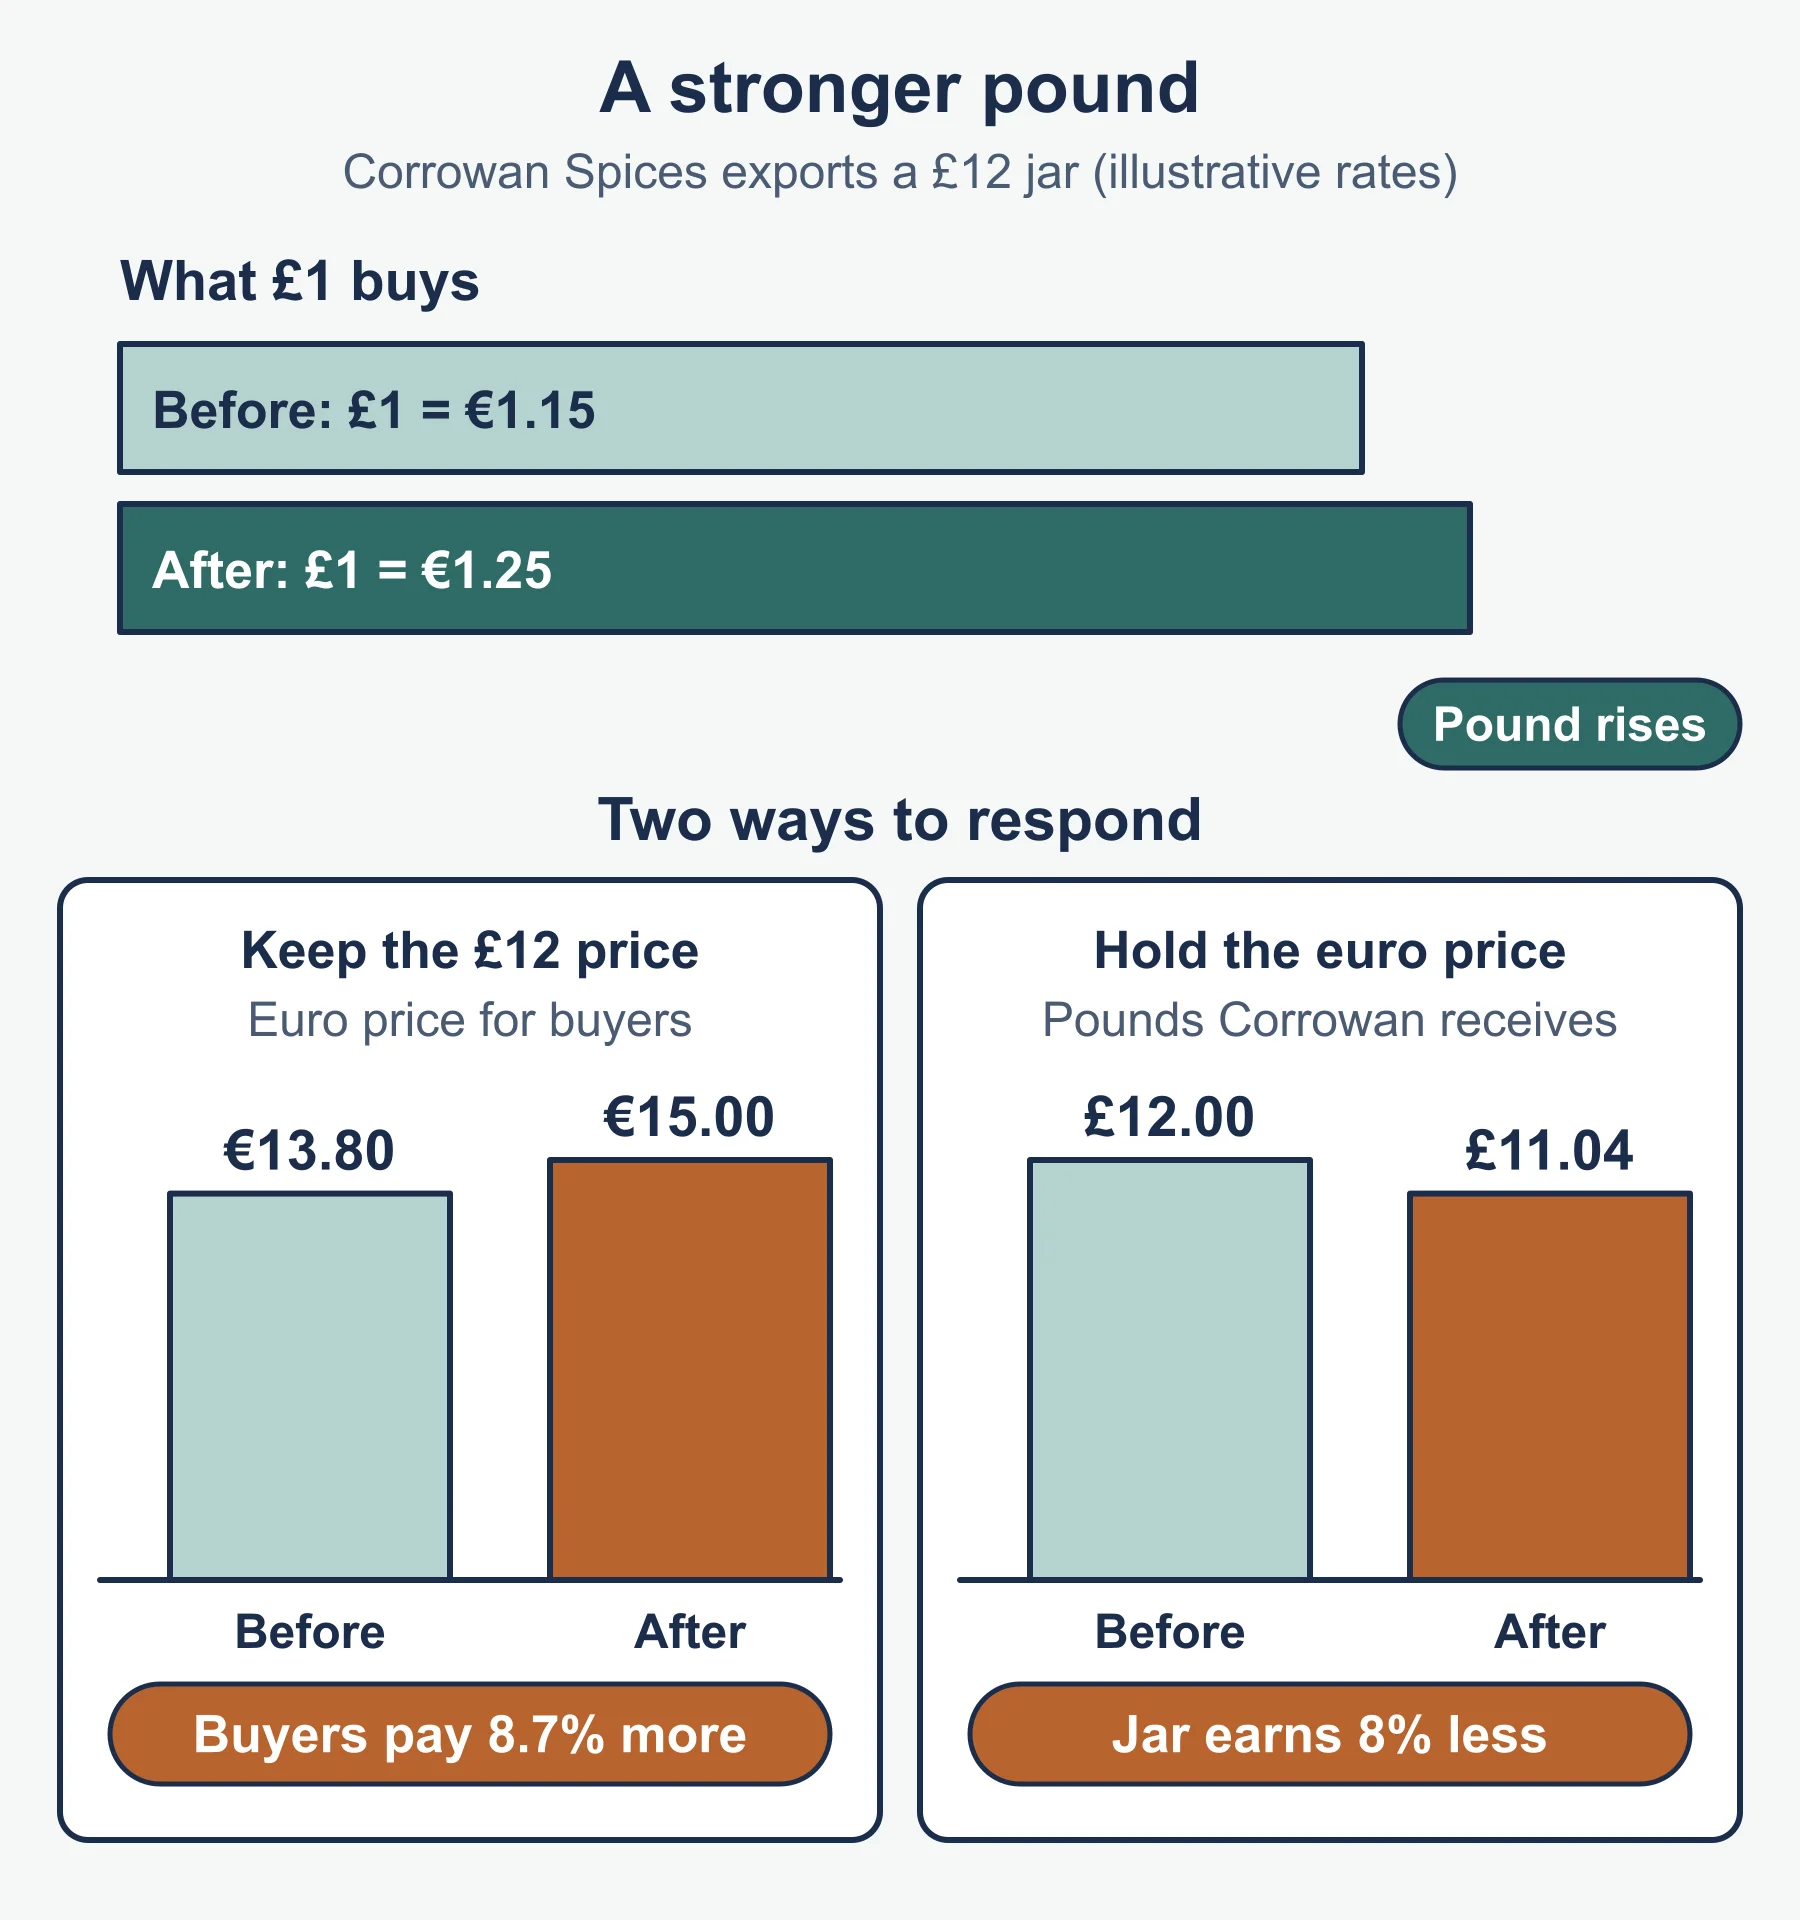
- Exchange rates: a stronger pound makes exports dearer and imports cheaper. If a firm sells an item at €100 and the rate falls from €1.25 to €1.10 per pound, its sterling revenue per item rises from £80 to about £90.91, because the pound has weakened.
- Inflation: rising costs squeeze margins.
- Fiscal policy (government spending and tax) and monetary policy (interest rates and money supply): higher interest rates raise borrowing costs and cut demand, hitting highly geared firms hardest.
- More open trade v protectionism: open trade widens markets and sourcing but adds competition; protectionism shelters domestic firms and raises importers’ costs.
For data work, say what changed, by how much and who it affects. If sales value rose 5% while prices rose 3.2%, real growth was about 1.7%.
Globalisation. Reasons: lower transport and communication costs, trade liberalisation, firms seeking lower costs and bigger markets, and rising incomes. Its importance: bigger markets, cheaper inputs and economies of scale, but also more rivals and currency risk. Emerging economies matter as fast-growing sources of demand and production, with political and infrastructure risks.
3.7.6 Social and technological change
Social change includes demographic change and population movements: an ageing population (demand for health care and leisure), urbanisation and migration (new city markets, labour supply), changes in consumer lifestyle and buying behaviour (convenience, health, ethical purchasing) and the growth of online businesses (home delivery, price comparison, high-street decline).
Corporate Social Responsibility (CSR) is a business accepting responsibility for its effects on society and the environment beyond the law.
- Reasons for: reputation, customer and employee loyalty, avoiding regulation, long-term sustainability.
- Reasons against: cost, lower short-term profit, and the view that a business’s job is profit.
The shareholder concept says a business exists mainly to maximise returns to owners. The stakeholder concept says it should balance the interests of all affected groups.
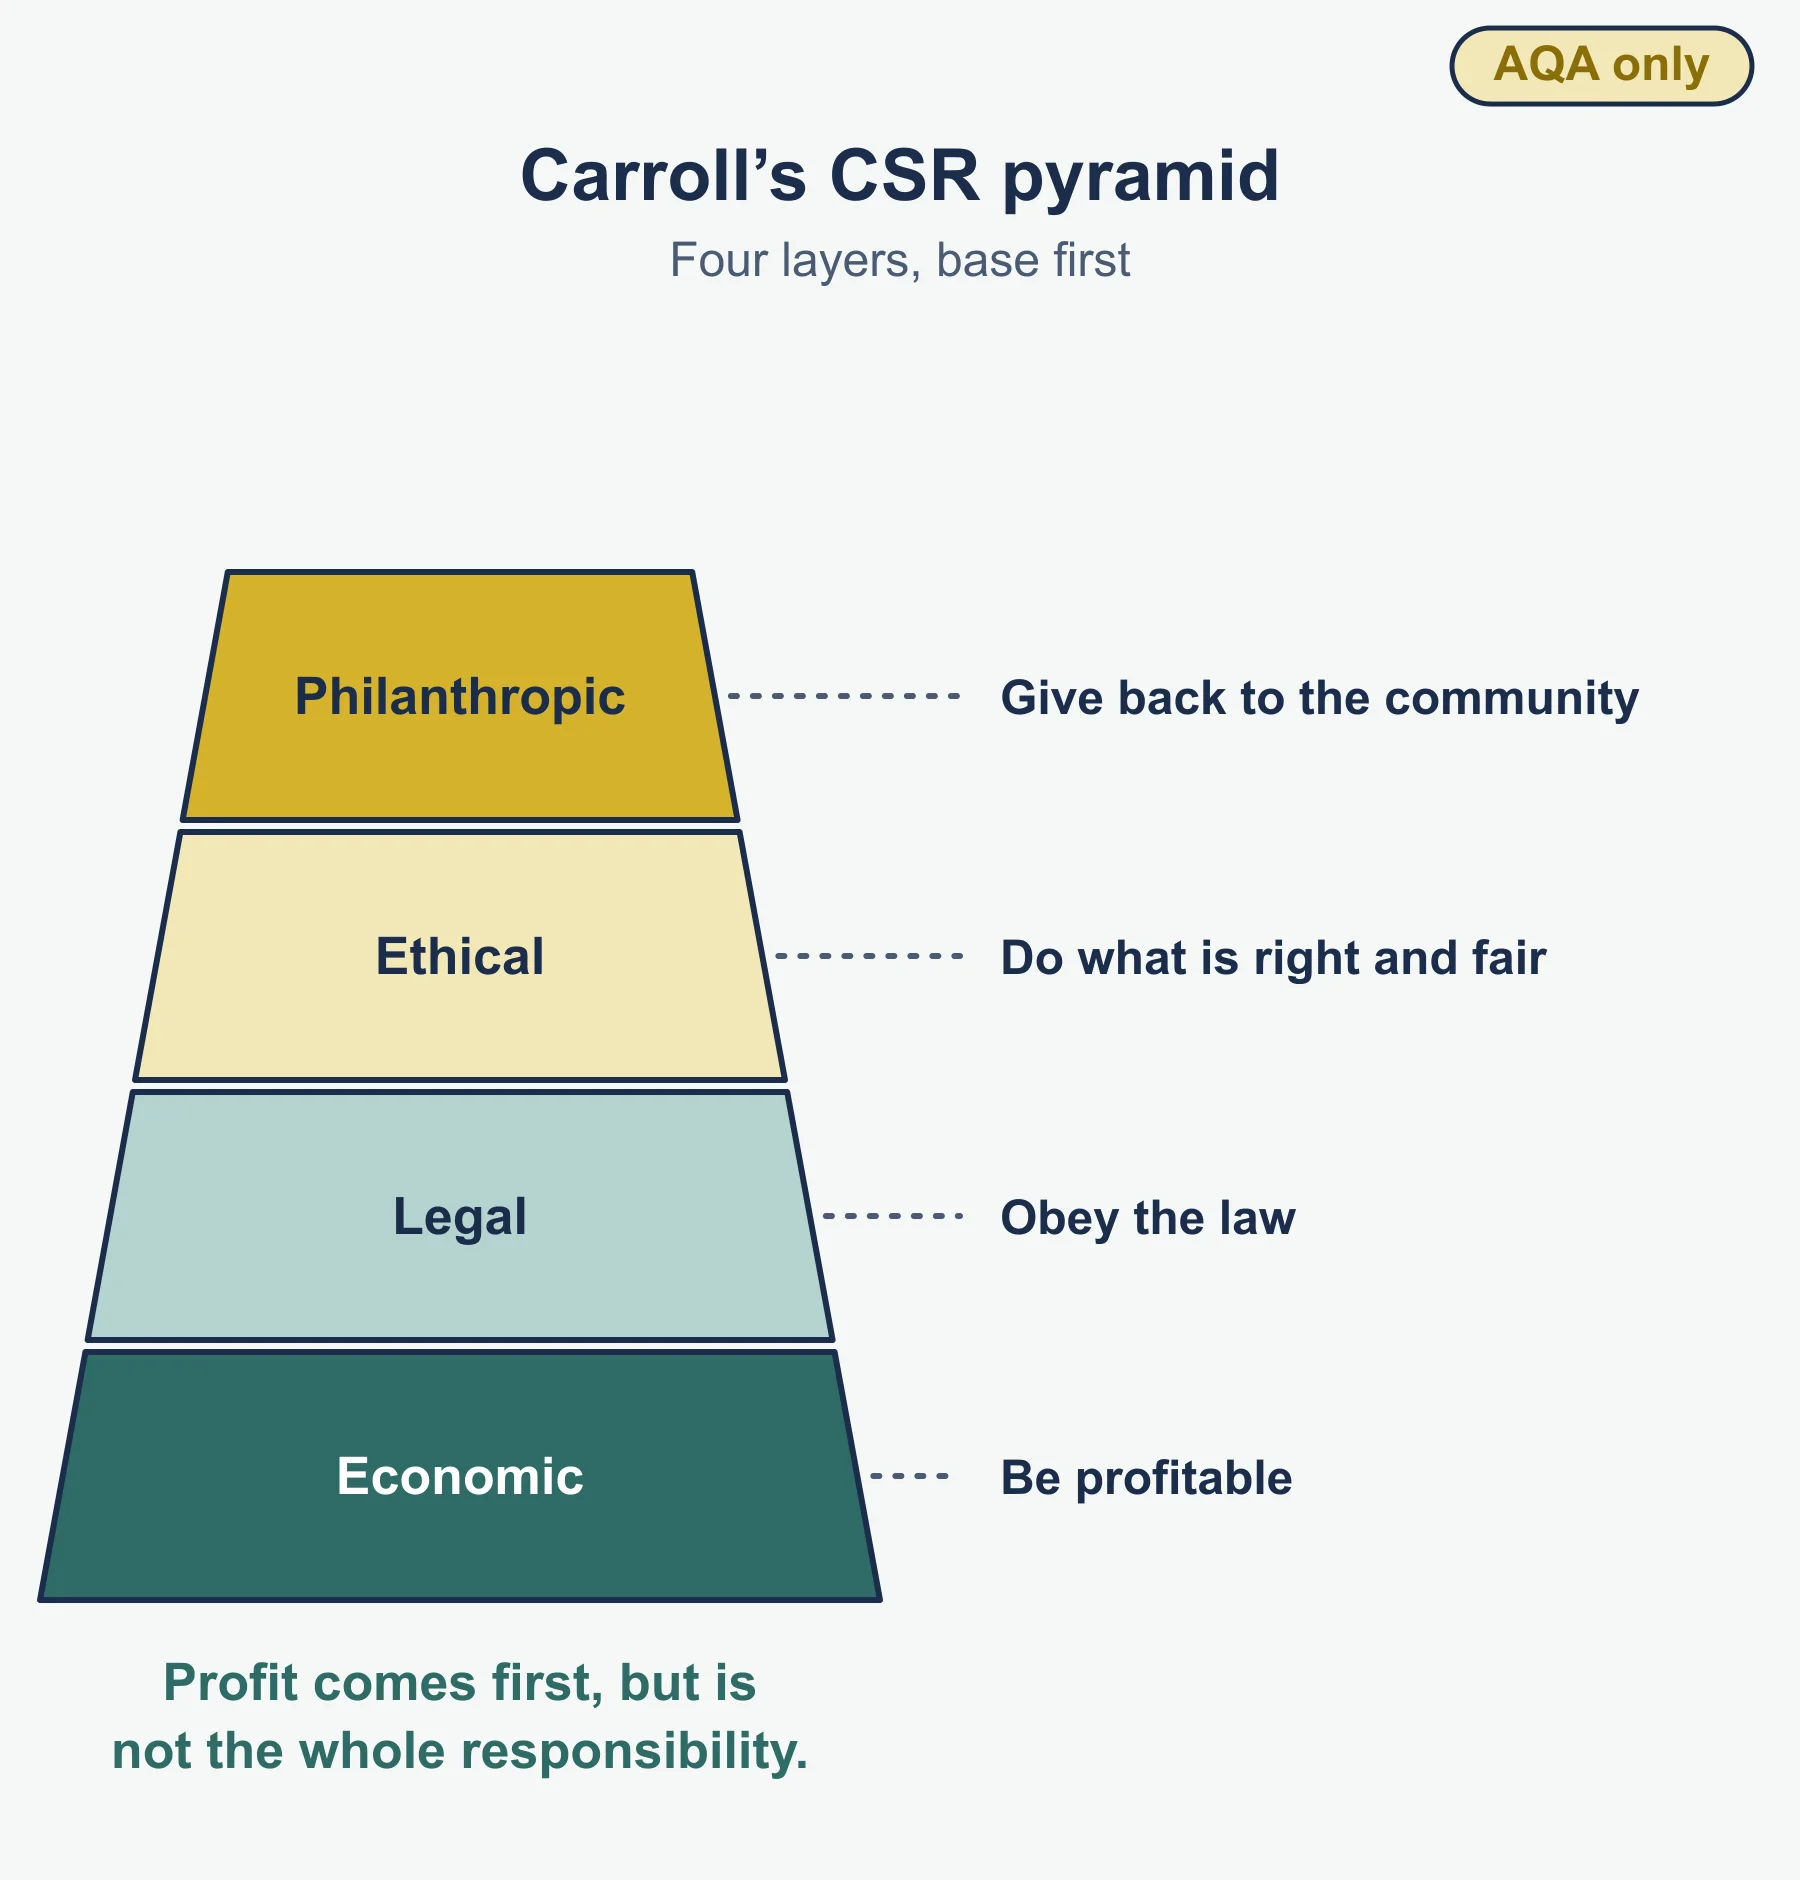
Carroll’s Corporate Social Responsibility pyramid has four layers from the base up: economic (be profitable), legal (obey the law), ethical (do what is right and fair) and philanthropic (give back to the community). Profit comes first but is not the whole responsibility.
Pressures for socially responsible behaviour come from consumers, pressure groups, social media, employees, investors and regulators.
Technological change affects functions (automation in operations, online channels in marketing, digital payments in finance, remote working in HR) and strategy: it can create markets, make products obsolete and lower entry barriers.
3.7.7 Porter’s five forces
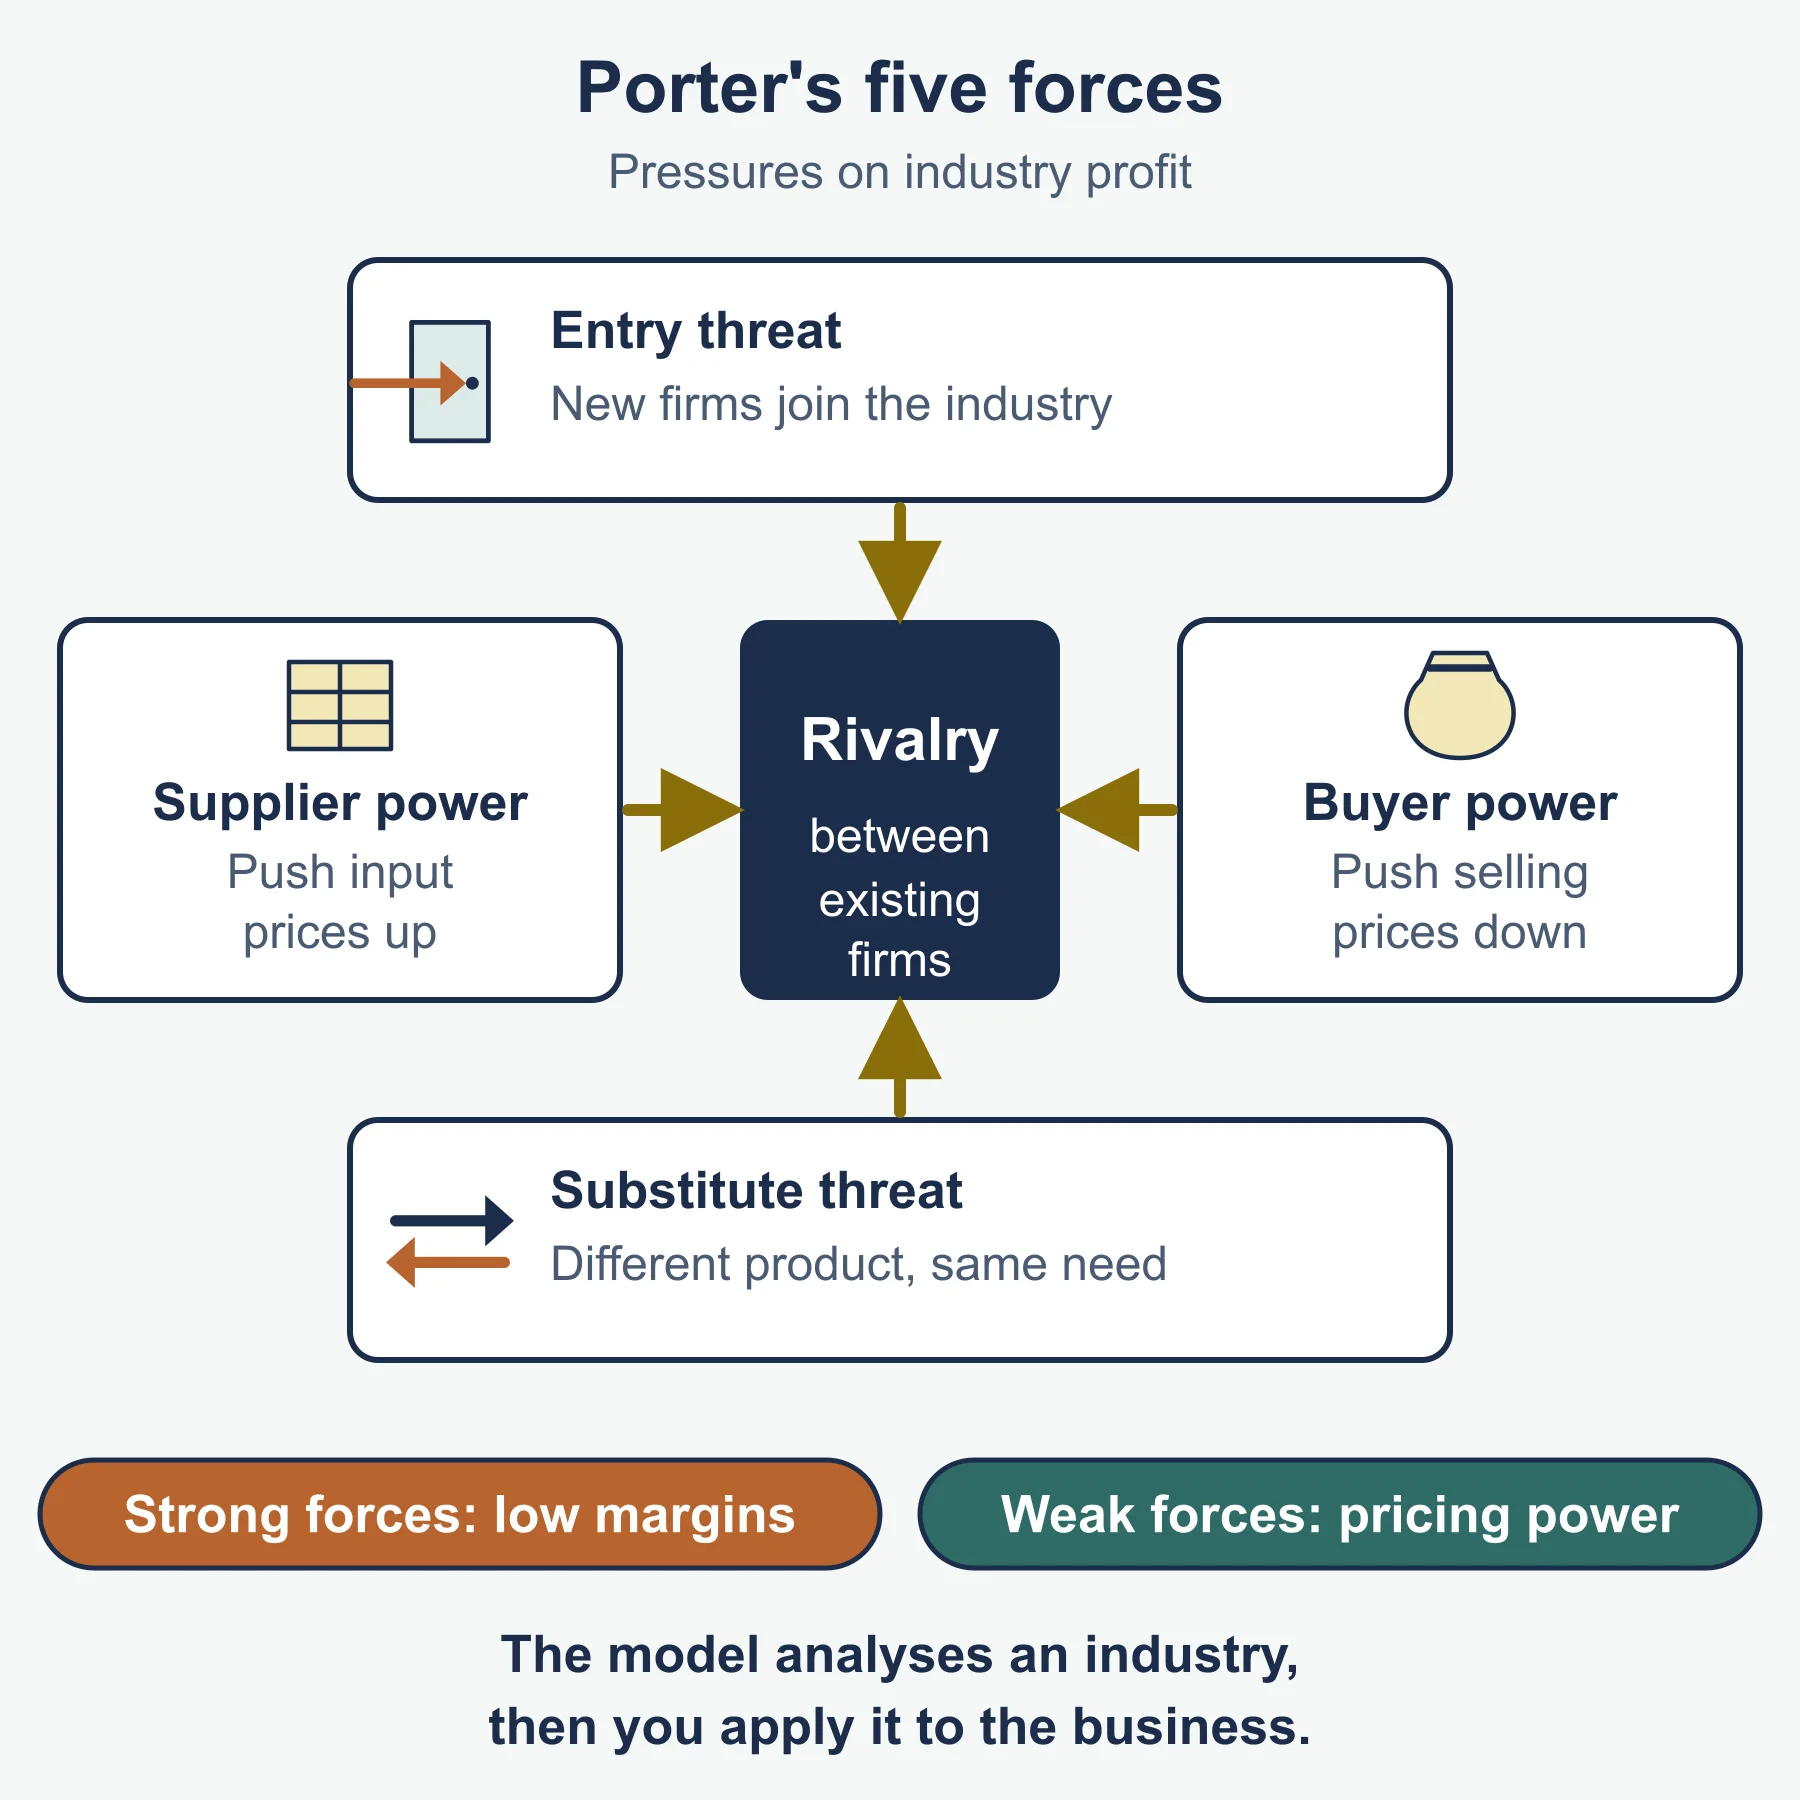
Porter’s model assesses the profit potential of an industry through five forces:
- Entry threat: high barriers to entry (economies of scale, brand loyalty, capital needs, patents) protect profits.
- Buyer power: strong when buyers are few, large or can switch easily. It pushes prices down.
- Supplier power: strong when few suppliers exist or inputs are specialised. It pushes costs up.
- Rivalry: intense with many similar competitors, slow market growth or high fixed costs.
- Substitute threat: where customers can meet the same need another way, which caps prices.
How and why they change. Technology can lower entry barriers, mergers can reduce rivals and raise buyer concentration, and new products alter substitutes. Implications. Weak forces mean higher profit potential. Firms respond by building barriers, differentiating or locking in customers, which shapes competitive strategy; fierce rivalry may push operations towards cost-cutting. Limit: it is a snapshot of an industry assumed stable.
3.7.8 Investment appraisal
Investment appraisal compares the expected cash flows of a project with its cost. The specification asks for calculation and interpretation of three methods.
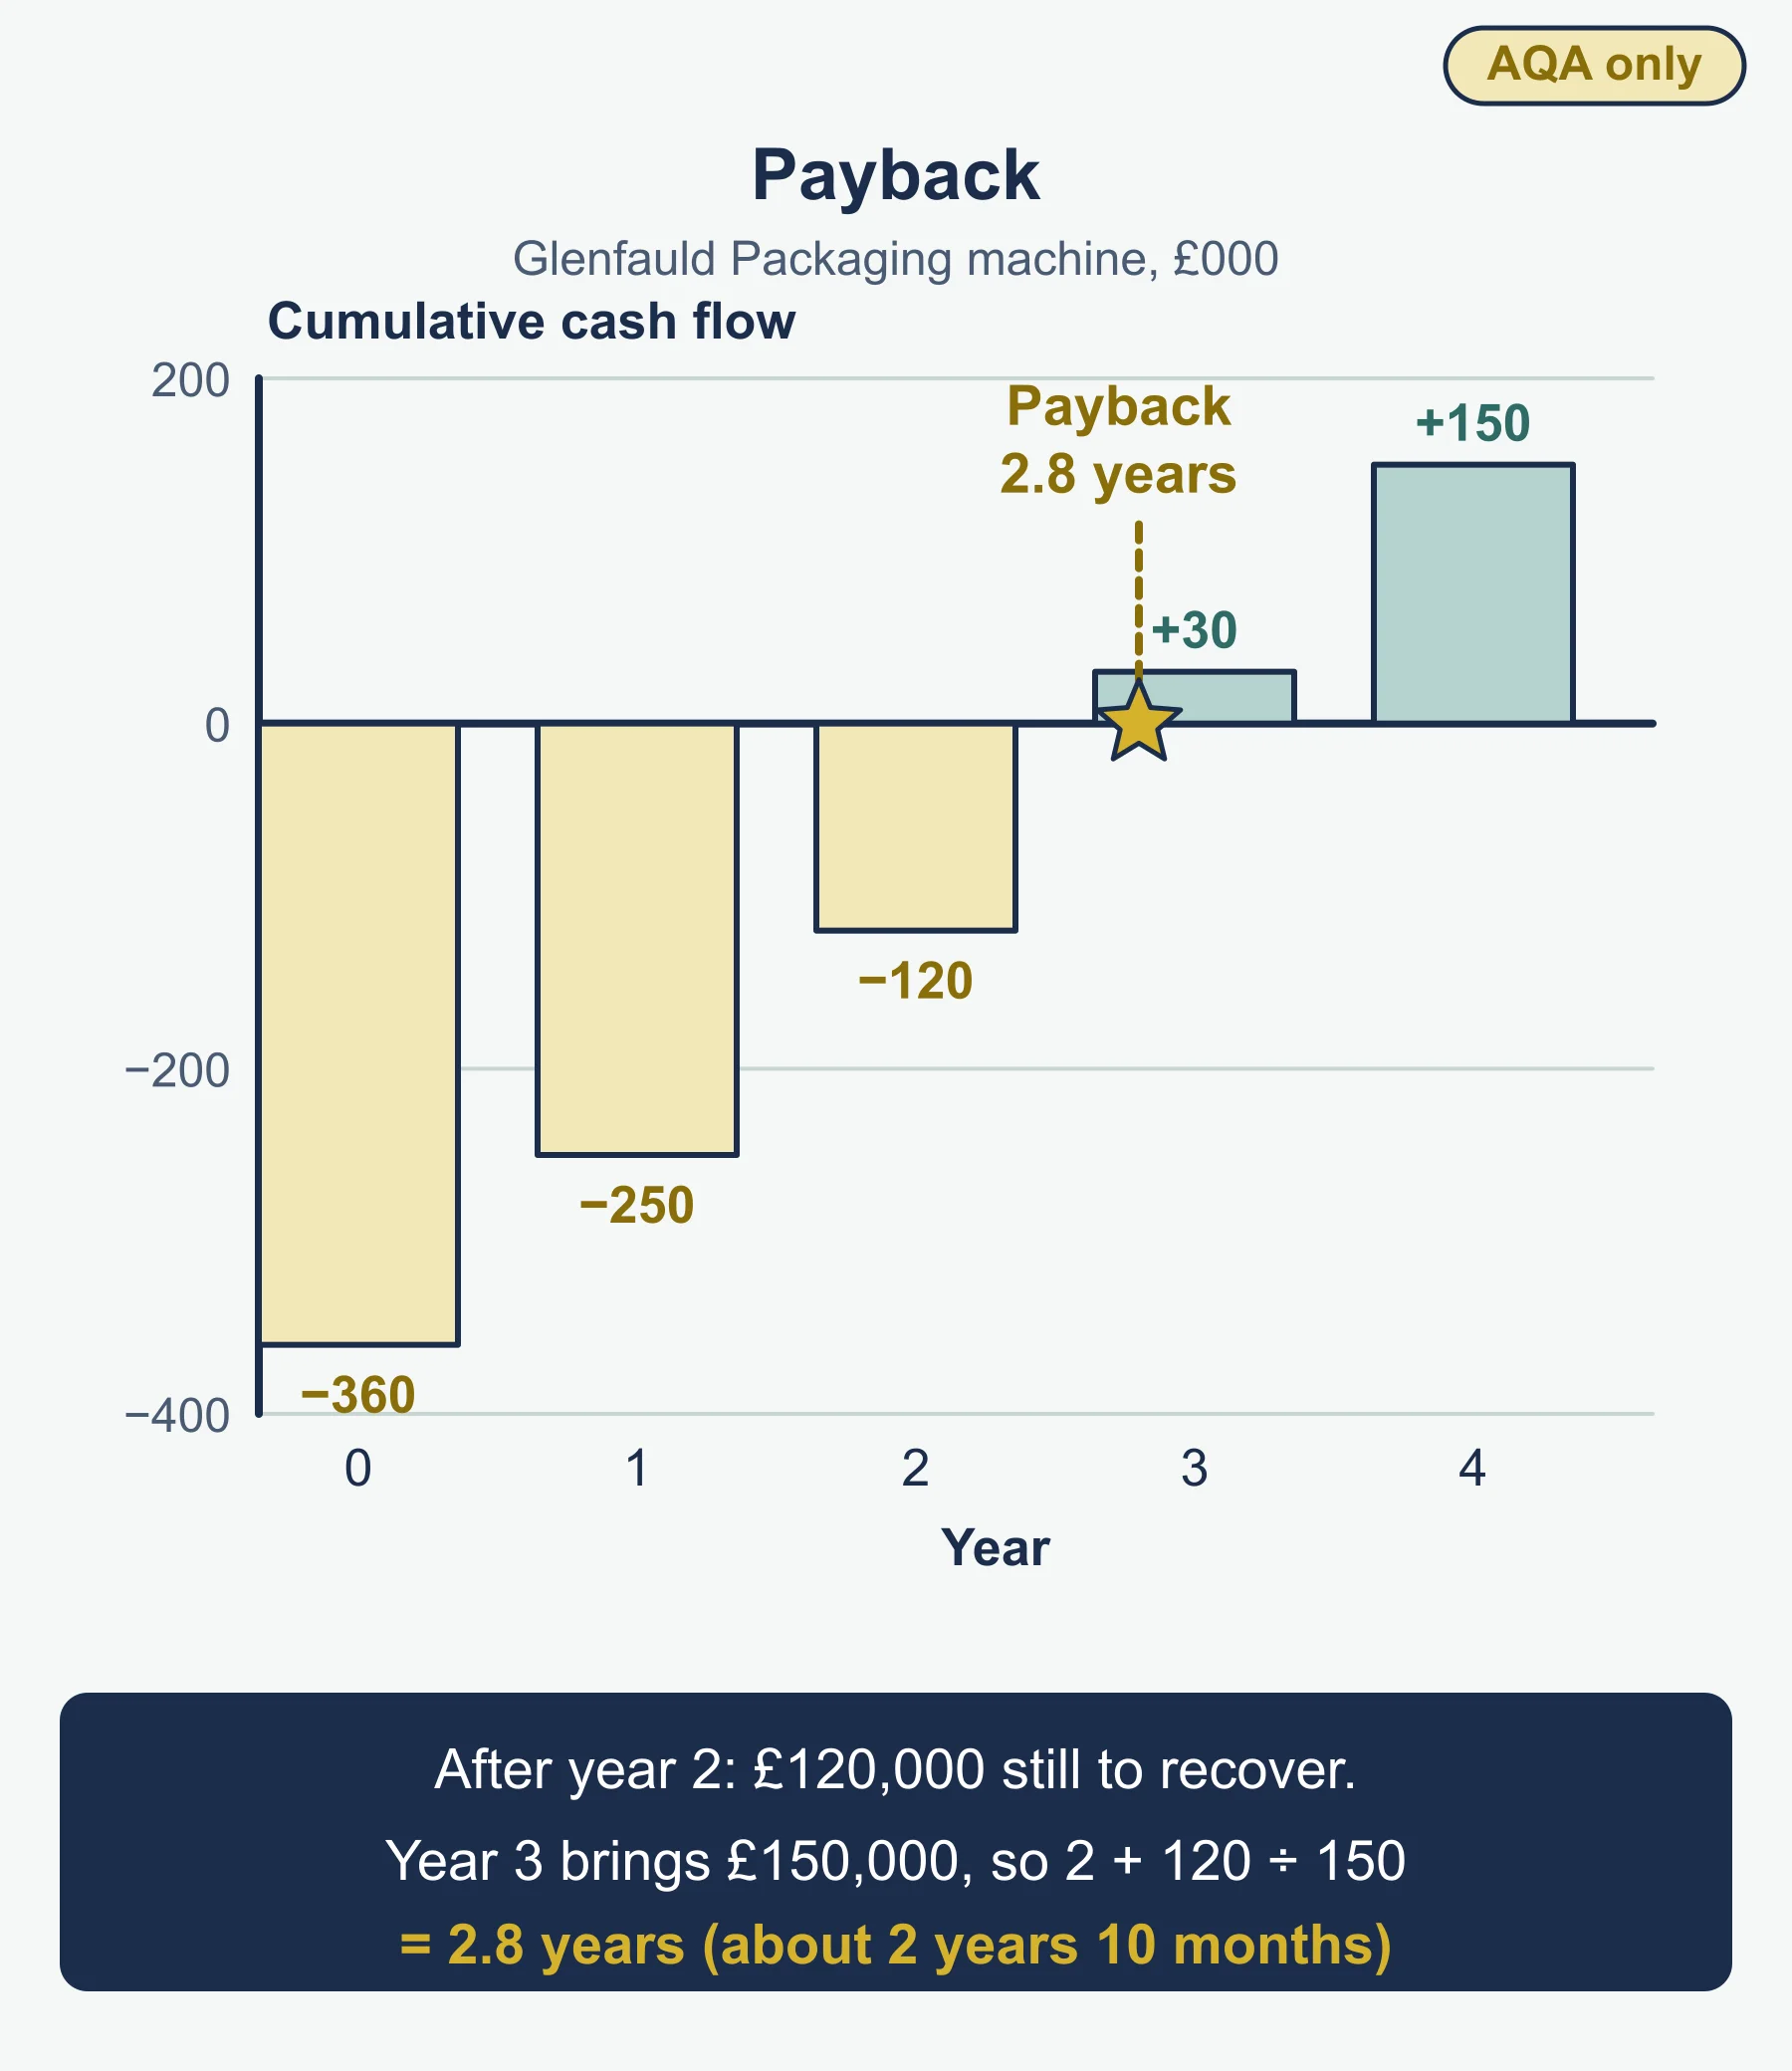
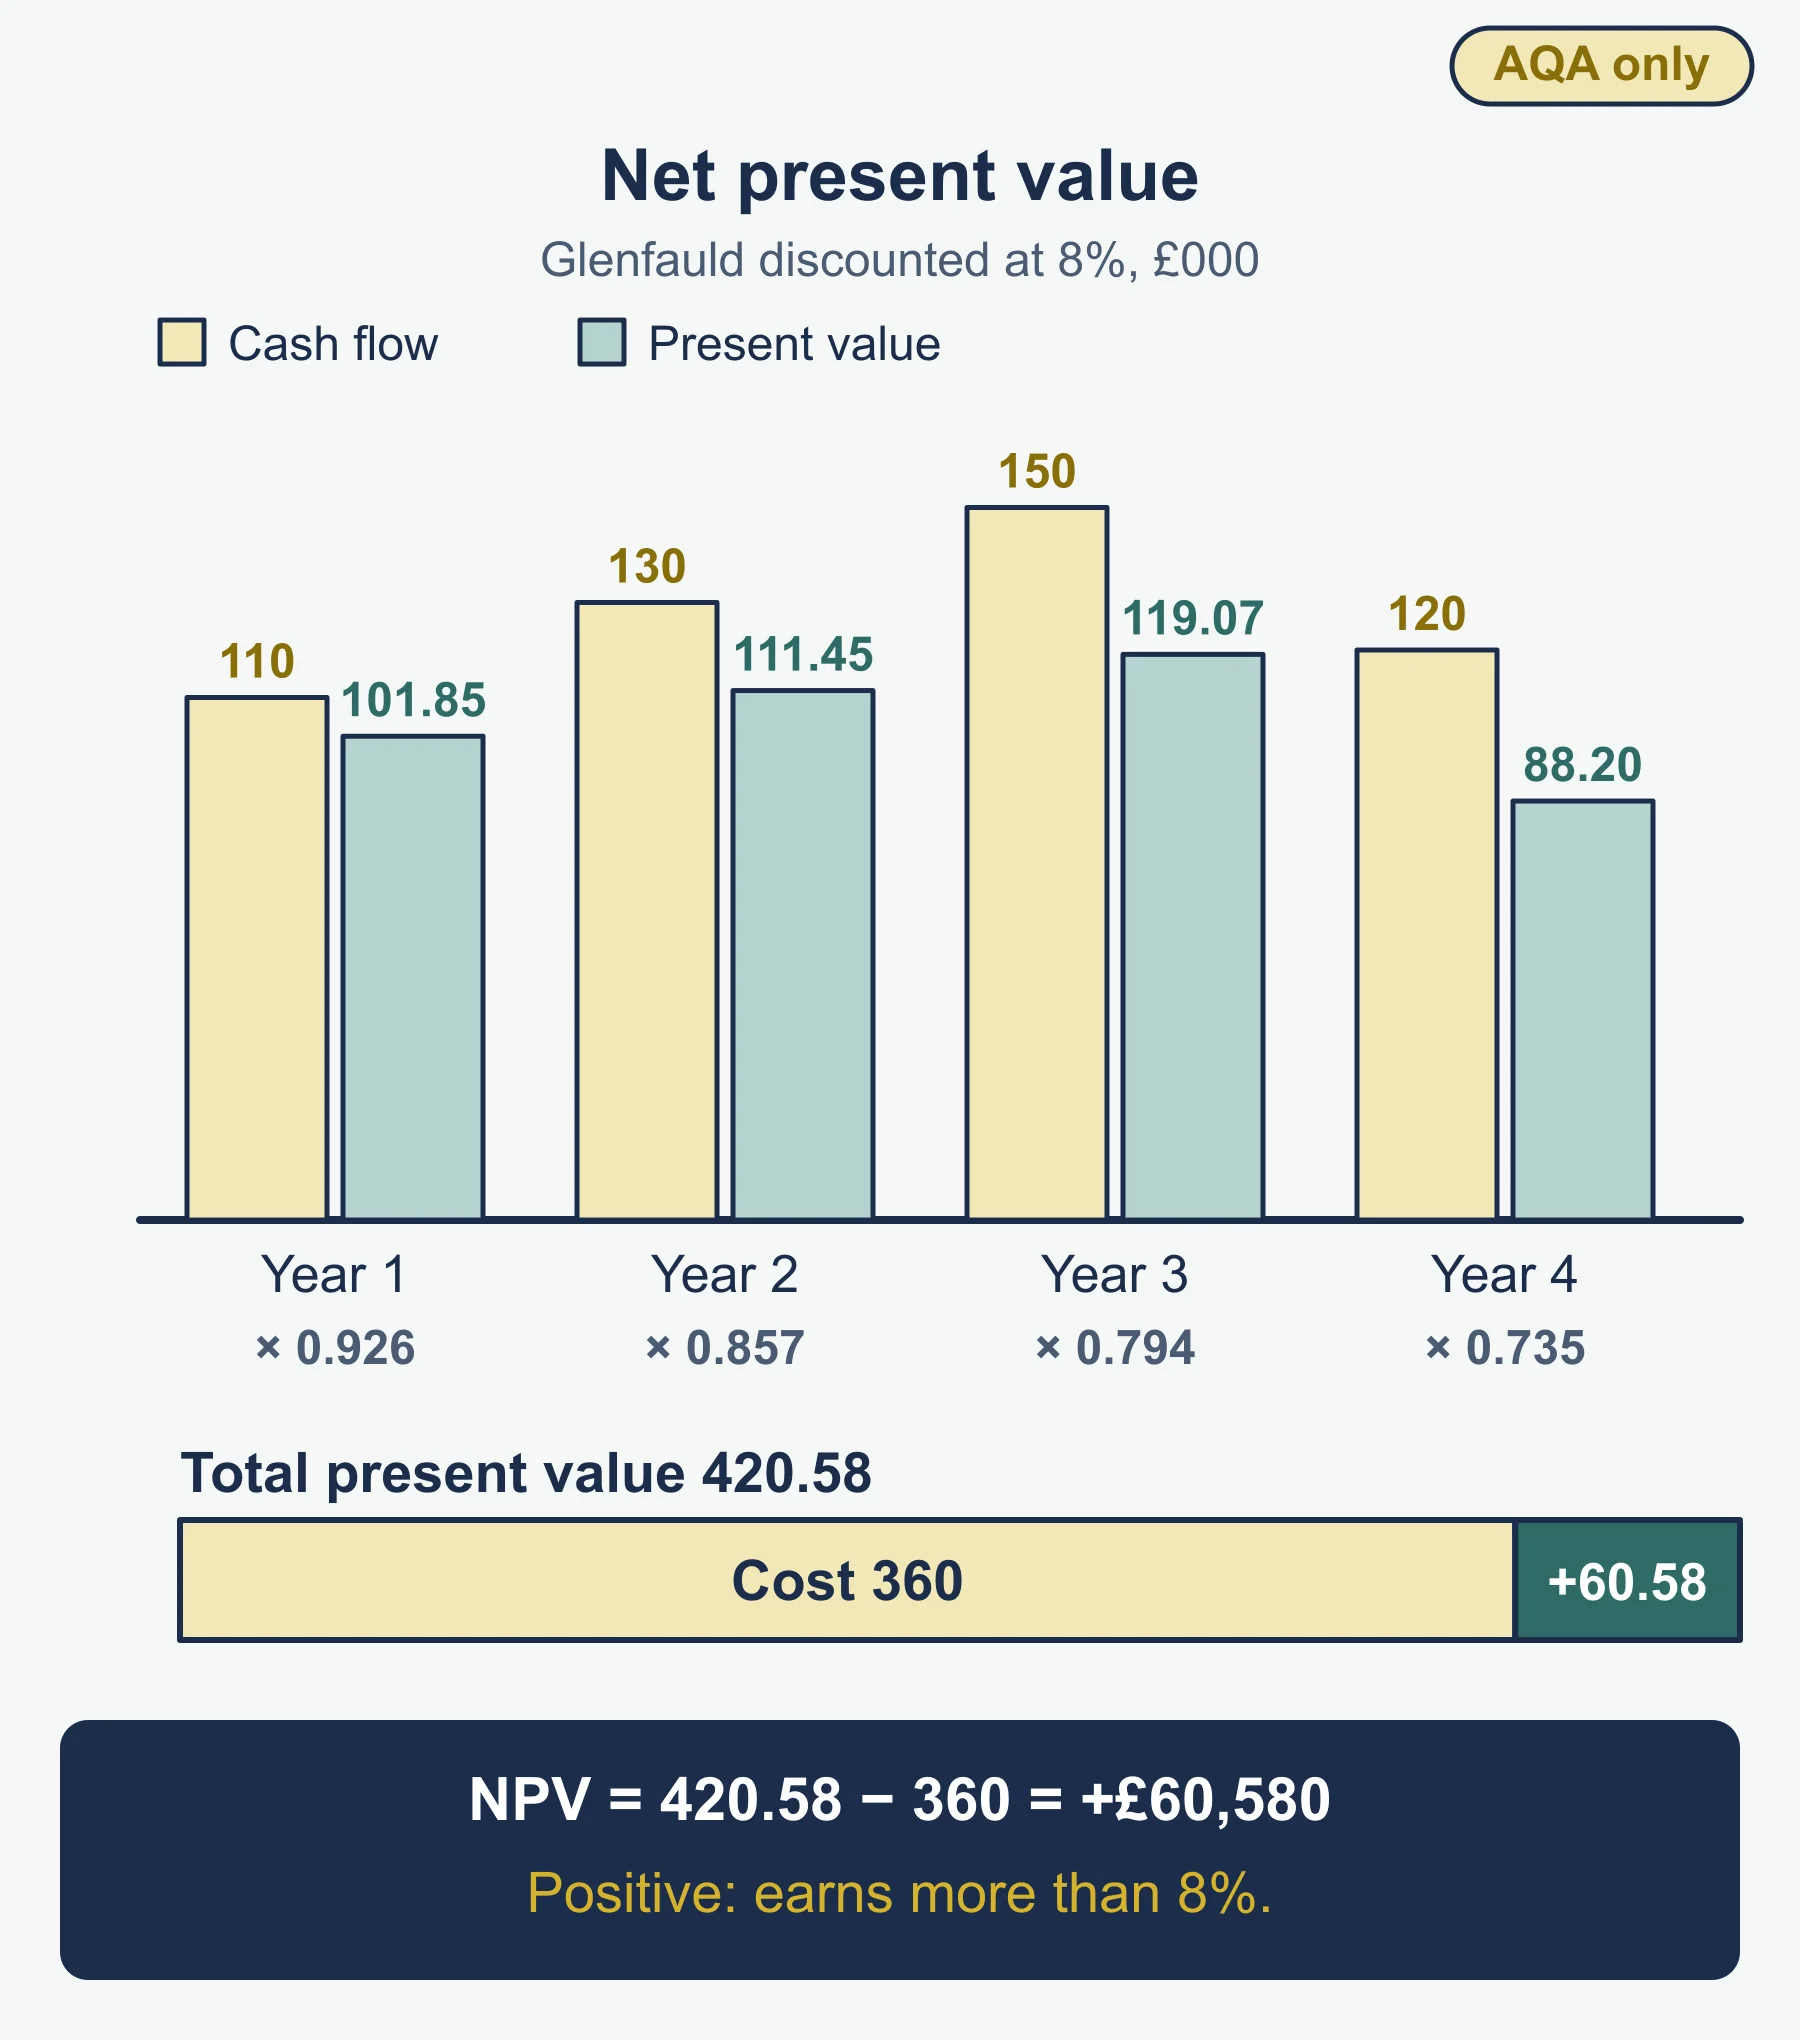
Worked example. Glenfauld Packaging considers a machine costing £360,000, with net cash flows of £110,000, £130,000, £150,000 and £120,000 in years 1 to 4, discounted at 8%.
Payback. After year 2, £240,000 is recovered and £120,000 remains. Year 3 gives £150,000, so payback is 2 + 120/150 = 2.8 years (about 2 years 10 months).
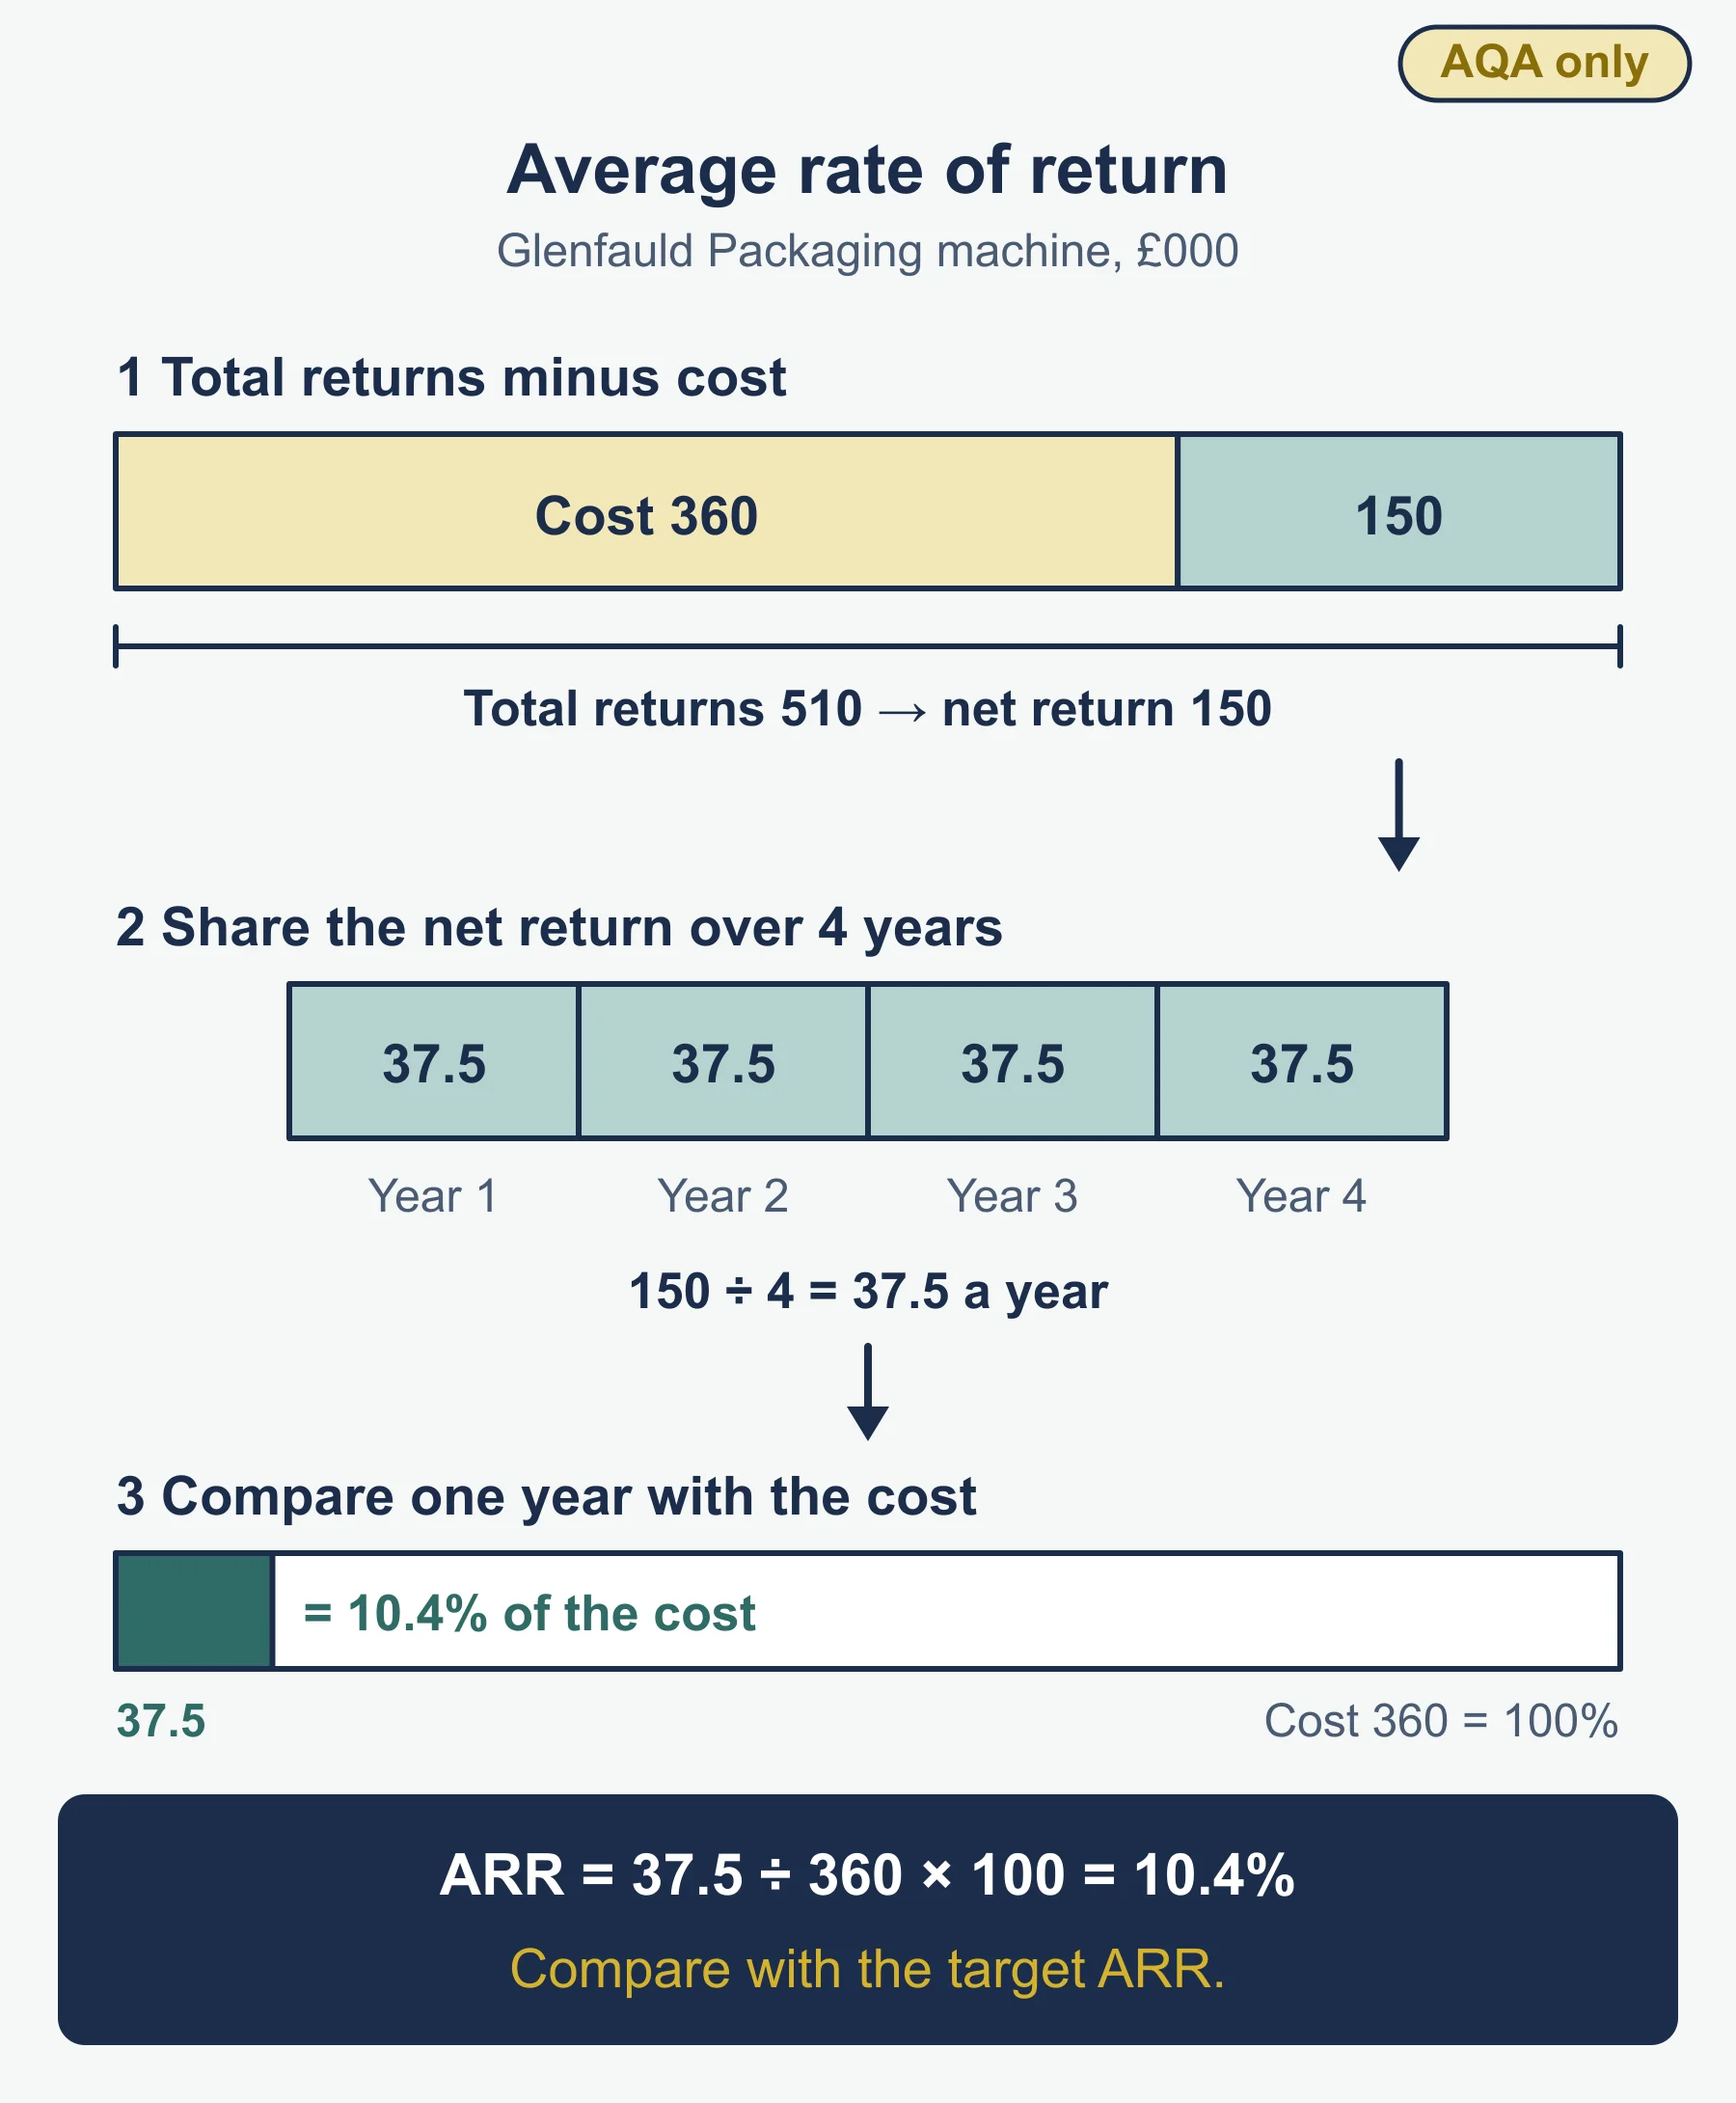
Average rate of return (ARR): (total returns minus cost) / years / cost x 100. Total returns are £510,000, so net return is £150,000. Annual average is £37,500, so ARR = 37,500 / 360,000 x 100 = 10.4%.
Net present value (NPV): discount each cash flow, add them and subtract the cost.
| Year | Cash flow (£000) | Discounted at 8% (£000) |
|---|---|---|
| 1 | 110 | 101.85 |
| 2 | 130 | 111.45 |
| 3 | 150 | 119.07 |
| 4 | 120 | 88.20 |
Total present value is £420,580, so NPV = 420.58 - 360 = +£60,580. A positive NPV means the project earns more than the discount rate.
Interpretation. Payback is simple and stresses risk, but ignores cash after payback and timing. ARR uses all the returns and can be compared with a target, but ignores timing. NPV allows for the time value of money, but depends on the discount rate and forecasts.
Factors influencing investment decisions are investment criteria (a maximum payback period, a minimum ARR or a positive NPV), non-financial factors (morale, brand, environment, strategic fit) and risk and uncertainty (forecasts can be wrong, more so the further ahead).
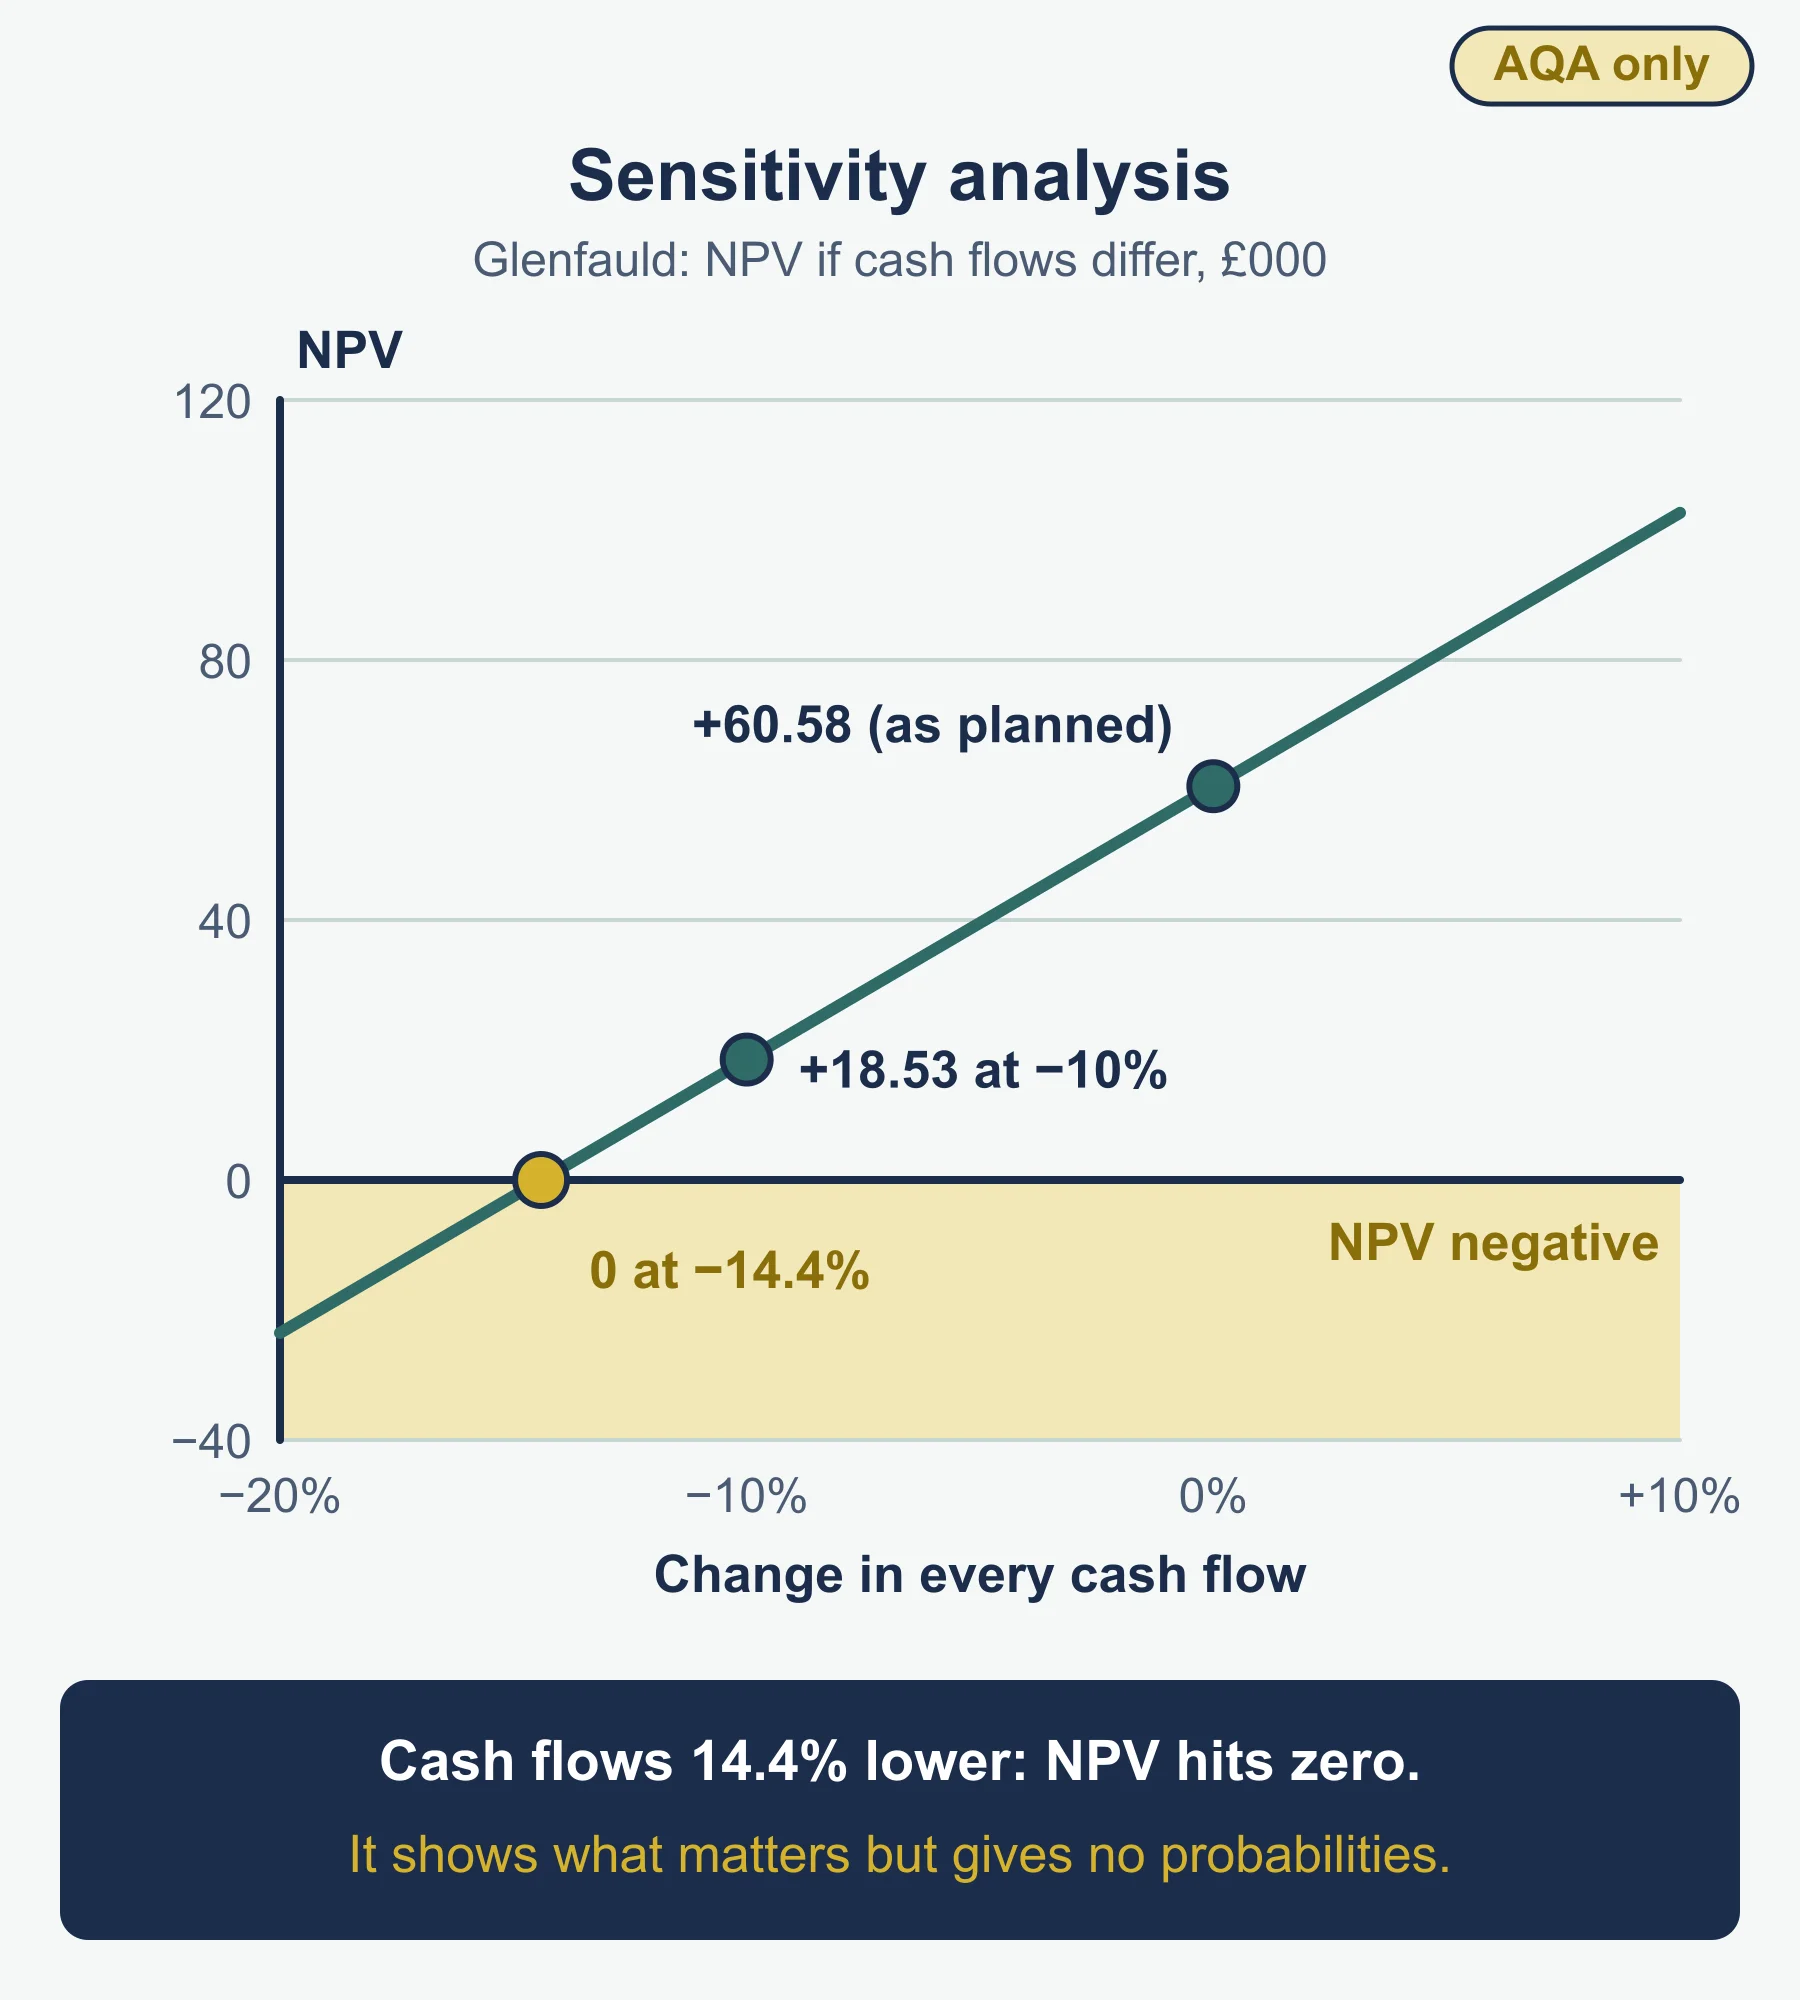
Sensitivity analysis changes one assumption at a time and shows the effect. If Glenfauld’s cash flows are all 10% lower, NPV falls to about £18,530; they would need to fall by about 14.4% before NPV reached zero. Its value is showing which forecasts matter most; its limit is that it gives no probabilities.
Common errors
- Using the wrong capital employed: it is equity plus non-current liabilities.
- Calling a ratio good or bad without a comparison.
- Forgetting to discount in NPV or to subtract the cost.
Frequently asked questions
What is the difference between a mission and corporate objectives? The mission is the broad purpose of the business: why it exists and what it stands for. Corporate objectives are measurable goals for the whole business that turn the mission into targets, and strategy then chooses how to reach them.
What is Elkington’s Triple Bottom Line? The Triple Bottom Line reports Profit, People and Planet: financial results, social impact on employees, the community and the supply chain, and environmental impact.
What does Porter’s five forces model assess? It assesses the profit potential of an industry through five forces: entry threat, buyer power, supplier power, rivalry and substitute threat. Weak forces mean higher profit potential.
What are the limitations of financial ratios? Ratios use past data, depend on accounting policies and ignore non-financial factors, so they are best used alongside data such as the Balanced Scorecard and compared over time or with rivals.
Which section of the AQA Business specification covers the strategic position of a business? Section 3.7, Analysing the strategic position of a business, which is A-level only in AQA AS and A-level Business (7131 and 7132) and is examined in 7132.
Official syllabus
AQA, AS and A-level Business (7131 and 7132) specification, section 3.7 (A-level only).
Get free revision emails (optional)
Occasional emails with practice questions, worked explanations and links to free resources for the qualification and subjects you choose. No spam, and you can unsubscribe from any email. The free tools on this site never need an email.
Related resources
-
Practice questions
AQA A-Level Business: Analysing the strategic position of a business (7132) – Practice Questions
Original AQA A-Level Business 7132 practice questions on topic 7, with worked answers: ratios, models, external change and investment appraisal.
Business · AQA · A Level
Try questions -
Revision notes
AQA A-Level Business: Analysing the strategic position of a business (7132) – Revision Notes
Condensed AQA A-Level Business 7132 revision notes on topic 7: formulas, models, definitions and a self-test covering all eight sections.
Business · AQA · A Level
Revise topic -
Study guides
AQA A-Level Business: Choosing strategic direction (7132)
Study guide to AQA A-Level Business 7132 topic 8: Ansoff matrix, Porter's generic strategies, Bowman's strategic clock and competitive advantage.
Business · AQA · A Level
Read guide
Related articles
-
teaching
A Level tuition in Dubai: Cambridge or Pearson Edexcel International A Level?
Schools in Dubai and Abu Dhabi teach either Cambridge International AS & A Level or Pearson Edexcel International A Level. How the two are structured, why it matters for tuition, and how online classes from Lahore work.
9 October 2026
-
curriculum guides
Choosing subjects at IGCSE and A Level
How subject choices at 14 and 16 affect university options later, and how to keep pathways open without overloading a timetable.
28 July 2026
Studying this with a teacher
Working through Business A LEVELS?
This page is free and stays free. If you would rather be taught it, Marlbridge runs Business classes one-to-one and in small groups of up to 15, online in your own time zone. The first trial class is free. WhatsApp replies within an hour (8am–11pm Pakistan time, every day); email the same day.
AQA Business teachers at Marlbridge
