
Study Guides
OxfordAQA A-Level Business: The external environment (9625/9725)
A worked study guide to market conditions, barriers to entry, and the effects of incomes, interest and exchange rates, input costs and competition.
- Subject
- Business
- Level
- AS LEVEL
- Topic
- What is business?
- Author
- Marlbridge Academic Team
- Updated
- Reviewed by
- Salman Ahmad (what this means)
Aligned to OxfordAQA A Level Business (9625, 9725), 9625: first teaching September 2018 (current cohorts). 9725: first teaching September 2026 (AS) / September 2027 (A2), the successor specification.. Official specification .
Syllabus page (what it covers and how it is assessed): OxfordAQA A Level Business.
Found an error? Report a correction.
Need help with this topic? Request a free trial class for A Level Business (9625 / 9725).
This guide teaches section 3.1.1.3, The external environment, from the OxfordAQA International AS and A-level Business specification (9725; the 9625 code covers the current cohorts). It sits in the “What is business?” topic and covers two blocks: market conditions, and the effect of changes in the external business environment. The wording used here is the 9725 document; the 9625 text differs in places (see Official syllabus at the end, and section 5.6 for the 9625-only points). All businesses and figures below are invented for practice.
Related: the topic-level study guide, revision notes and practice paper for the whole topic, plus this unit’s revision notes and practice questions. Course hub: OxfordAQA A-level Business. Printable list: checklist. Not sure where to start? Try the free diagnostics.
What the section asks you to do
Calculate and interpret market size (volume and value), growth or decline, market share and the four firm concentration ratio; explain five barriers to entry and the effect of high or low barriers; explain how market conditions affect demand, decisions and profits; and explain the effect of changes in incomes (normal and inferior goods, YED), interest rates, exchange rates, input costs and competition.
1. Market size, growth and share
Market size can be measured two ways. Volume counts units sold (loaves, bikes, tonnes). Value is sales revenue in the market, which is volume multiplied by average price.
Market growth or decline is the percentage change in size between two periods:
growth (%) = (new size - old size) / old size × 100
A negative answer is market decline. Volume and value can move differently, so say which you use.
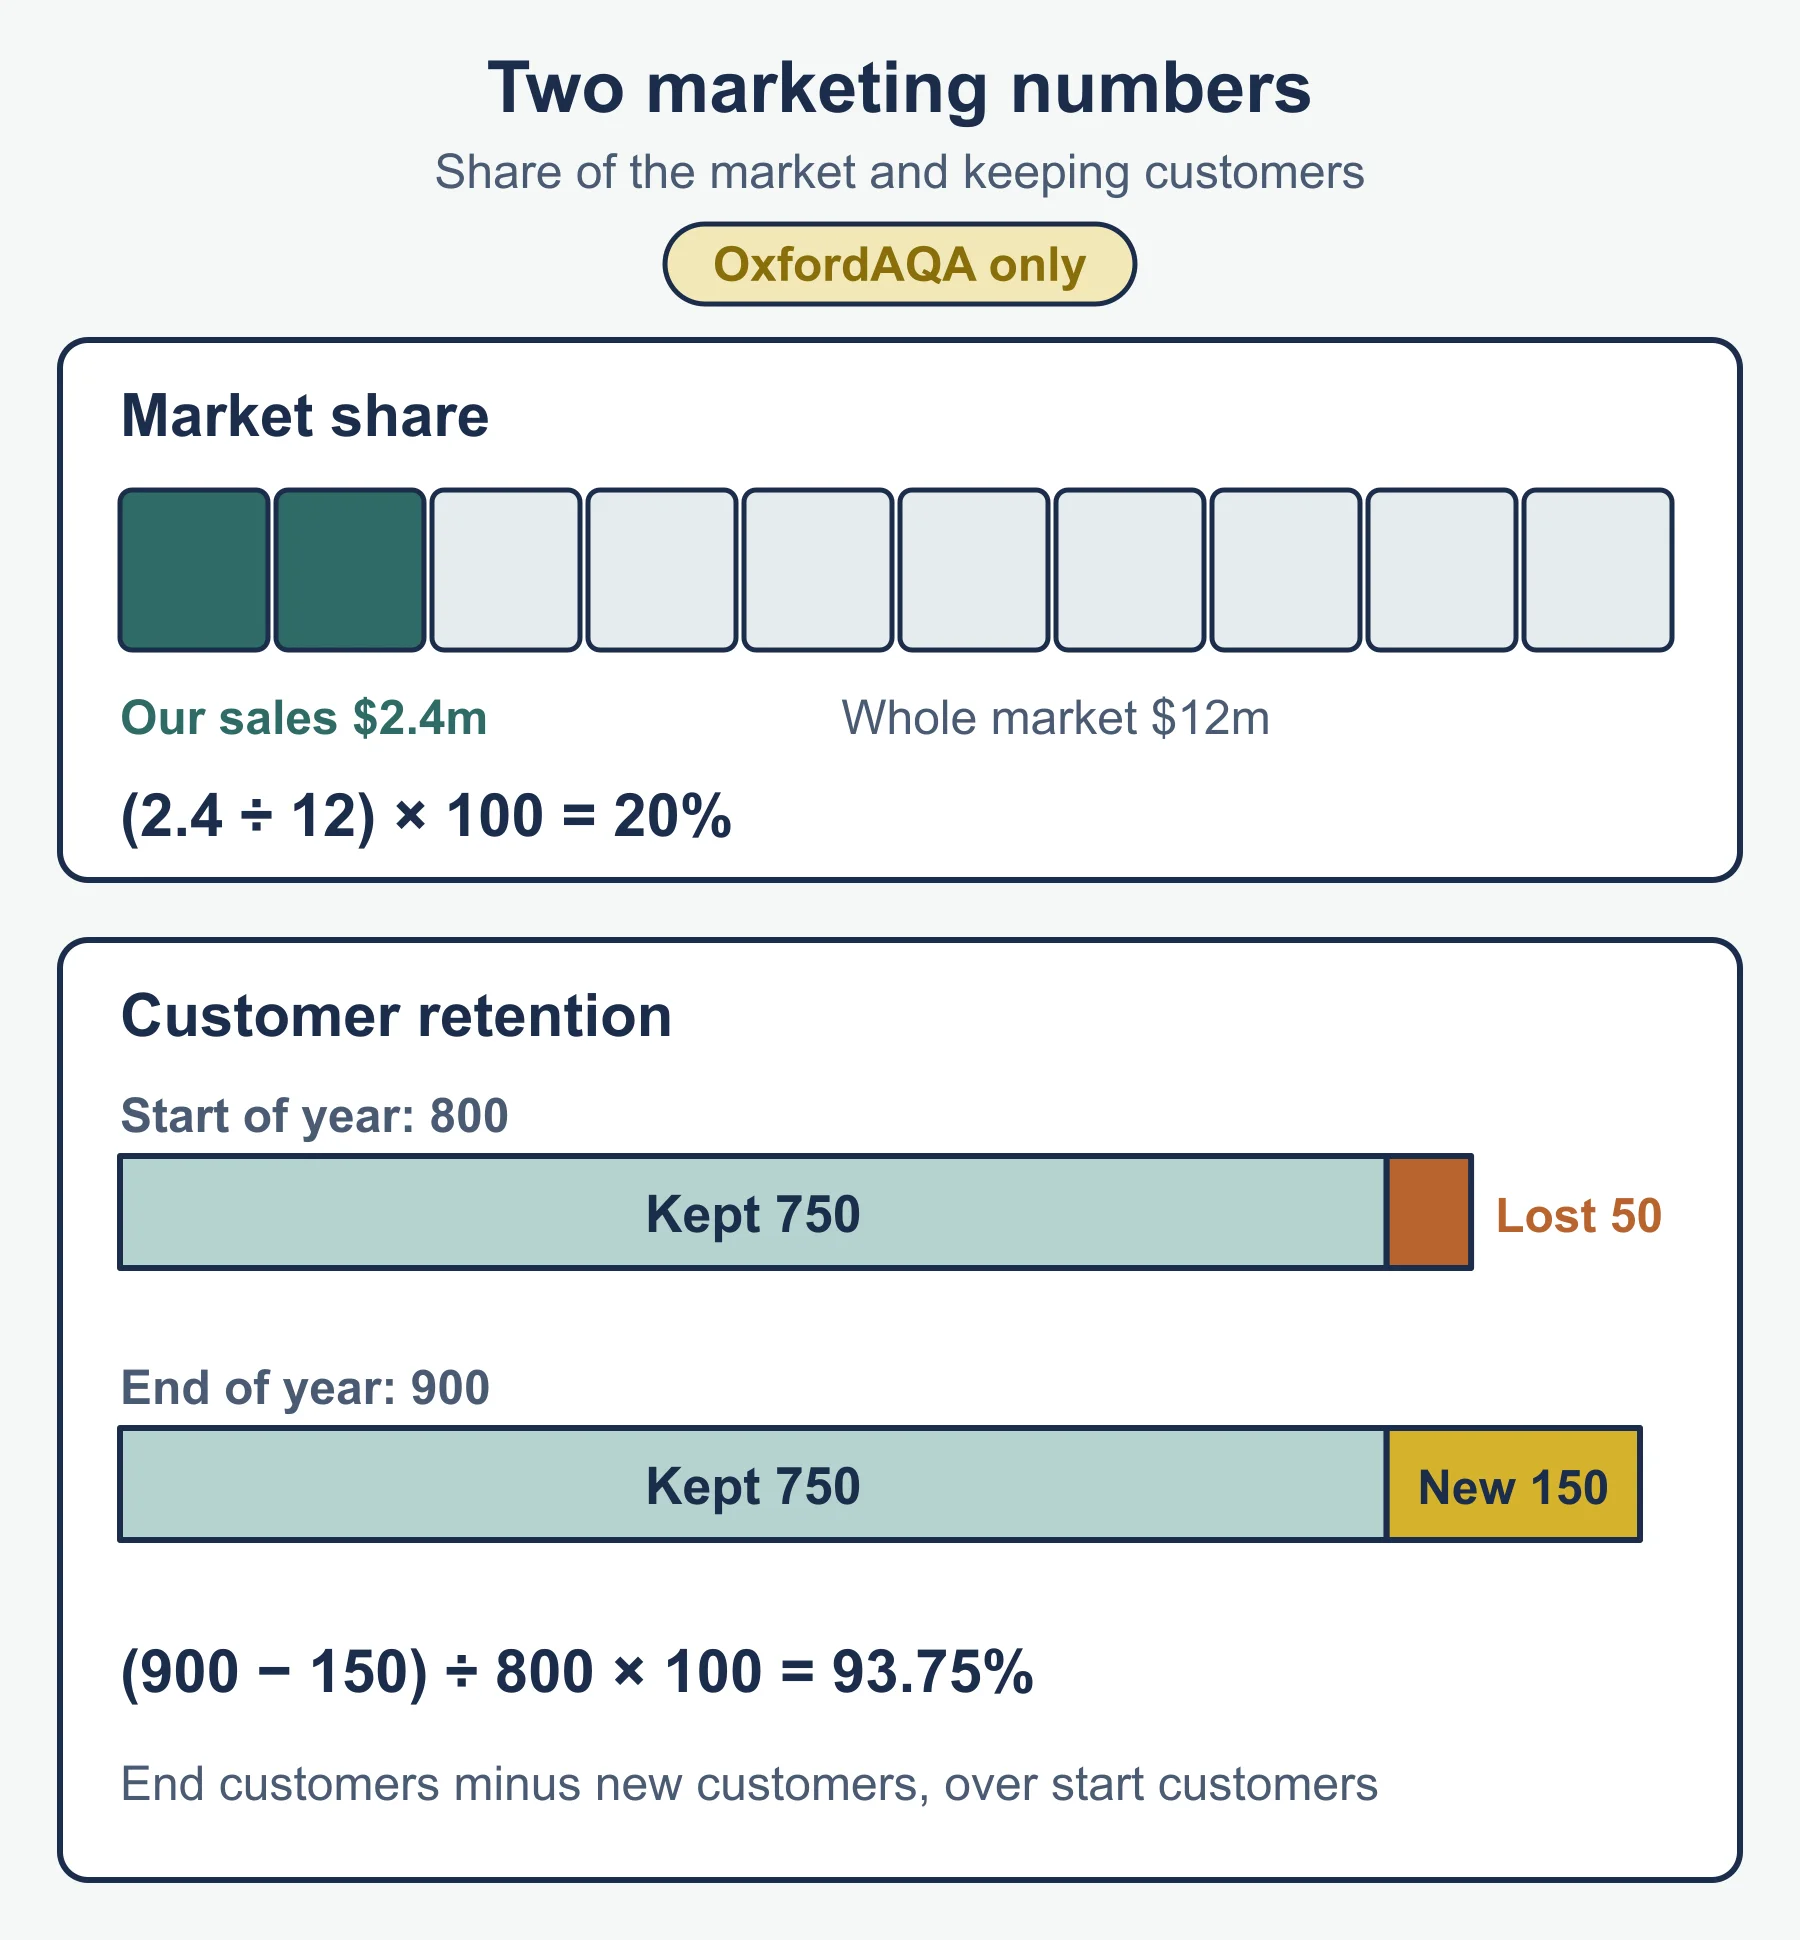
Market share shows how large one business is within its market:
market share (%) = business sales / total market sales × 100
Use the same measure on top and bottom: sales value over market value, or units over market volume.
Worked example 1: the bread market
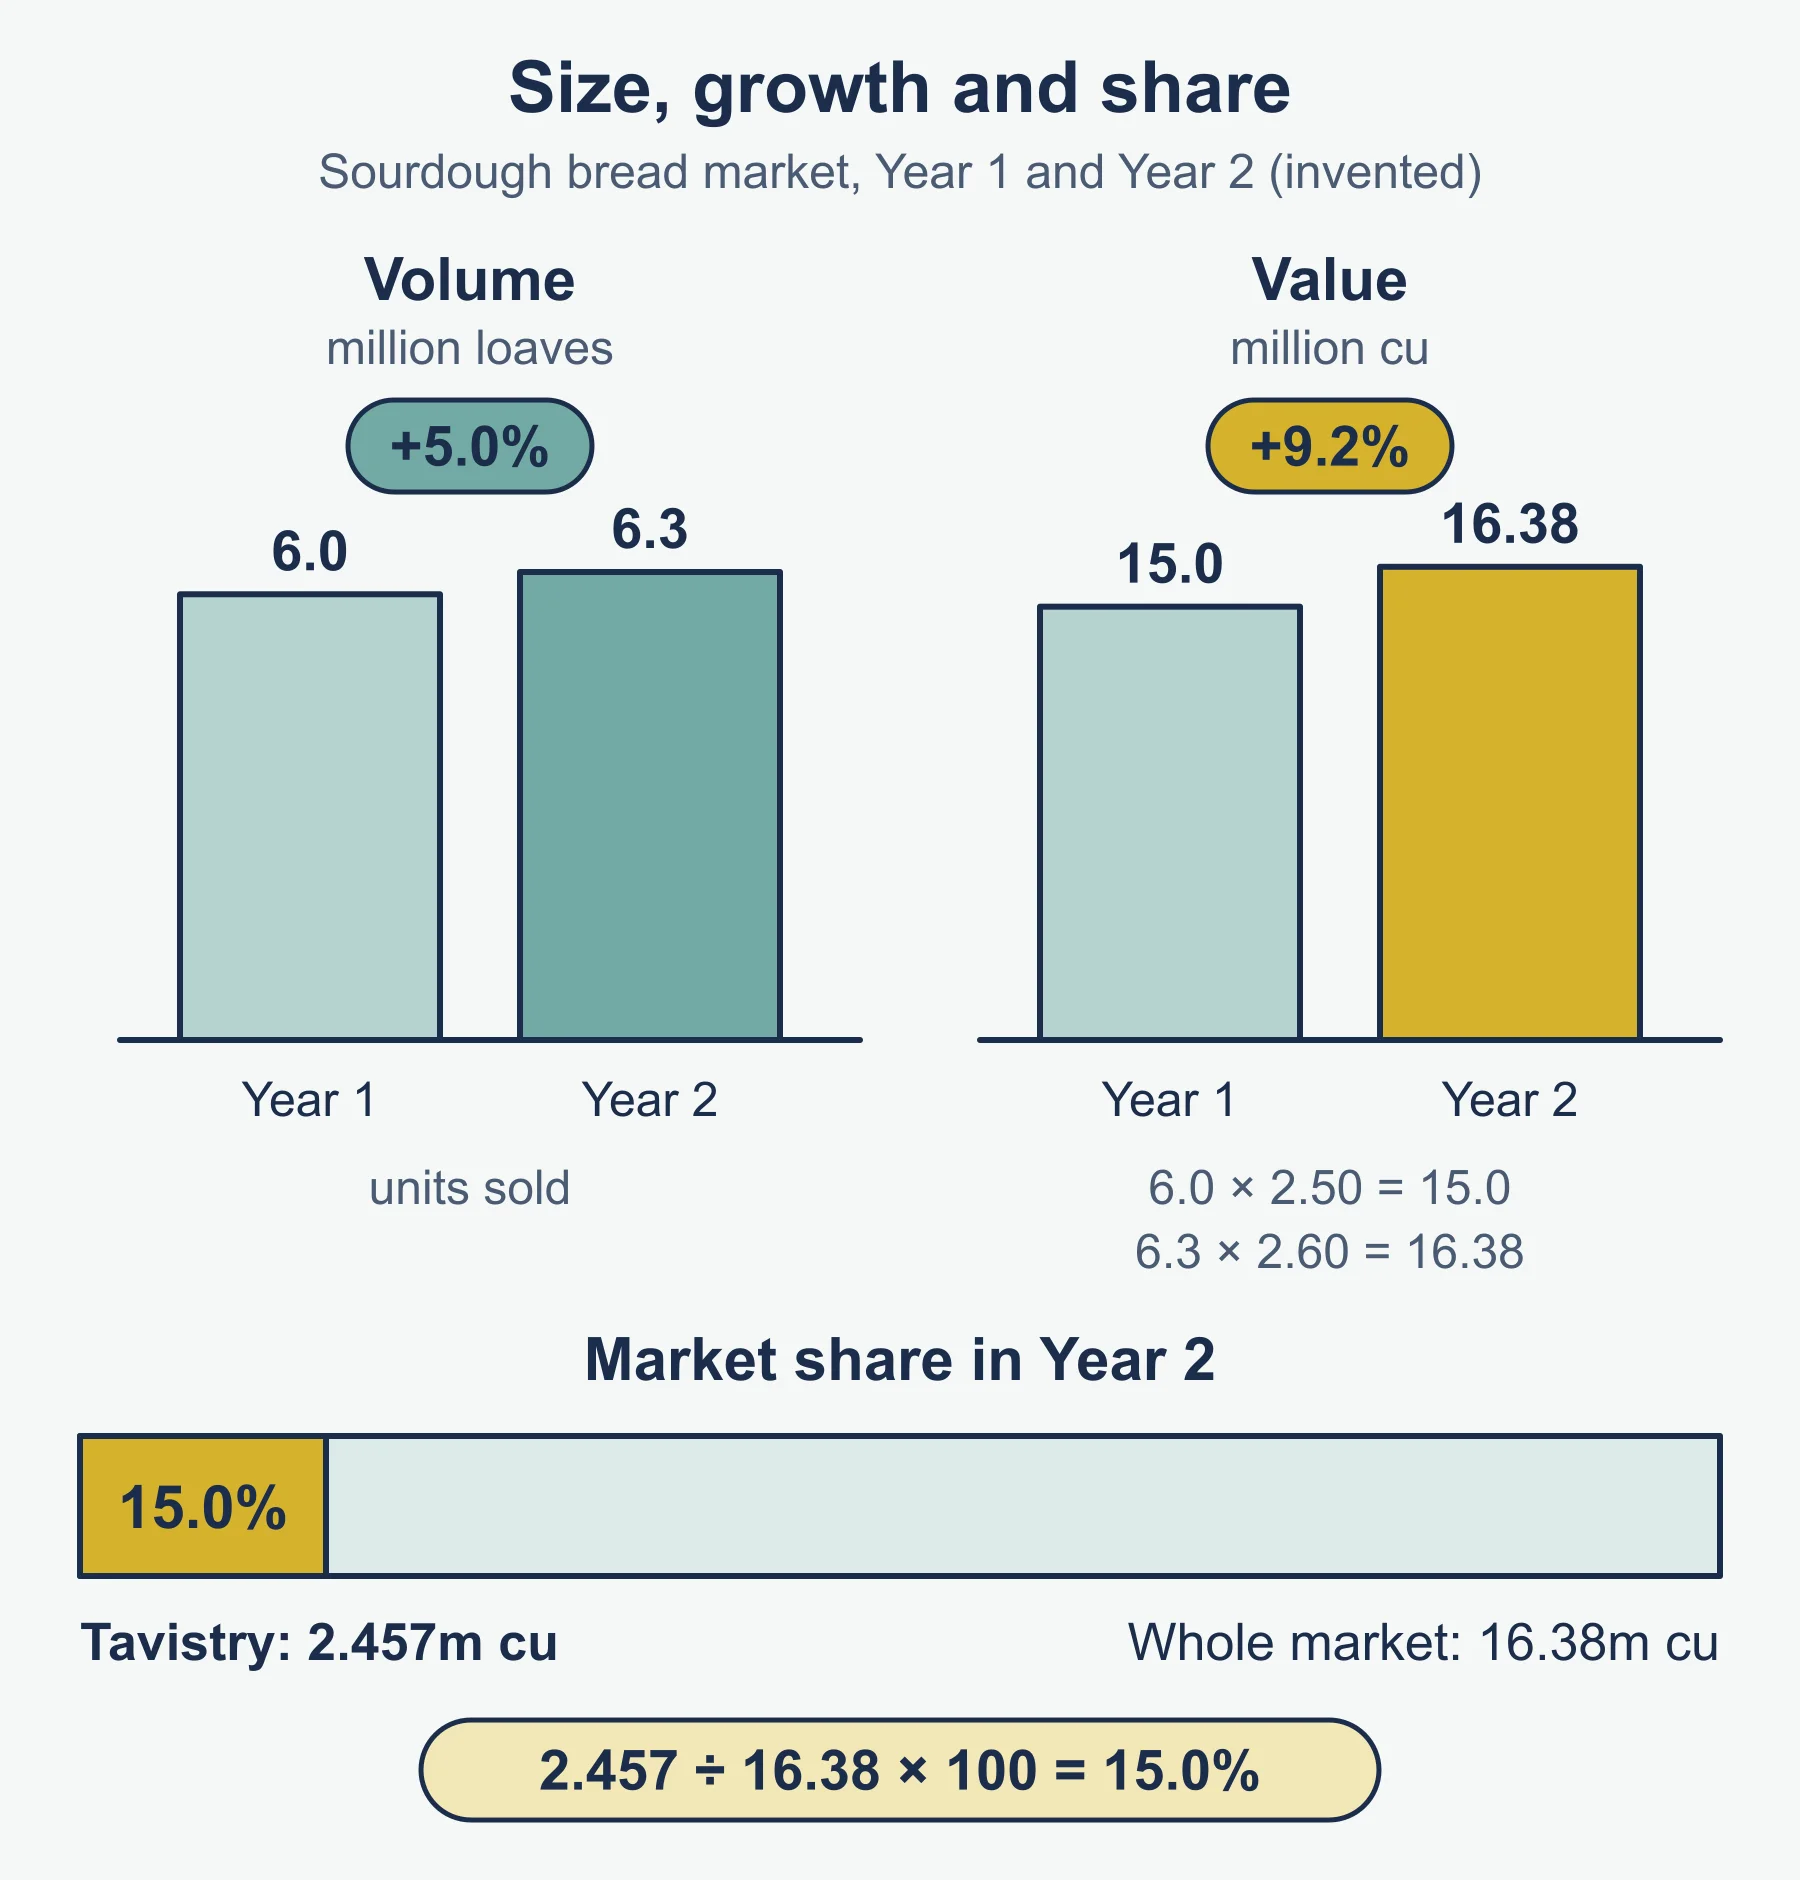
The sourdough bread market in one city sells 6.0 million loaves in Year 1 at an average price of 2.50 currency units (cu), and 6.3 million loaves in Year 2 at an average price of 2.60 cu. Tavistry Bakehouse’s Year 2 sales revenue is 2.457 million cu.
Step 1, Year 1 value: 6.0m × 2.50 = 15.0m cu. Step 2, Year 2 value: 6.3m × 2.60 = 16.38m cu. Step 3, volume growth: (6.3 - 6.0) / 6.0 × 100 = 5.0%. Step 4, value growth: (16.38 - 15.0) / 15.0 × 100 = 9.2%. Step 5, Tavistry’s market share: 2.457 / 16.38 × 100 = 15.0%.
Interpretation: value grew faster than volume (9.2% against 5.0%) because the average price also rose, so volume alone understates the growth in sales revenue. A 15.0% share makes Tavistry a significant player that does not dominate.
2. Four firm concentration ratio
The four firm concentration ratio adds the market shares of the four largest firms.
Worked example 2: the electric bike market
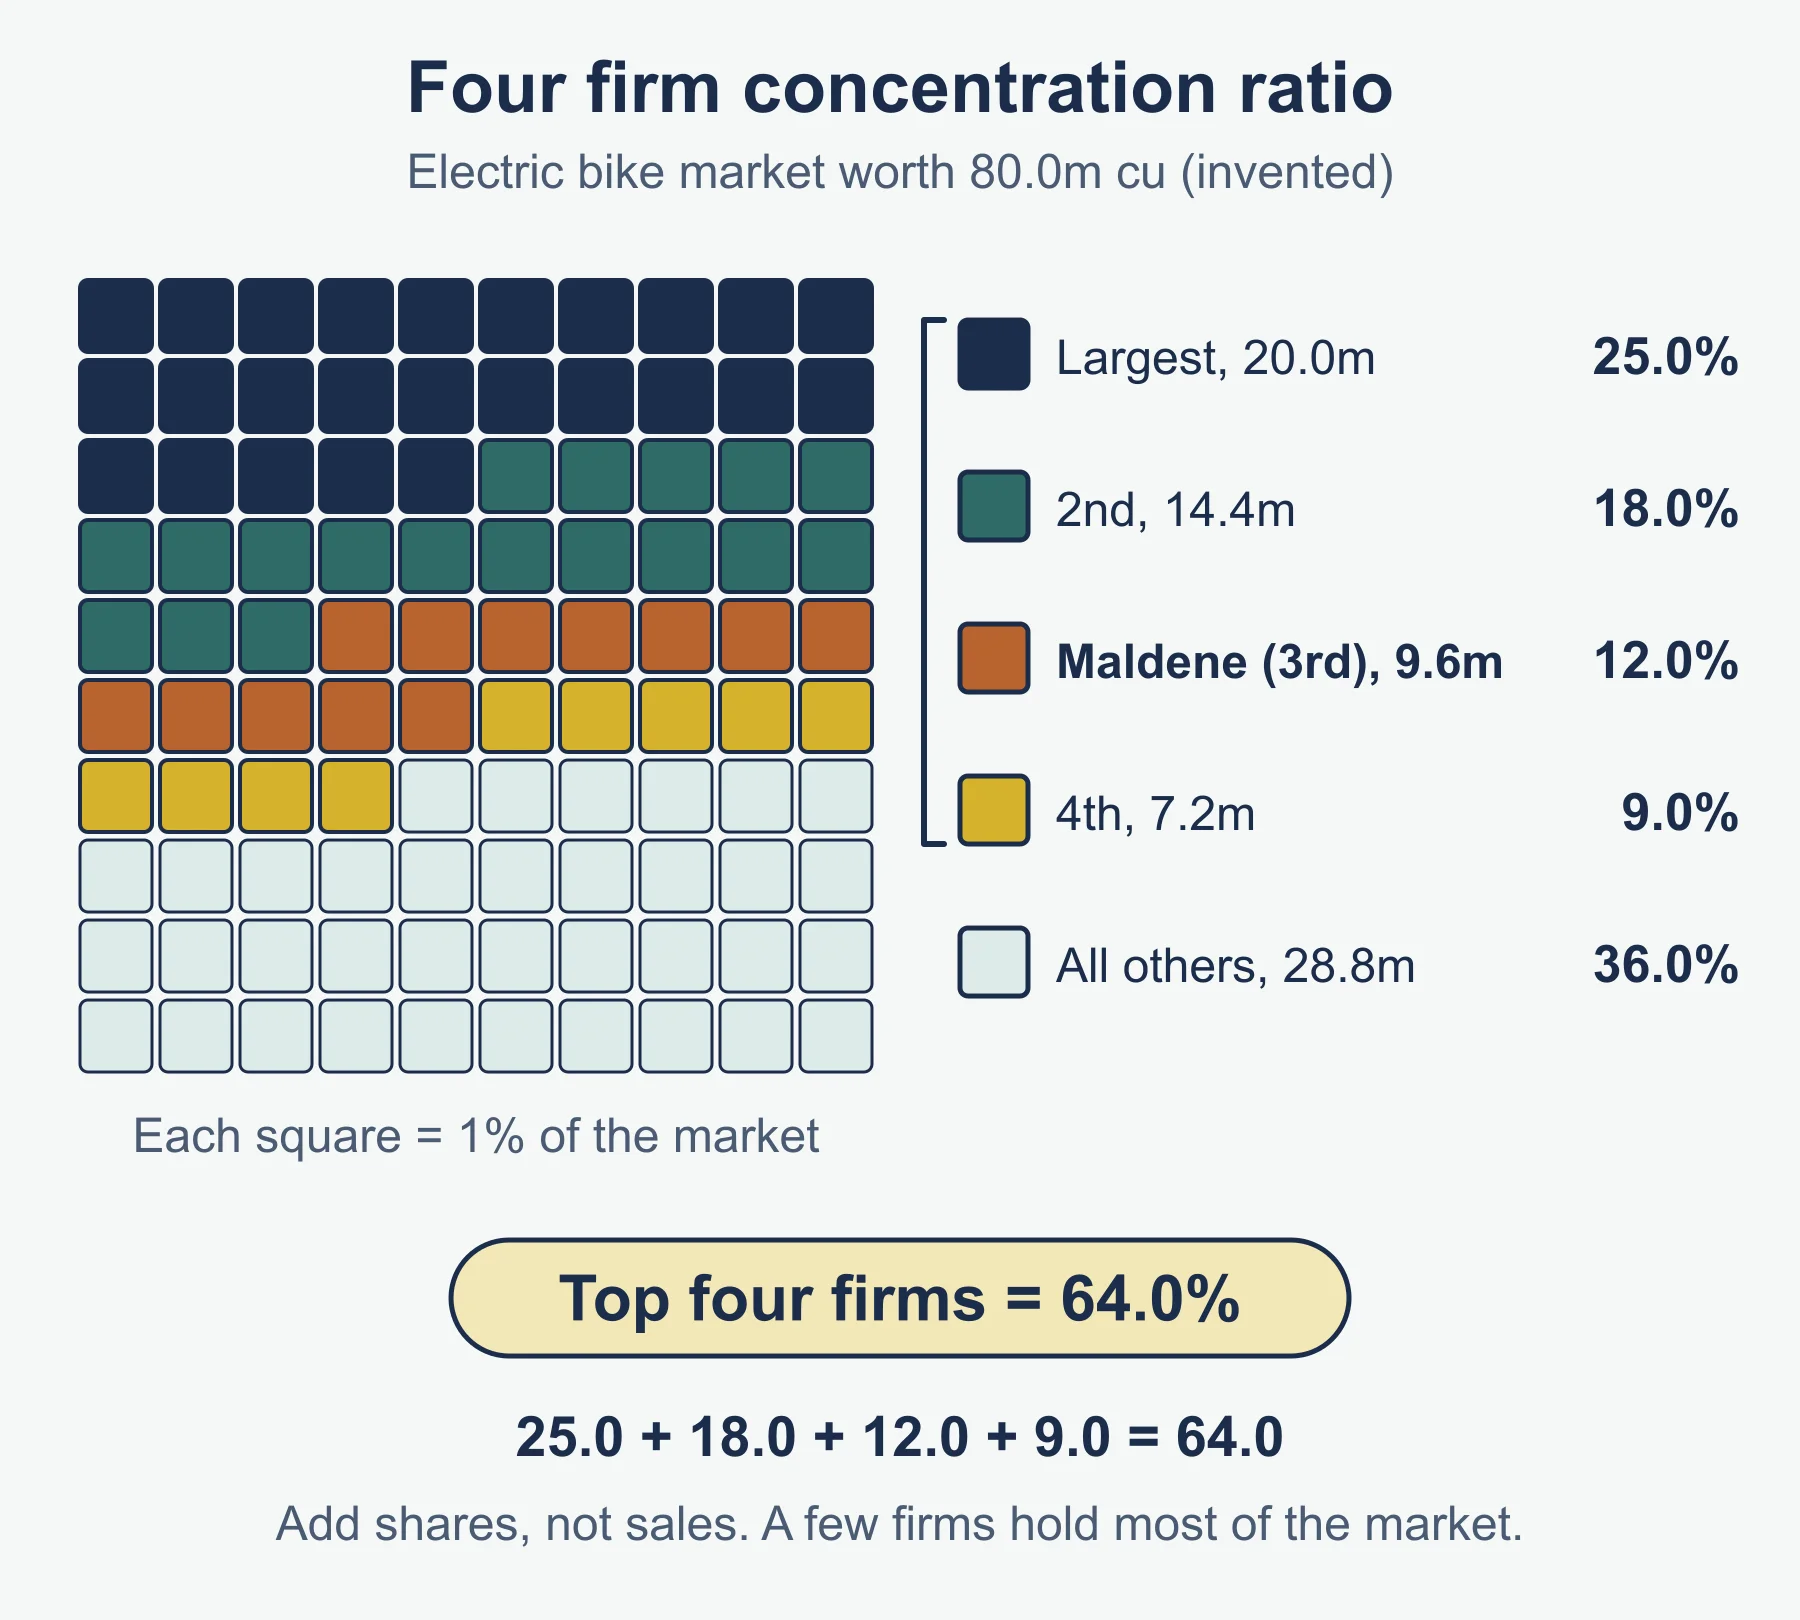
Maldene Cycles competes in a market worth 80.0m cu. The largest firms have sales of 20.0m, 14.4m, 9.6m and 7.2m cu. Maldene is the third largest.
Step 1, shares: 20.0/80 = 25.0%; 14.4/80 = 18.0%; 9.6/80 = 12.0%; 7.2/80 = 9.0%. Step 2, ratio: 25.0 + 18.0 + 12.0 + 9.0 = 64.0%. Step 3, all other firms share the remaining 36.0%.
Interpretation: 64% means a few firms hold most of the market, which may point to higher barriers or scope to influence price. It does not by itself show how fiercely they compete.
3. Barriers to entry
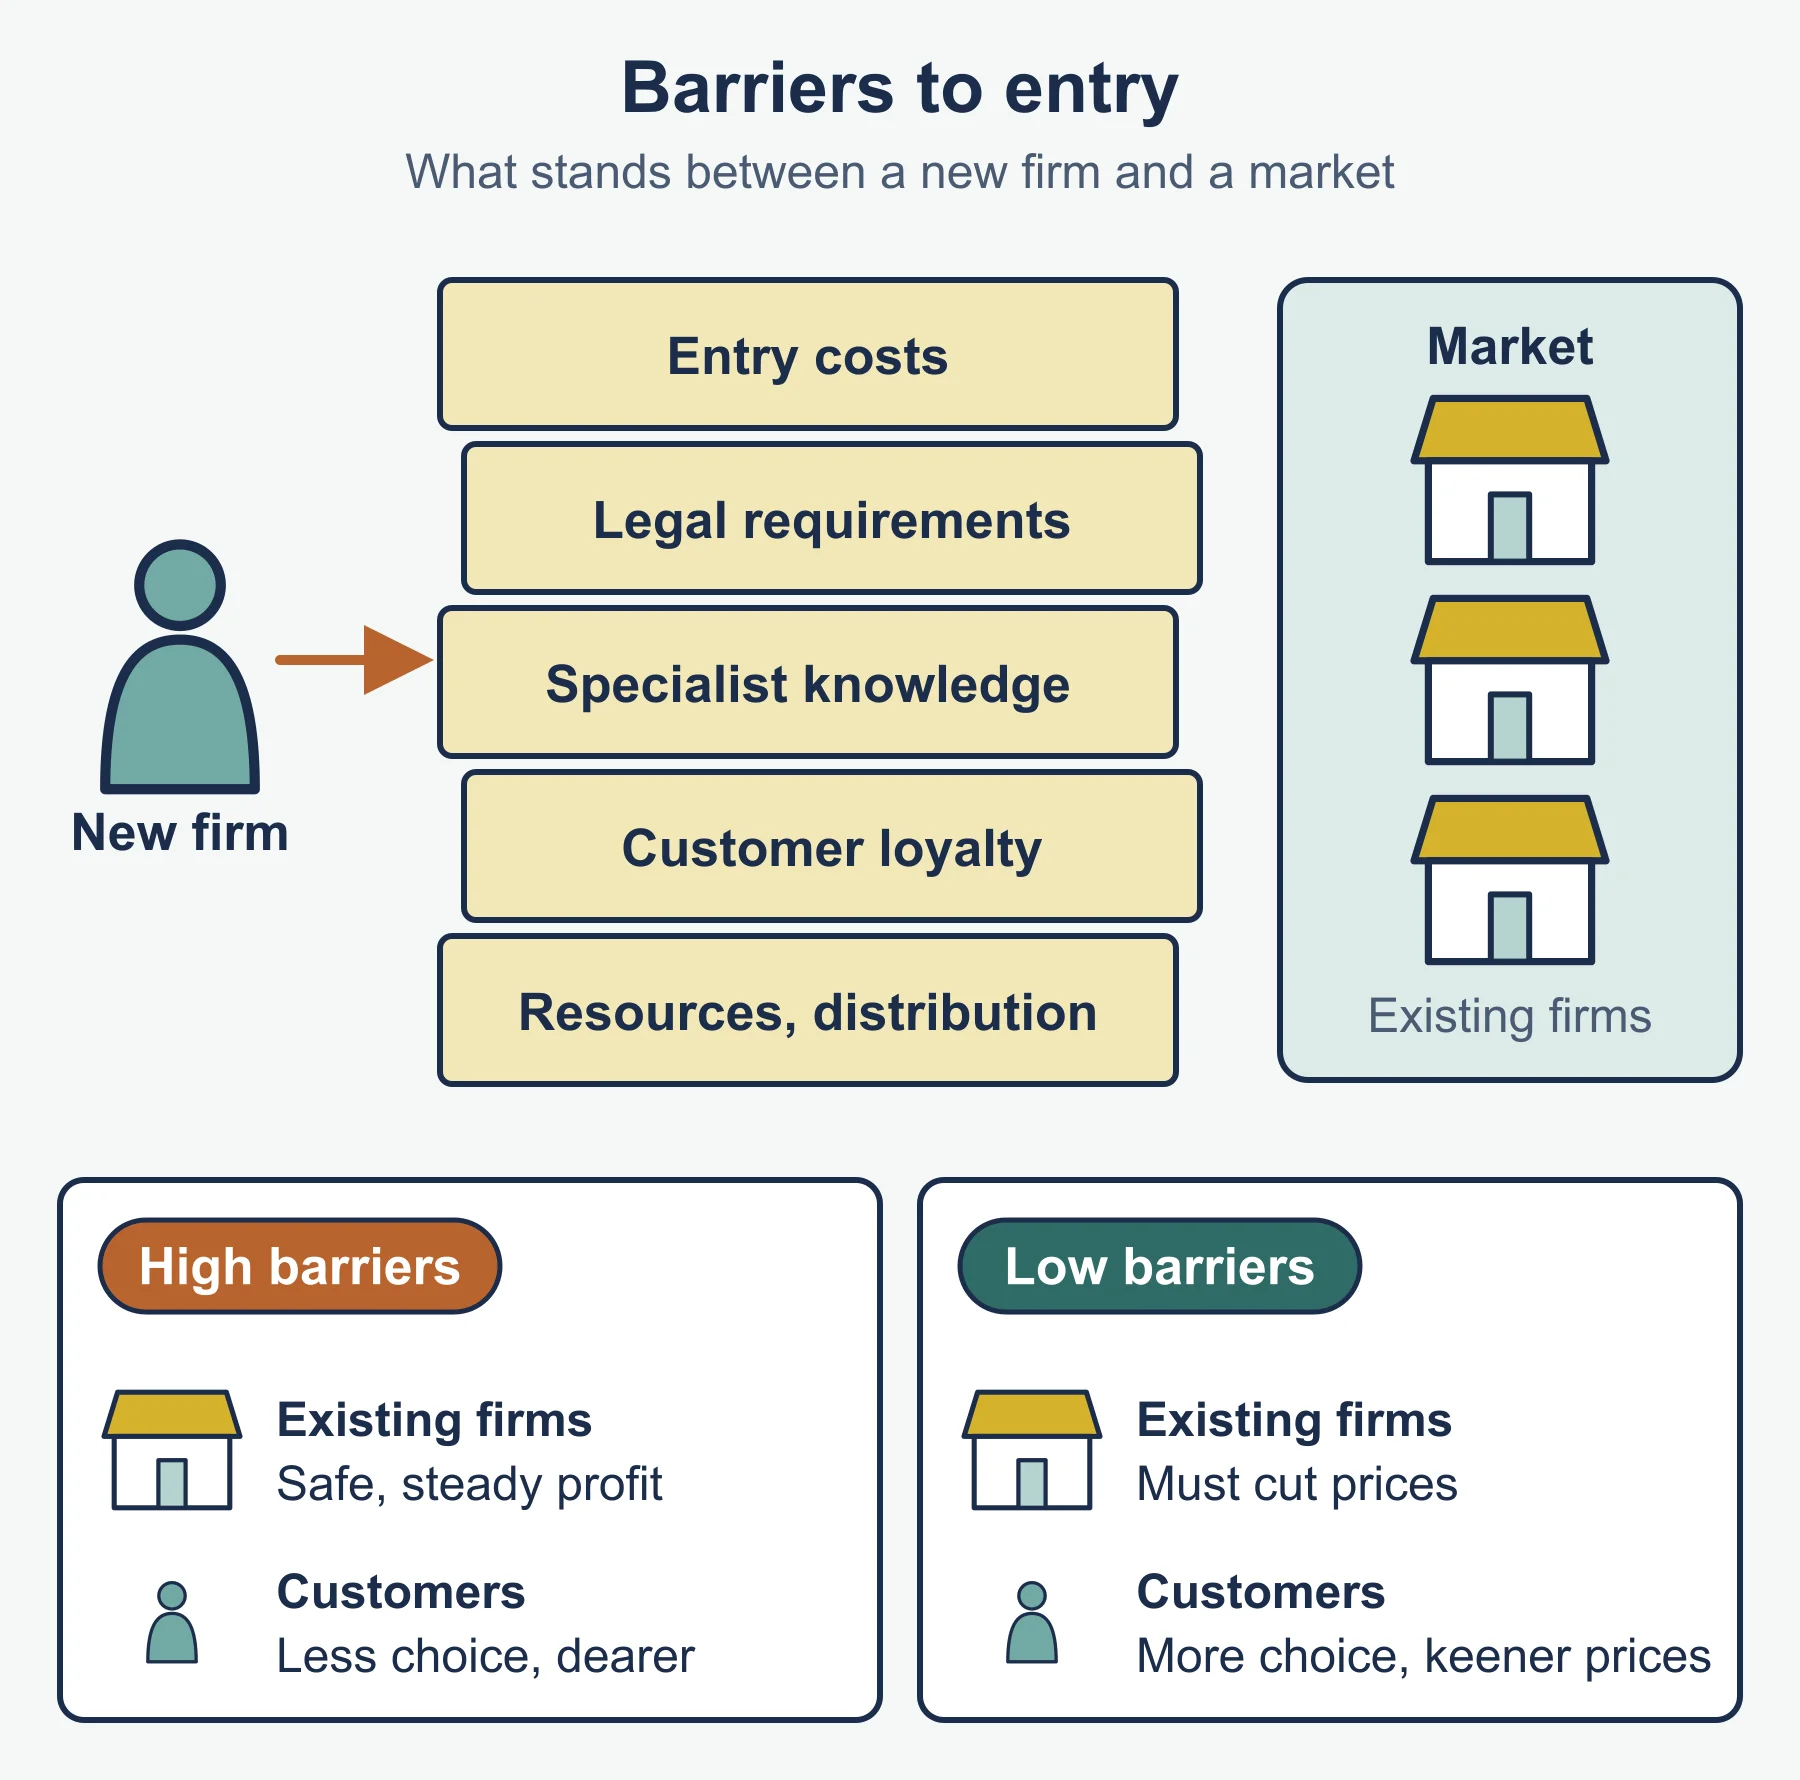
A barrier to entry is anything that makes it hard or costly for a new business to enter a market. The specification lists five.
- Entry costs: premises, machinery, stock and launch marketing.
- Legal requirements: licences, permits, safety rules or professional registration that must be met before trading.
- Specialist knowledge: skills or expertise that take years to build.
- Loyalty to existing businesses: customers who stay with brands they know, so a newcomer must spend heavily to win them over.
- Access to resources or distribution: a new firm may be unable to secure scarce raw materials, or shelf space and delivery routes already tied up by established rivals.
Effect of high or low barriers
| High barriers | Low barriers | |
|---|---|---|
| Existing businesses | Protected from new rivals; more stable share and profit; less pressure to cut price or innovate | Always exposed to new entrants; must keep prices down and keep improving; profit can be competed away |
| Customers | Less choice; prices may be higher; less pressure on quality | More choice; keener prices; businesses are pushed to improve quality and service |
4. Market conditions and their impact
Market conditions describe how competitive, crowded and fast changing a market is. They affect demand, business decisions (price, range, investment) and profits.
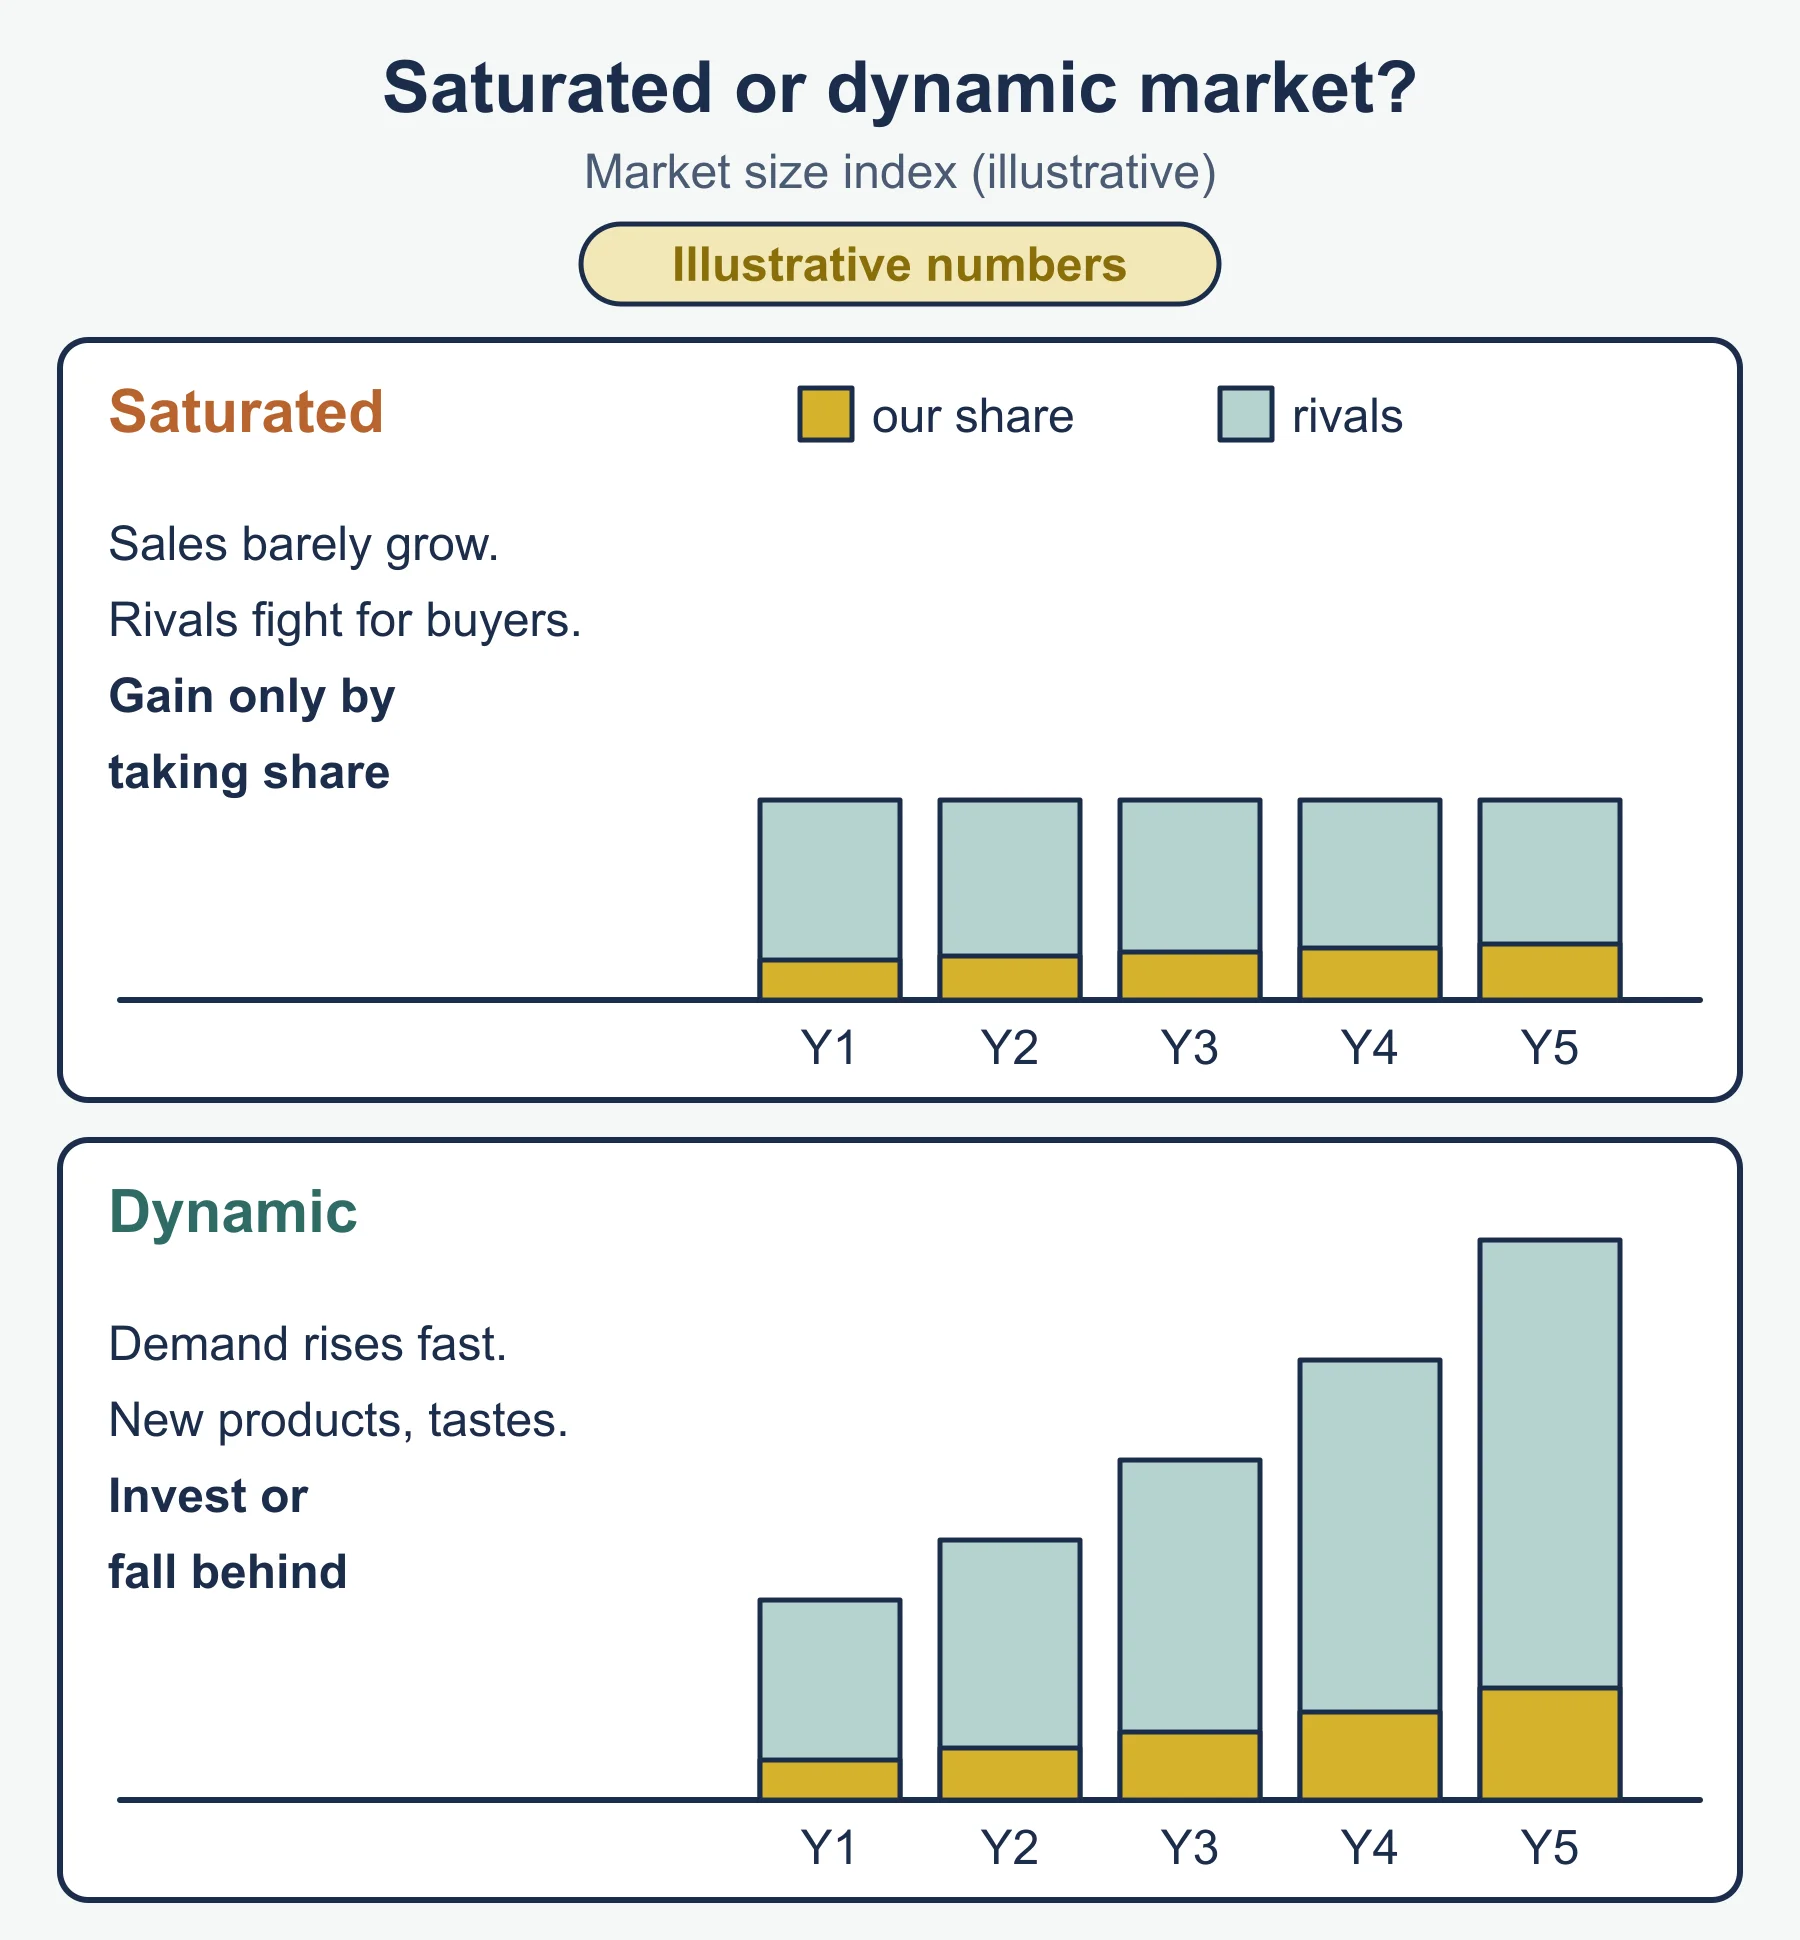
- Saturated market: most potential customers already buy the product, so total sales barely grow. A firm can grow only by taking share from rivals. Decisions lean toward differentiation, promotion or cost cutting, and profit is squeezed if rivals cut price.
- Dynamic market: it changes quickly, with new products, technology or customer tastes and often fast growth. Demand can rise rapidly, but so can the risk of falling behind. Decisions lean toward investing in innovation and capacity.
5. The external business environment
The external business environment is everything outside the firm that affects it. A change can affect four things: costs (what the firm pays), demand (what customers buy), decisions (what managers choose to do) and profits (the result of the first two).
5.1 Incomes: normal and inferior goods, and YED
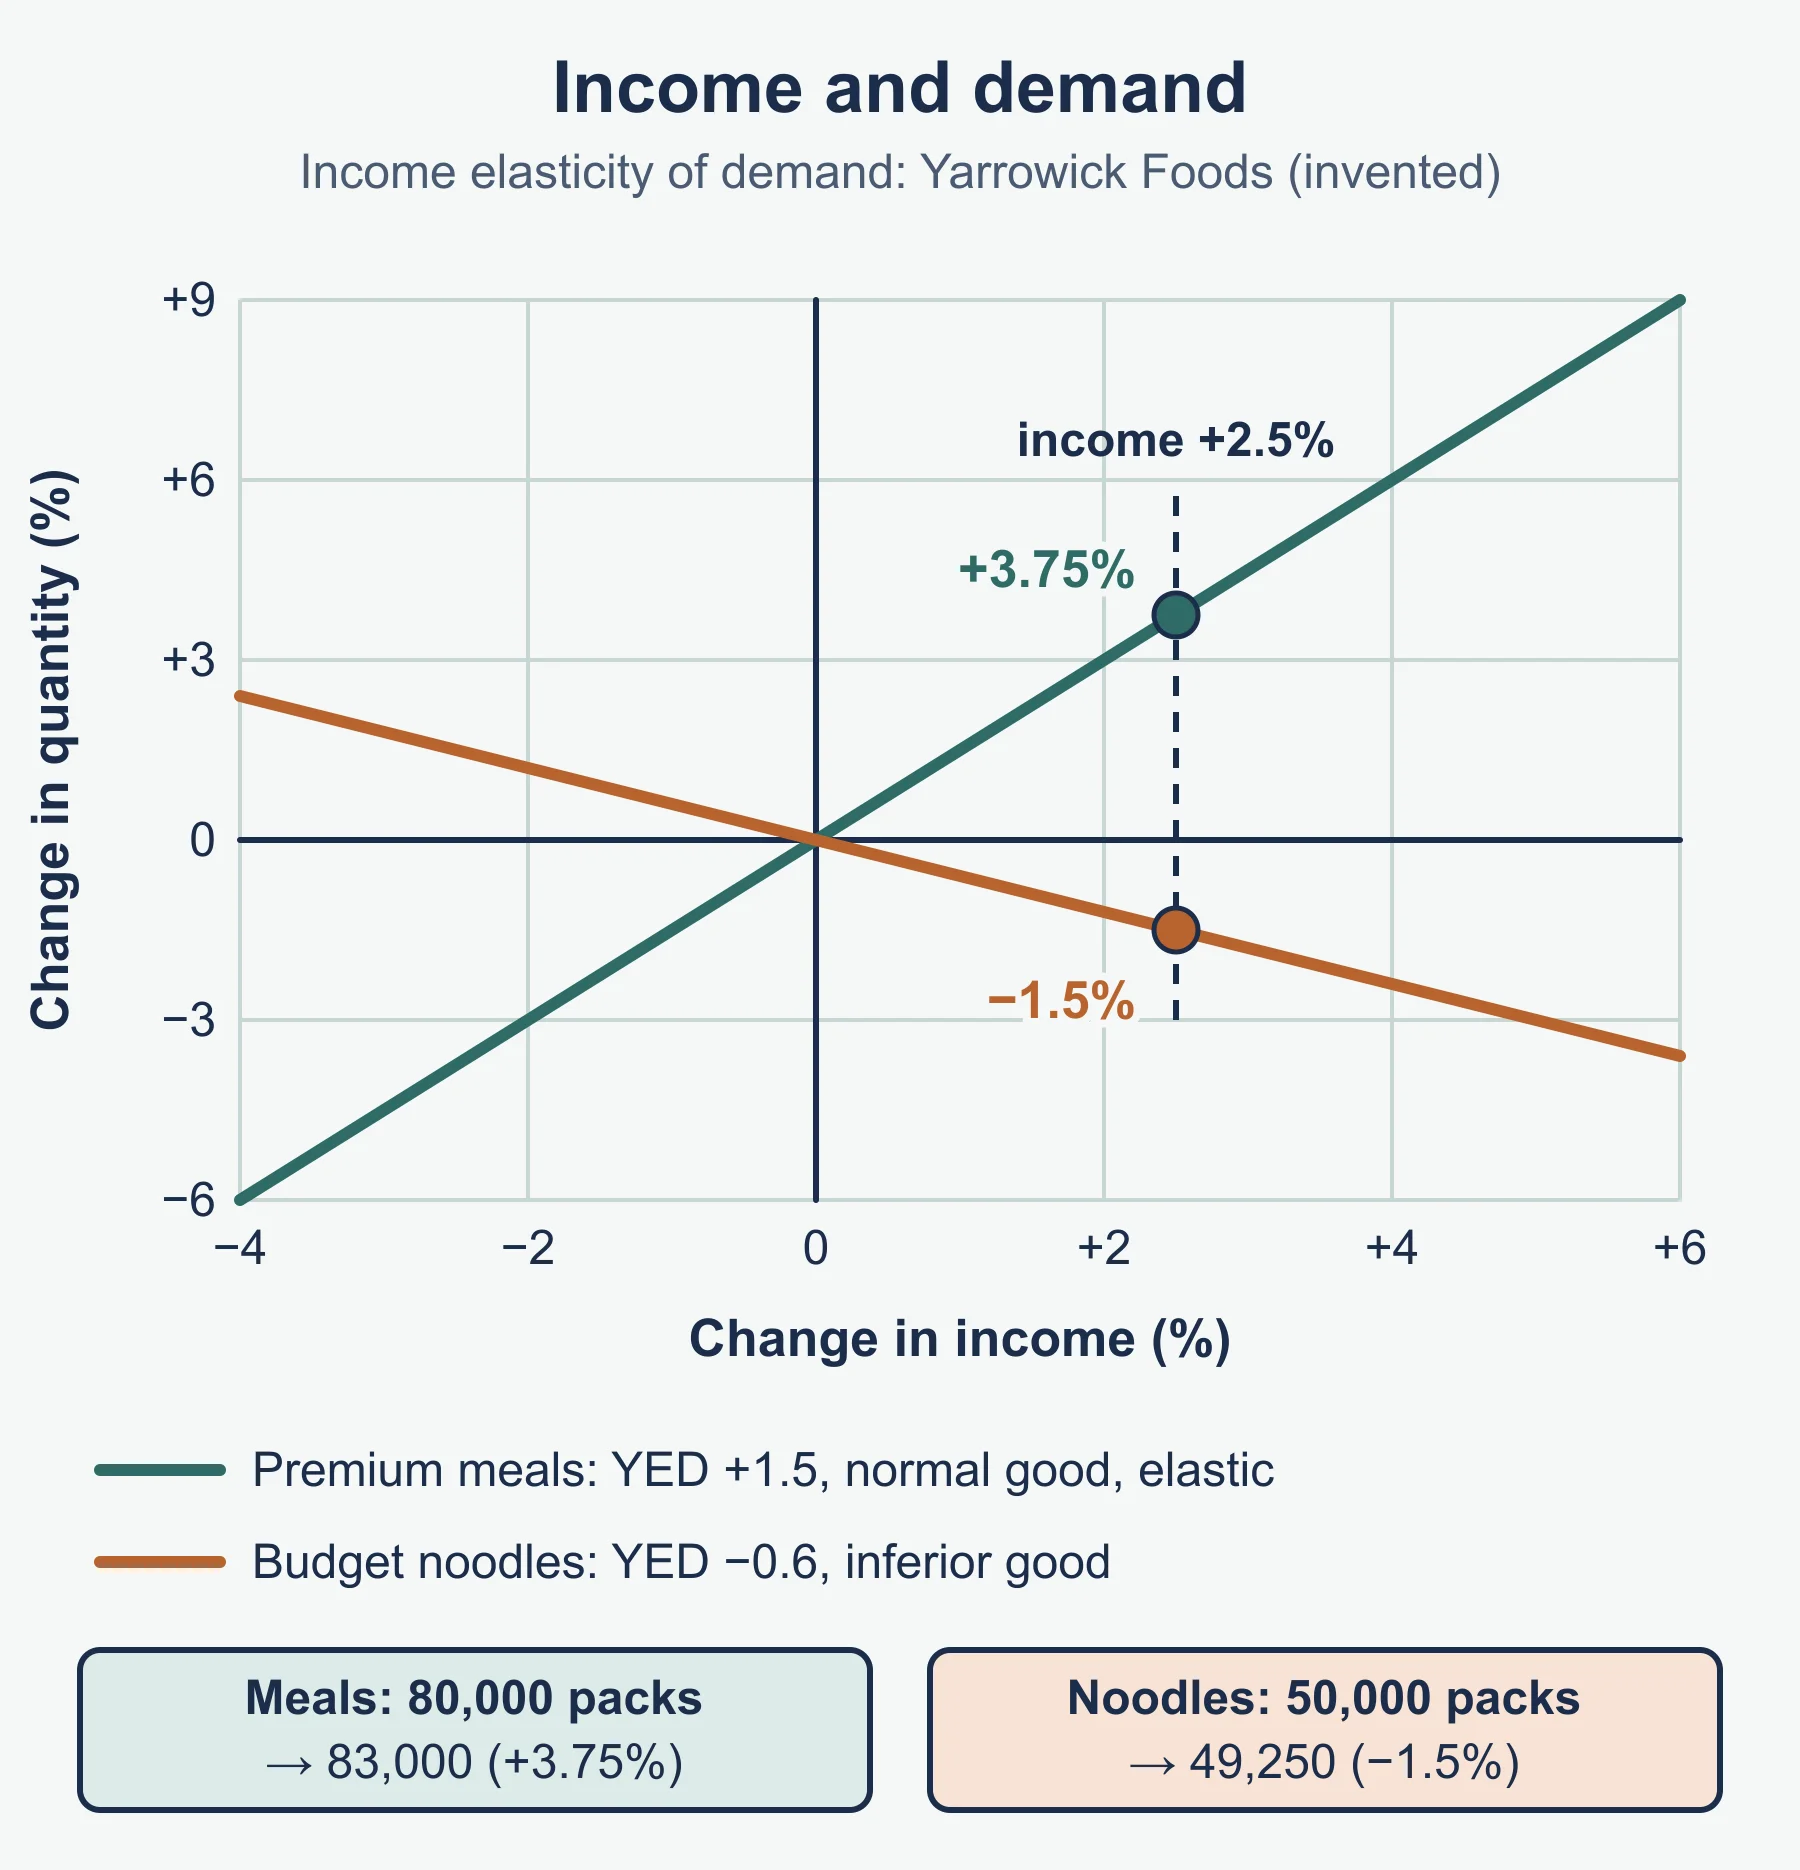
- A normal good is one whose demand rises when incomes rise (and falls when incomes fall). Its YED is positive.
- An inferior good is one whose demand falls when incomes rise (and rises when incomes fall). Its YED is negative.
Income elasticity of demand (YED) measures how responsive quantity demanded is to a change in income:
YED = % change in quantity demanded / % change in income
A normal good with YED above 1 is income elastic: demand rises by a larger percentage than income. A normal good with YED between 0 and 1 is income inelastic.
To find the change in quantity demanded when YED is known, rearrange:
% change in quantity demanded = YED × % change in income
Worked example 3: ready meals and budget noodles
Yarrowick Foods records that average household income in its main market rose from 24,000 cu to 25,200 cu, and sales of its premium ready meals rose from 40,000 to 43,000 packs.
Step 1, income change: (25,200 - 24,000) / 24,000 × 100 = 5.0%. Step 2, quantity change: (43,000 - 40,000) / 40,000 × 100 = 7.5%. Step 3, YED = 7.5 / 5.0 = +1.5. Positive, so a normal good, and above 1 so income elastic.
Forecast: Yarrowick expects incomes to rise 2.5% next year. Premium meals sell 80,000 packs a year at present, with the same YED of +1.5.
Step 4, % change in quantity = 1.5 × 2.5 = 3.75%. Step 5, new quantity = 80,000 × 1.0375 = 83,000 packs.
Yarrowick’s budget noodles have a YED of -0.6 and sell 50,000 packs.
Step 6, % change = -0.6 × 2.5 = -1.5%. Step 7, new quantity = 50,000 × 0.985 = 49,250 packs.
If incomes fell 3%, premium meals would fall 4.5% and noodles rise 1.8%, so a mixed range is partly protected.
5.2 Interest rates
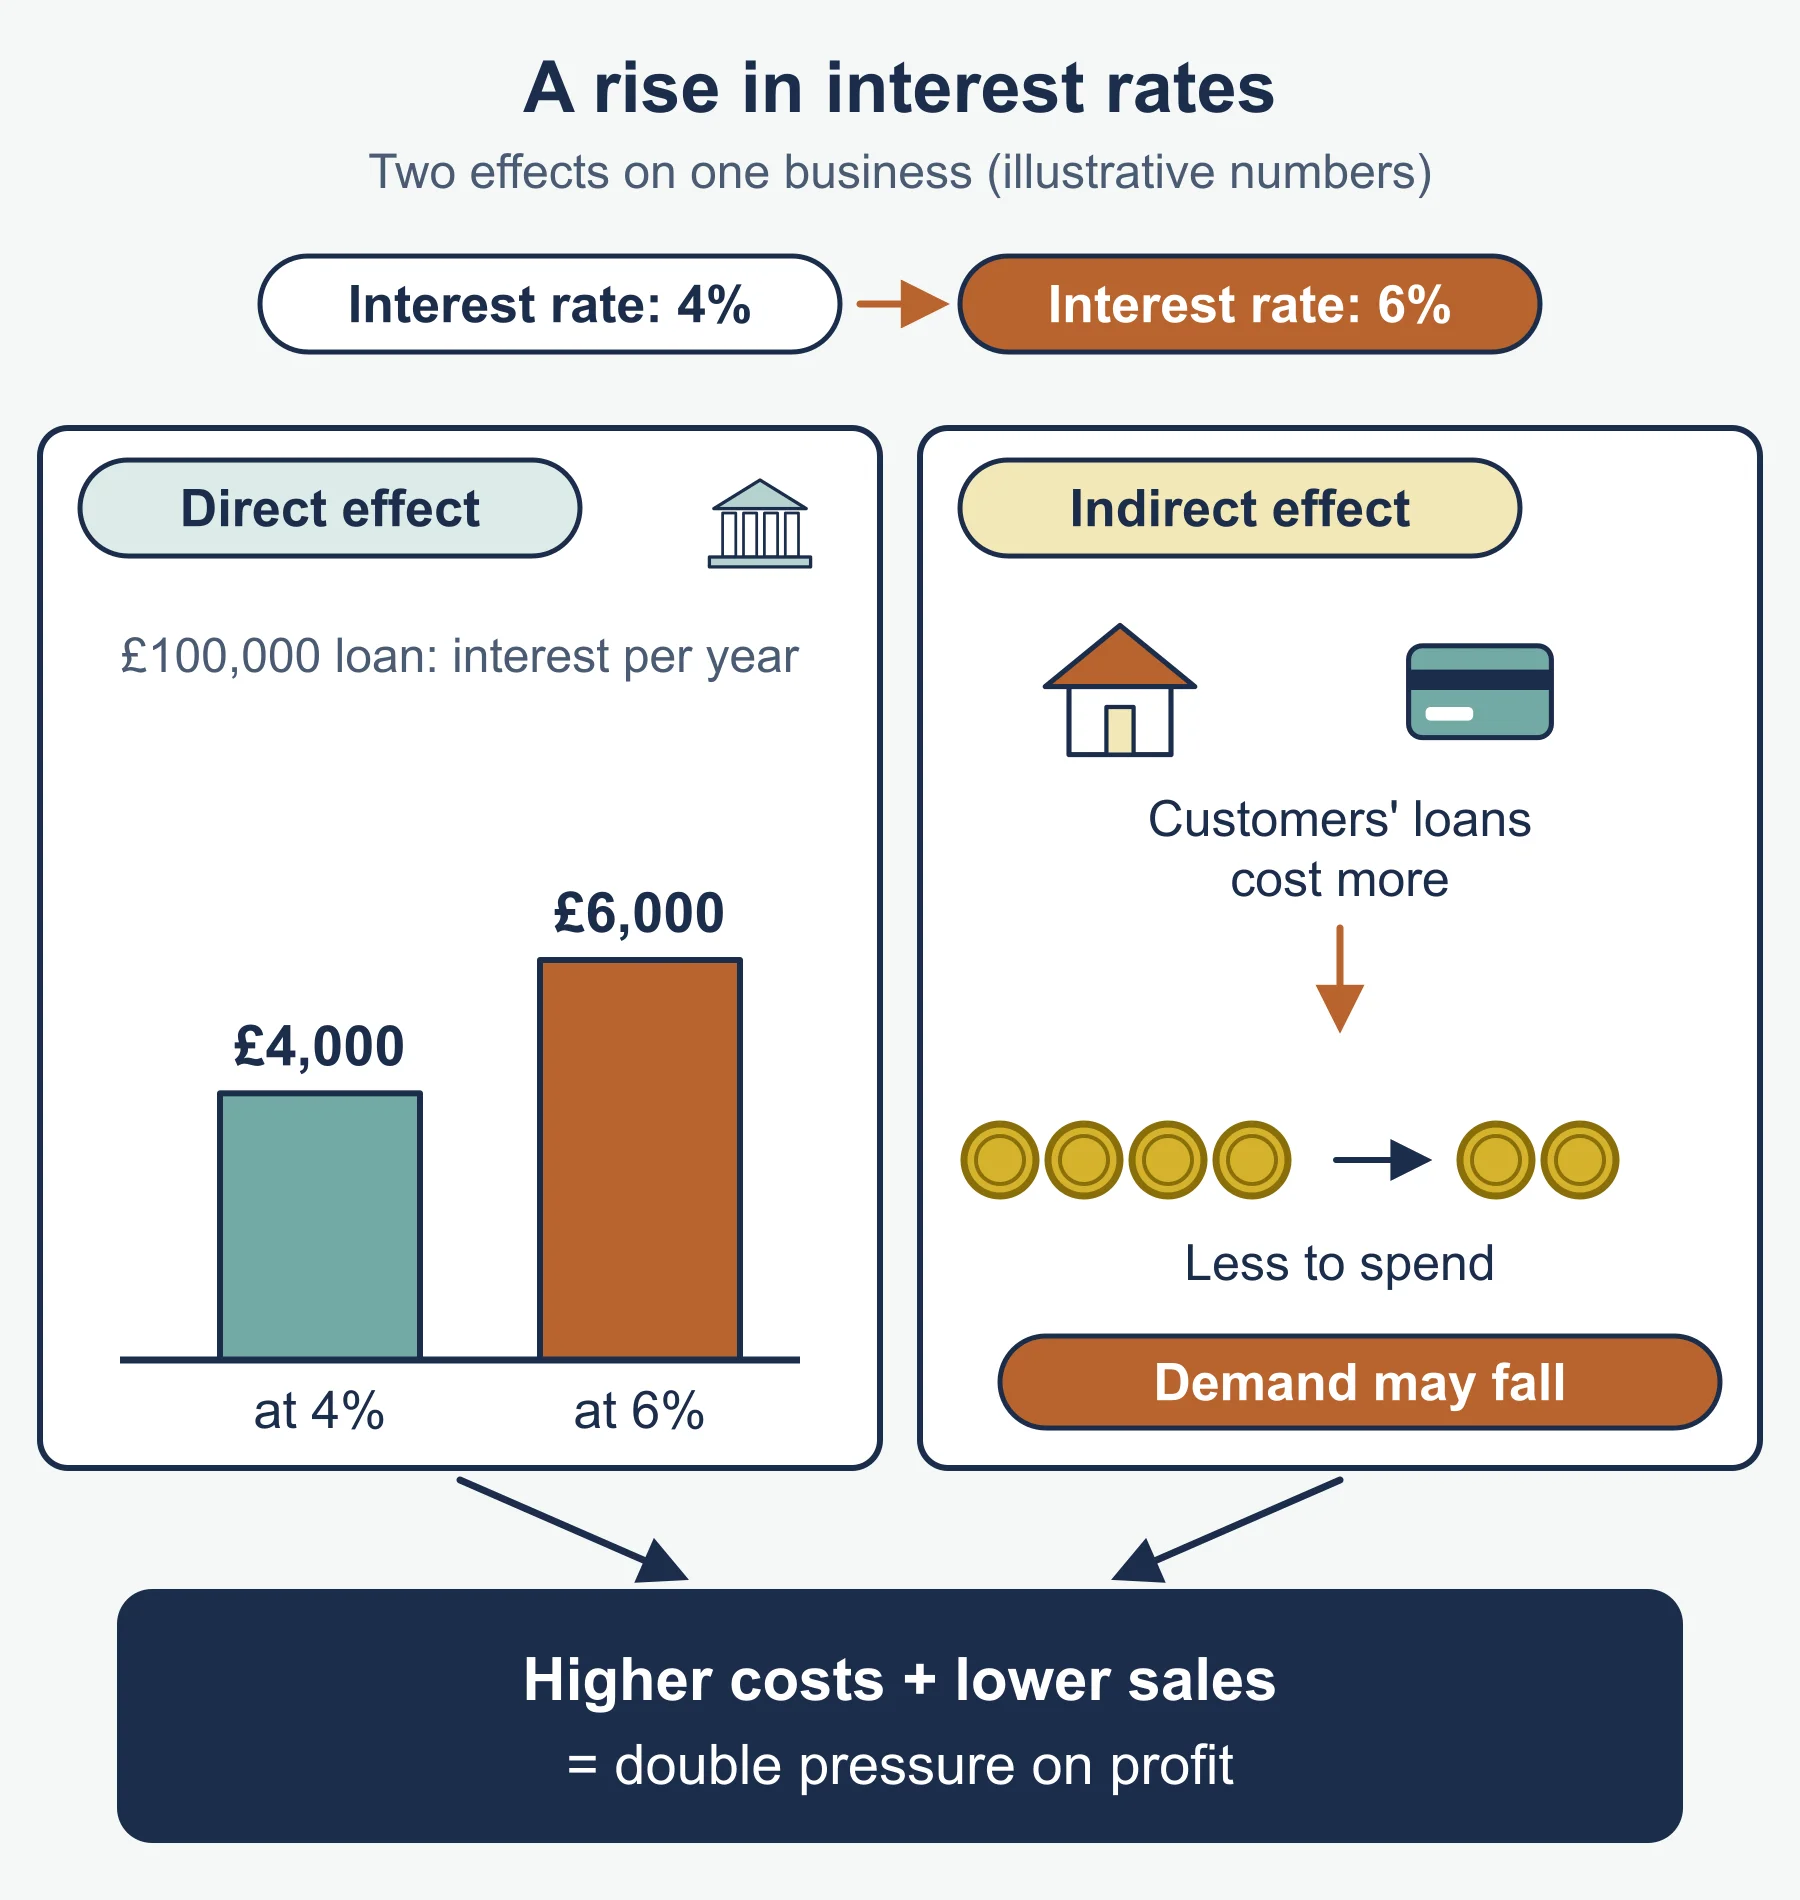
An interest rate is the price of borrowing (and the reward for saving). A rise has these effects.
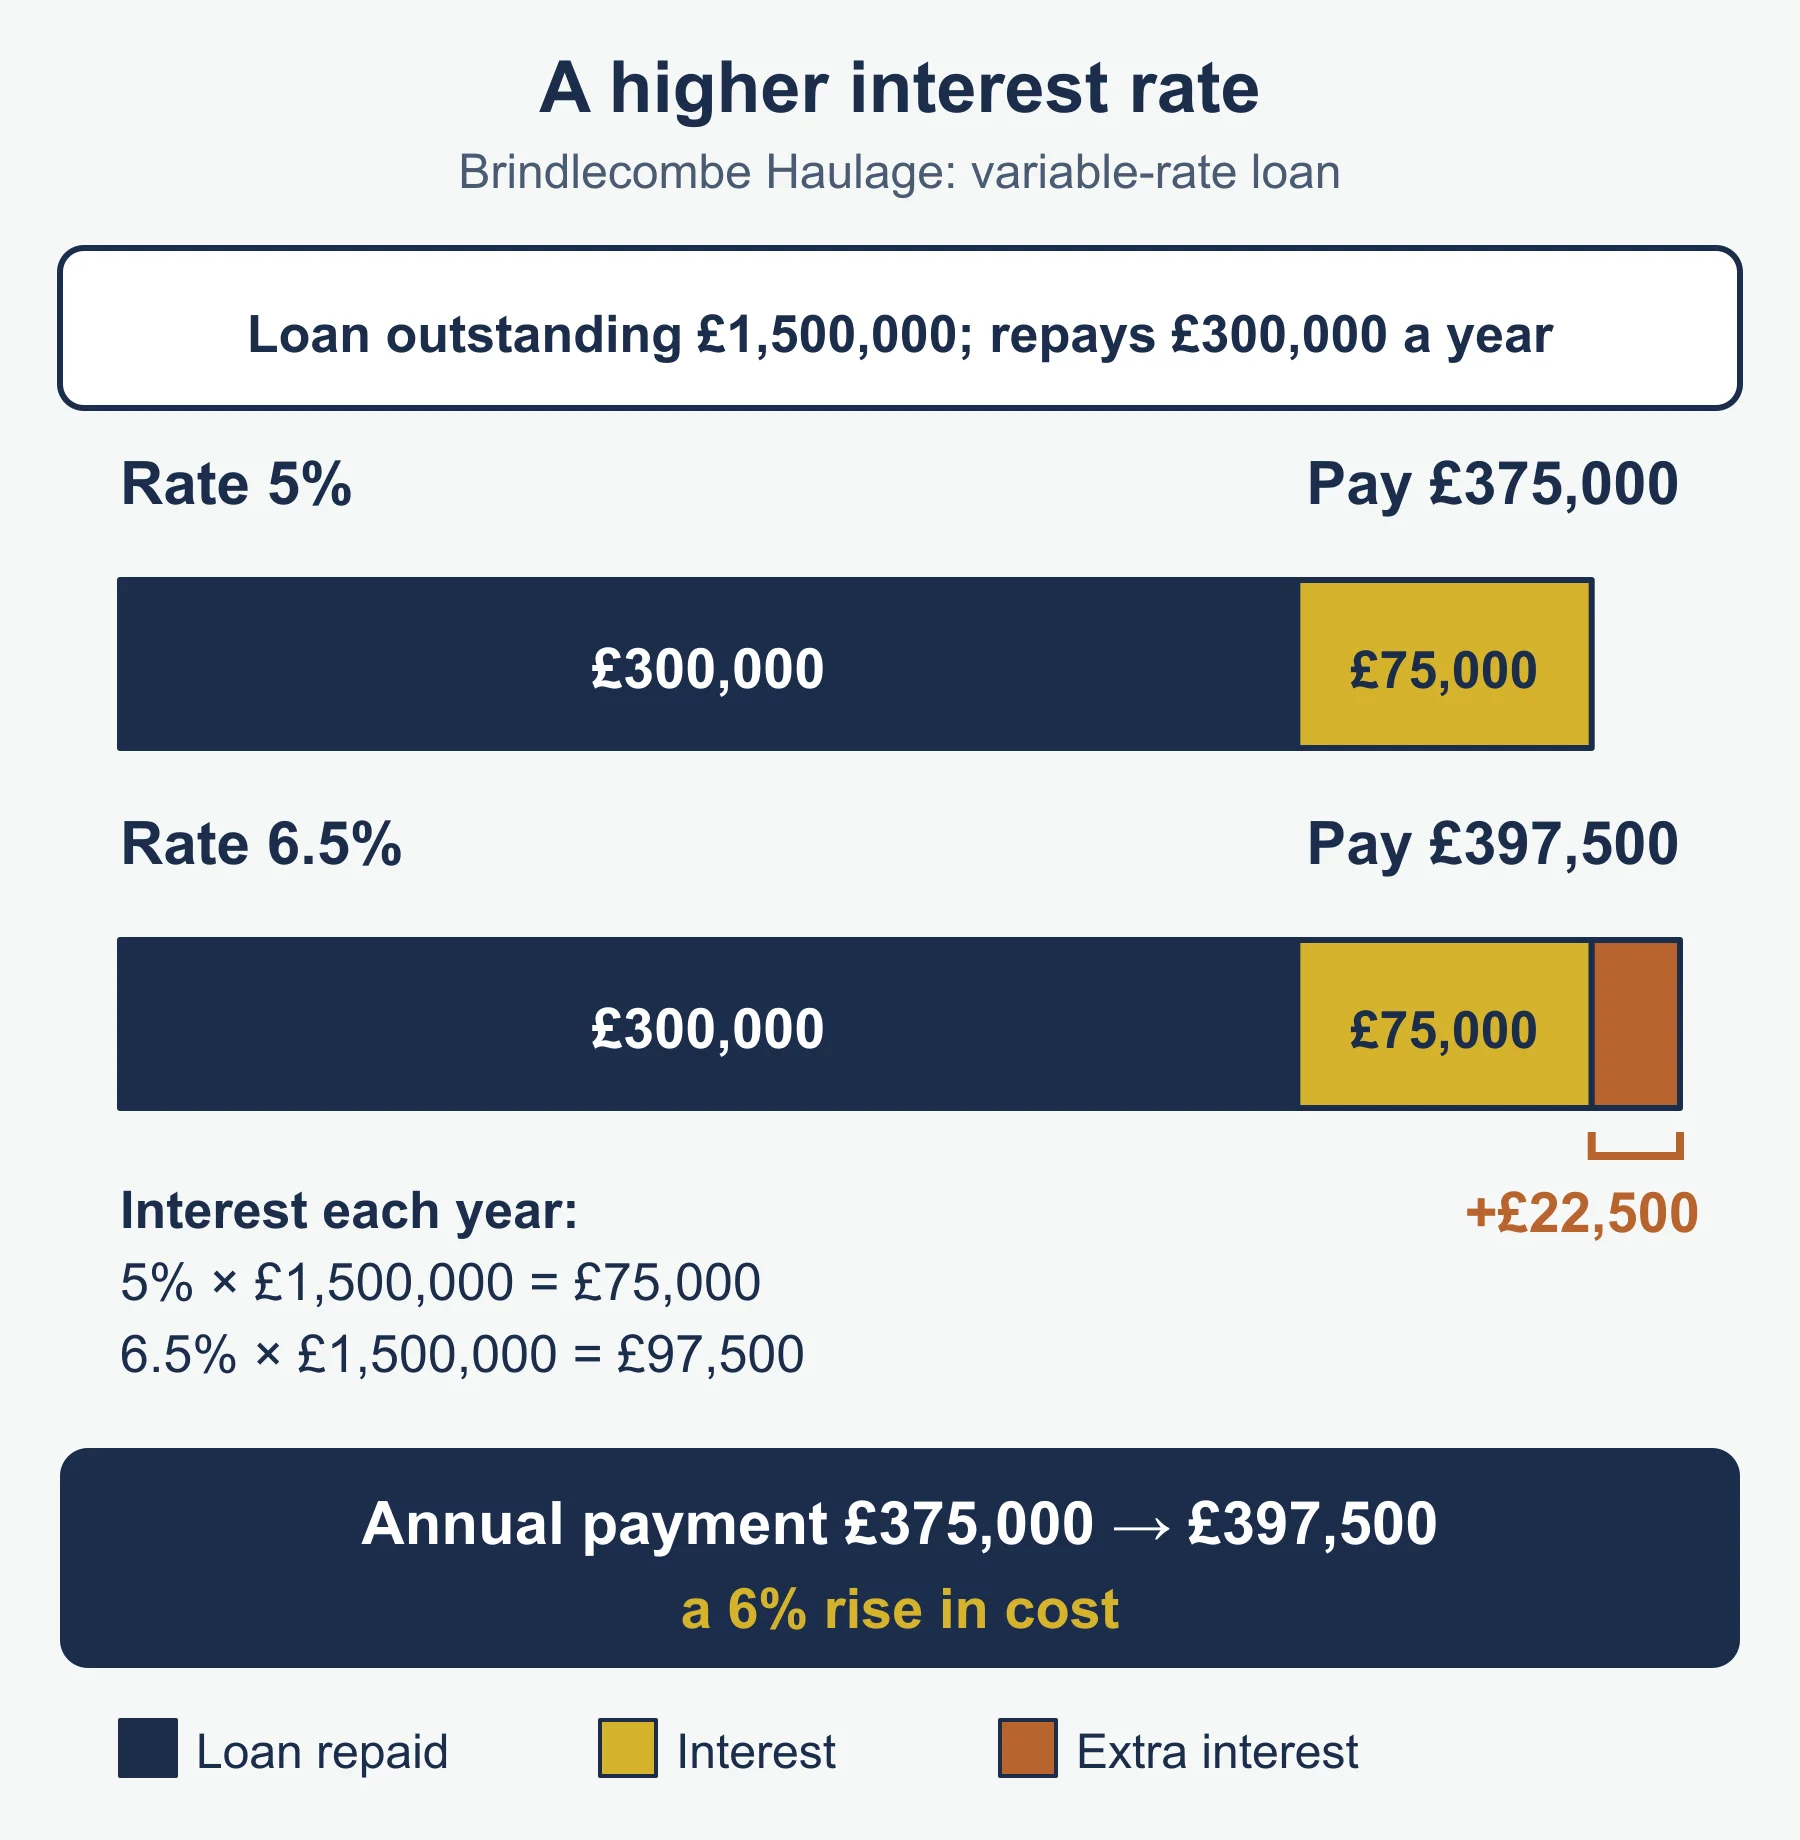
- Costs: firms with variable rate loans pay more. Borrowing 300,000 cu at 5% costs 15,000 cu a year; at 6.5% it costs 19,500 cu, an extra 4,500 cu.
- Demand: consumers pay more on loans and mortgages, so they have less to spend. Demand for goods bought on credit, such as cars and furniture, tends to fall.
- Decisions: investment projects that looked profitable at 5% may not be at 6.5%, so managers may delay expansion.
A fall works in the opposite direction.
5.3 Exchange rates
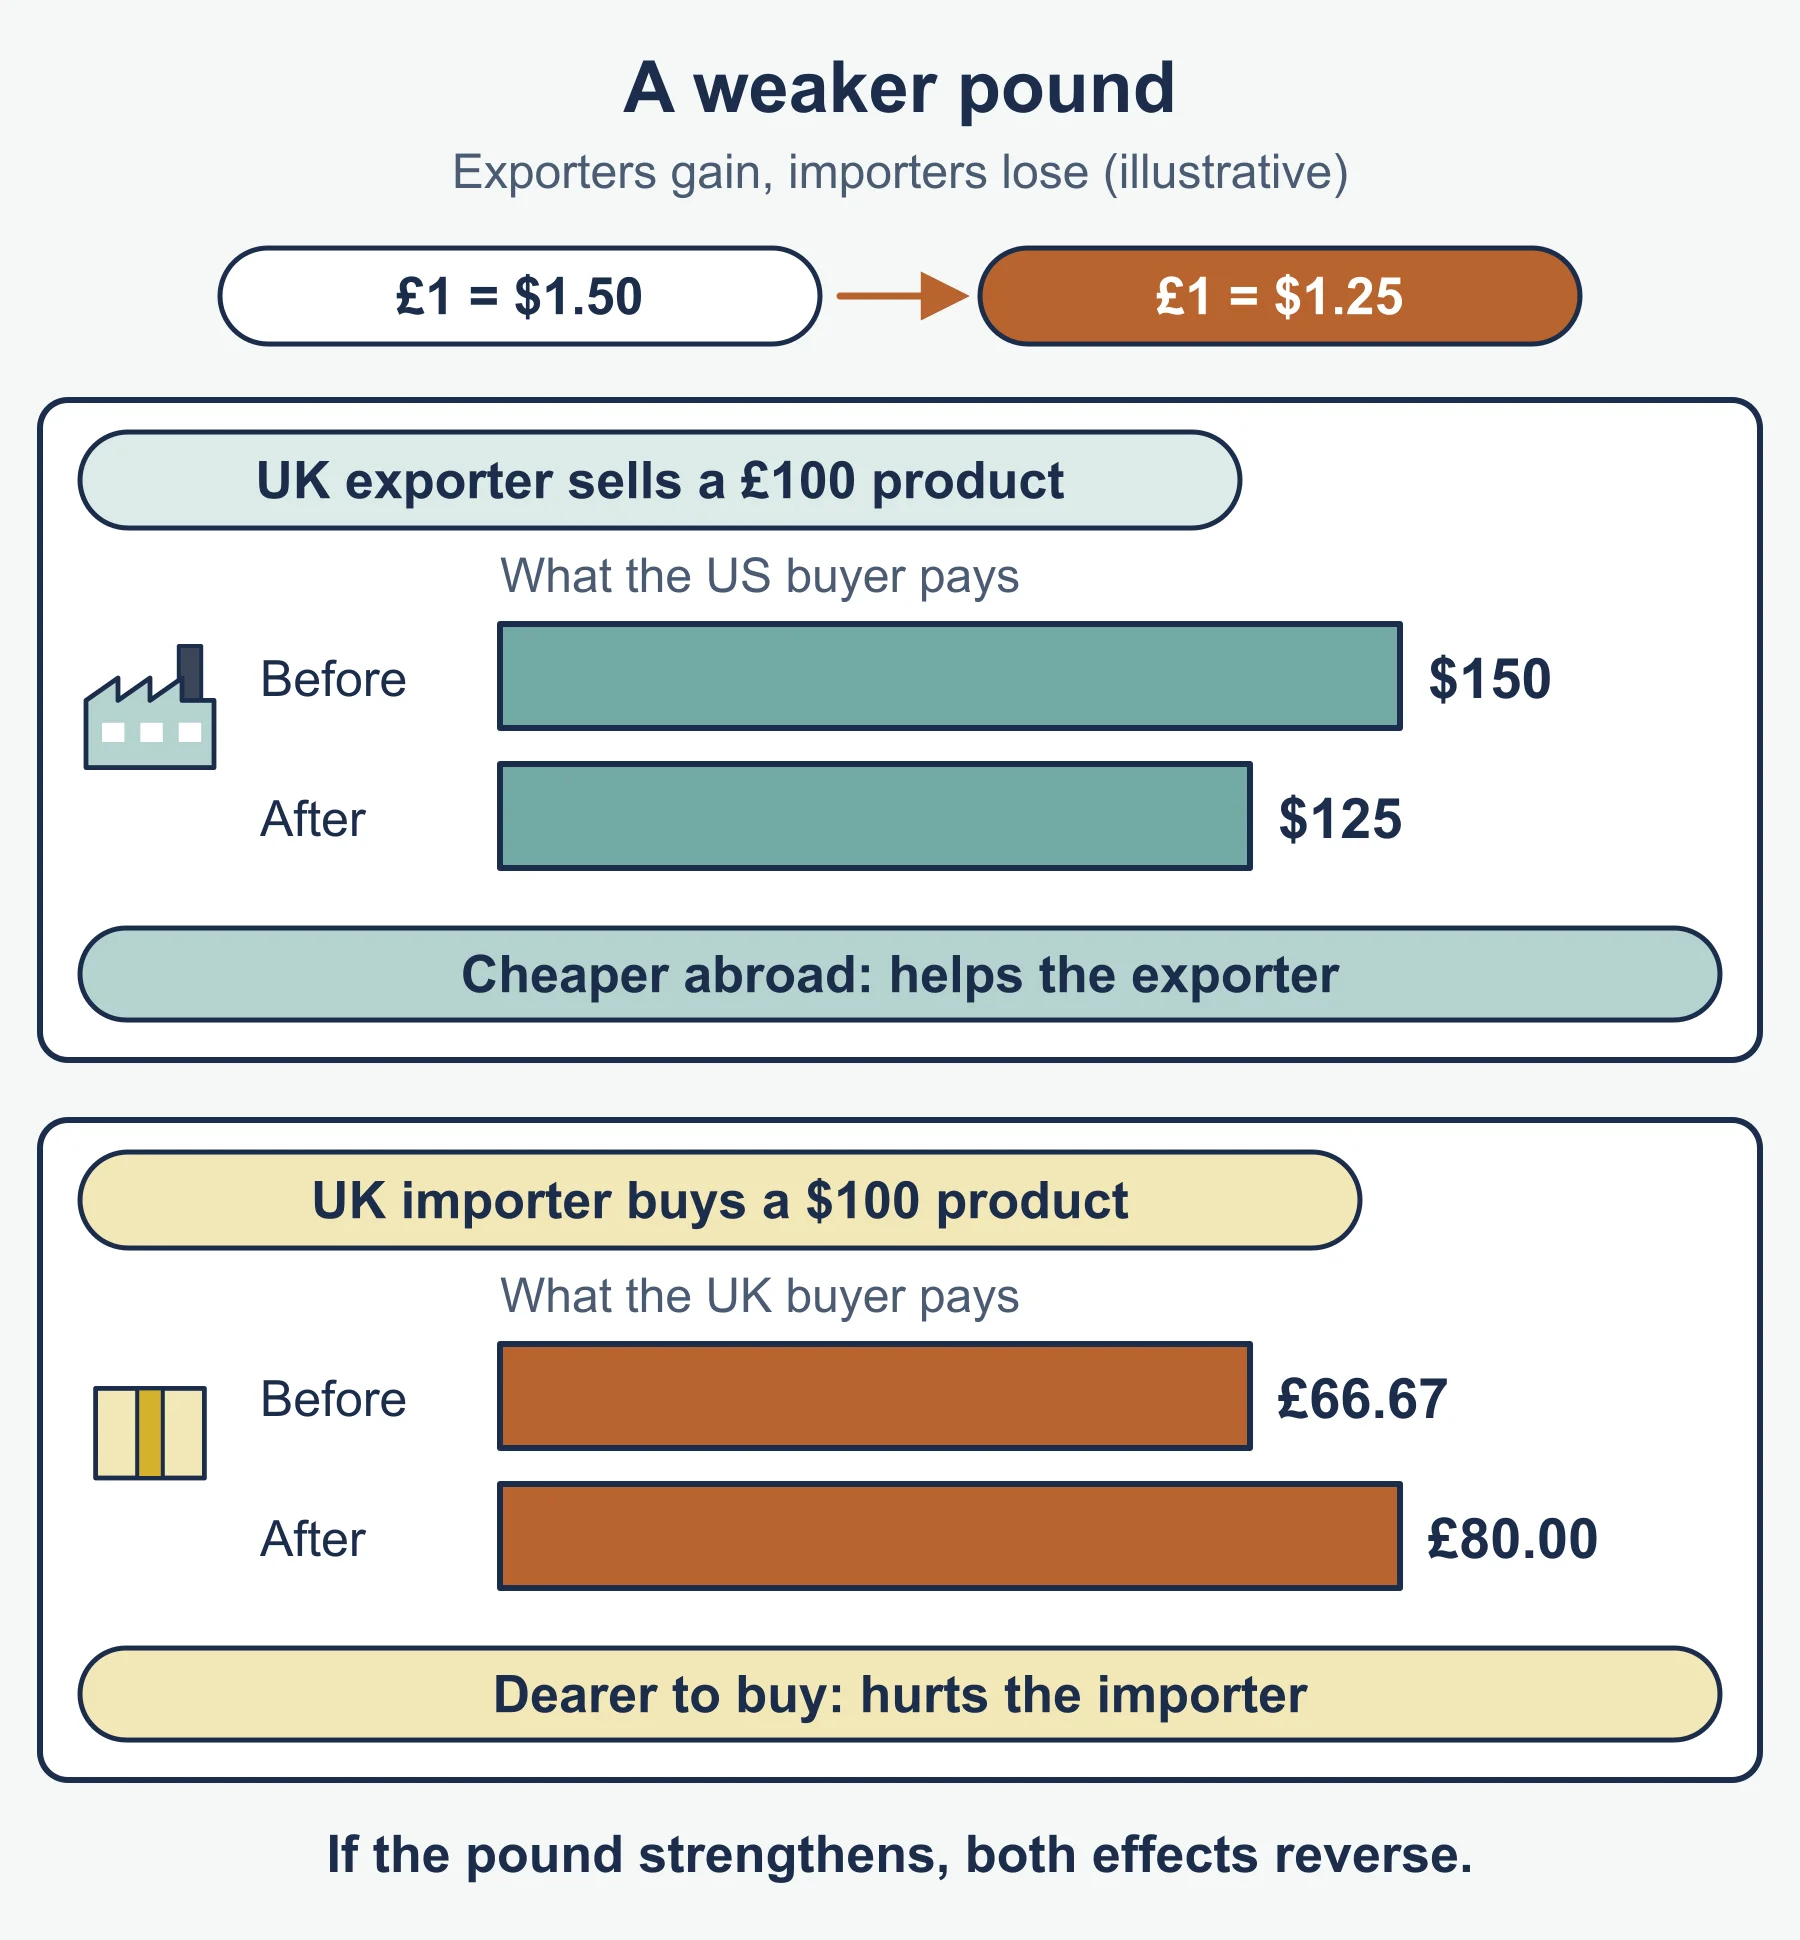
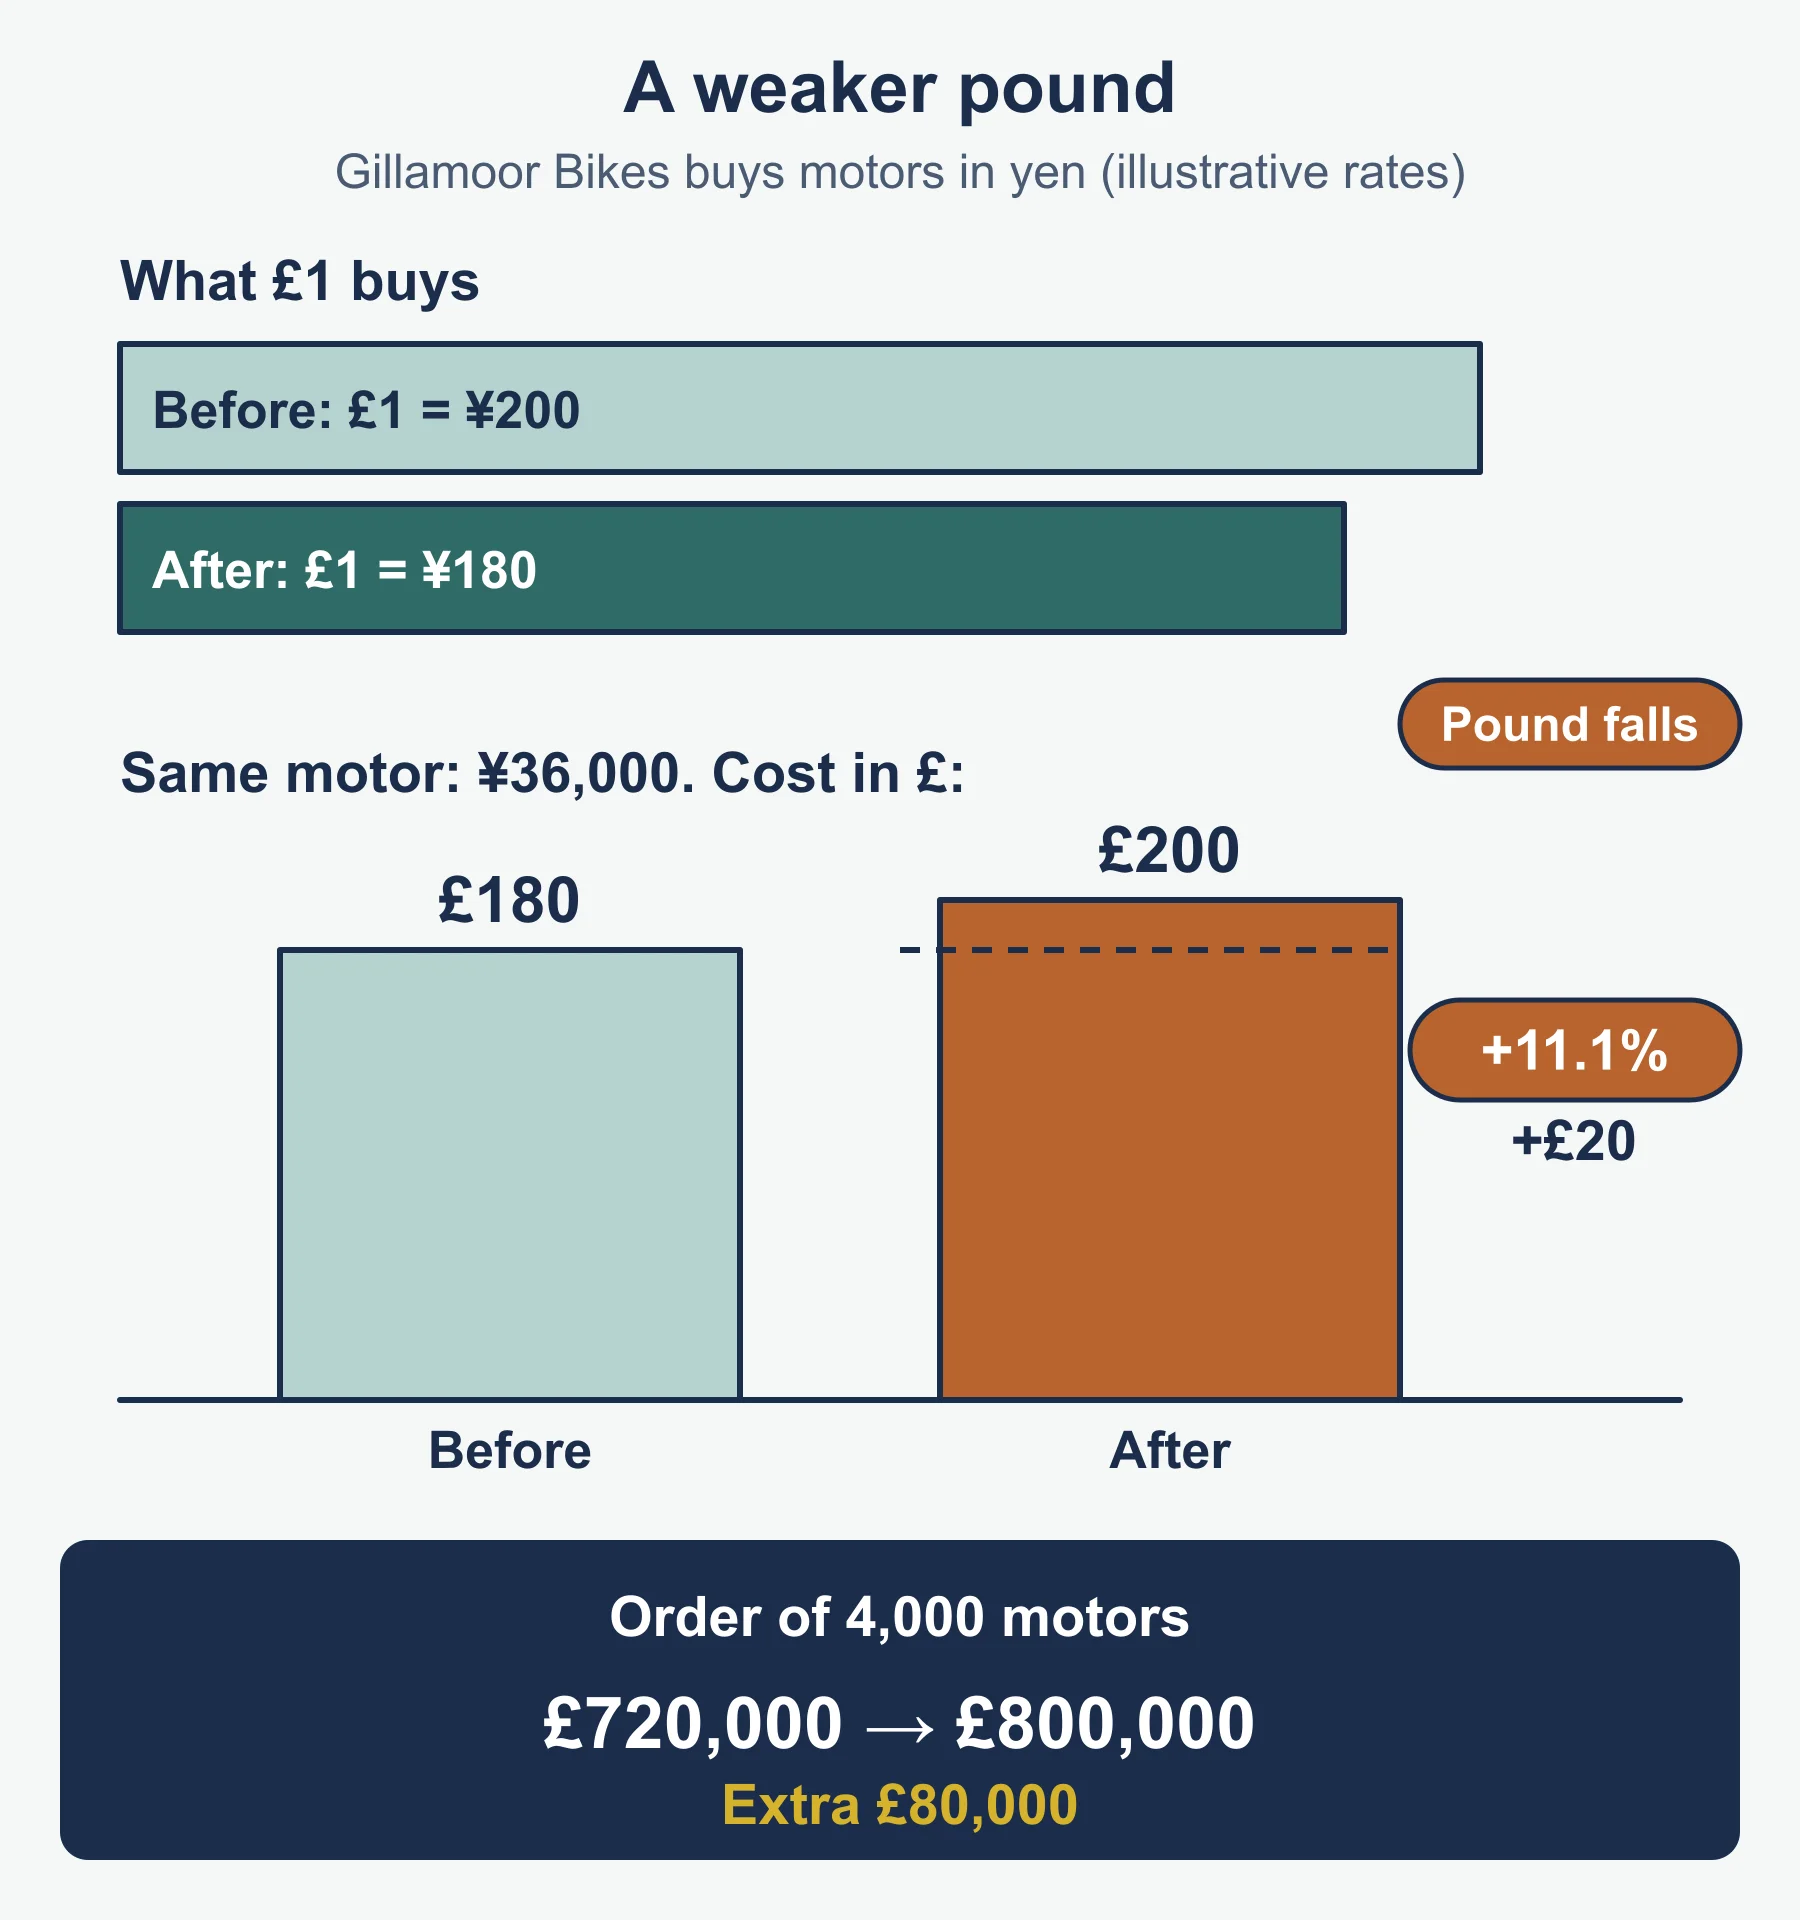
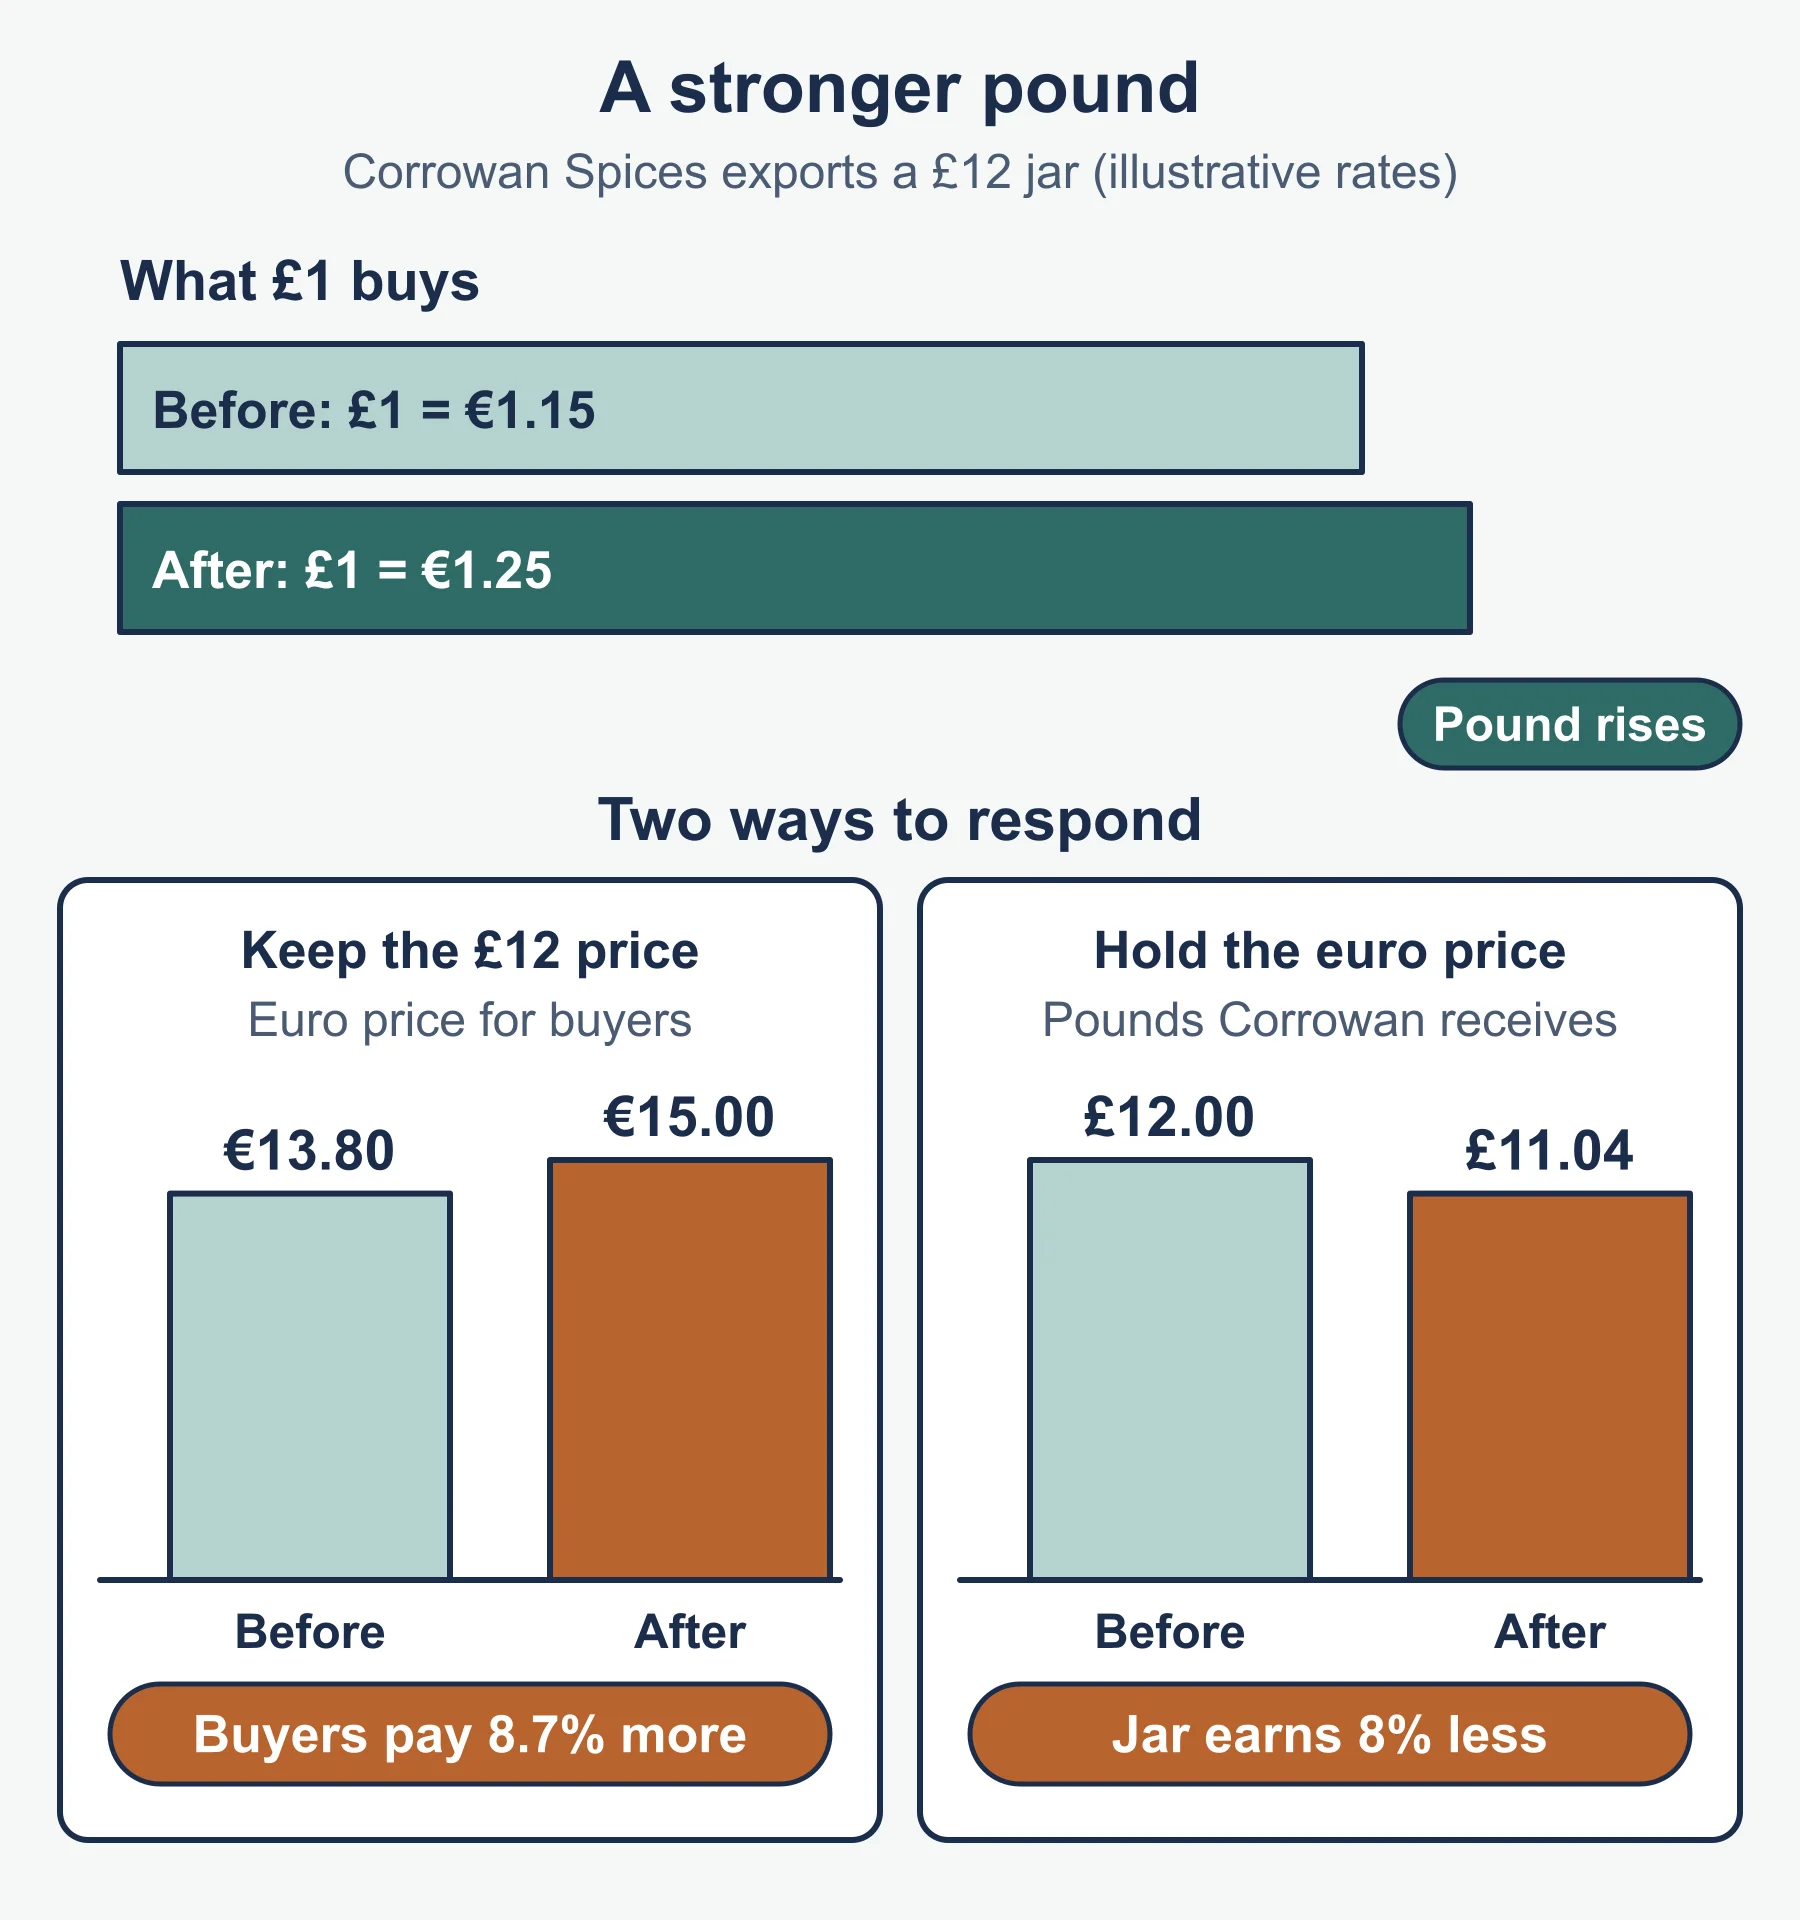
The exchange rate is the price of one currency in terms of another. When the home currency rises in value (strengthens), imports become cheaper in home currency terms and exports become dearer for overseas buyers. A weaker home currency does the reverse.
Worked example 4: imported clay and exported tiles
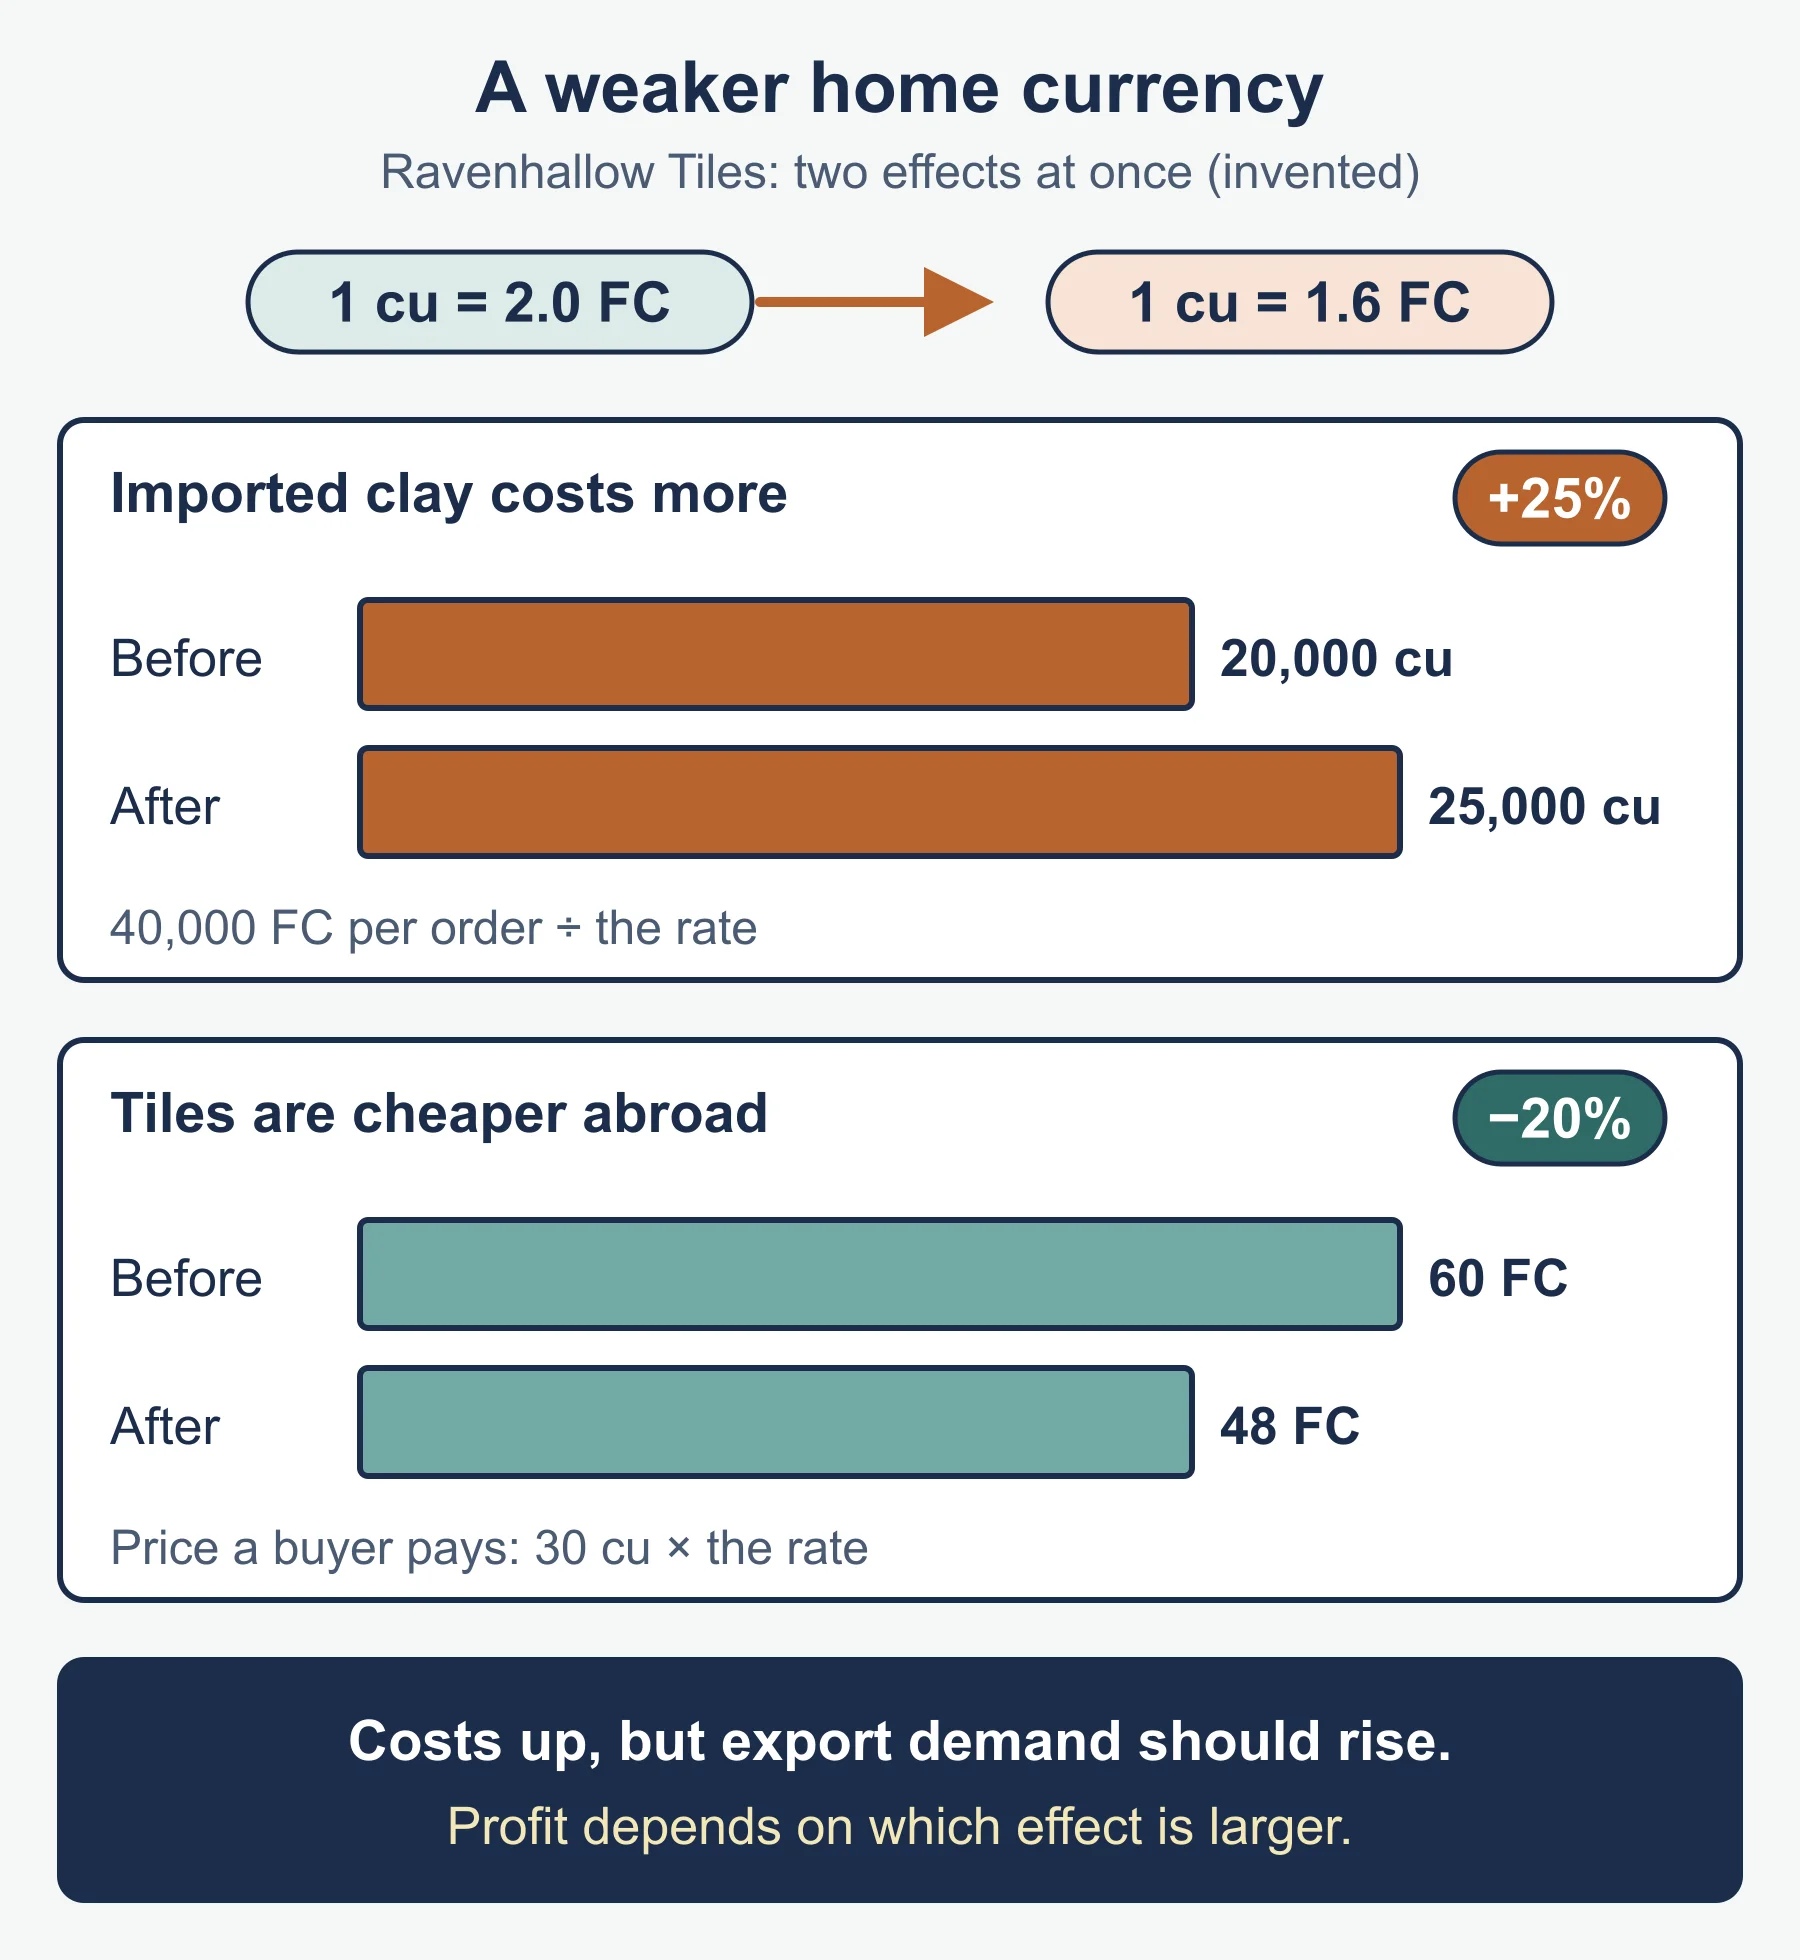
Ravenhallow Tiles buys clay for 40,000 foreign currency units (FC) per order and exports tiles priced at 30 cu each.
Rate 1: 1 cu = 2.0 FC. The clay costs 40,000 / 2.0 = 20,000 cu. A tile costs an overseas buyer 30 × 2.0 = 60 FC. Rate 2 (home currency weakens): 1 cu = 1.6 FC. The clay costs 40,000 / 1.6 = 25,000 cu, a rise of 25%. A tile now costs 30 × 1.6 = 48 FC abroad.
So the weaker currency raises Ravenhallow’s input costs by 25% but makes its tiles 20% cheaper for overseas customers, which should lift export demand. Net profit depends on which effect is larger.
5.4 Costs of inputs
Inputs include raw materials, components, energy and labour. A rise lifts unit costs and cuts margins unless the business passes it on or saves elsewhere.
Worked example 5: jackets
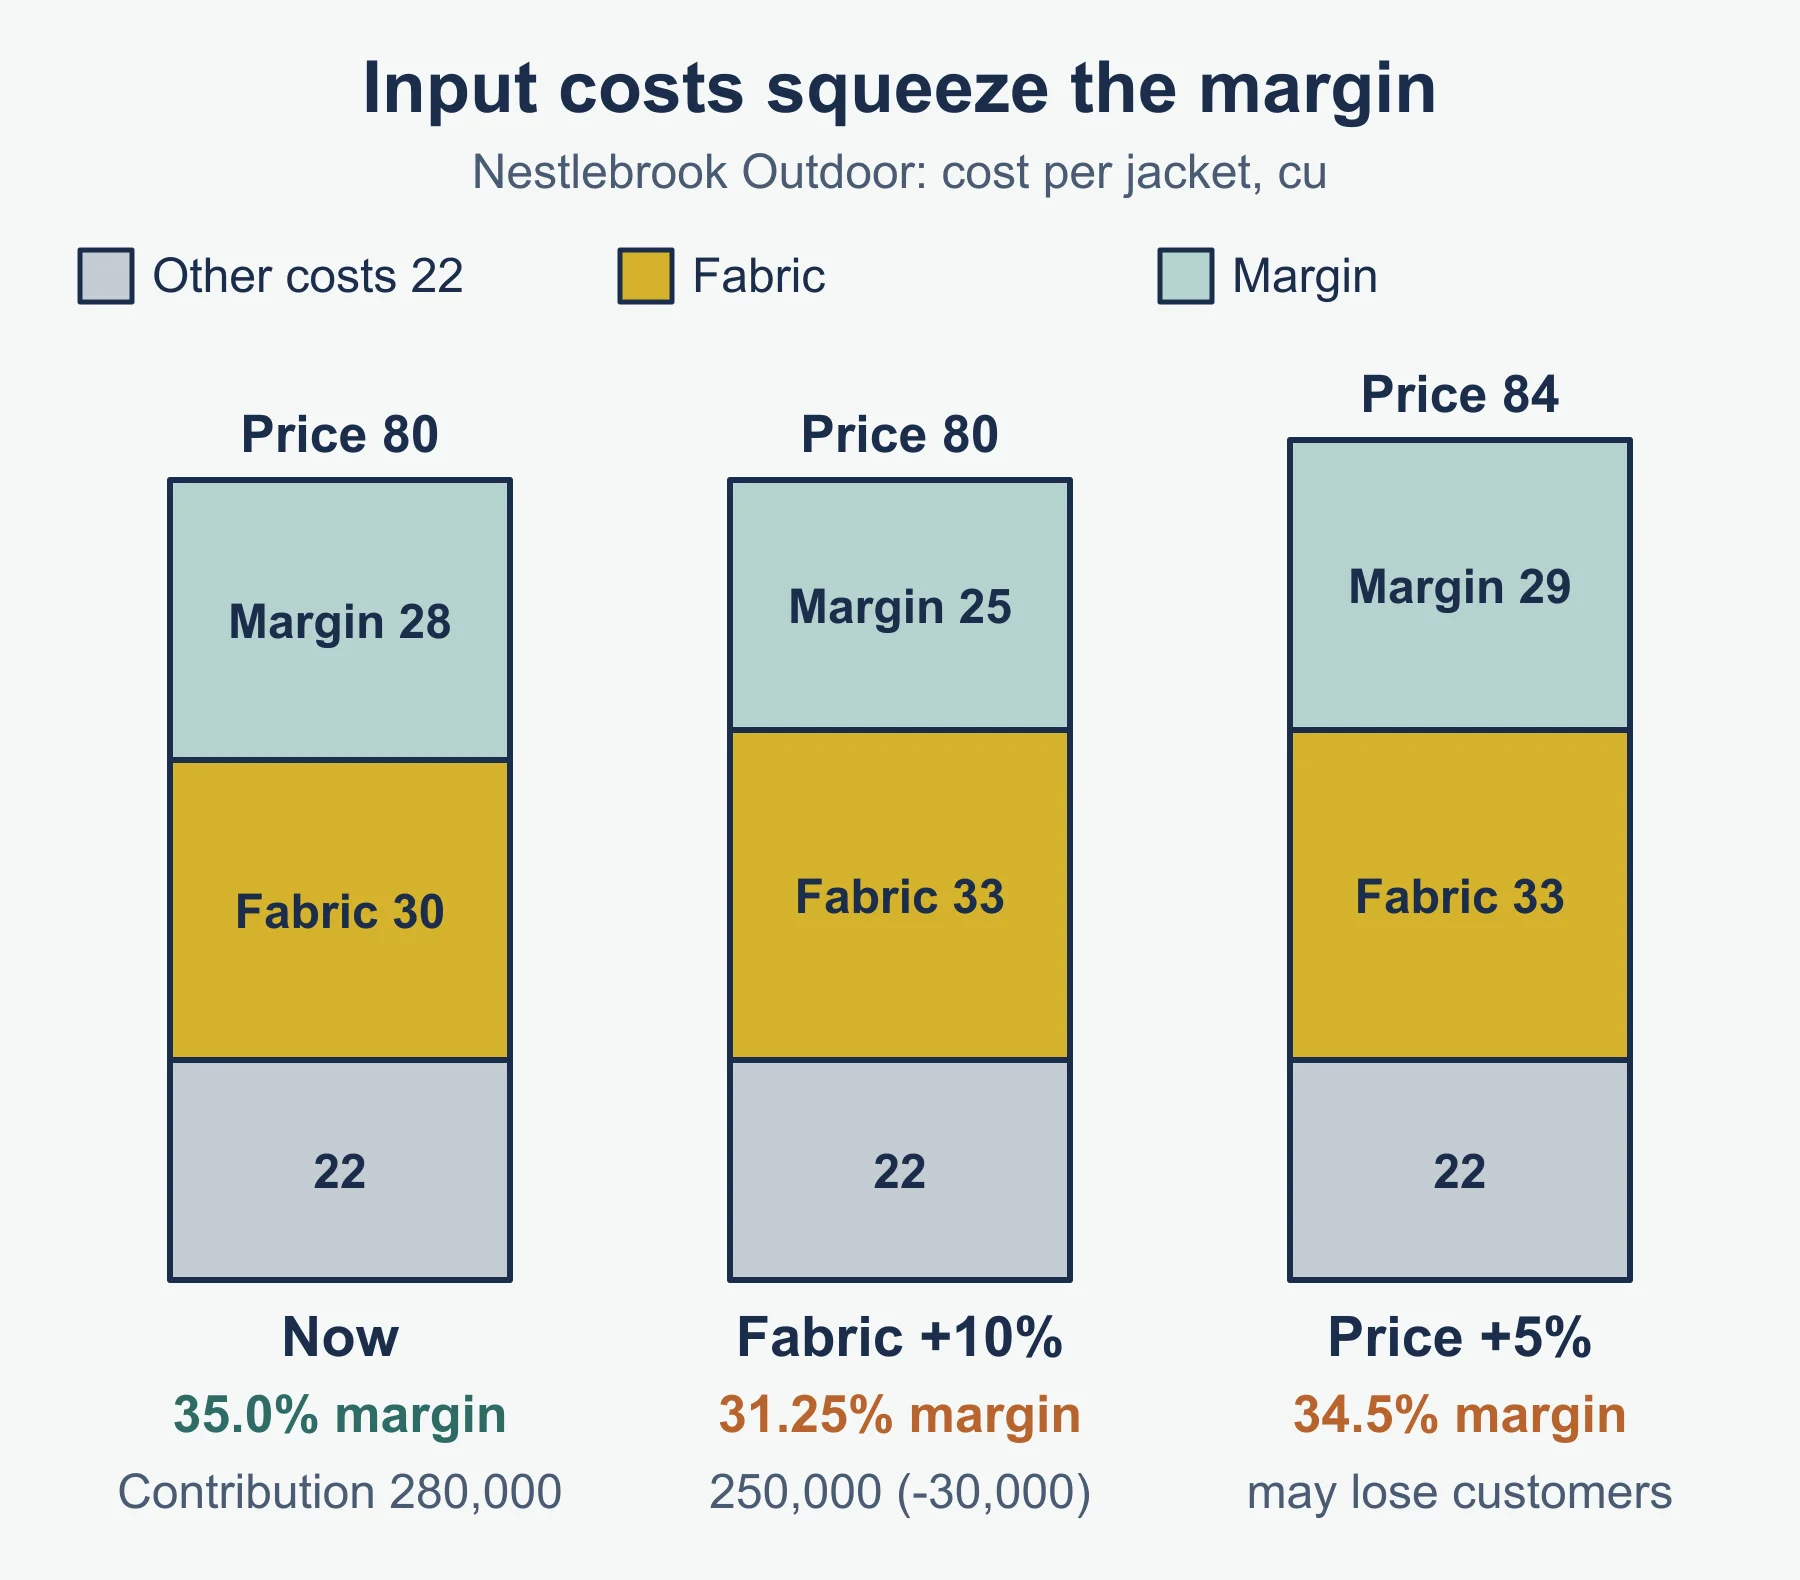
Nestlebrook Outdoor sells jackets at 80 cu with a unit cost of 52 cu, of which 30 cu is fabric. It sells 10,000 jackets a year.
Step 1, margin now: 80 - 52 = 28 cu per jacket, which is 28/80 = 35.0% of price; profit contribution 280,000 cu. Step 2, fabric up 10%: 30 × 1.10 = 33 cu, so unit cost is 55 cu. Step 3, new margin: 80 - 55 = 25 cu, or 31.25%; contribution 250,000 cu, a fall of 30,000 cu.
Options: absorb the fall; raise price 5% to 84 cu (margin 29 cu, 34.5%) and risk losing customers; or change supplier.
5.5 Competition
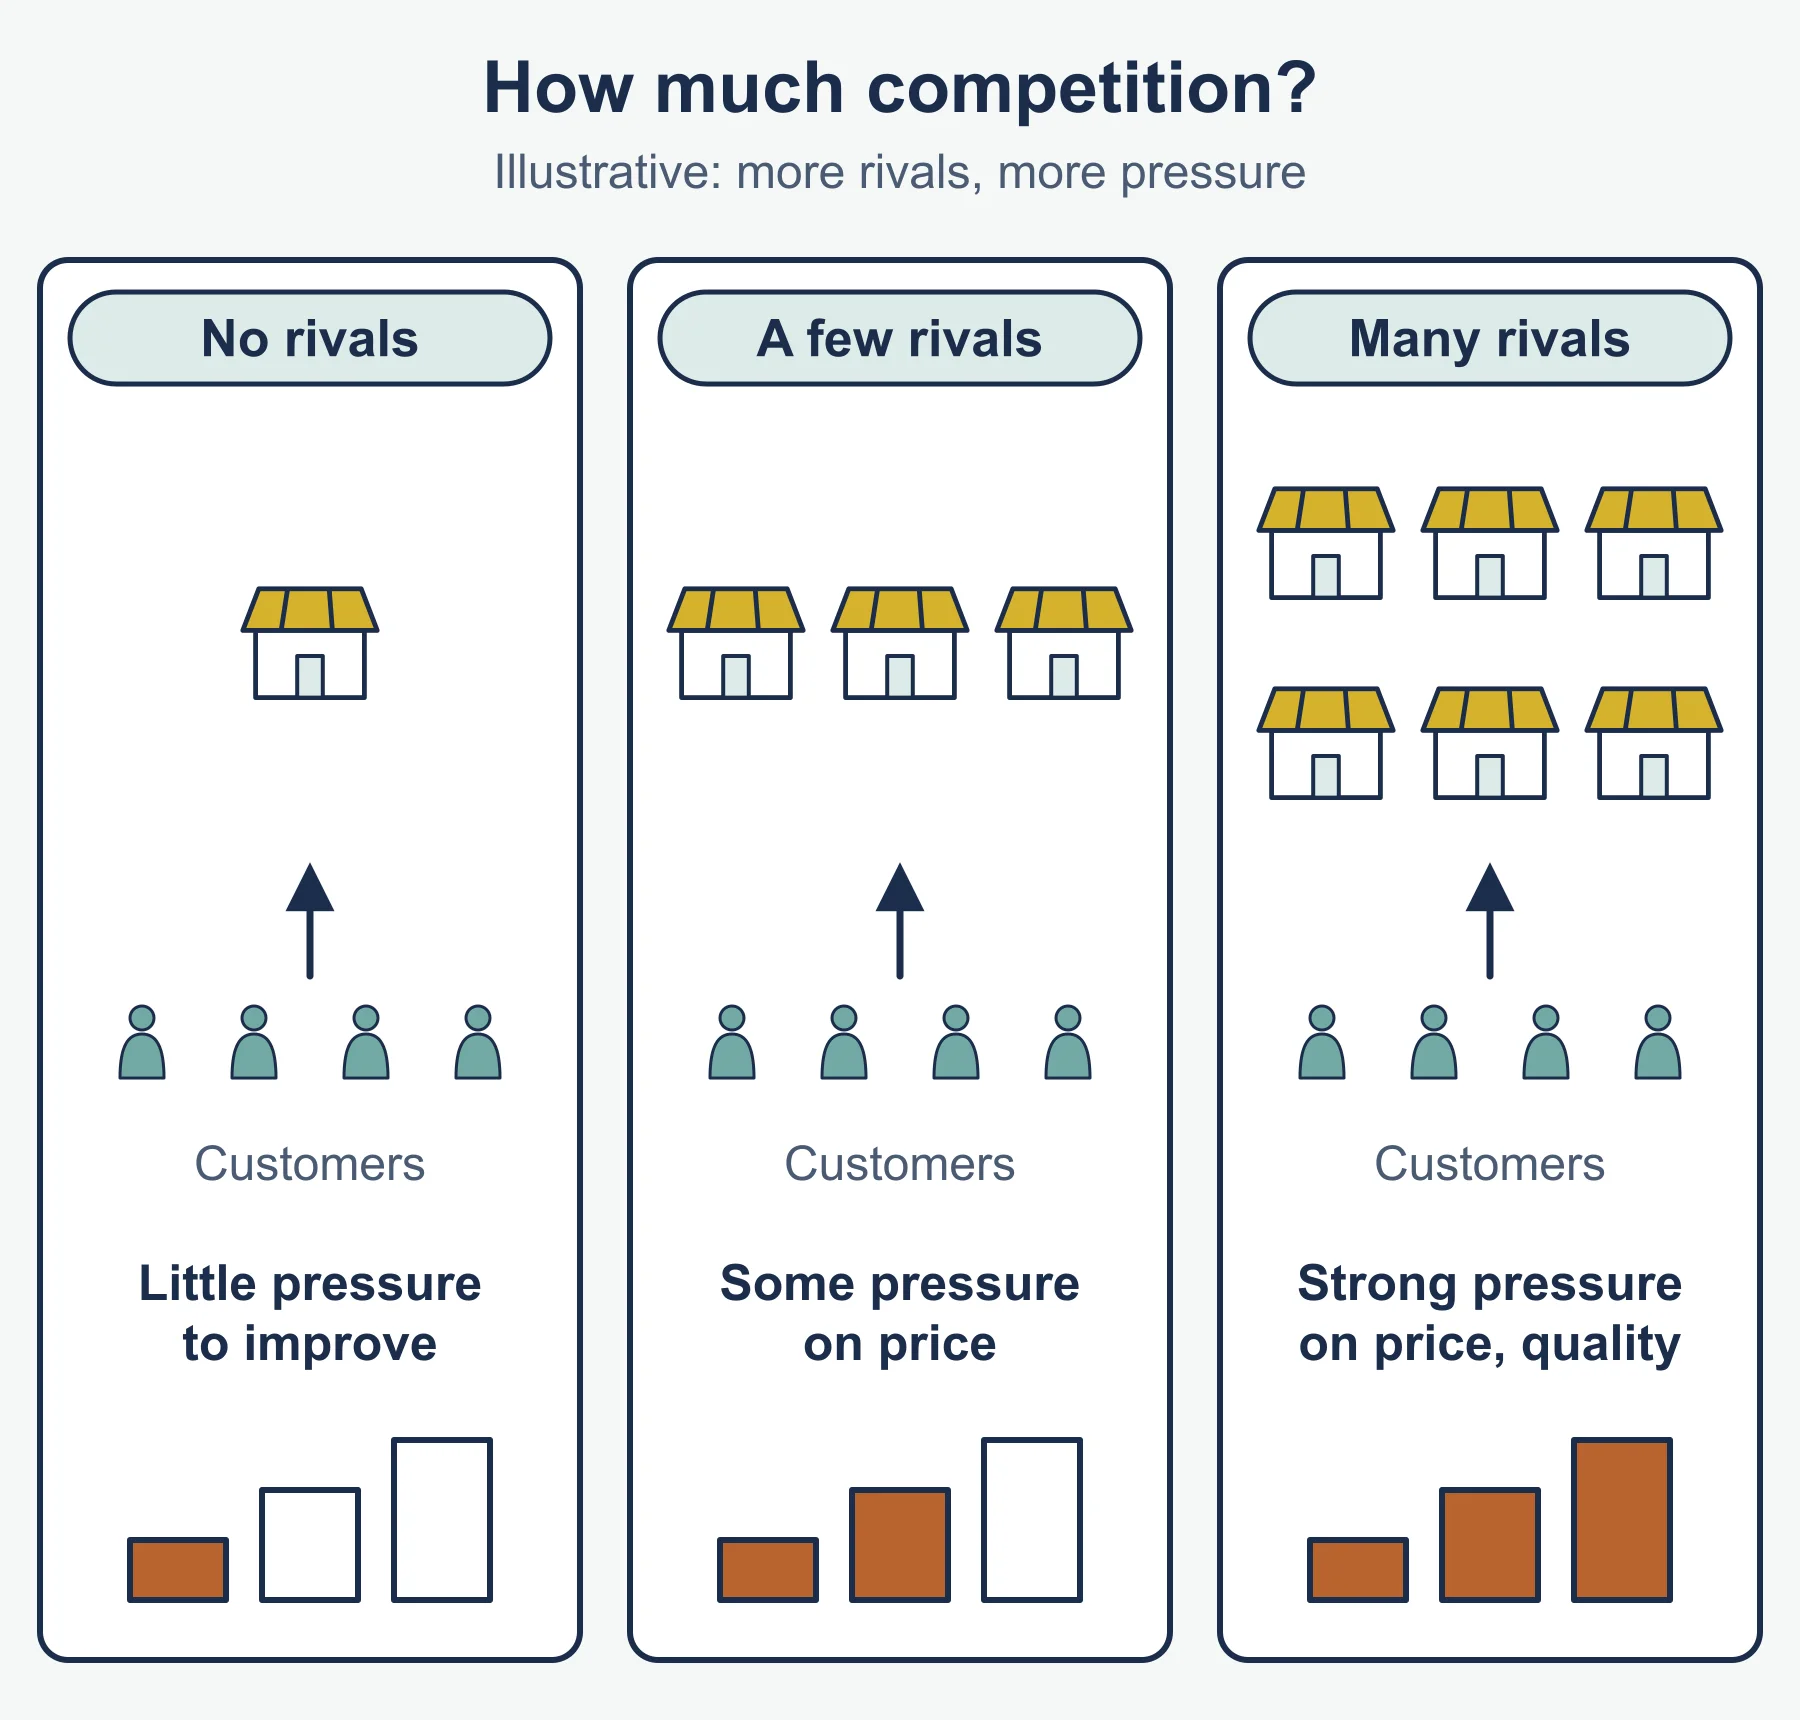
A new entrant takes share and can force a price response, cutting profit per sale. A rival leaving does the opposite. How easily rivals can enter depends on the barriers in section 3. Competition from abroad works the same way: overseas rivals selling in the home market add to the number of businesses, take share and press on price, and a weaker home currency can make their goods dearer and ease the pressure.
5.6 Government policies and the degree of competition
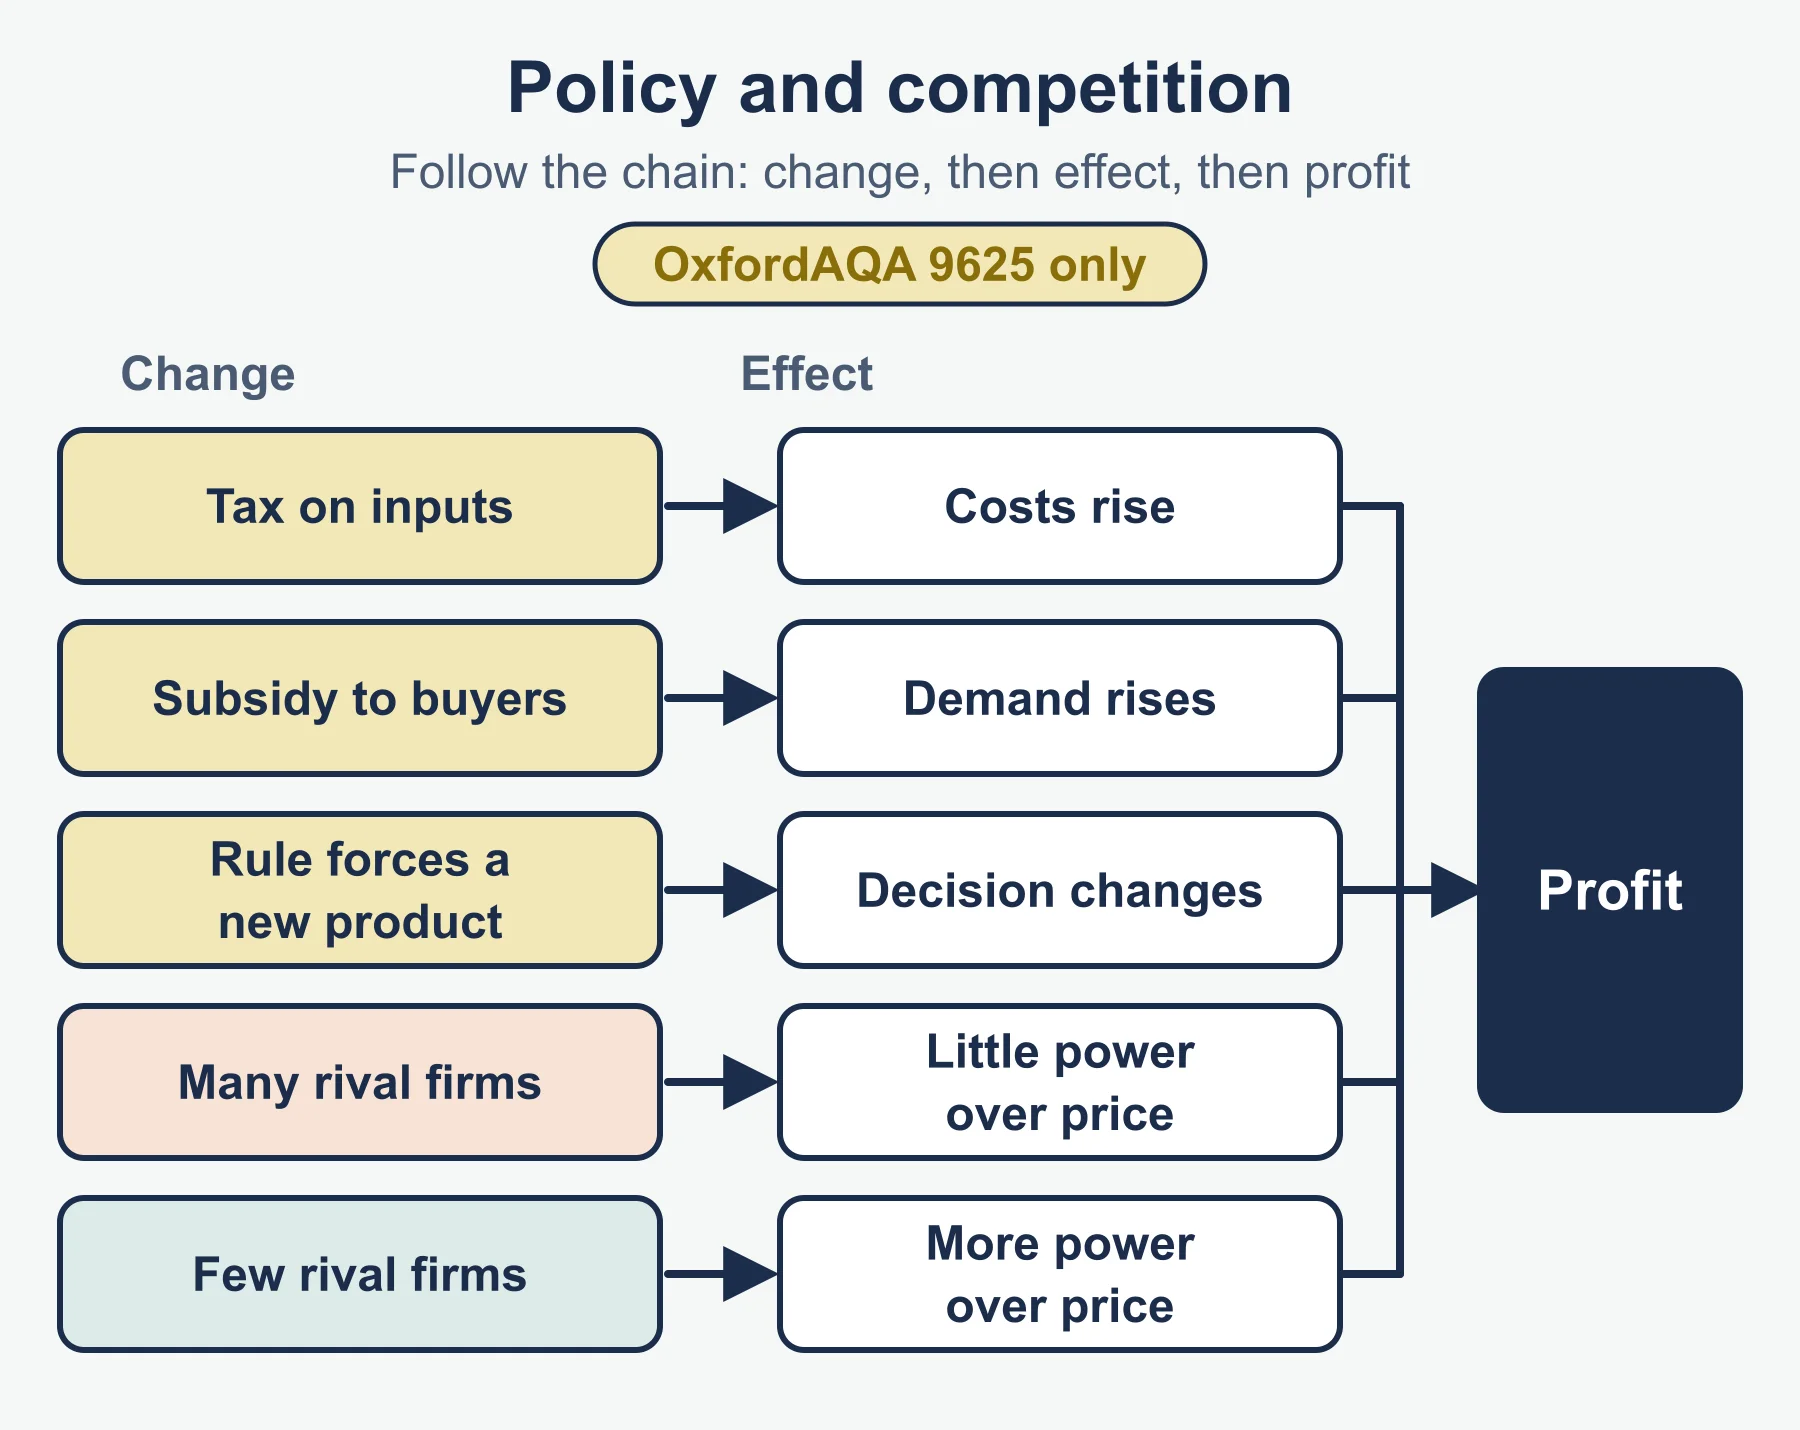
The 9625 text also lists government policies and the degree of competition (the number of businesses). Policies such as taxes, subsidies, regulation or trade rules change costs (a tax on inputs), demand (a subsidy to buyers) and decisions (a rule that forces a change of product). Many businesses in a market means strong competition and little power over price; few mean the opposite. Use the same chain: change, cost or demand, decision, profit.
Common errors
- Mixing volume and value, or dividing a percentage change by the new figure.
- Treating the concentration ratio as a sum of sales rather than shares.
- Calling an inferior good low quality, or stopping at “costs go up” with no link to profit.
Frequently asked questions
What is the difference between a normal good and an inferior good? Demand for a normal good rises when incomes rise and falls when incomes fall, so its YED is positive. Demand for an inferior good falls when incomes rise, so its YED is negative.
What is income elasticity of demand? Income elasticity of demand (YED) measures how responsive quantity demanded is to a change in income. It is the percentage change in quantity demanded divided by the percentage change in income.
How does a rise in interest rates affect a business? Firms with variable-rate loans pay more interest, which raises costs, and consumers paying more on loans and mortgages have less to spend, so demand for goods bought on credit, such as cars and furniture, tends to fall. A fall in interest rates works in the opposite direction.
What is the difference between a saturated and a dynamic market? In a saturated market most potential customers already buy the product, so a firm can grow only by taking share from rivals. A dynamic market changes quickly, with new products, technology or tastes and often fast growth.
What are examples of barriers to entry? Barriers to entry include high entry costs for premises, machinery, stock and launch marketing, legal requirements such as licences or permits, specialist knowledge, customer loyalty to existing businesses, and difficulty accessing resources or distribution.
Official syllabus
OxfordAQA International AS and A-level Business (9725), Version 1.1, section 3.1.1.3, for International AS exams May/June 2027 onwards and International A-level exams May/June 2028 onwards. The 9625 specification (Version 3.1) section 3.1.1.3, checked against its text, lists degree of competition (number of businesses), extent of barriers to entry, market size, growth or decline and concentration ratio, and the effect of incomes, interest rates, exchange rates, costs of inputs, government policies and competition (including from abroad). It does not list income elasticity, normal and inferior goods or the four firm form; those points and market share come from 9725. Published by OxfordAQA.
Get free revision emails (optional)
Occasional emails with practice questions, worked explanations and links to free resources for the qualification and subjects you choose. No spam, and you can unsubscribe from any email. The free tools on this site never need an email.
Related resources
-
Practice questions
OxfordAQA A-Level Business: The external environment (9625/9725) – Practice Questions
Twelve original questions with worked answers on market size, share, concentration ratio, barriers to entry, income elasticity and external changes.
Business · OxfordAQA · AS Level
Try questions -
Revision notes
OxfordAQA A-Level Business: The external environment (9625/9725) – Revision Notes
Condensed recall notes on market size, share, concentration ratio, barriers to entry, income elasticity and external changes for OxfordAQA Business.
Business · OxfordAQA · AS Level
Revise topic -
Study guides
OxfordAQA A-Level Business: The nature and purpose of business and Types of business ownership (9625/9725)
Study guide to OxfordAQA International AS Business 3.1.1.1 and 3.1.1.2: entrepreneurs, objectives, plans, ownership, shareholders and stakeholders.
Business · OxfordAQA · AS Level
Read guide
Related articles
-
teaching
A Level tuition in Dubai: Cambridge or Pearson Edexcel International A Level?
Schools in Dubai and Abu Dhabi teach either Cambridge International AS & A Level or Pearson Edexcel International A Level. How the two are structured, why it matters for tuition, and how online classes from Lahore work.
9 October 2026
-
curriculum guides
Choosing subjects at IGCSE and A Level
How subject choices at 14 and 16 affect university options later, and how to keep pathways open without overloading a timetable.
28 July 2026
Studying this with a teacher
Working through Business AS LEVEL?
This page is free and stays free. If you would rather be taught it, Marlbridge runs Business classes one-to-one and in small groups of up to 15, online in your own time zone. The first trial class is free. WhatsApp replies within an hour (8am–11pm Pakistan time, every day); email the same day.
OxfordAQA Business teachers at Marlbridge
